
A Low-Cost AI Buoy System for Monitoring Water Quality at Offshore Aquaculture Cages

 , ,
, , 
Abstract
:1. Introduction
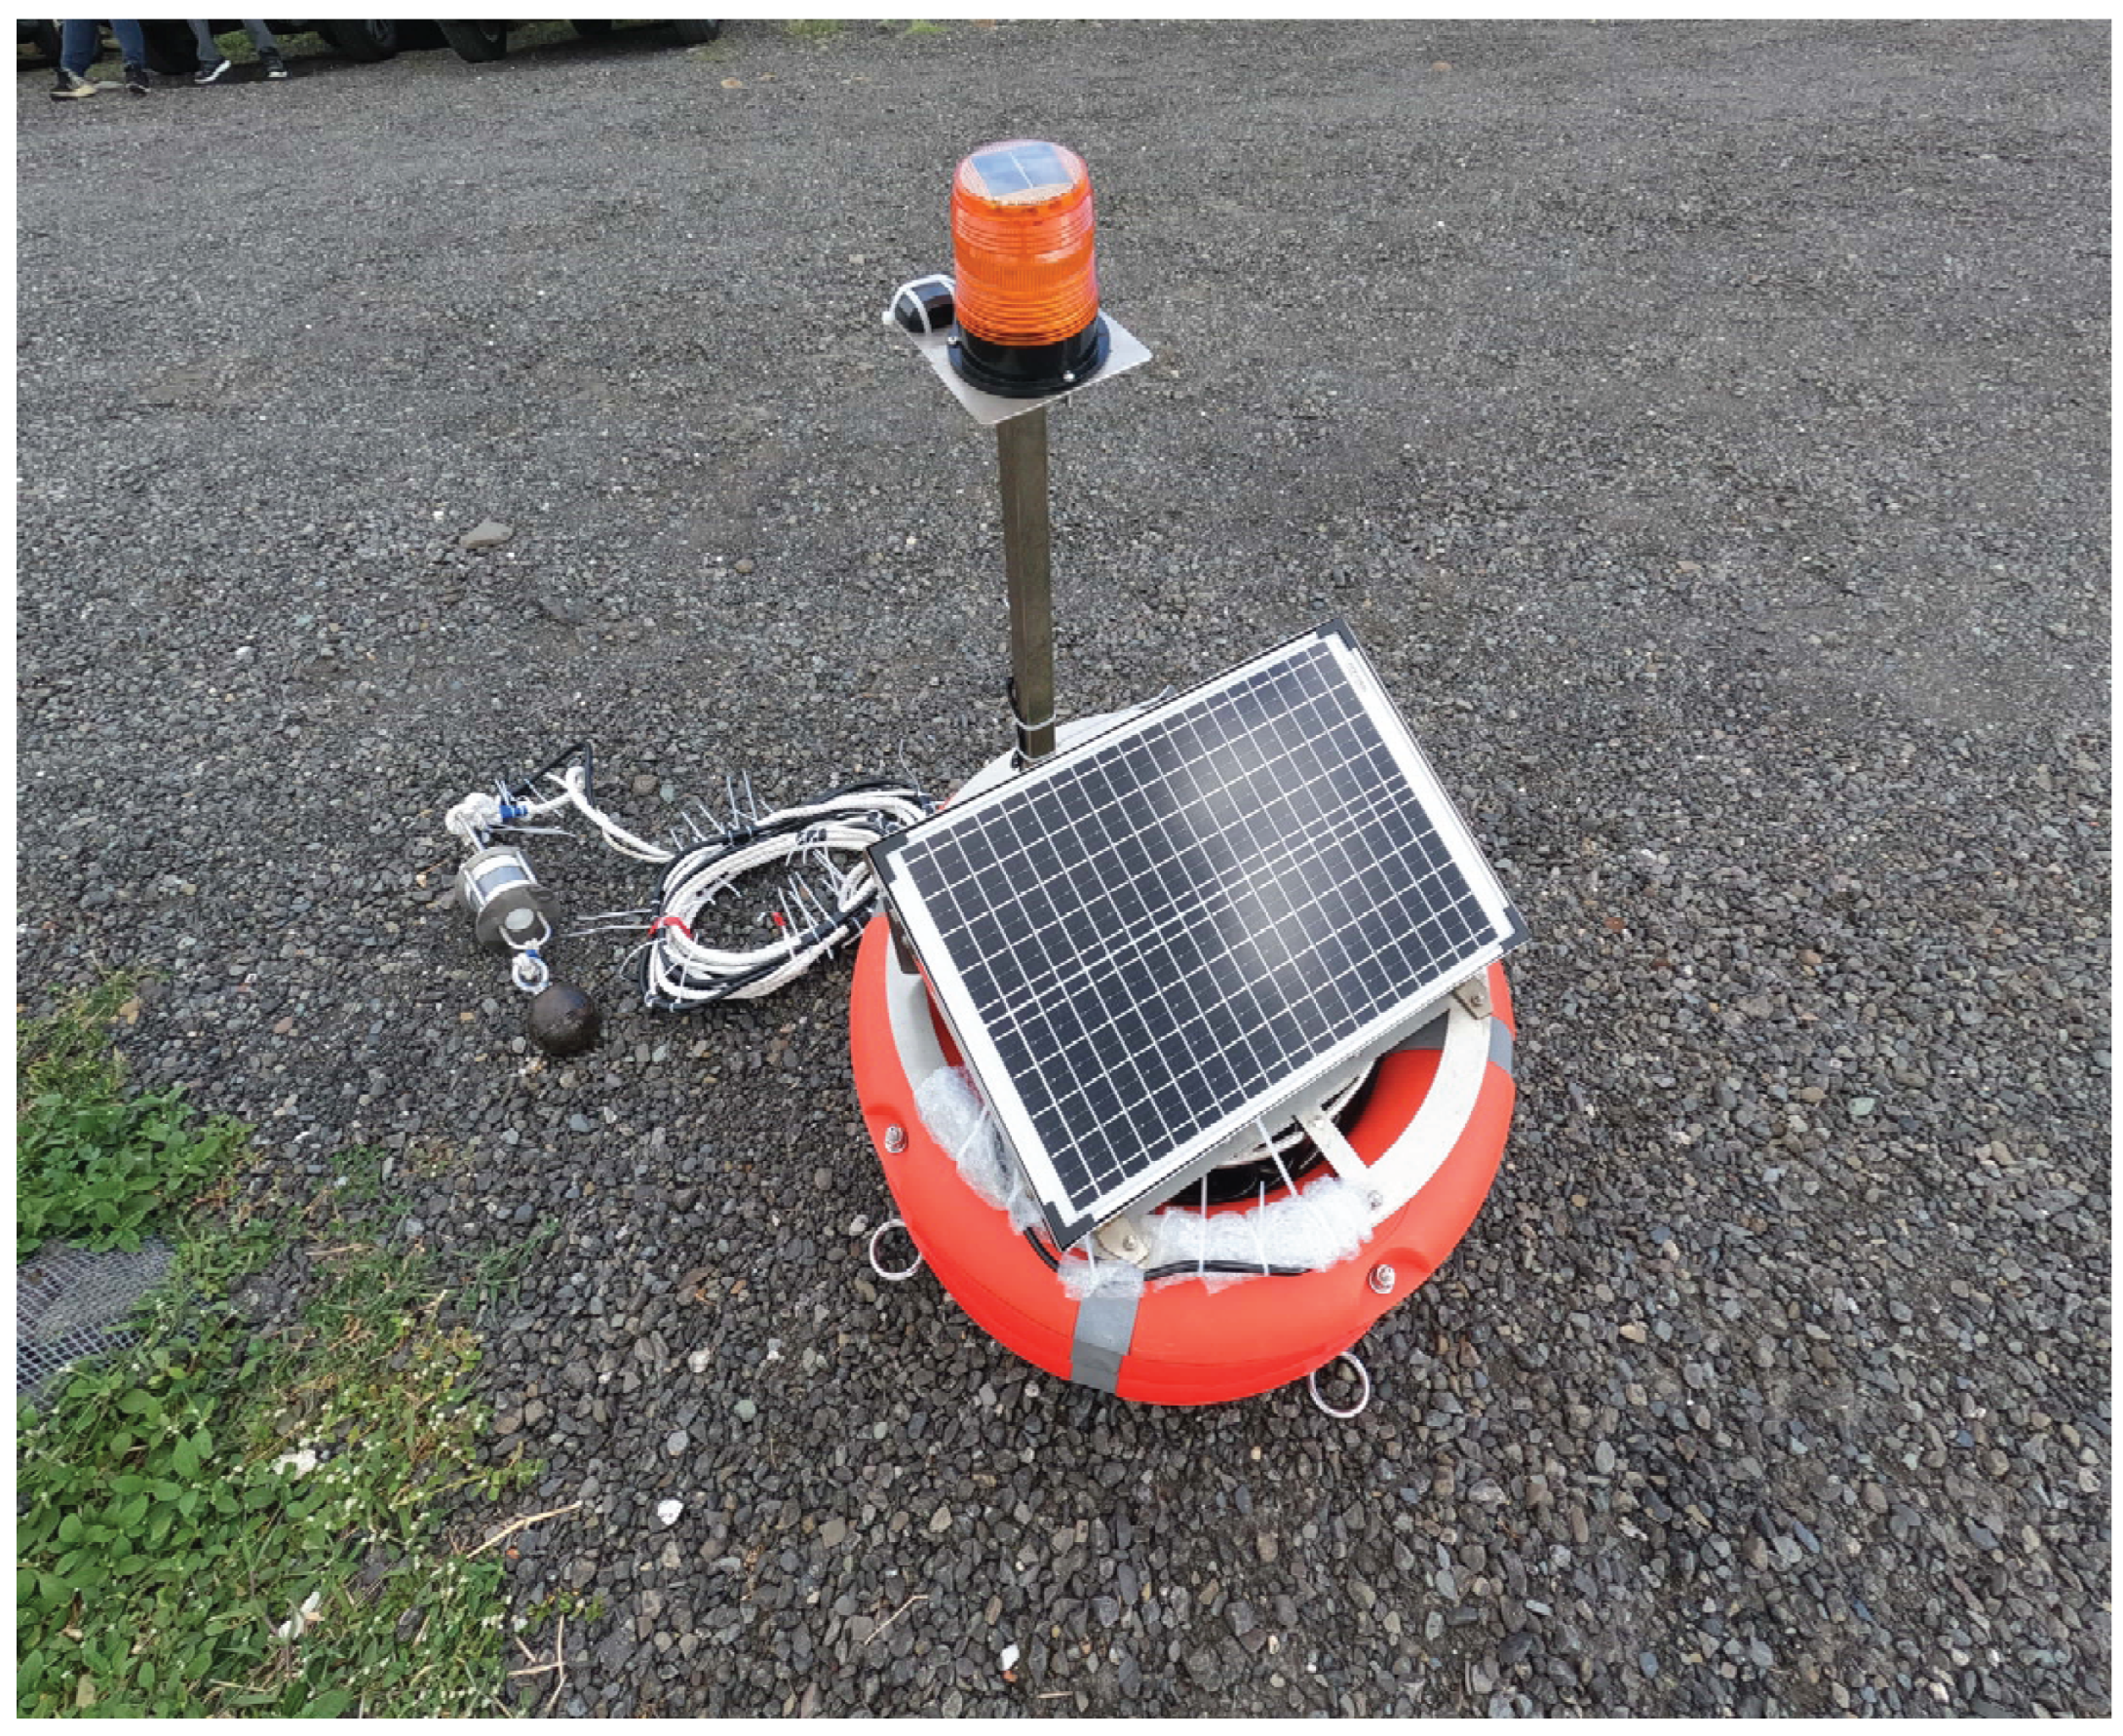
- The proposed AI buoy system is designed and implemented to achieve a low-cost and easy-to-build architecture that deals with the difficulty of installation in the water environment.
- RS-485 with an industry interface standard is integrated into the buoy to enhance the stability of sensor measurement. In addition, to adapt to the dynamics of the interface standard, the proposed buoy allows the aquaculture staff to switch to different sensors for various water quality parameter monitoring.
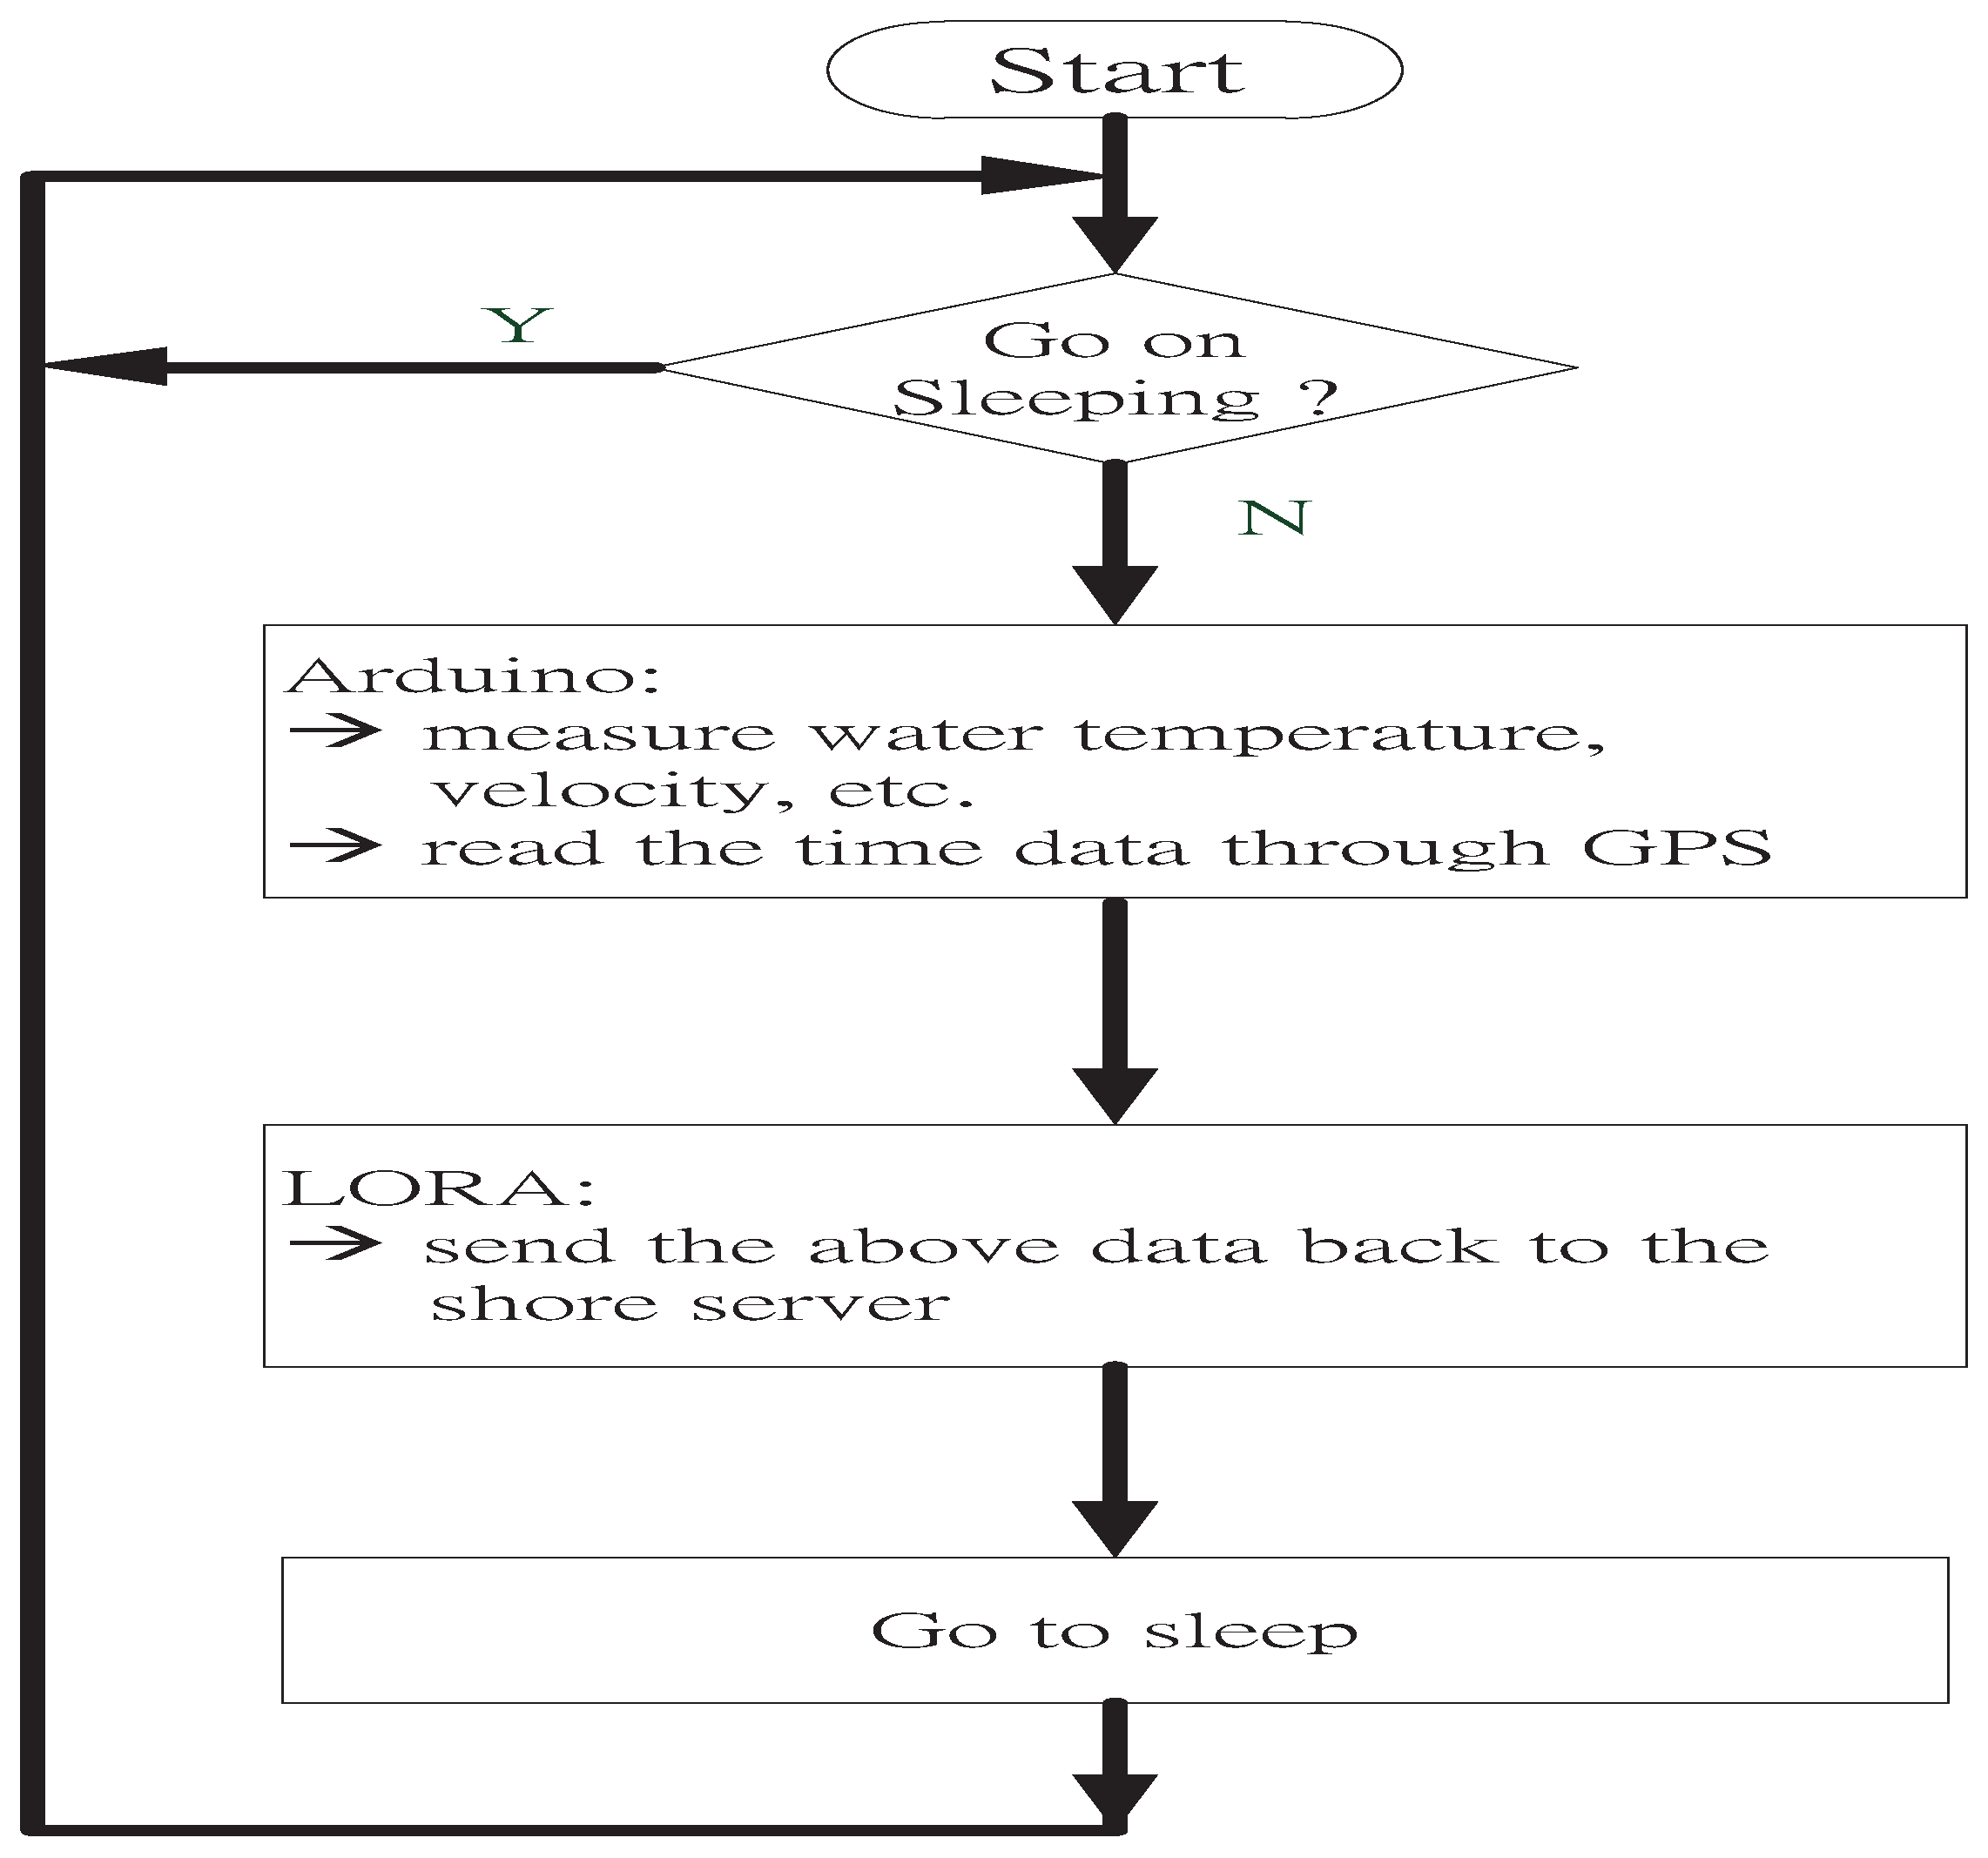
- Integrating LoRa for the wireless communications mechanism requires low power consumption for the proposed AI buoy operation in transmitting the water quality measurement data, considering it is several kilometers away from the shore server.
- The measurement data stored at the shore server are utilized for the machine learning algorithm training using the server-side AI programs. The training results provide AI models for intelligent water quality prediction on water temperature and velocity. In addition, the data measured by the flow sensor tube are also utilized to assist the AI regression in estimating water velocity, thereby achieving low-cost water flow meter design and implementation.
2. Architecture and Operation Flow
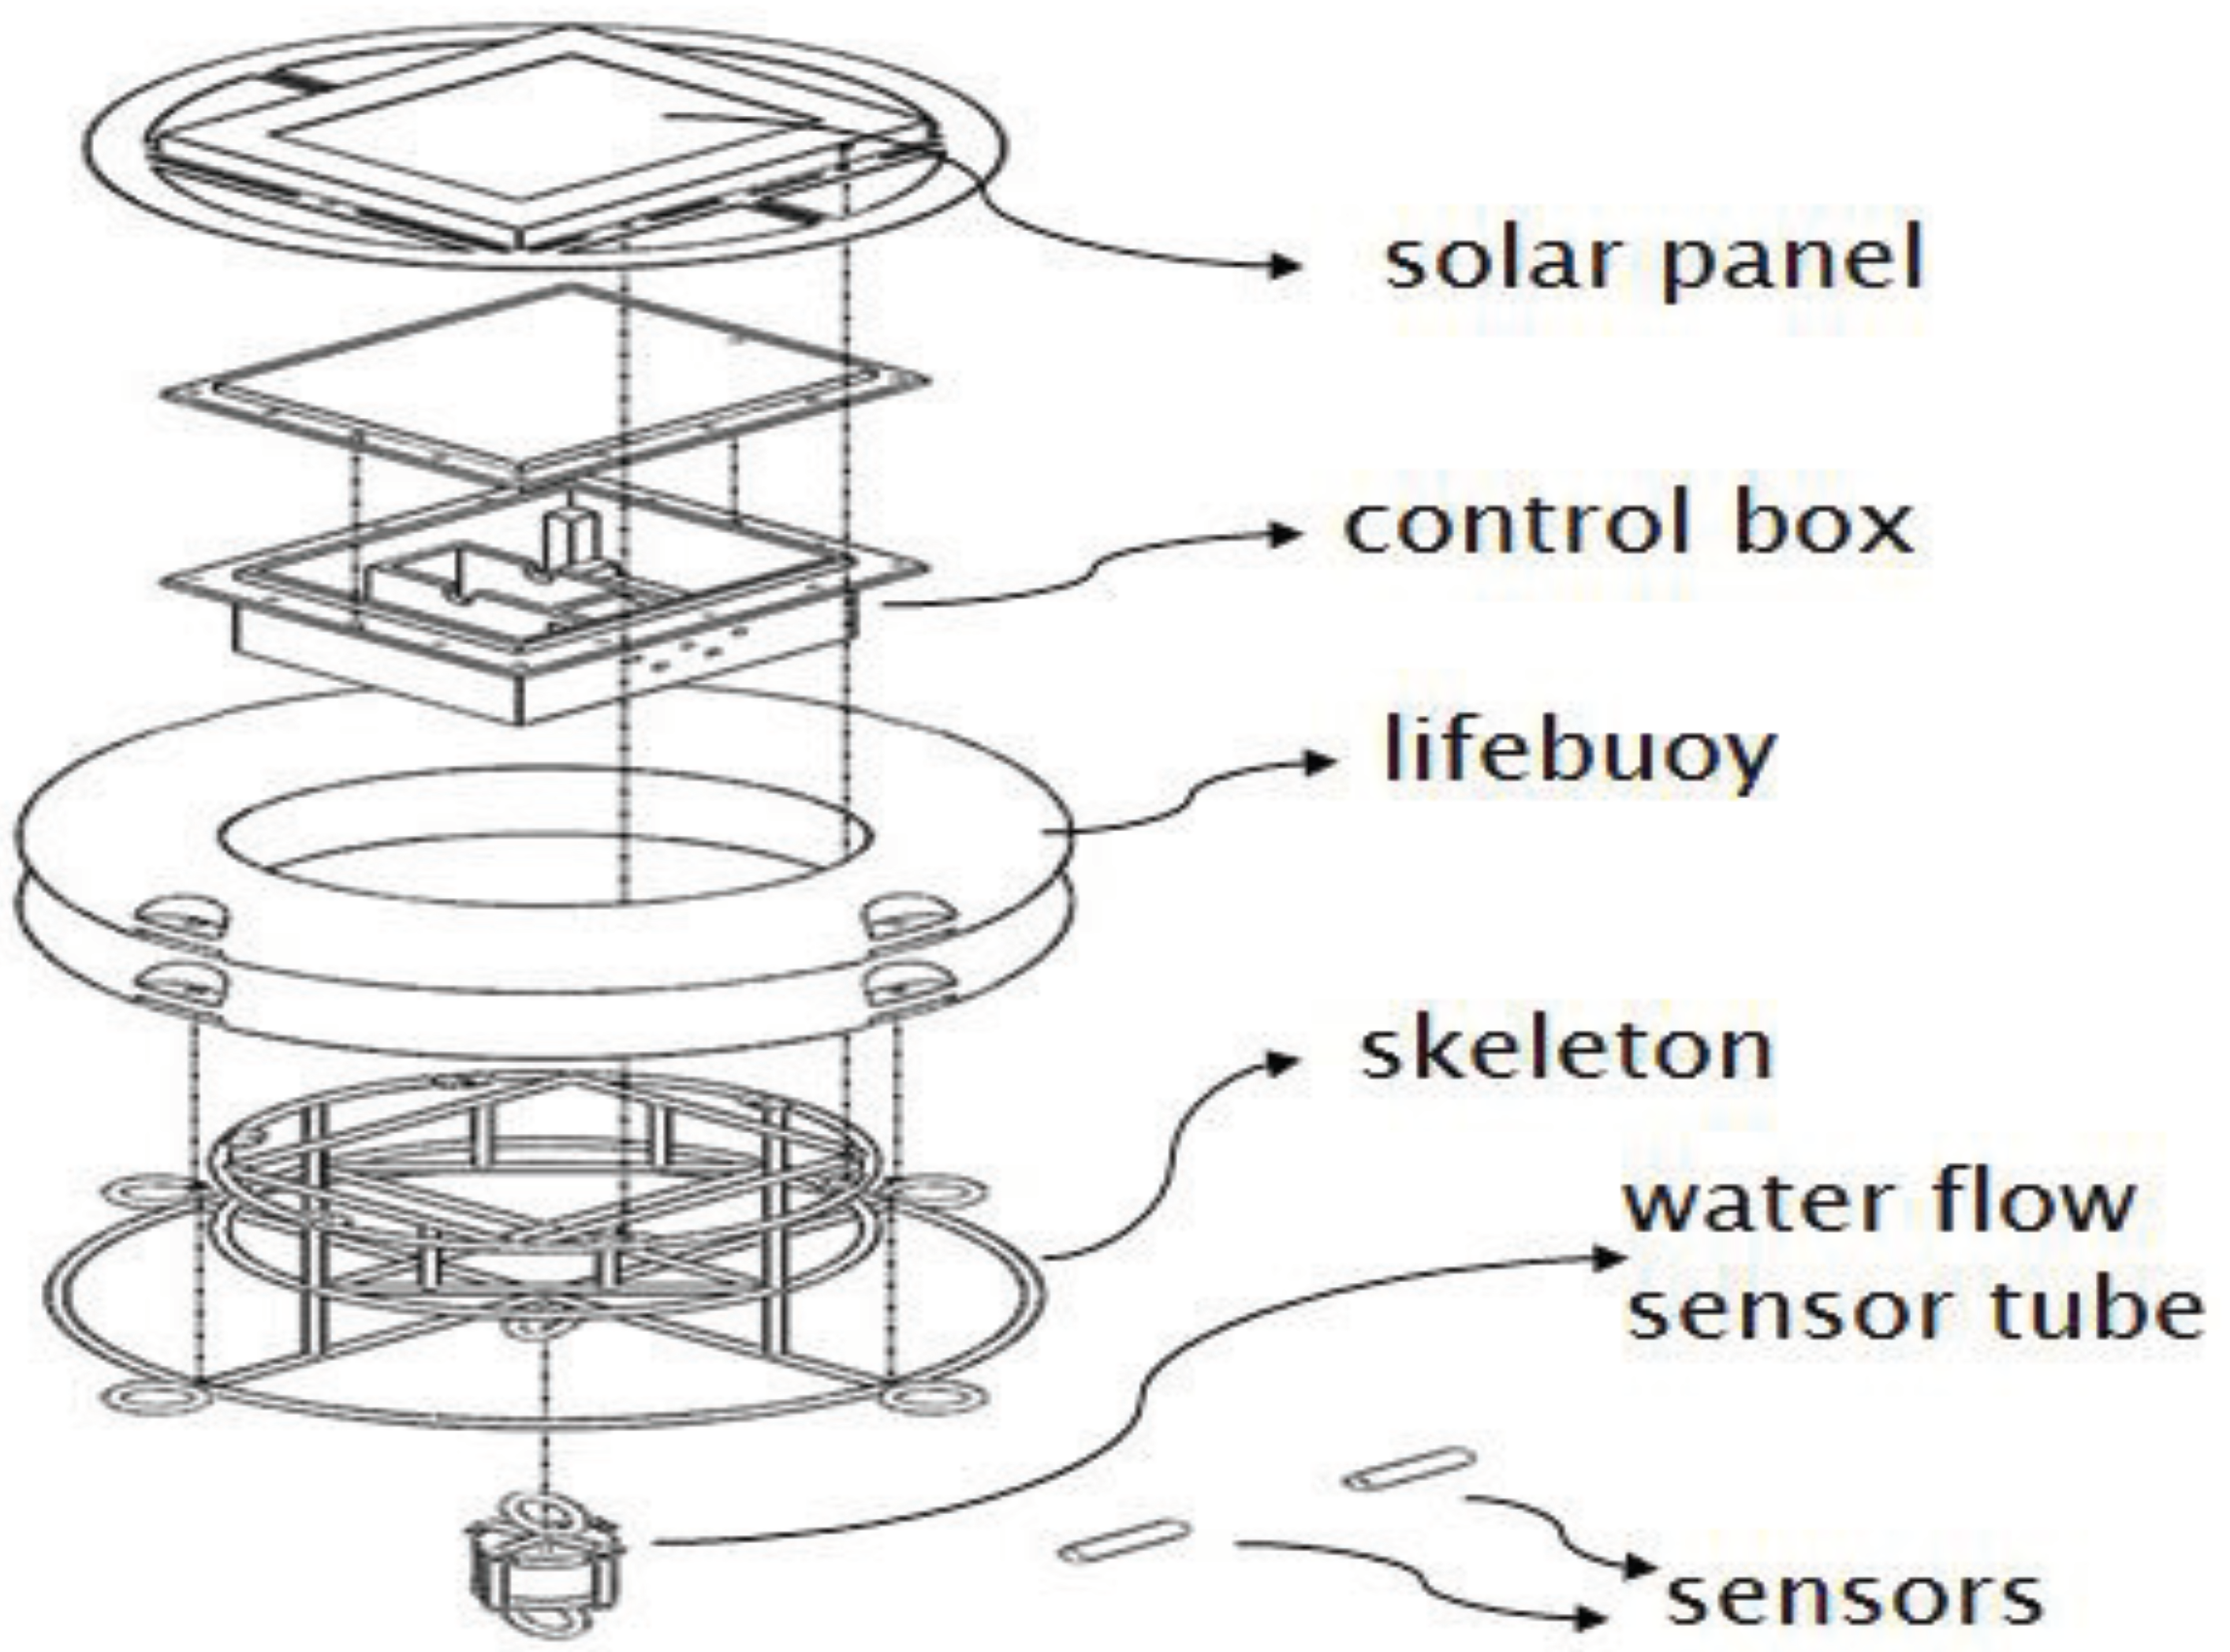
2.1. Architecture
- Solar panel: The solar panel converts the irradiated energy of the sun into electrical energy and then stores the energy in the battery, thereby functioning as a power source for the offshore buoy.
- Waterproof control box: The control box was designed to provide space for the kernel devices of the offshore buoy. The devices included are the Arduino which controls the entire function of the buoy, and the LoRa module, which is responsible for wireless communication transmissions.
- Lifebuoys: The two lifebuoys provide the needed buoyancy for the offshore buoy to float on the water surface.
- Steel skeleton: The steel skeleton combines the control box, lifebuoys, and other associated items as a buoy.
- Sensors: Measure water quality data such as temperature, DO, and salinity.
- Water flow sensing tube: An electronic accelerometer is installed to measure water velocity and direction using the flow tube. In addition, the flow tube is hung under the steel skeleton.
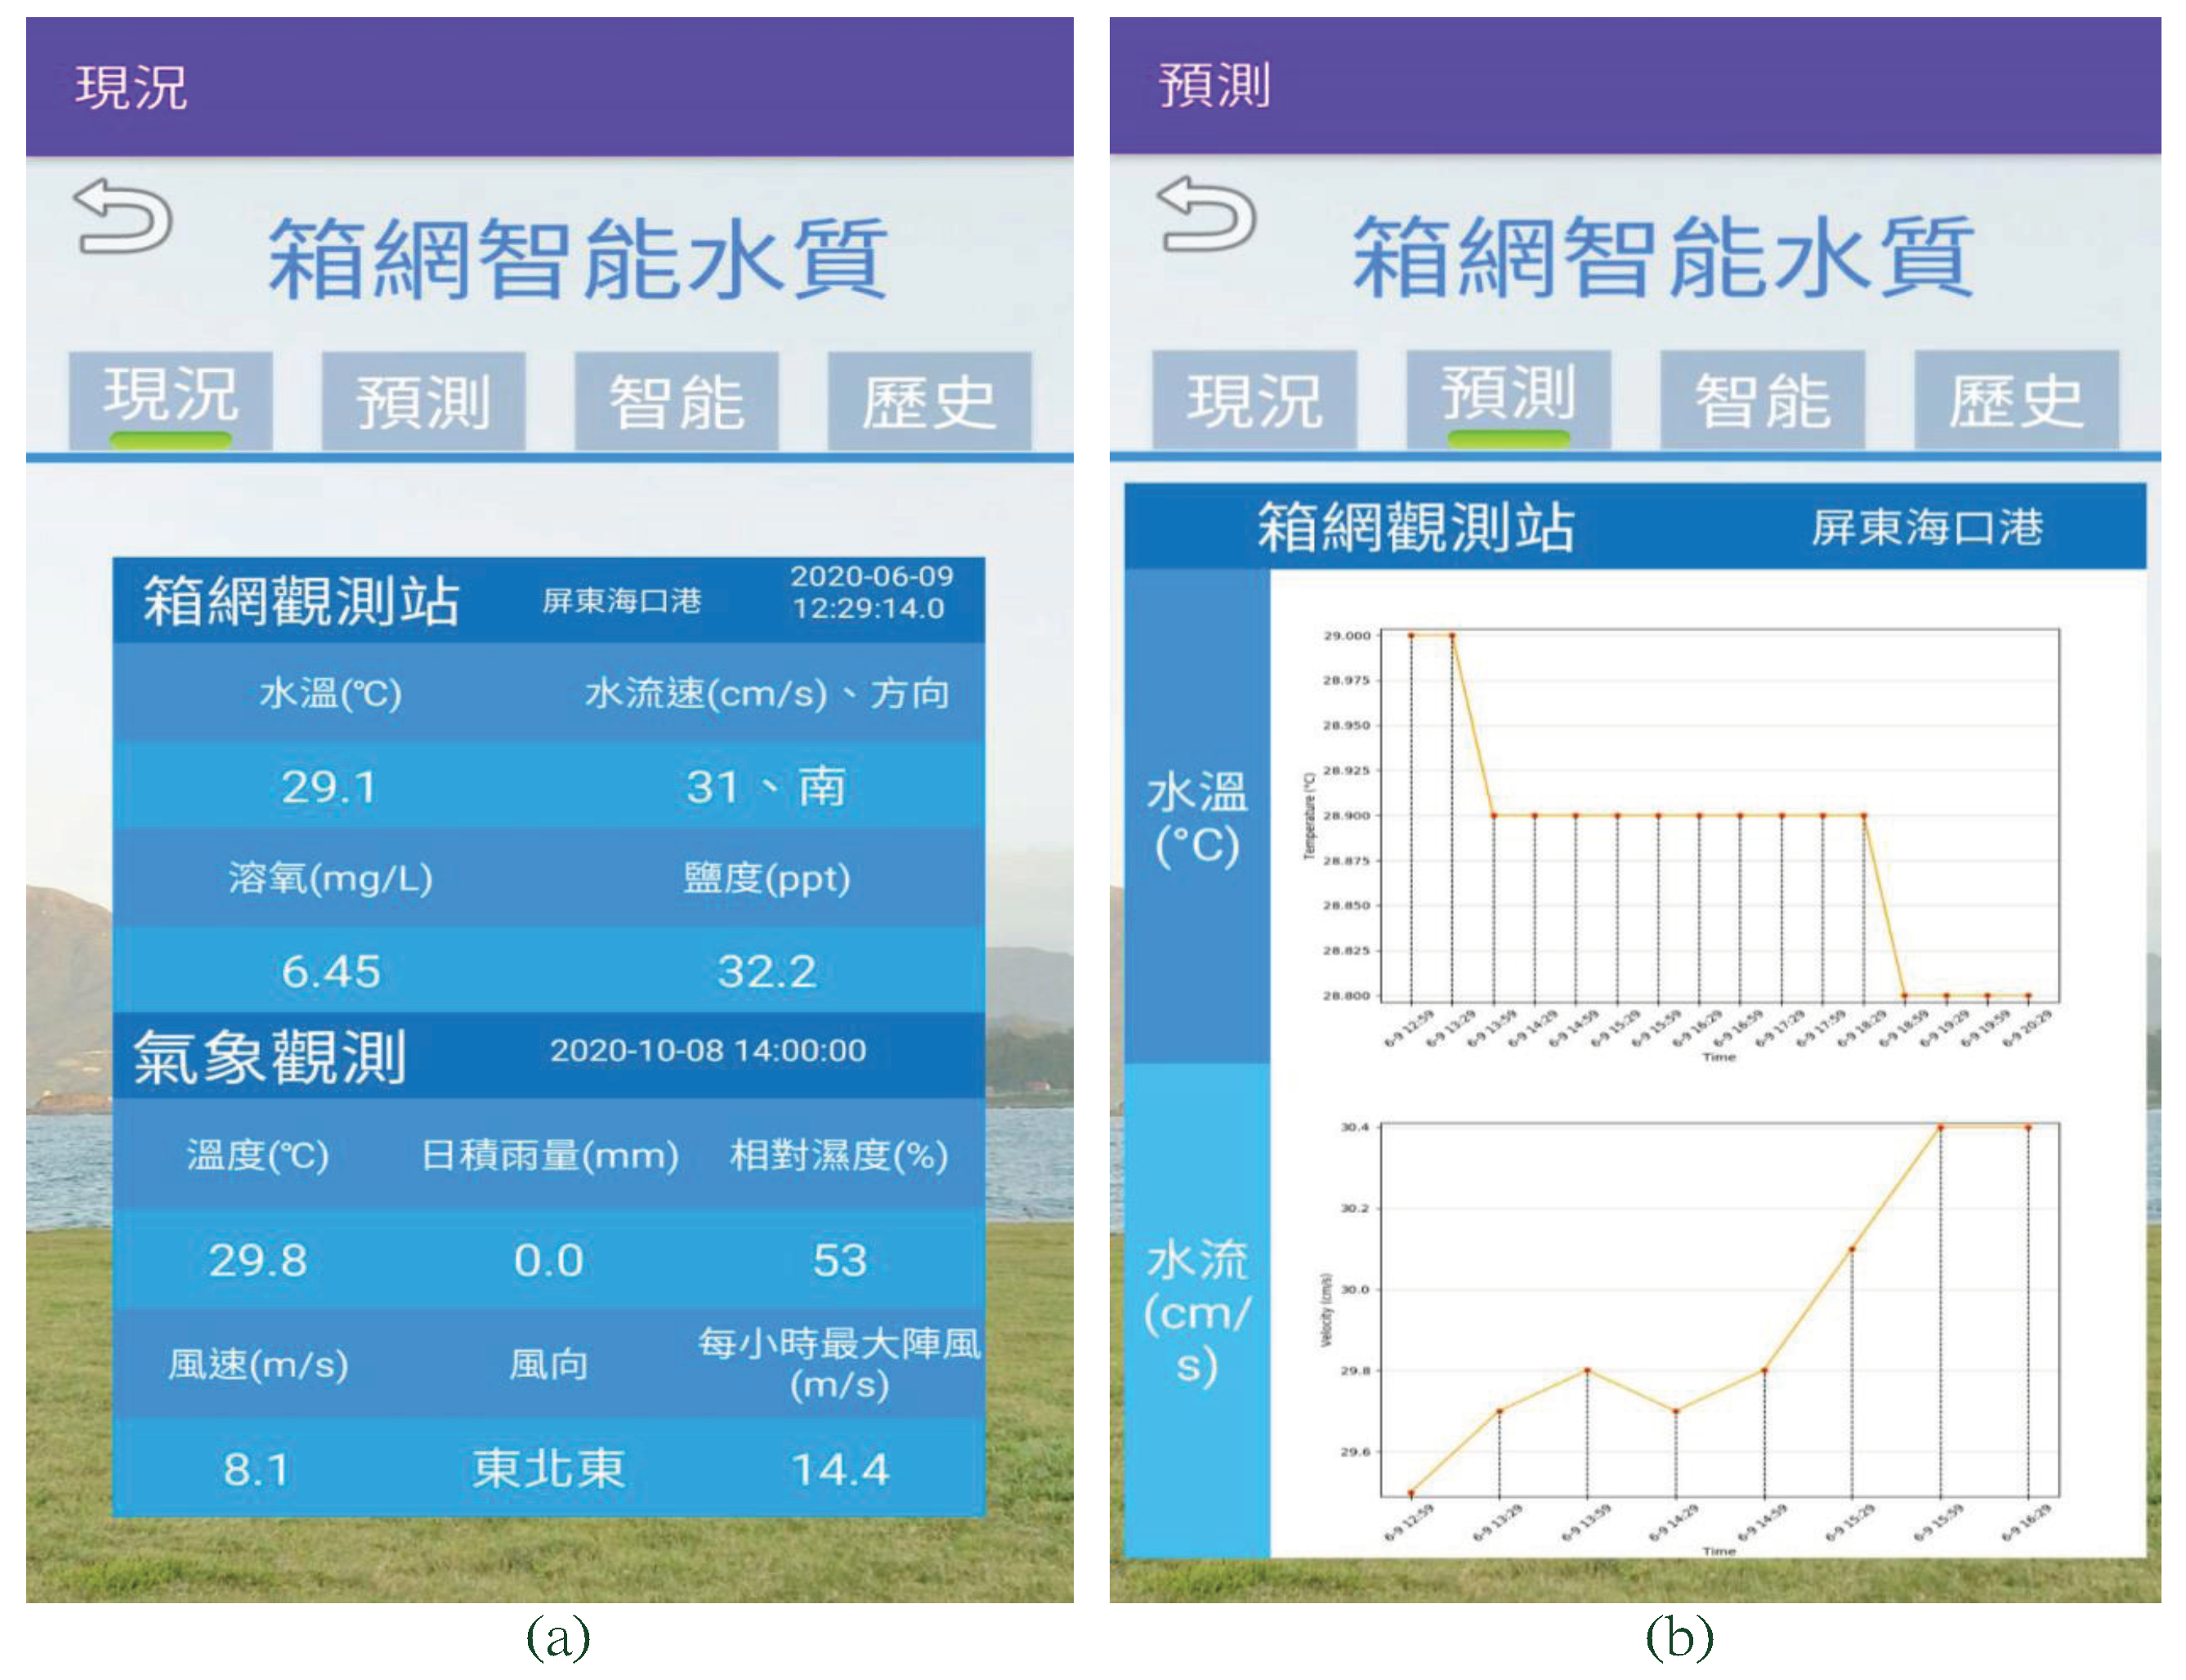
- Server-side AI programs: Three AI programs were deployed at the shore server to predict water temperature within the eight-hour duration, for water velocity within the four-hour duration.
2.2. Operation Flow
3. Hardware Modules
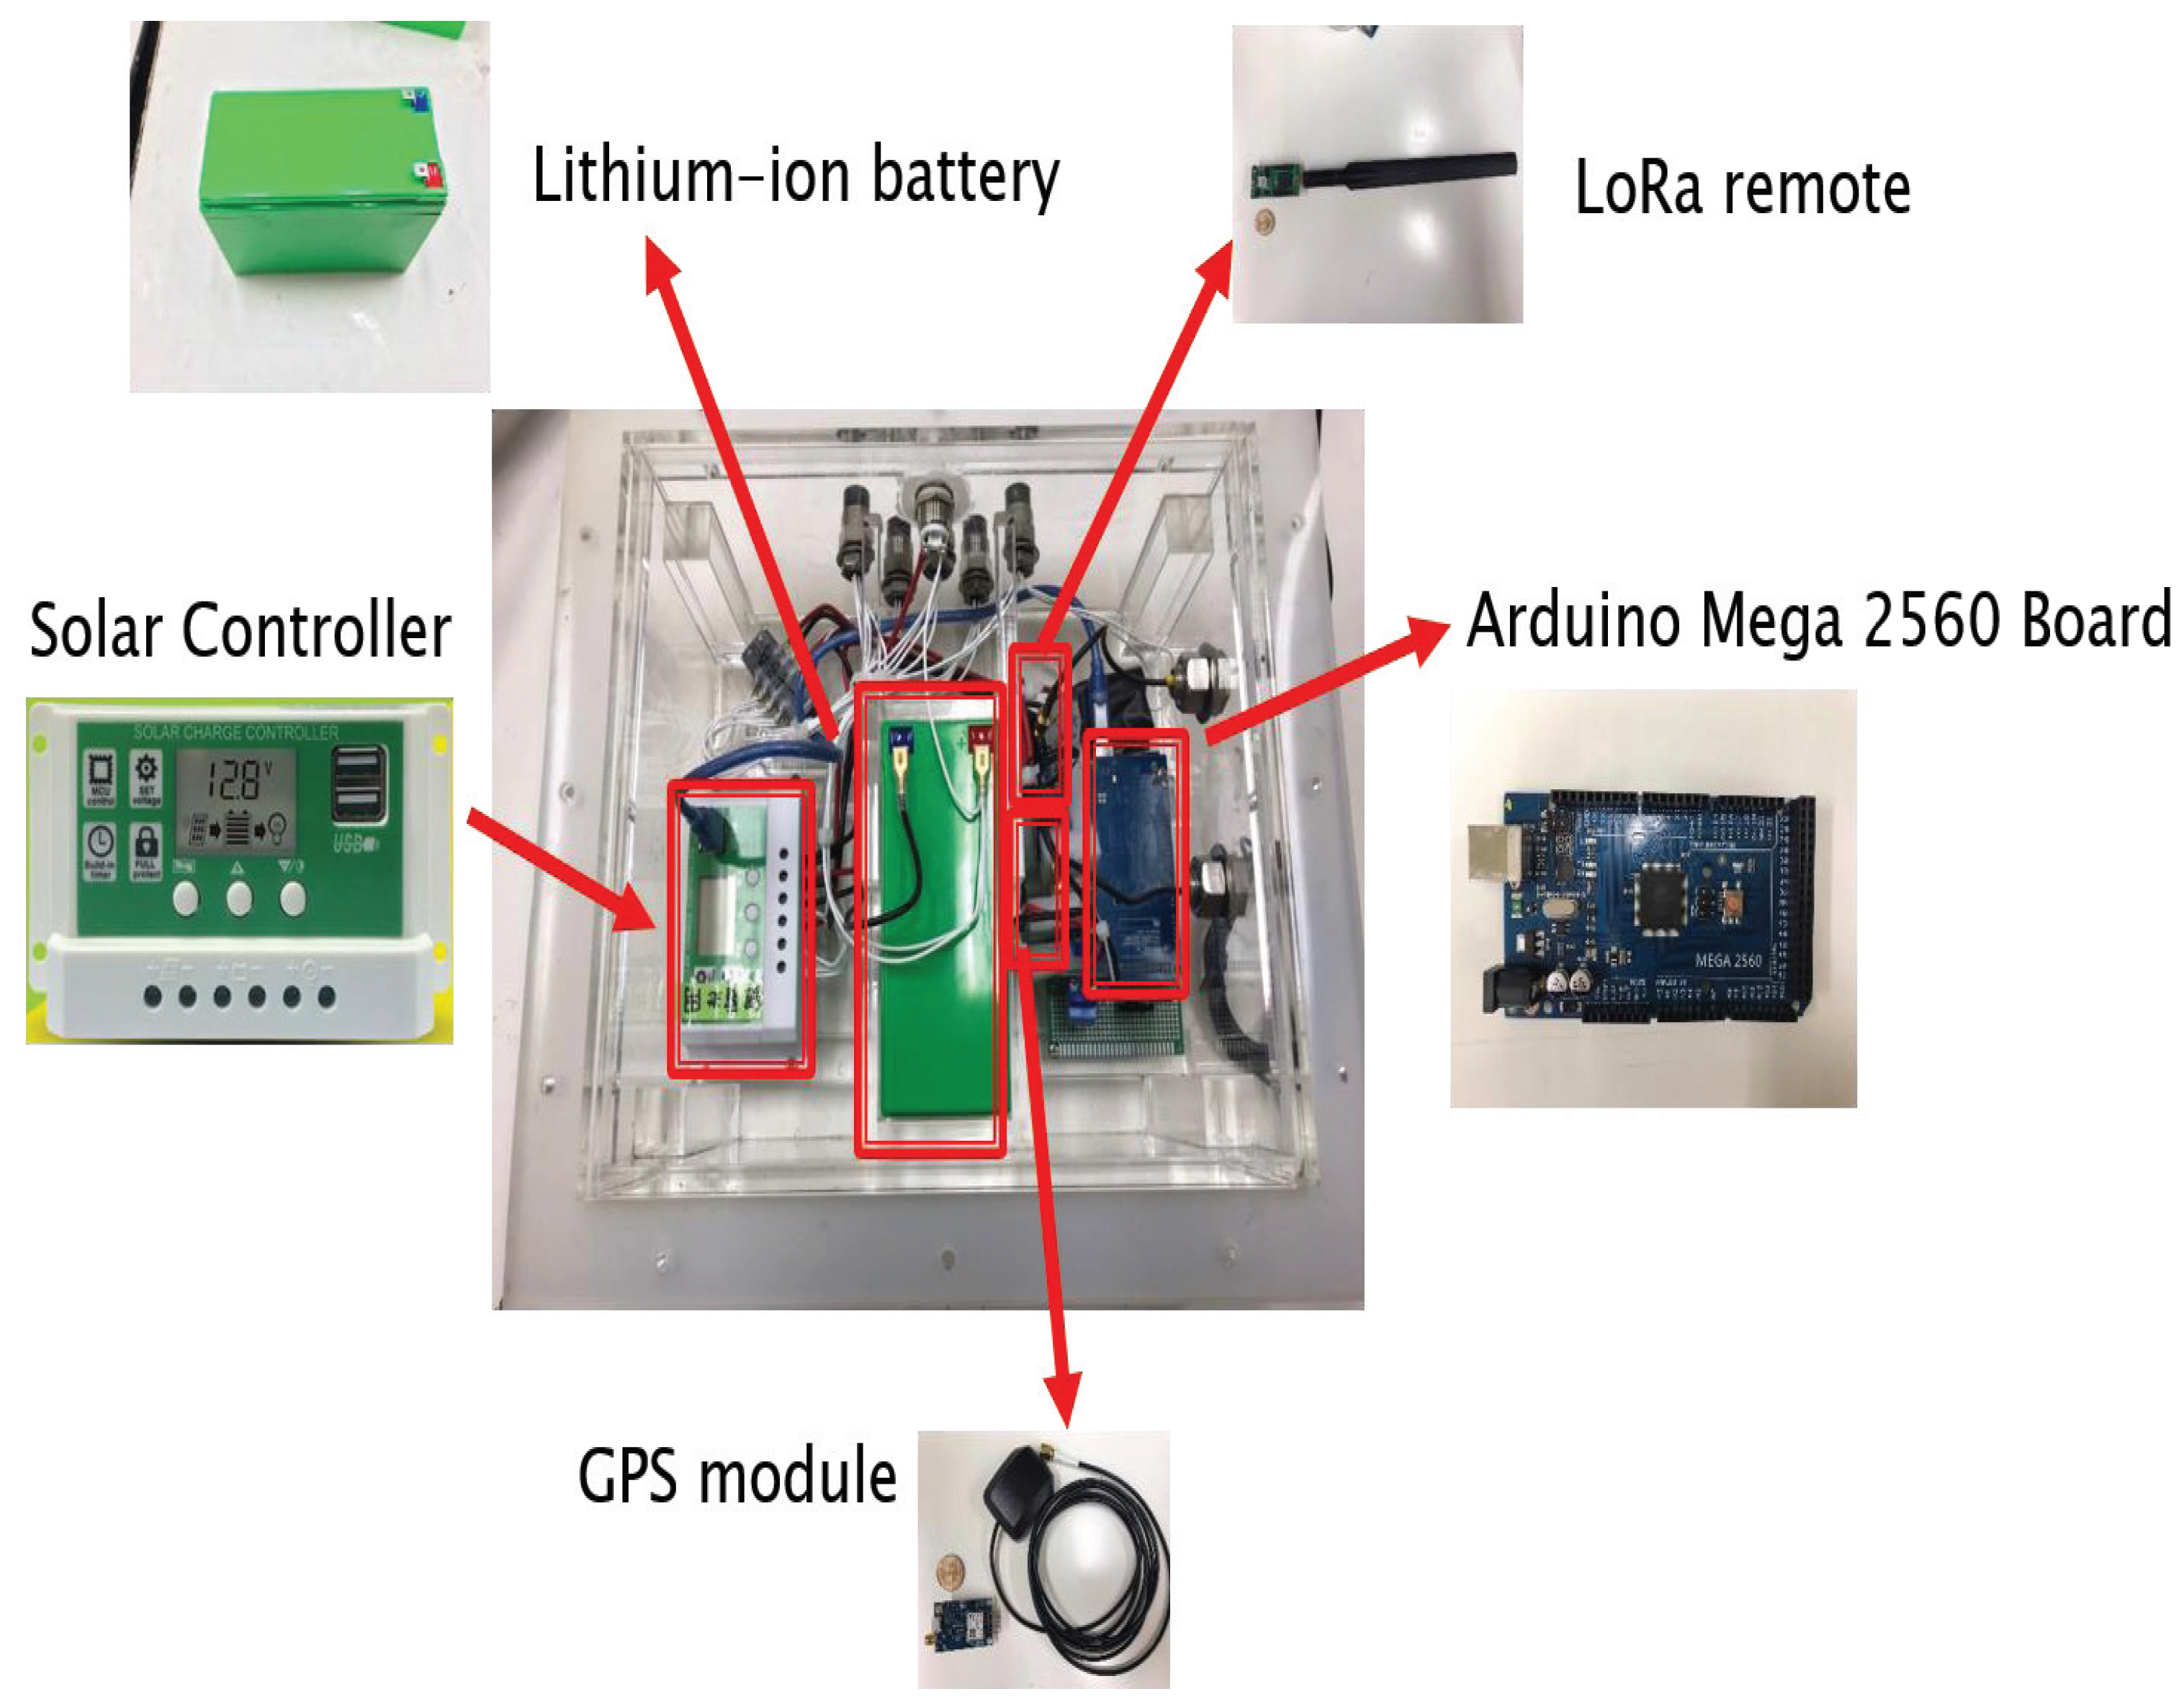
3.1. Control Box
- (1)
- Arduino Chip
- (2)
- LoRa Remote Module
- (3)
- Lithium-ion Battery and Solar Controller
- (4)
- GPS Module
3.2. Solar Panel
3.3. Sensors
4. Server-Side AI Programs
4.1. Prediction for Water Temperature
- (1)
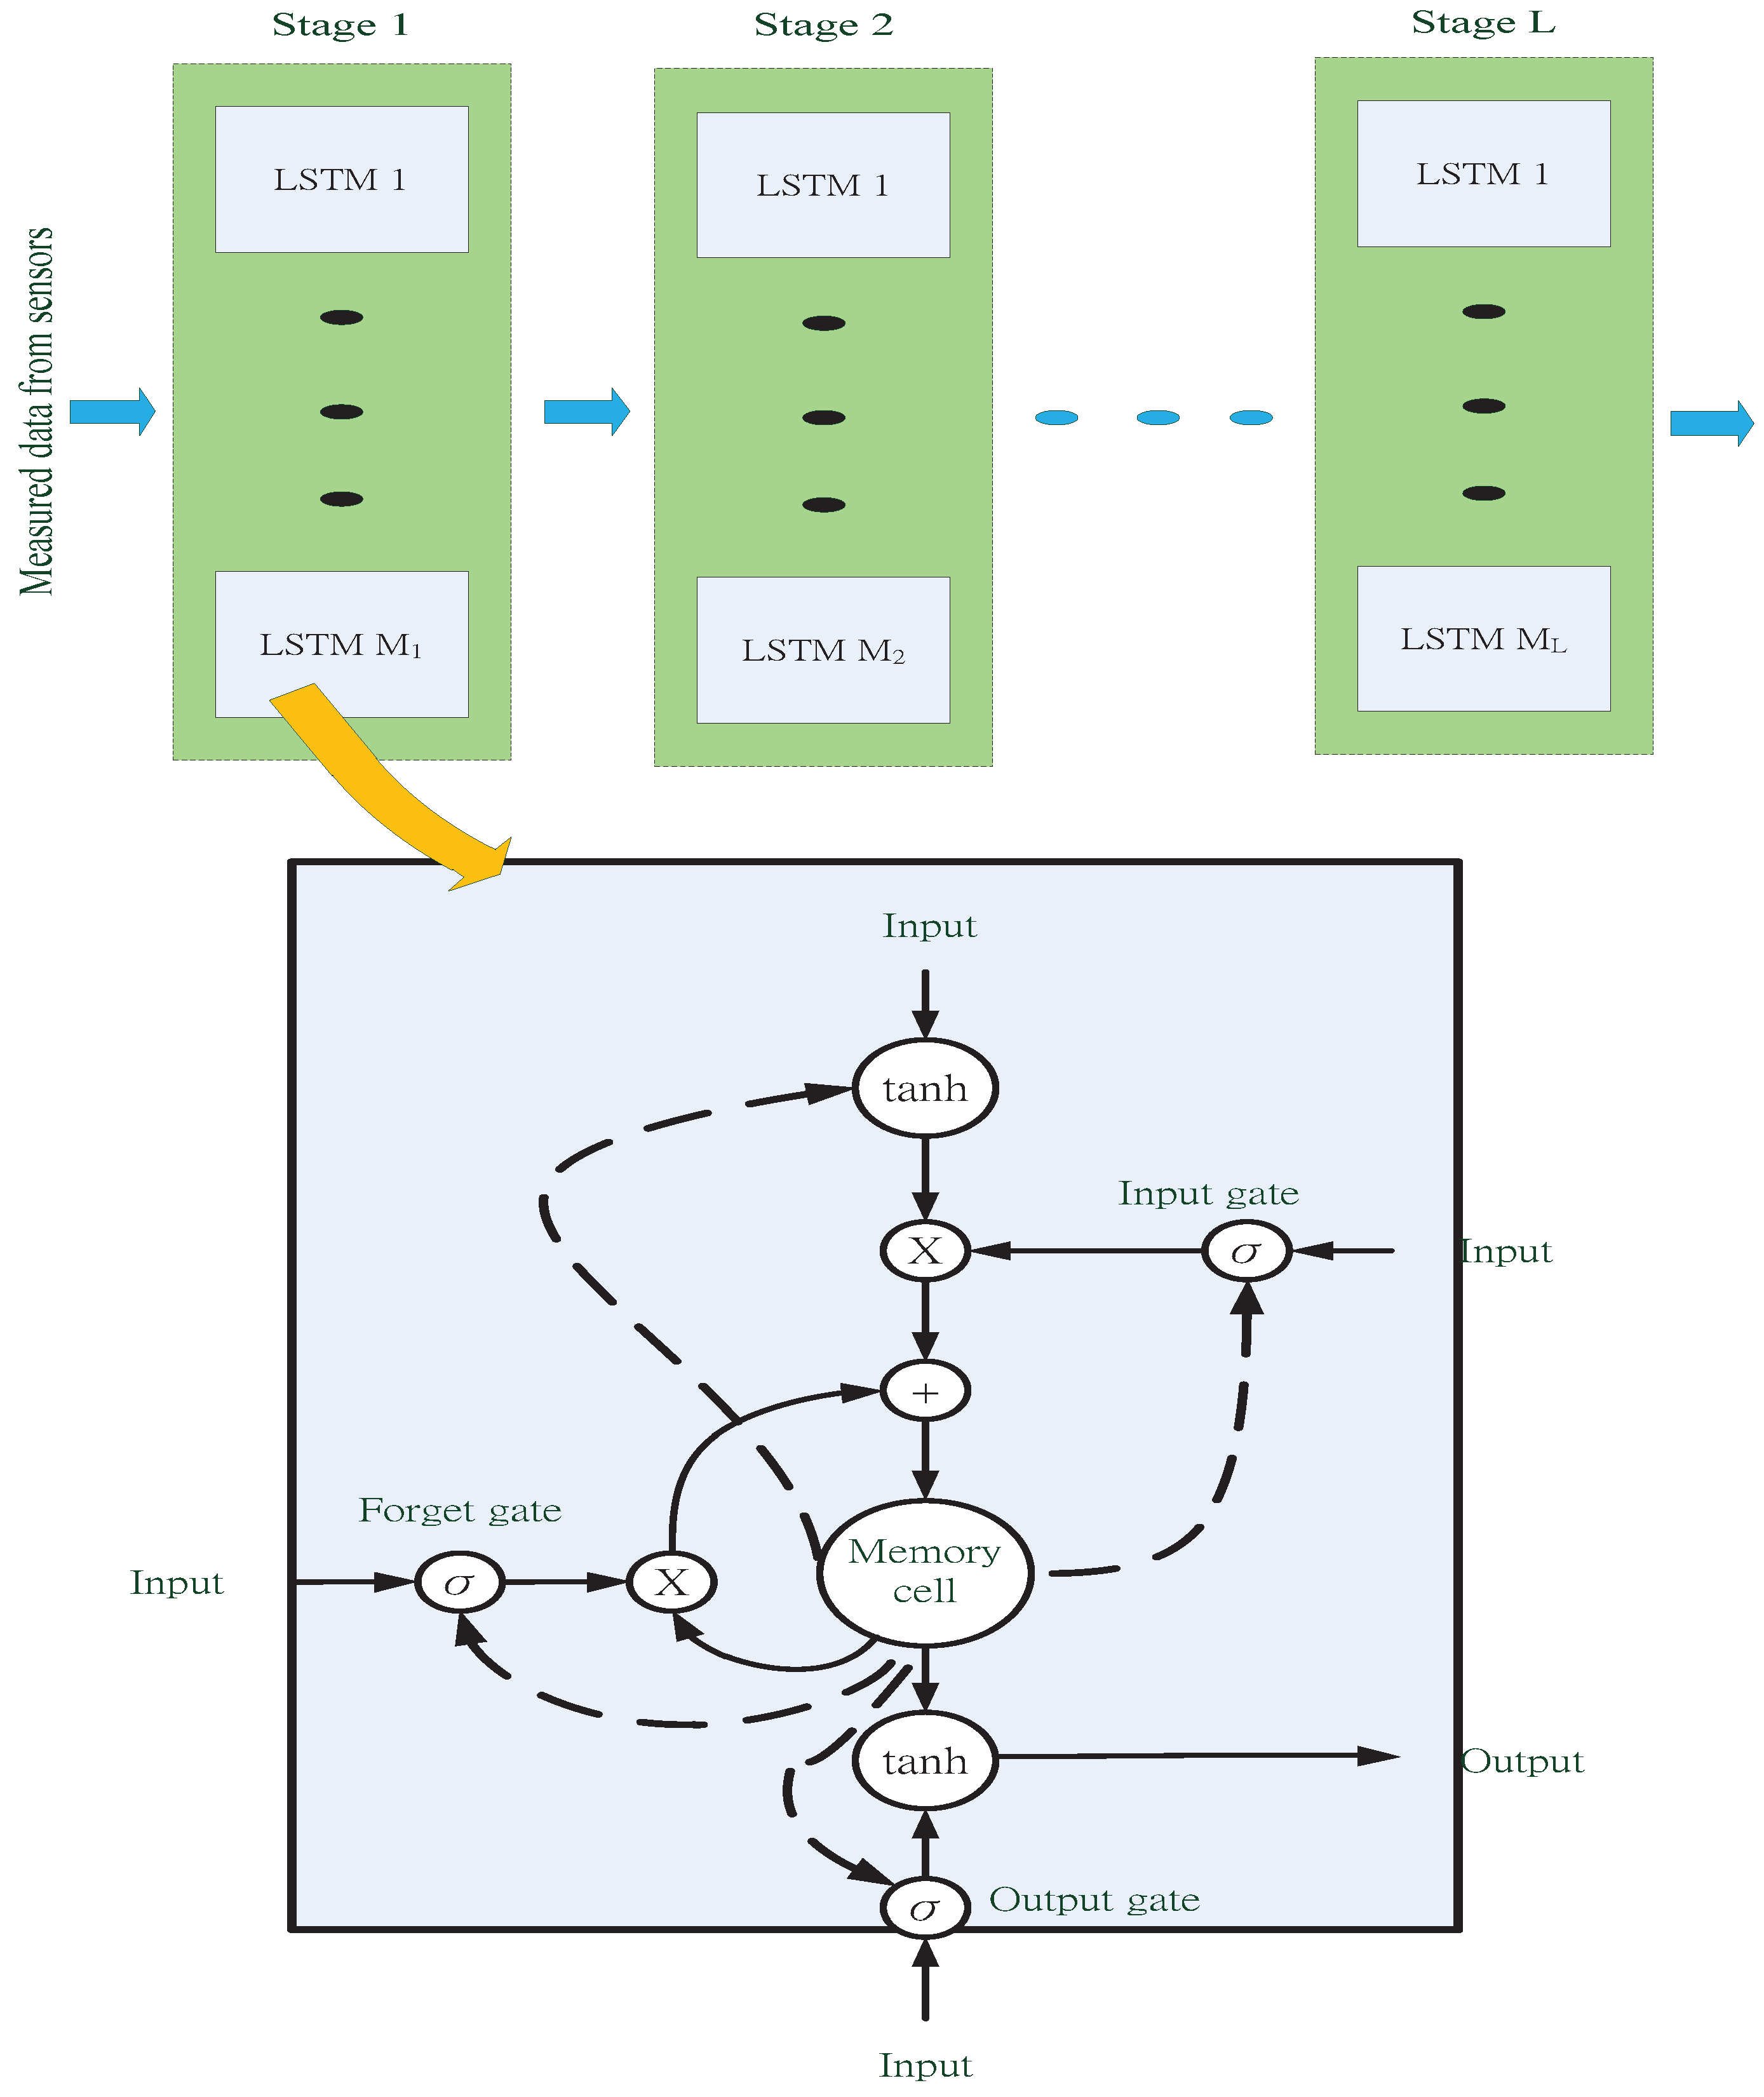
- Long Short-Term Memory (LSTM)
- (2)
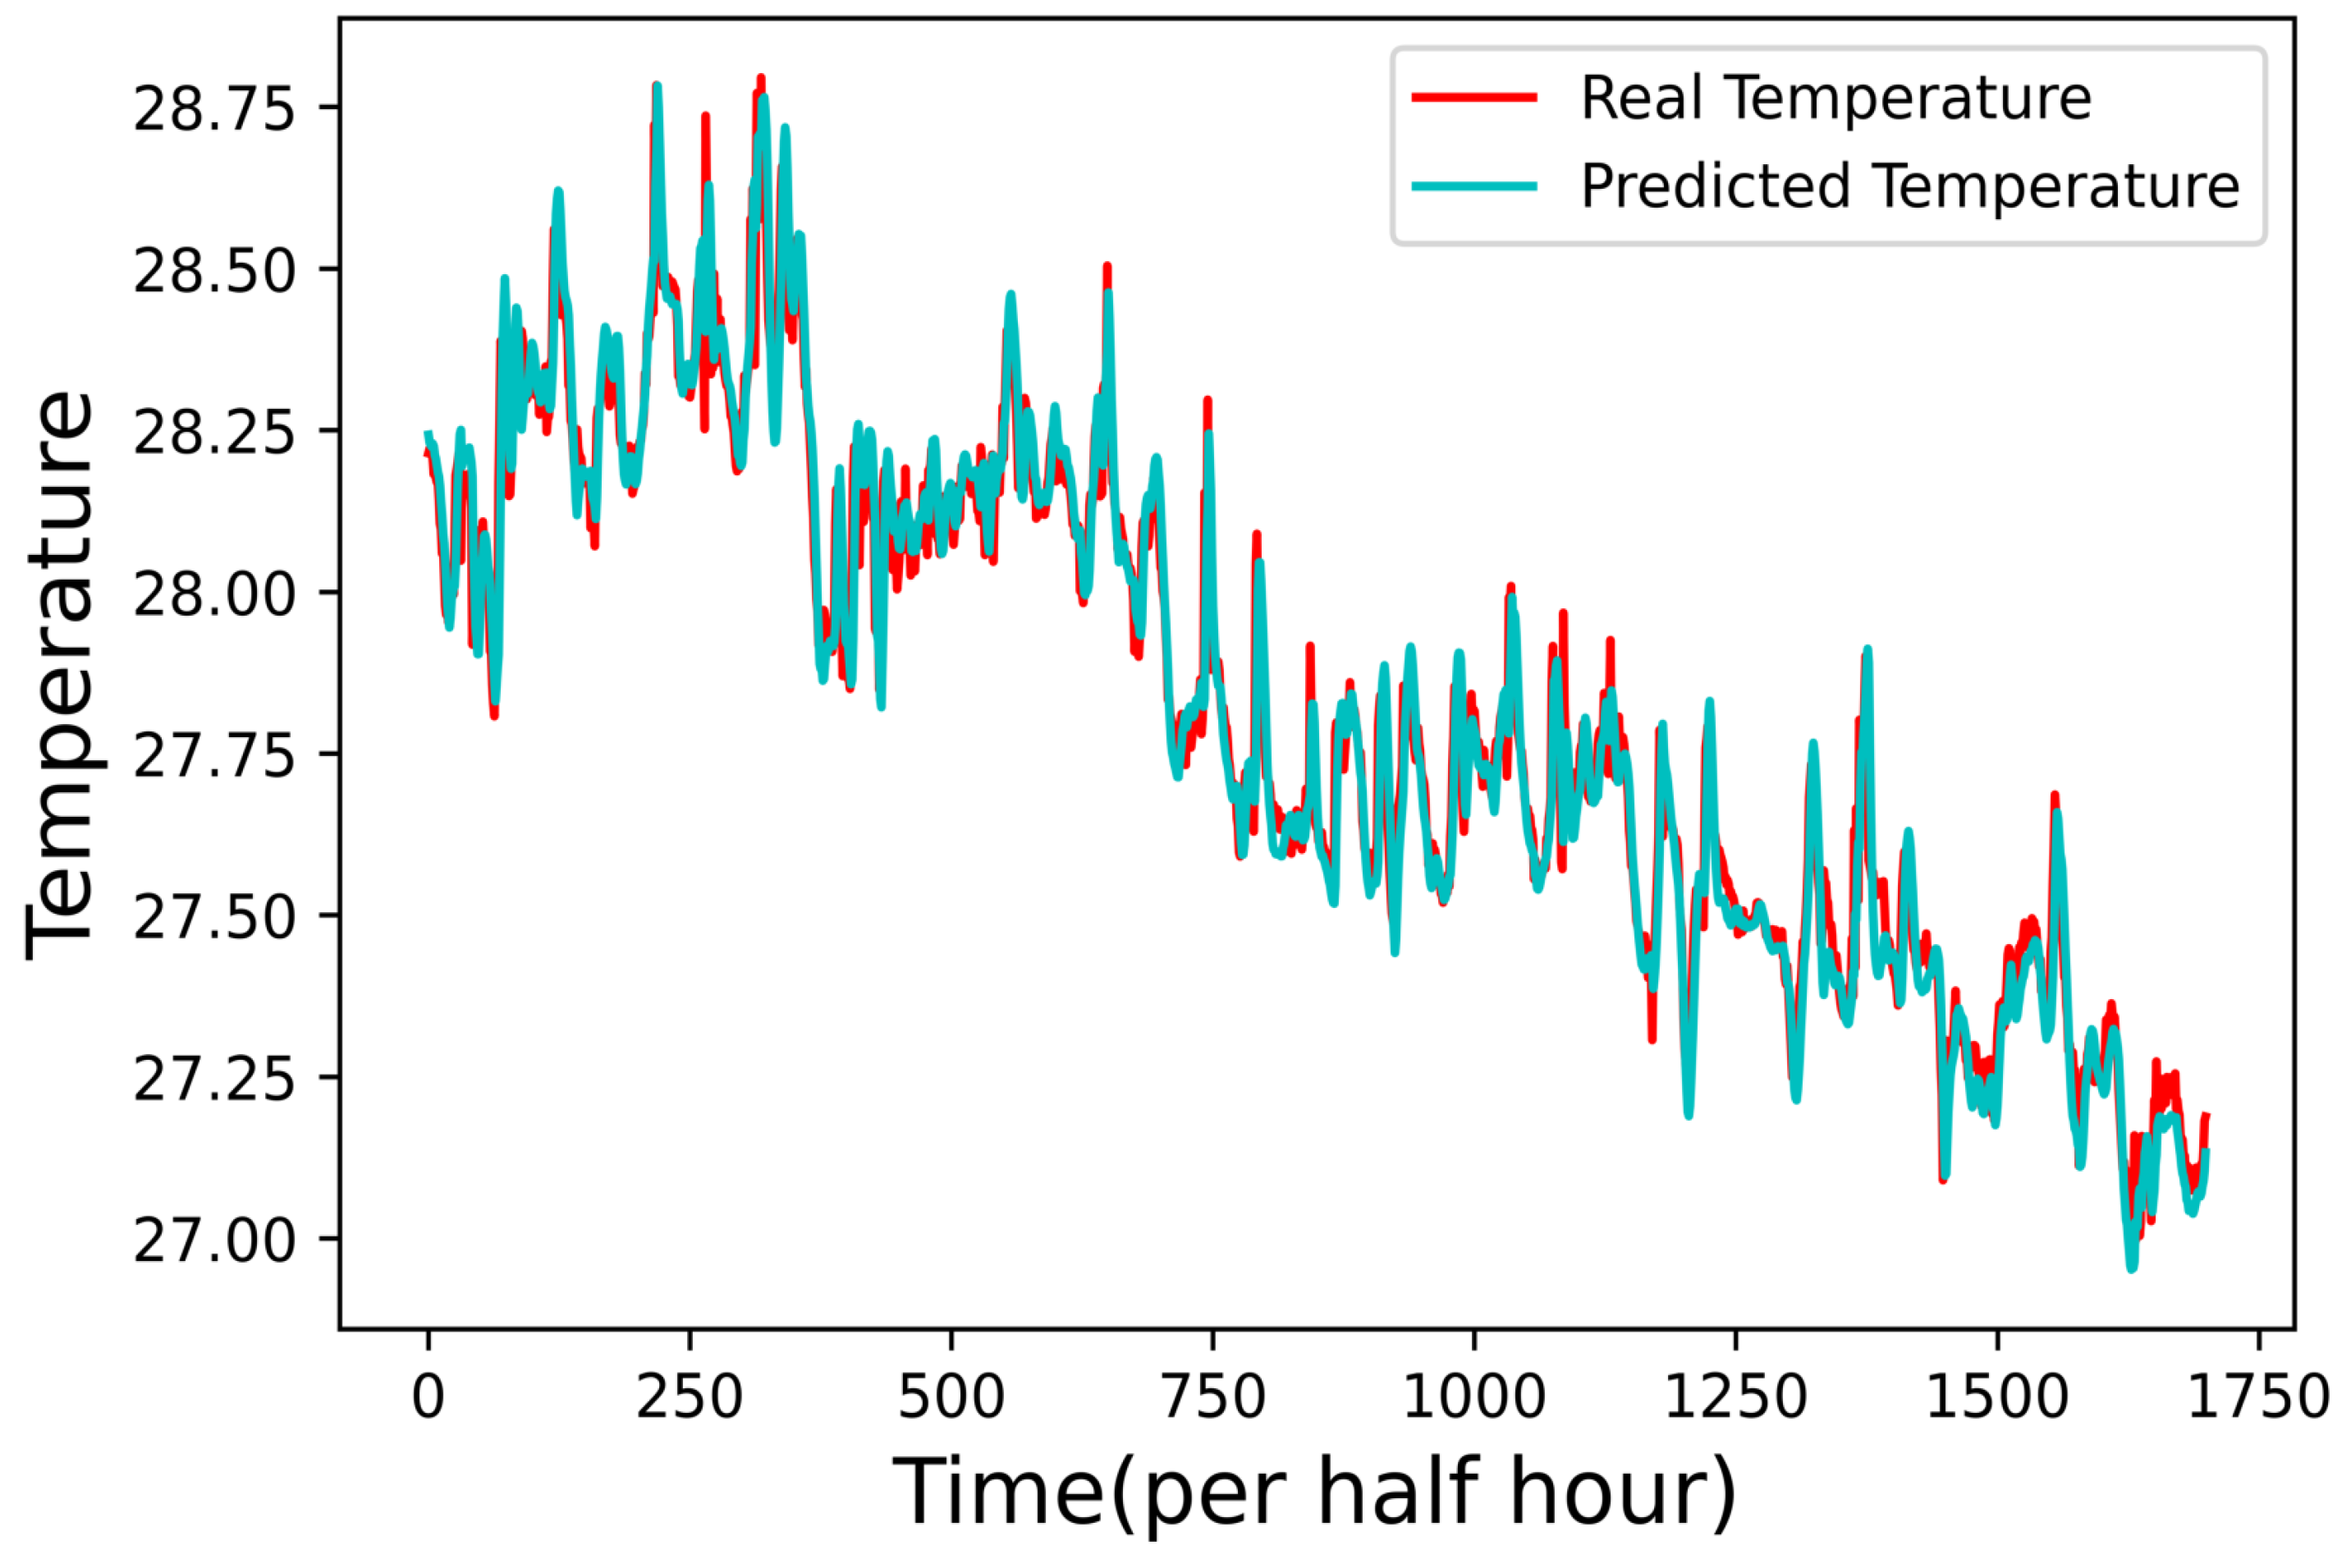
- Prediction Results of Water Temperature
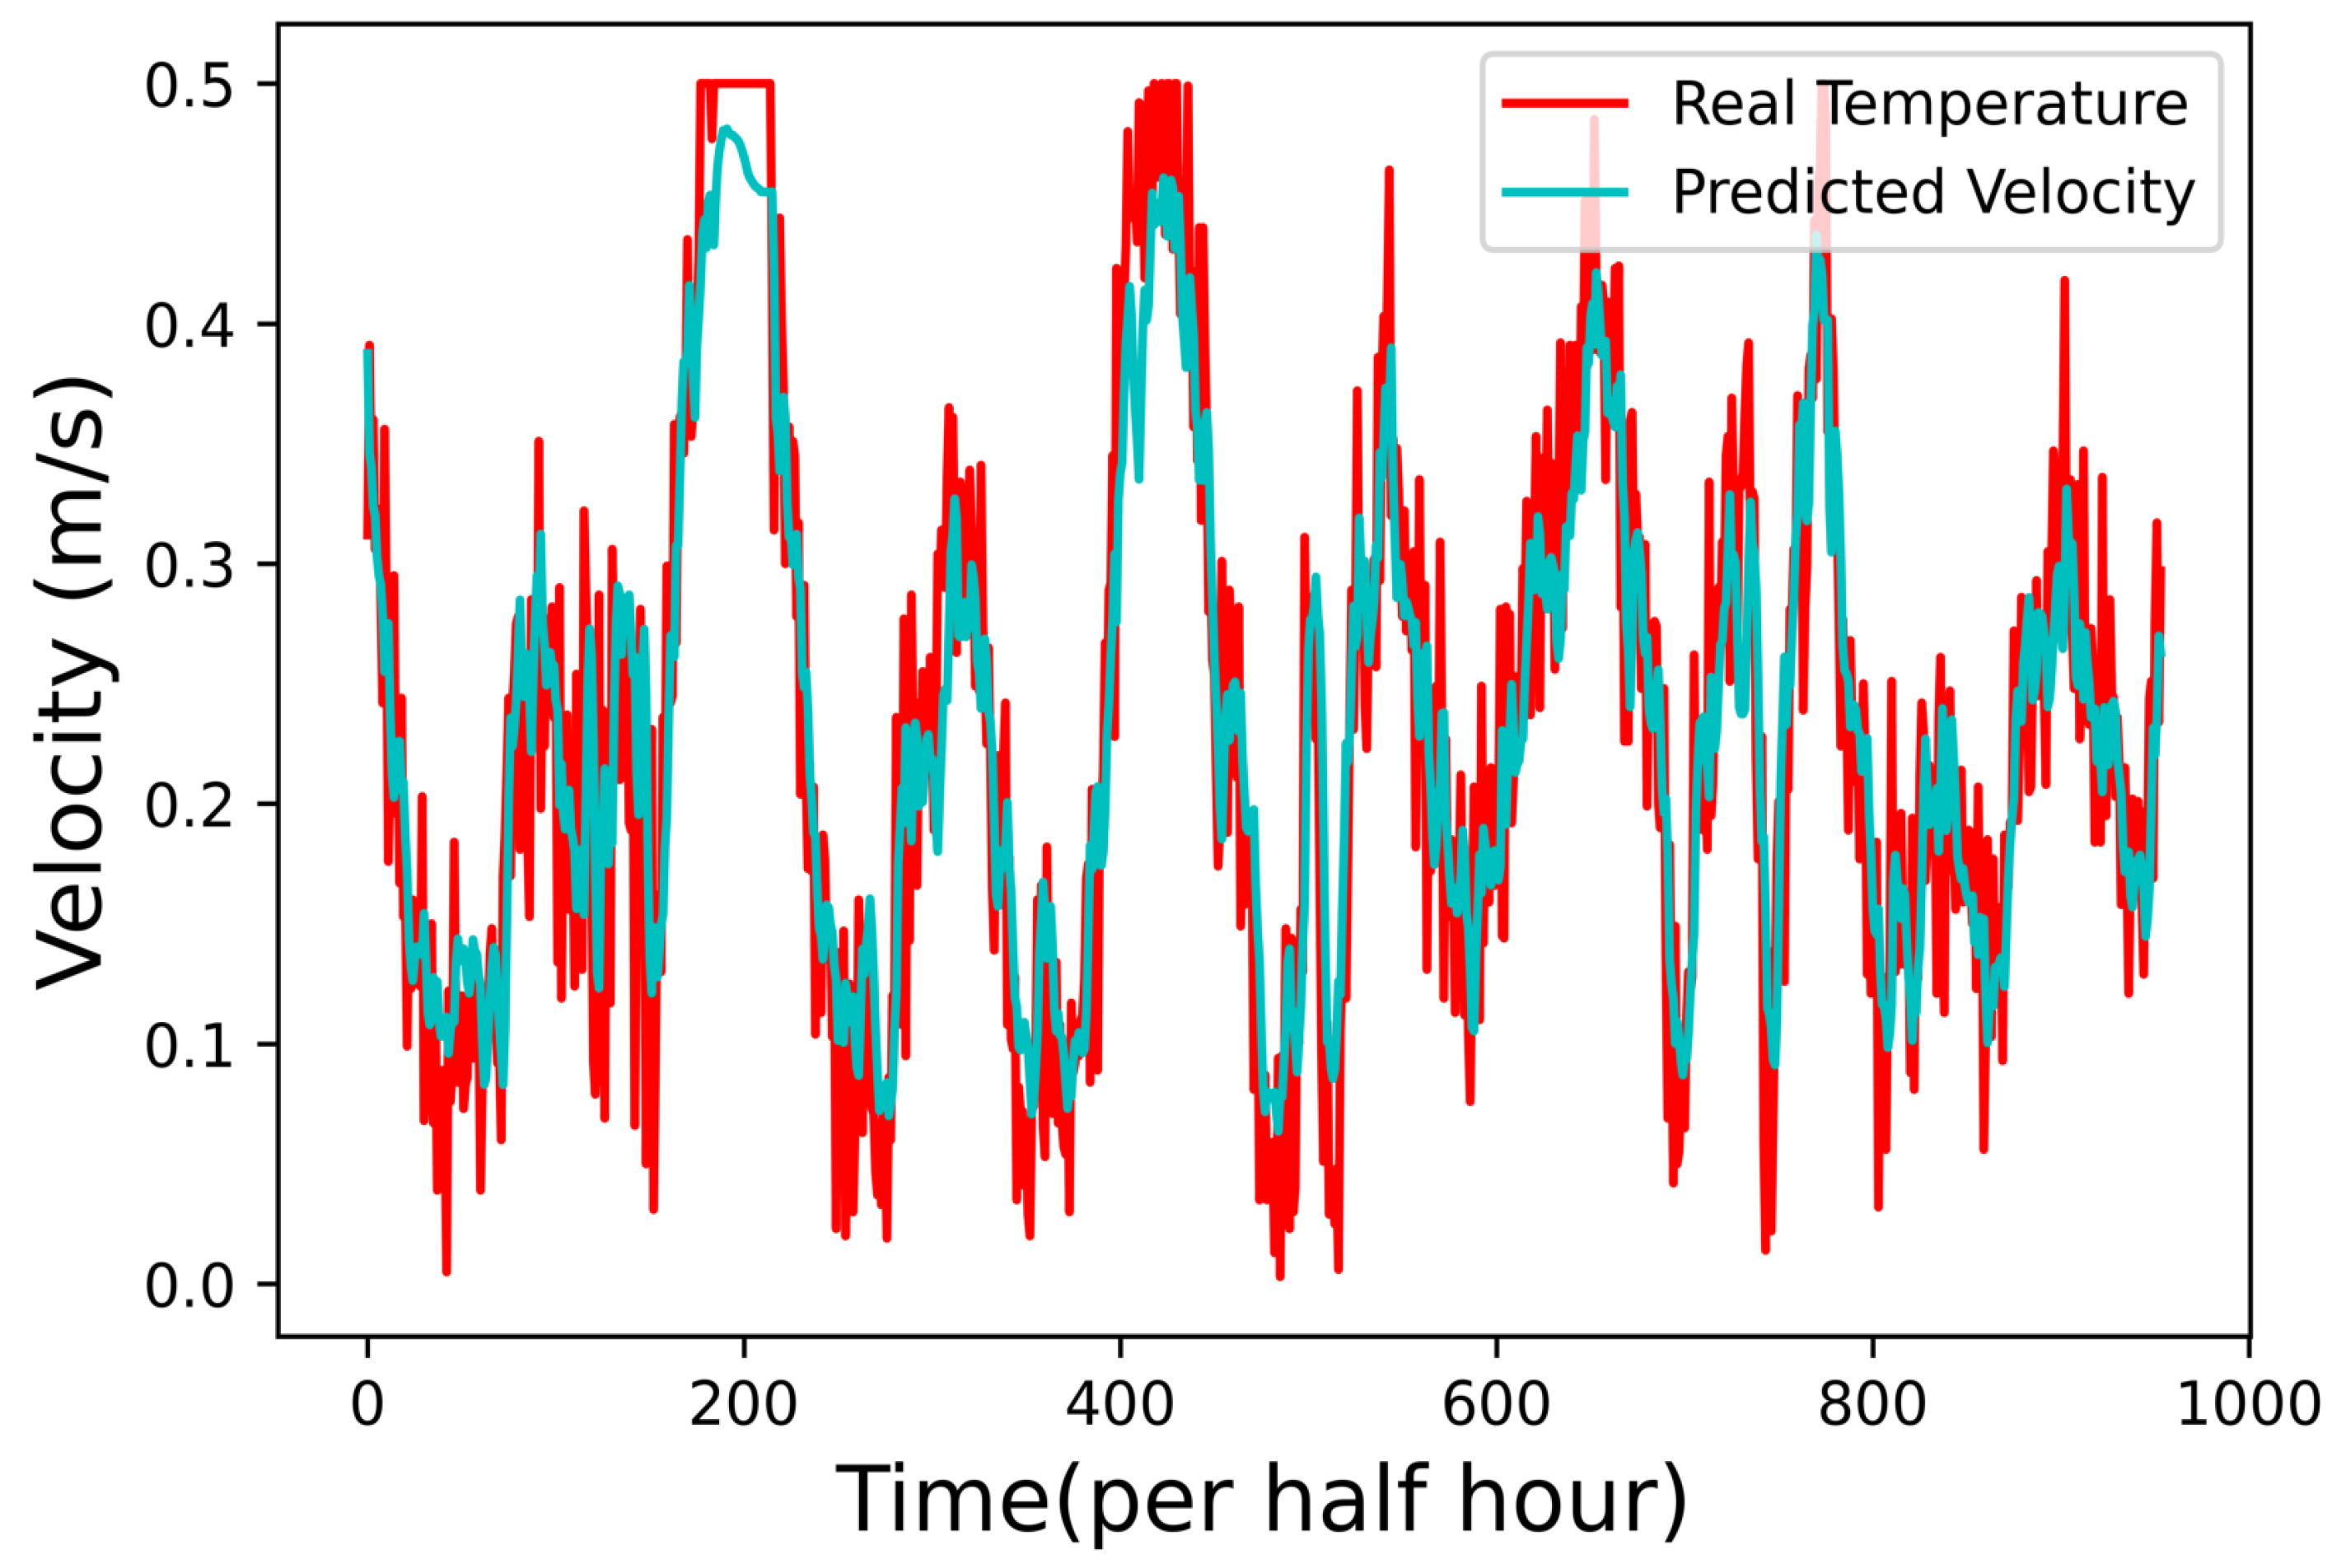
4.2. Prediction Results for Water Velocity
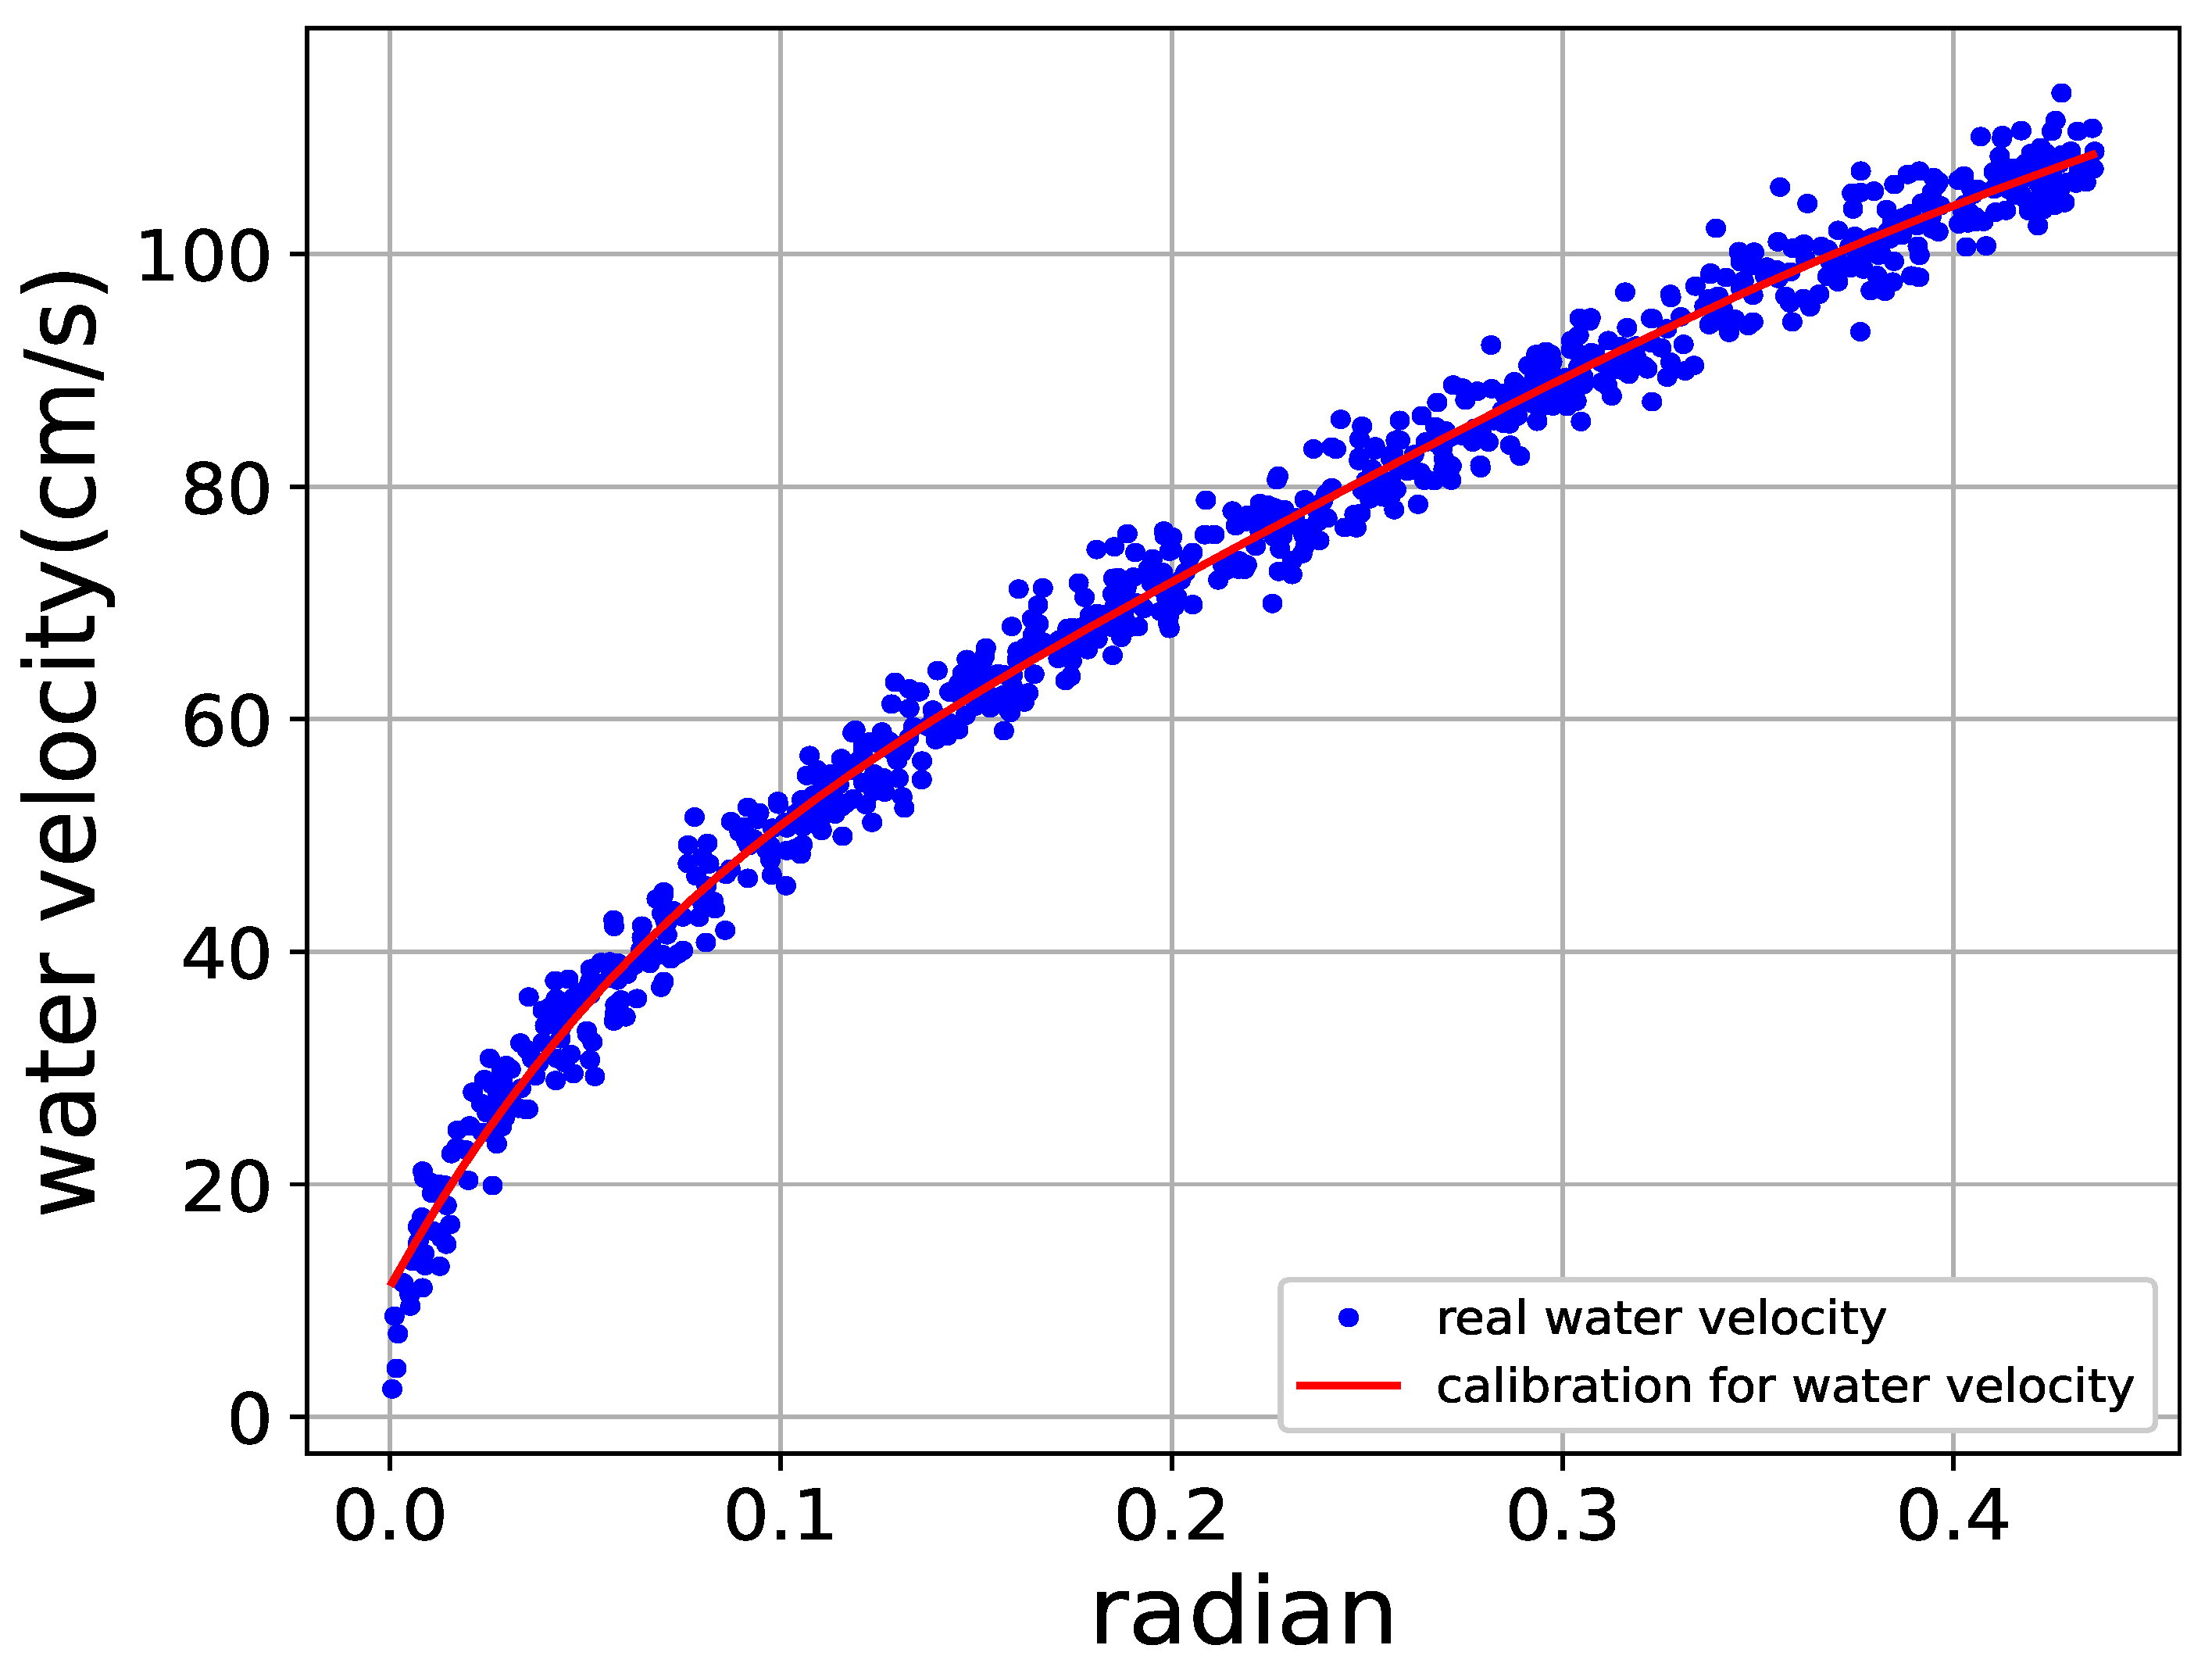
4.3. Nonlinear Regression for Water Velocity Versus Accelerometer’S Depletion Angles
5. Implementation Results and Discussions
6. Conclusions
7. Patents
Author Contributions
Funding
Conflicts of Interest
References
- Berlie, A.B. Global warming: A review of the debates on the causes, consequences and politics of global response. Ghana J. Geogr. 2018, 10, 144–164. [Google Scholar]
- Shukla, P.R.; Buendia, E.C.; Delmotte, V.M.; Zhai, P.; Pörtner, H.O.; Roberts, D.; Skea, J.; Slade, R.; Connors, S.; Diemen, R.V.; et al. Climate change and land, an IPCC special report on climate change, desertification, land degradation, sustainable sand Management, food Security, and greenhouse gas fluxes in terrestrial ecosystems. In Proceedings of the Intergovernmental Panel on Climate Change (IPCC), Geneva, Switzerland, 2 August 2019. [Google Scholar]
- Bardey, D.J. Overfishing: Pressure on our oceans. Res. Agric. Livest. Fish. 2019, 6, 397–404. [Google Scholar] [CrossRef]
- Ellitott, J.E.; Ellitott, K.H. Tracking marine pollution. Science 2013, 340, 556–558. [Google Scholar] [CrossRef] [PubMed]
- Willis, K.A.; Serra-Gonçalves, C.; Richardson, K.; Schuyler, Q.A.; Pedersen, H.; Anderson, K.; Stark, J.S.; Vince, J.; Hardesty, B.D.; Wilcox, C.; et al. Cleaner seas: Reducing marine pollution. Rev. Fish Biol. Fish. 2022, 32, 145–160. [Google Scholar] [CrossRef]
- Grappi, S.; Romani, S.; Barbarossa, G. Fashion without pollution: How consumers evaluate brands after an NGO campaign aimed at reducing toxic chemicals in the fashion industry. J. Clean. Prod. 2017, 149, 1164–1173. [Google Scholar] [CrossRef] [Green Version]
- Mustapha, U.F.; Alhassan, A.-W.; Jiang, D.-N.; Li, G. Sustainable aquaculture development: A review on the roles of cloud computing, internet of things and artificial intelligence. Rev. Aquac. 2021, 58, 788–799. [Google Scholar] [CrossRef]
- Naylor, R.L.; Hardy, R.W.; Buschmann, A.H.; Bush, S.R.; Cao, L.; Klinger, D.H.; Little, D.C.; Lubchenco, J.; Shumway, S.E.; Troell, M. A 20-year retrospective review of global aquaculture. Nature 2021, 591, 551–563. [Google Scholar] [CrossRef]
- Kibenge, F.S.B. Emerging viruses in aquaculture. Curr. Virol. 2019, 34, 97–103. [Google Scholar] [CrossRef]
- Garlock, T.; Asche, F.; Anderson, J.; Bjørndal, J.; Kumar, G.; Lorenzen, K.; Ropicki, A.; Smith, M.D.; Tveterås, R. A global blue revolution: Aquaculture growth across regions, species, and countries. Rev. Fish. Sci. Aquac. 2020, 28, 107–116. [Google Scholar] [CrossRef]
- Lu, H.Y.; Cheng, C.Y.; Cheng, S.; Lo, W.; Cheng, Y.; Nan, F.; Chang, S. A low-cost buoy system with artificial intelligence (AI) for offshore aquaculture. In Proceedings of the 2021 International Symposium on Intelligent Signal Processing and Communication Systems (ISPACS), Hualien, Taiwan, 16–19 November 2021. [Google Scholar]
- Nam, H.; An, S.; Kim, C.H.; Park, S.H.; Kim, Y.W.; Lim, S.H. Remote monitoring system based on ocean sensor networks for offshore aquaculture. In Proceedings of the 2014 Oceans, St. John’s, NL, Canada, 14–19 September 2014. [Google Scholar]
- Cao, J.; Xu, L. Research on counting algorithm of residual feeds in aquaculture based on machine vision. In Proceedings of the 2018 3rd IEEE International Conference on Image, Vision and Computing, Auckland, New Zealand, 19–21 November 2018. [Google Scholar]
- Silva, M.S.; Cruz, N.A.; Lima, F.P. Remote supervision system for aquaculture platforms. In Proceedings of the OCEANS 2016 MTS/IEEE Monterey, Monterey, CA, USA, 19–23 September 2016. [Google Scholar]
- Dupont, C.; Cousin, P.; Dupont, S. IoT for aquaculture 4.0 smart and easy-to-deploy real-time water monitoring with IoT. In Proceedings of the 2018 Global Internet of Things Summit, Bilbao, Spain, 4–7 June 2018. [Google Scholar]
- Chiani, M.; Elzanaty, A. On the LoRa modulation for IoT: Waveform properties and spectral analysis. IEEE Internet Things J. 2019, 6, 8463–8470. [Google Scholar] [CrossRef] [Green Version]
- Ma, Y.; Ding, W. Design of intelligent monitoring system for aquaculture water dissolved oxygen. In Proceedings of the 2018 IEEE 3rd Advanced Information Technology, Electronic and Automation Control Conference, Chongqing, China, 12–14 October 2018. [Google Scholar]
- Abinaya, T.; Ishwarya, J.; Maheswari, M. A novel methodology for monitoring and controlling of water quality in aquaculture using Internet of things (IoT). In Proceedings of the 2019 International Conference on Computer Communication and Informatics, Coimbatore, India, 23–25 January 2019. [Google Scholar]
- Luna, F.D.V.B.; Aguilar, E.D.L.R.; Naranjo, J.S.; Jagüey, J.G. Robotic system for automation of water quality monitoring and feeding in aquaculture shadehouse. IEEE Trans. Syst. Man, Cybern. Syst. 2017, 47, 1575–1589. [Google Scholar] [CrossRef]
- Eriegha, O.J.; Ekokotu, P.A. Factors affecting feed intake in cultured fish species: A review. Anim. Res. Int. 2017, 14, 2697–2709. [Google Scholar]
- Mizanur, R.M.; Yun, H.; Moniruzzaman, M.; Ferreira, F.; Kim, K.W.; Bai, S.C. Effects of feeding rate and water temperature on growth and body composition of Juvenile Korean Rockfish, Sebastes schlegeli. Asian-Australas J. Anim Sci. 2014, 27, 690–699. [Google Scholar] [CrossRef] [Green Version]
- Beveridge, M. Cage Aquaculture; John Wiley & Sons: Hoboken, NJ, USA, 2004. [Google Scholar]
- Jack, J.P.; Abdsalam, A.T.; Khalifa, N.S. Assessment of dissolved oxygen in coastal waters of Benghazi, Libya. Black Sea/Mediterranean Environ. 2009, 15, 135–156. [Google Scholar]
- Tran-Duy, A.; Schrama, J.W.; Dam, A.A.V.; Veffeth, J.A.J. Effects of oxygen concentration and body weight on maximum feed intake, growth and hematological parameters of Nile tilapia, Oreochromis niloticus. Aquaculture 2008, 275, 152–162. [Google Scholar] [CrossRef]
- Luo, H.; Li, G.; Peng, W.; Jie, S.; Bai, Q. Real-time remote monitoring system for aquaculture water quality. Int. J. Agric. Biol. Eng. 2015, 8, 136–143. [Google Scholar]
- Yang, P.Y.; Tsai, J.T.; Chou, J.H.; Ho, W.H.; Lai, Y.Y. Prediction of water quality evaluation for fish ponds of aquaculture. In Proceedings of the SICE Annual Conference, Kanazawa, Japan, 19–22 September 2017. [Google Scholar]
- Defe, G.A.; Antonio, A.Z.C. Multi-parameter Water Quality monitoring device for grouper aquaculture. In Proceedings of the IEEE International Conference on Humanoid, Nanotechnology, Information Technology, Communication and Control, Environment and Management, Baguio City, Philippines, 29 November–2 December 2018. [Google Scholar]
- Cheng, C.Y.; Chang, C.C.; Lu, H.Y.; Cheng, S.C.; Nan, F.H.; Tang, C.S.; Hua, Z.W.; Lin, W.Y.; Yu, H.J. Design of a feeding system for cage aquaculture based on IoT and AI Technology. In Proceedings of the International Symposium on Intelligent Signal Processing and Communication Systems, Hualien, Taiwan, 16–19 November 2021. [Google Scholar]
- Raju, K.; Varma, G. Knowledge based real Time monitoring system for aquaculture using IoT. In Proceedings of the 2017 IEEE 7th International Advance Computing Conference, Hyderabad, India, 5–7 January 2017. [Google Scholar]
- Sosa, G.S.; Abril, J.S.; Sosa, J.; Montiel-Nelson, J.-A.; Bautista, T. Design of a practical underwater sensor network for offshore fish farm cages. Sensors 2020, 20, 4459. [Google Scholar] [CrossRef]
- Parra, L.; Sendra, S.; Garciia, L.; Lloret, J. Design and deployment of low-cost sensors for monitoring the water quality and fish behavior in aquaculture tanks during the feeding Process. Sensors 2018, 18, 750. [Google Scholar] [CrossRef] [Green Version]
- Marchant, R.; Stevens, T.; Choukroun, S.; Coombes, G.; Santarossa, M.; Whinney, J.; Ridd, P. A buoyant tethered sphere for marine current estimation. IEEE J. Ocean. Eng. 2014, 39, 2–9. [Google Scholar] [CrossRef]
- Beddows, P.A.; Mallon, E.K. Cave pearl data Logger: A flexible arduino-based logging platform for long-term monitoring in harsh environments. Sensors 2018, 18, 530. [Google Scholar] [CrossRef] [Green Version]
- Foukalas, F.; Tziouvaras, A. Edge artificial intelligence for industrial internet of things applications: An industrial edge intelligence solution. IEEE Ind. Electron. Mag. 2021, 15, 28–36. [Google Scholar] [CrossRef]
- Mao, B.; Tang, F.; Kawamoto, Y.; Kato, N. AI models for green communications towards 6G. IEEE Commun. Surveys Tuts. 2022, 24, 210–247. [Google Scholar] [CrossRef]
- Liu, C.-H.; Chen, Z.; Tang, J.; Xu, J.; Piao, C. Energy-efficient UAV control for effective and fair communication coverage: A deep reinforcement learning approach. IEEE J. Sel. Areas Commun. 2018, 36, 2059–2070. [Google Scholar] [CrossRef]
- Zhang, C.; Dong, M.; Ota, K. Employ AI to improve AI services: Q-Learning based holistic traffic control for distributed co-inference in deep learning. IEEE Trans. Serv. Comput. 2022, 15, 627–639. [Google Scholar] [CrossRef]
- Monge-Quevedo, A.; Sandoval-Bringas, J.A.; Carreño-León, M.A.; León, D.P.C. Aquaculture 4.0 is the digital revolution that is not coming to the little Mexican farmers. In Proceedings of the 2021 4th International Conference on Inclusive Technology and Education (CONTIE), La Paz, Mexico, 27–29 October 2021. [Google Scholar]
- Luger, G.; Stubblefield, W. Artificial Intelligence: Structures and Strategies for Complex Problem Solving; Pearson Education: Boston, MA, USA, 2009. [Google Scholar]
- Marais, H. RS-485/RS-422 Circuit Implementation Guide. Analog. Devices Appl. Note. 2018. Available online: https://www.analog.com/media/en/technical-documentation/application-notes/an-960.pdf (accessed on 25 April 2022).
- Hochreiter, S.; Schmidhuber, J. Long short-term memory. Neural Comput. 1997, 9, 1735–1780. [Google Scholar] [CrossRef]
- LeCun, Y.; Bengio, Y.; Hinton, G. Deep learning. Nature 2015, 521, 436–444. [Google Scholar] [CrossRef]


Publisher’s Note: MDPI stays neutral with regard to jurisdictional claims in published maps and institutional affiliations. |
© 2022 by the authors. Licensee MDPI, Basel, Switzerland. This article is an open access article distributed under the terms and conditions of the Creative Commons Attribution (CC BY) license (https://creativecommons.org/licenses/by/4.0/).
Share and Cite
Lu, H.-Y.; Cheng, C.-Y.; Cheng, S.-C.; Cheng, Y.-H.; Lo, W.-C.; Jiang, W.-L.; Nan, F.-H.; Chang, S.-H.; Ubina, N.A. A Low-Cost AI Buoy System for Monitoring Water Quality at Offshore Aquaculture Cages. Sensors 2022, 22, 4078. https://0-doi-org.brum.beds.ac.uk/10.3390/s22114078
Lu H-Y, Cheng C-Y, Cheng S-C, Cheng Y-H, Lo W-C, Jiang W-L, Nan F-H, Chang S-H, Ubina NA. A Low-Cost AI Buoy System for Monitoring Water Quality at Offshore Aquaculture Cages. Sensors. 2022; 22(11):4078. https://0-doi-org.brum.beds.ac.uk/10.3390/s22114078
Chicago/Turabian StyleLu, Hoang-Yang, Chih-Yung Cheng, Shyi-Chyi Cheng, Yu-Hao Cheng, Wen-Chen Lo, Wei-Lin Jiang, Fan-Hua Nan, Shun-Hsyung Chang, and Naomi A. Ubina. 2022. "A Low-Cost AI Buoy System for Monitoring Water Quality at Offshore Aquaculture Cages" Sensors 22, no. 11: 4078. https://0-doi-org.brum.beds.ac.uk/10.3390/s22114078