
Data Compression in the NEXT-100 Data Acquisition System

 , and
, and
Abstract
:1. Introduction
1.1. Introduction to NEXT Detectors
1.2. Motivation
1.3. Considerations
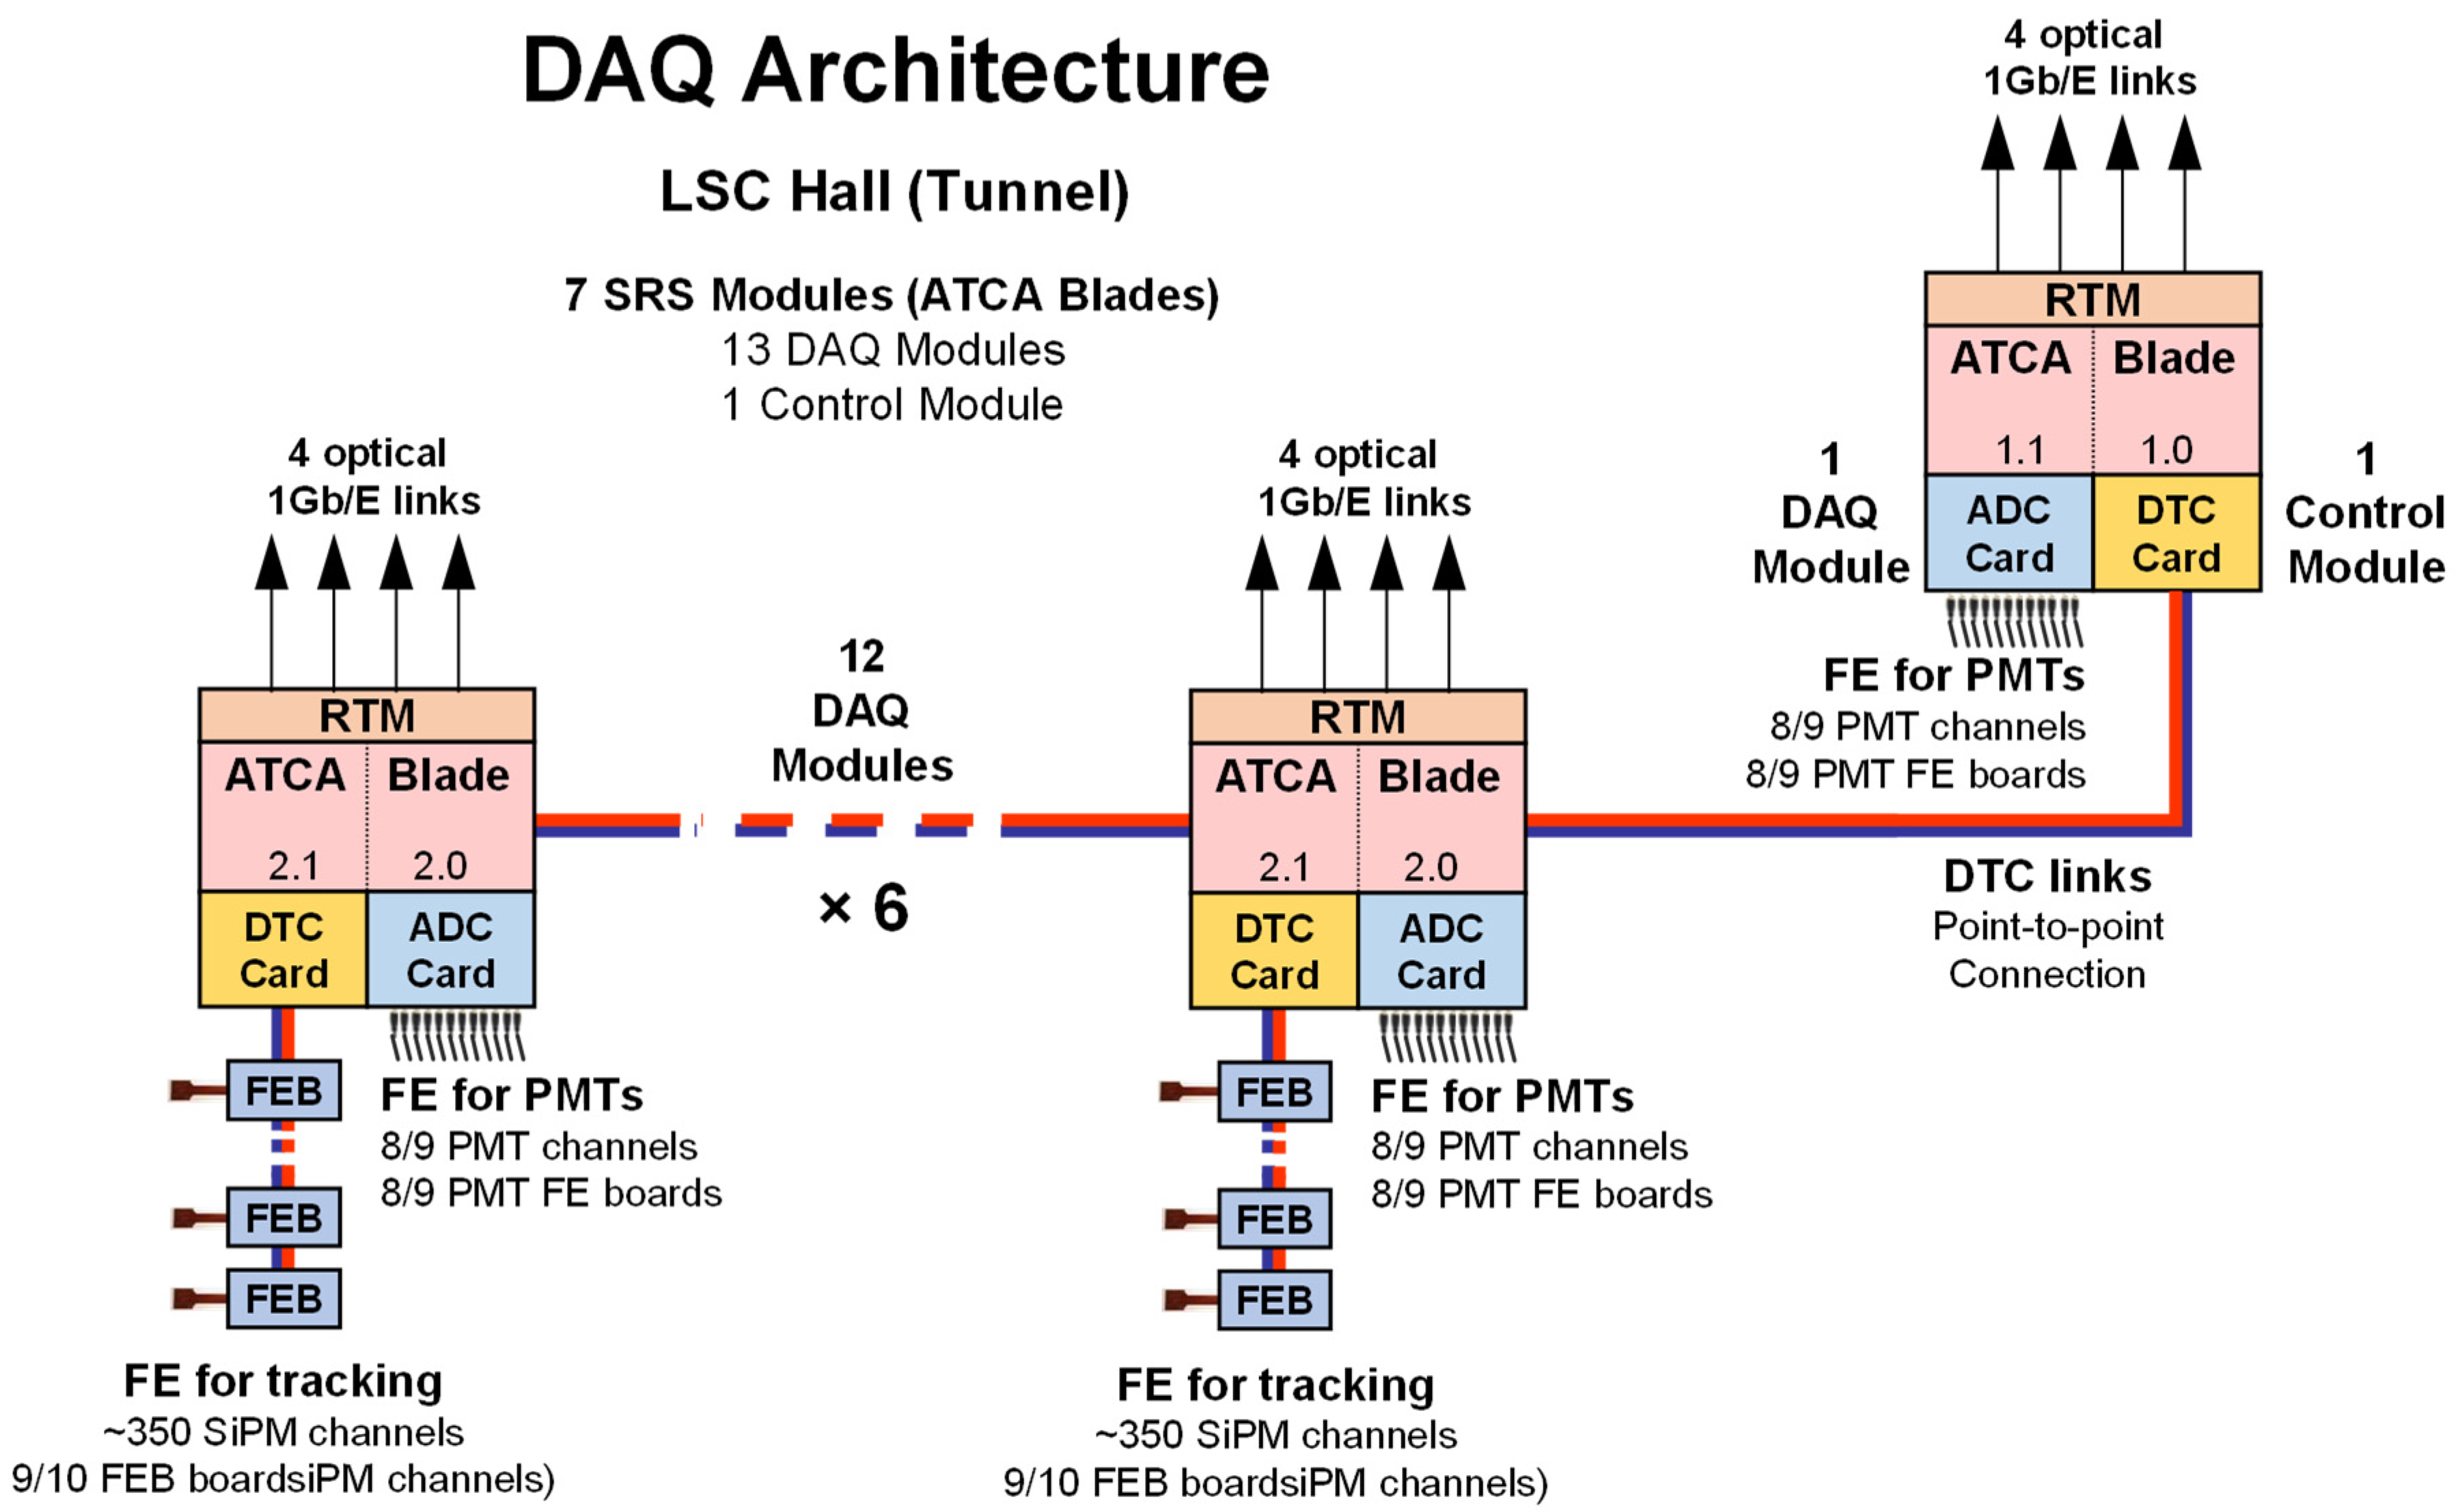
- Limited hardware resources.The available DAQ resources are limited since the algorithm must be implemented using existing FPGA devices that are already used to read out detector data. The compression module must be implemented with minimum hardware resources. On the one hand, this implies keeping the algorithm as simple as possible. On the other hand, it is desirable to have the algorithm uncorrelated from the number of sensors to be processed, avoiding parallelizing the module or parts of it, if possible. It is important to remark that the detector, at least in the TP, has a very large number of sensors to read out per DAQ Module (up to 768 sensors). Related to this, module placement in the data chain for both sensor planes could have a considerable impact on the hardware resources needed, so this must also be carefully studied.
- High compression ratio.Different algorithms accomplishing statement one must be studied to select the best option with a minimum, but high, compression ratio. As stated in Section 1.2, the event data load estimated due to the calibration process will be in the range of 920 to 1520 MB/s, while the maximum system throughput will be about 875 MB/s. A minimum reduction factor of 2 is needed, but a better compression ratio will help to reduce dead time since its value is related to the data acquisition system throughput.
2. NEXT-100 Data Acquisition and Event Detection Systems
2.1. Hardware Architecture
2.2. System Architecture
3. Data Compression in Physics Experiments
4. Data Compression Techniques
4.1. Introduction
4.2. Lossy Compression Techniques
4.3. Lossless Compression Techniques
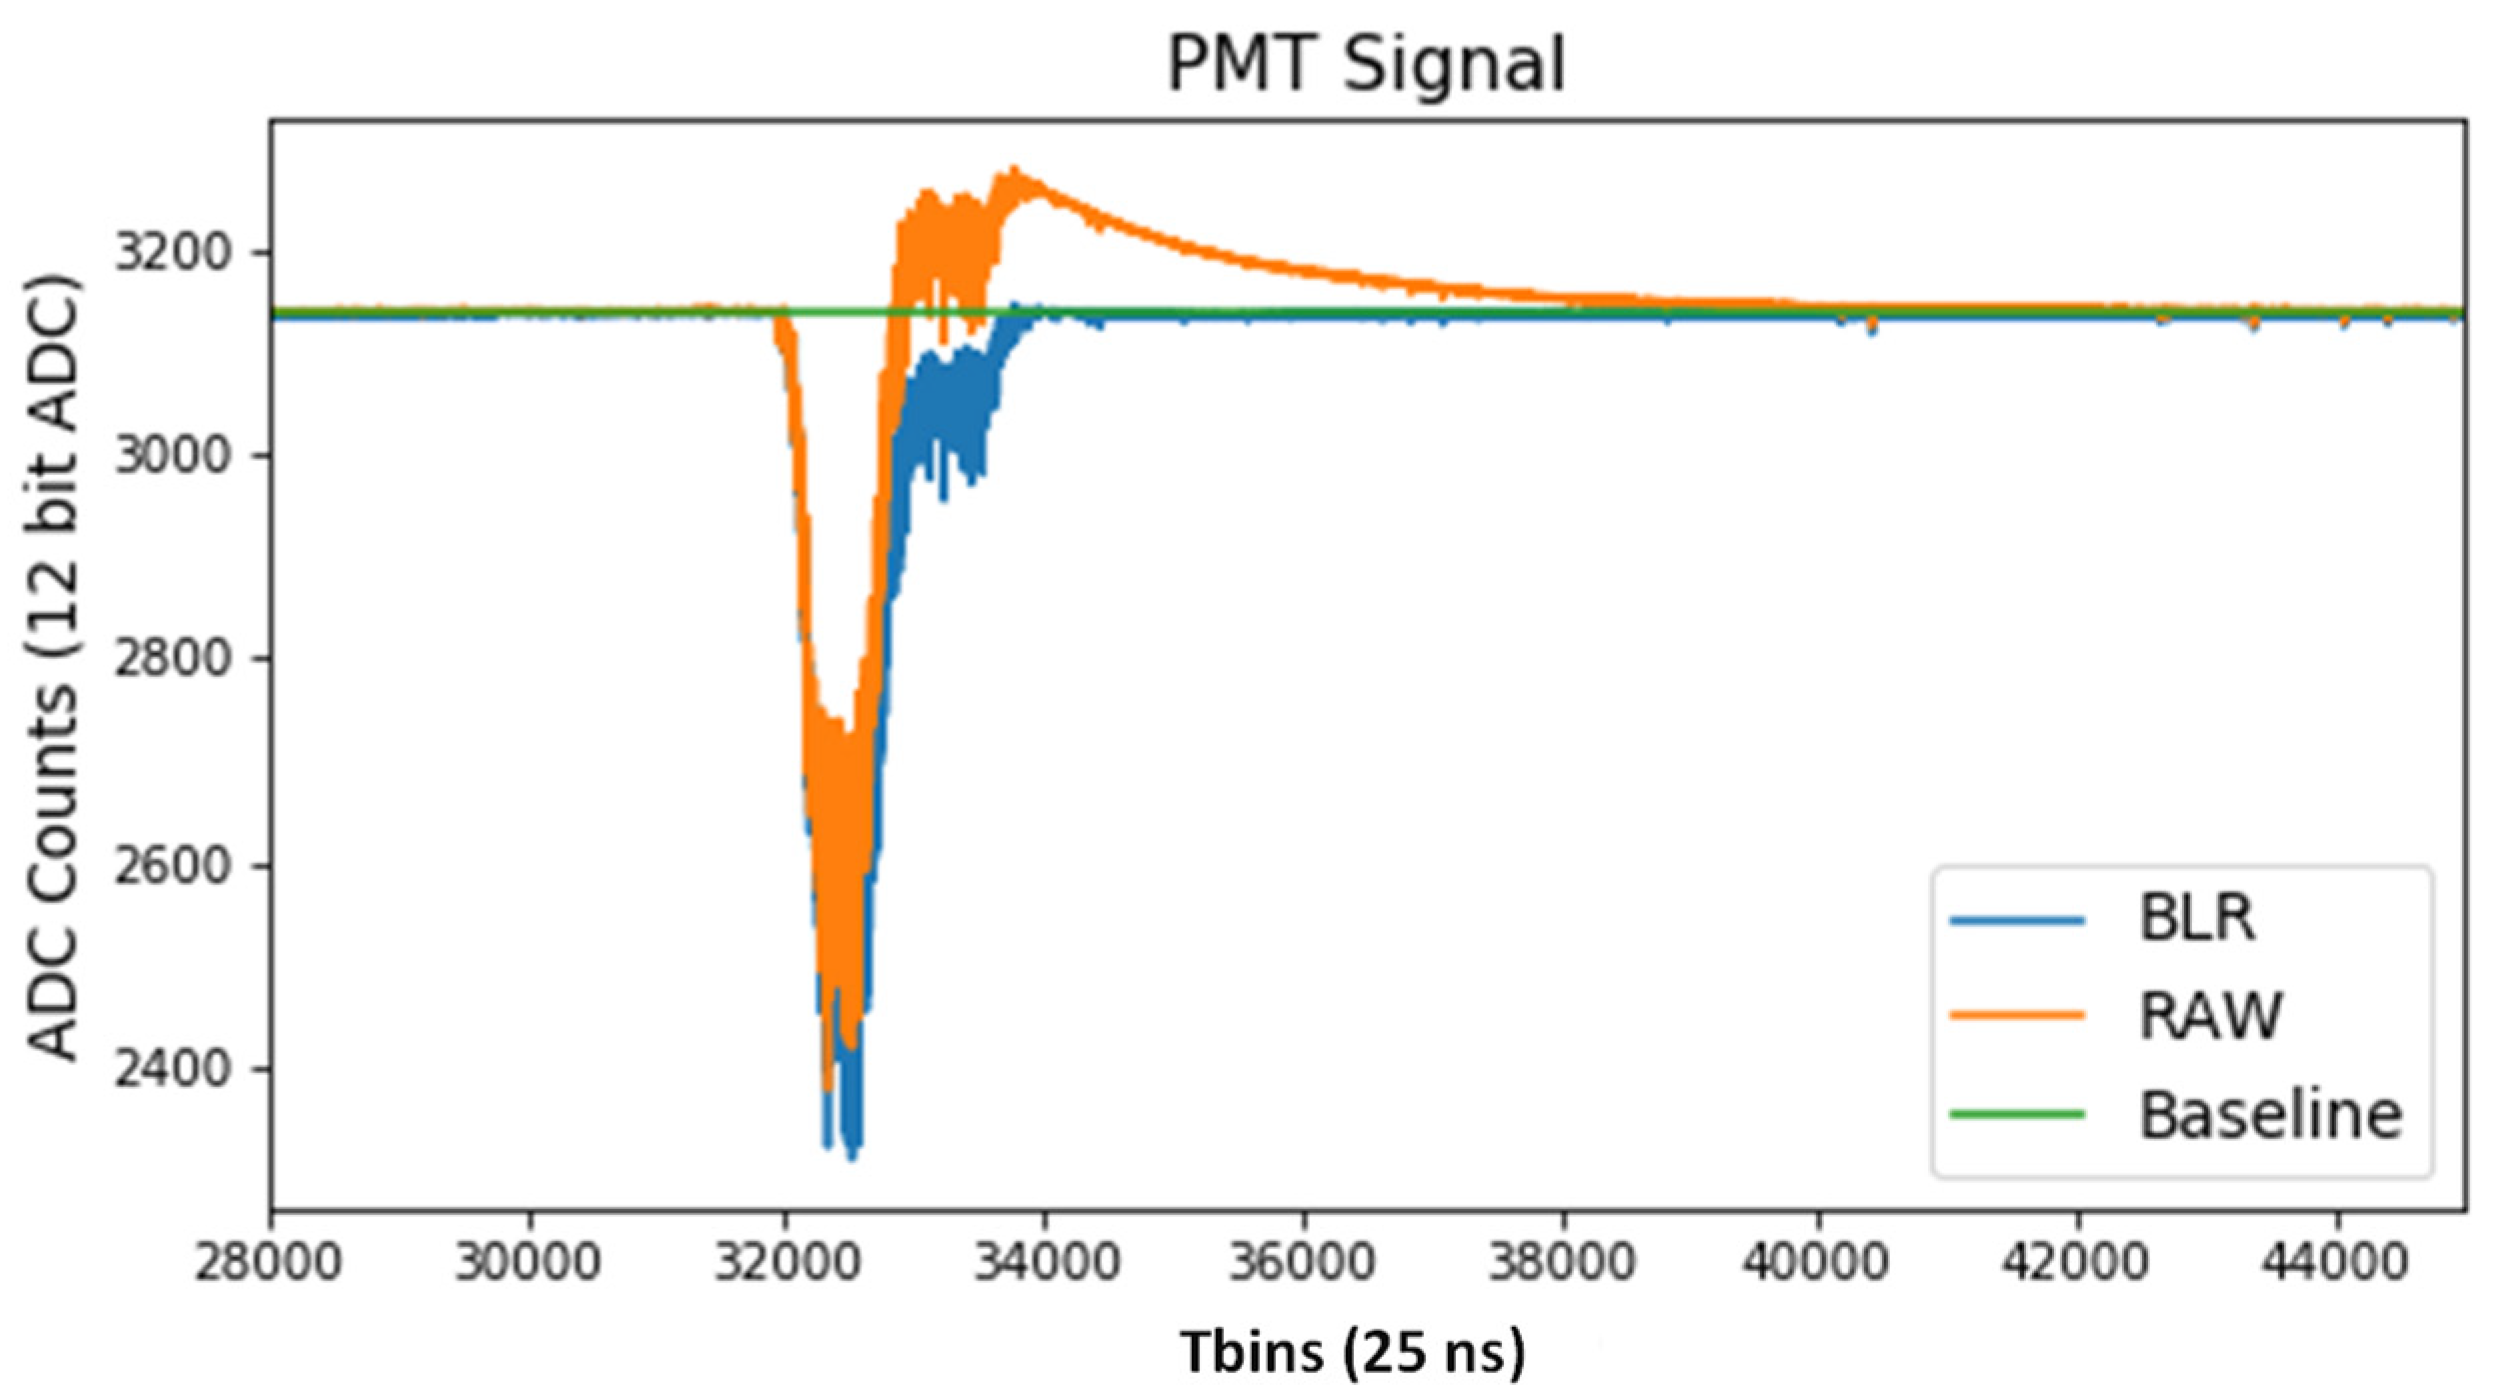
4.4. Signal Conditioning
5. NEXT Experiment Data Compression Study
5.1. Lossy Data Compression Review
5.2. Lossless Data Compression Study
- Baseline subtraction. In this case, the DC value of the signal is subtracted prior to compression.
- Delta encoding. In this case, delta encoding is applied prior to compression.
- Ca2. Data in the compression range are encoded by its two’s complement values with the minimum number of bits needed. This codification is direct and very simple.
- Sensor ref + Ca2. Prior to encoding the data, reference sensor data (sent without compression) is subtracted from the rest of the sensor data. Then, case 1 is applied.
- RLE. The data are RLE encoded.
- Huffman. Data in the compression range are Huffman encoded. It requires the calculation of the Huffman tree to set the codes and their sizes in bits.
5.3. Conclusions
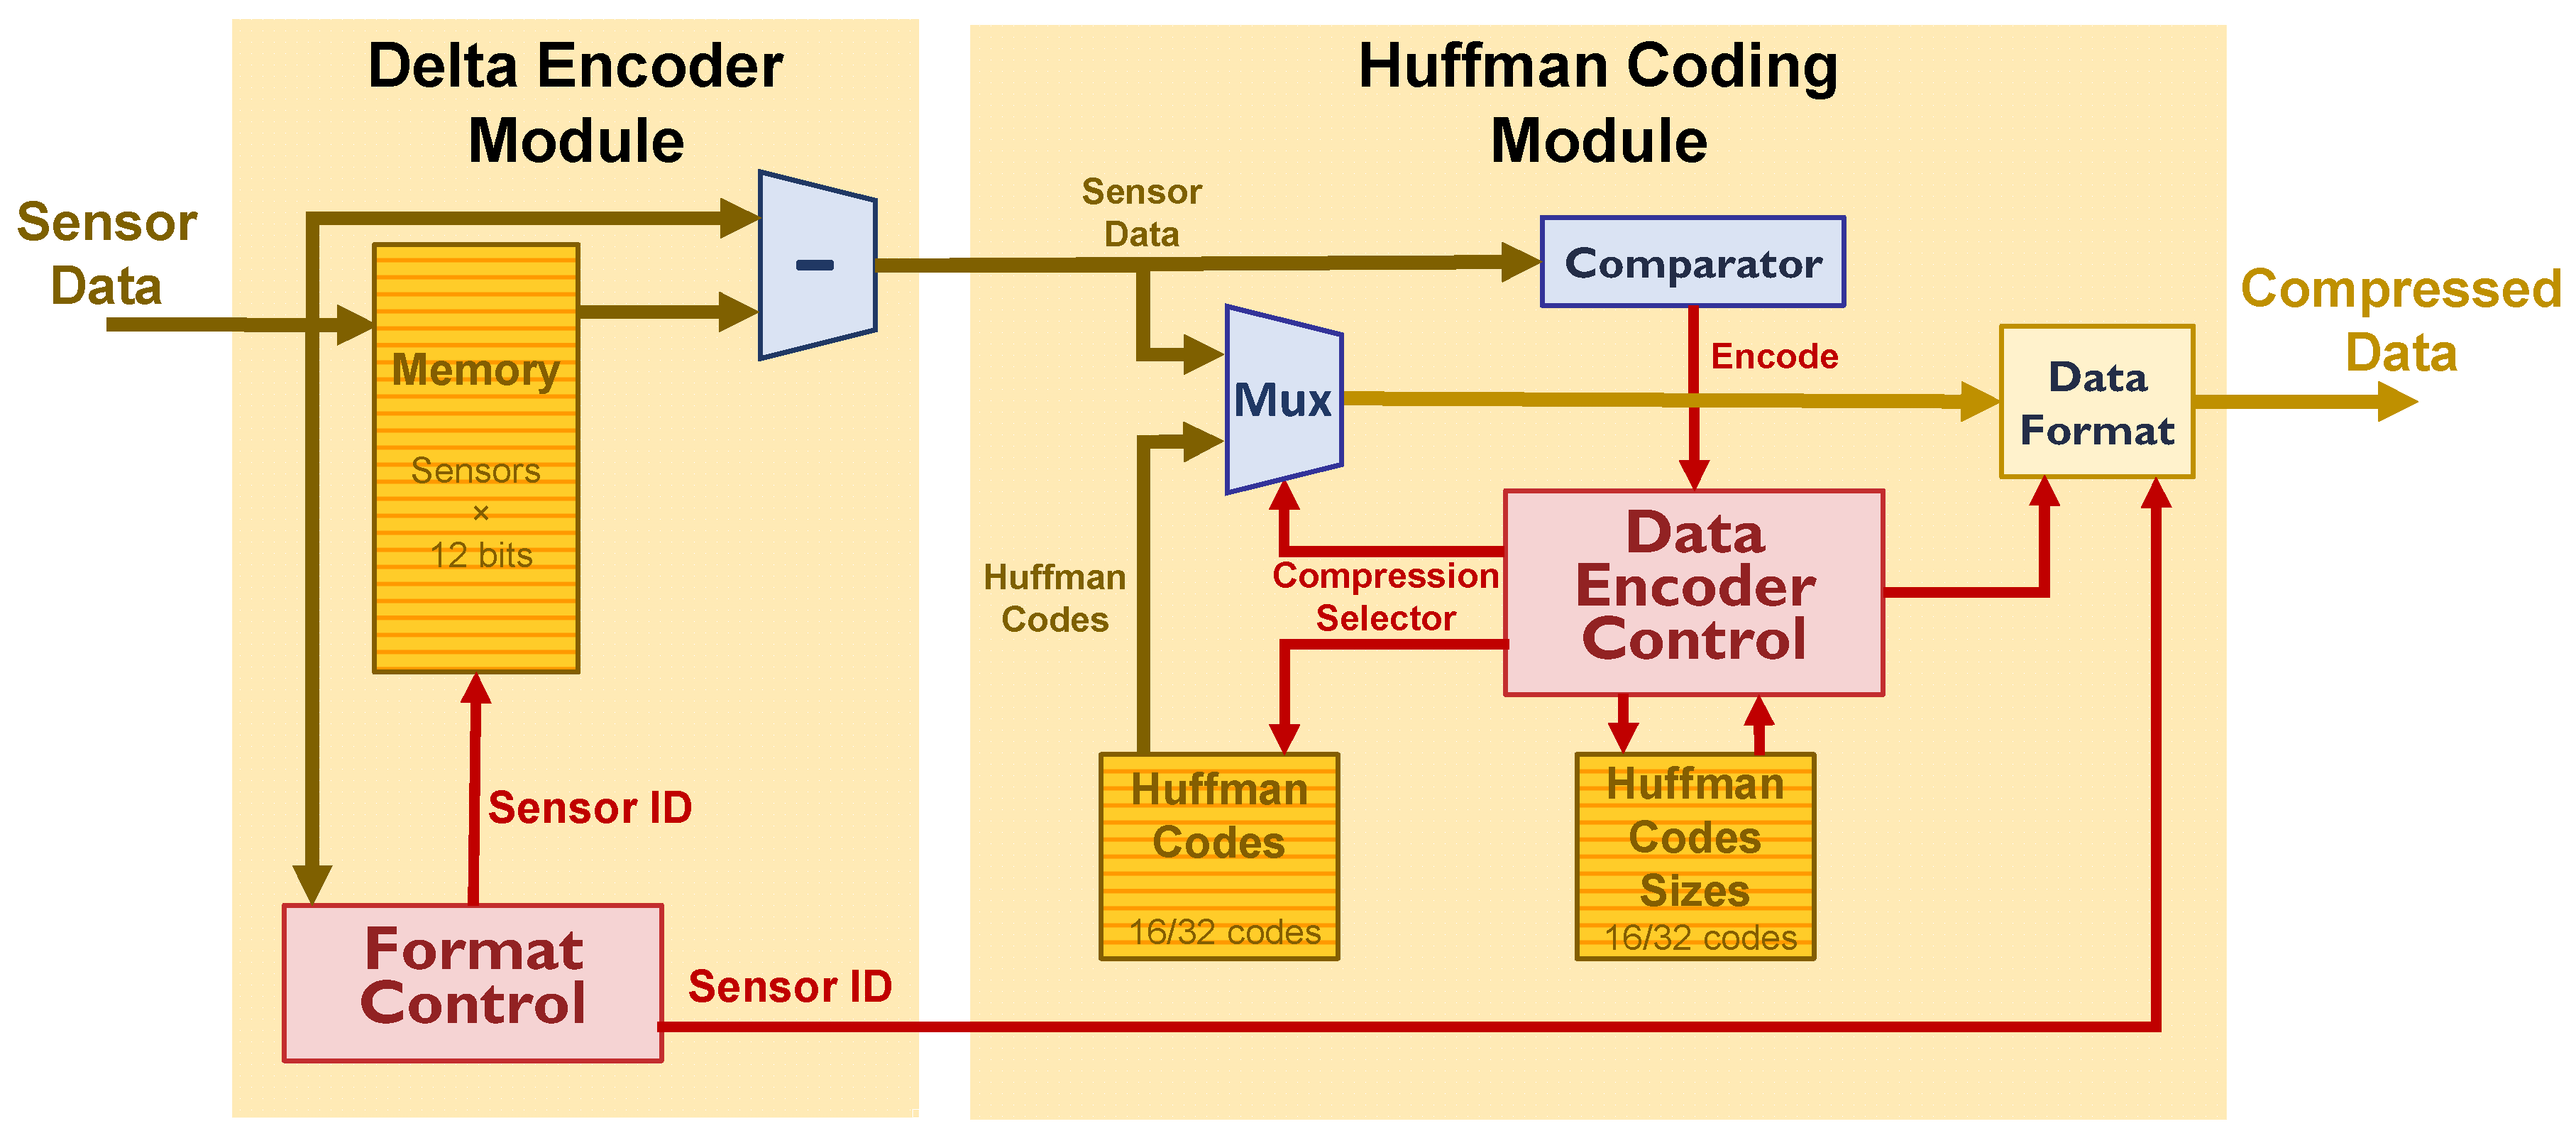
6. NEXT Experiments Huffman Coding Implementation
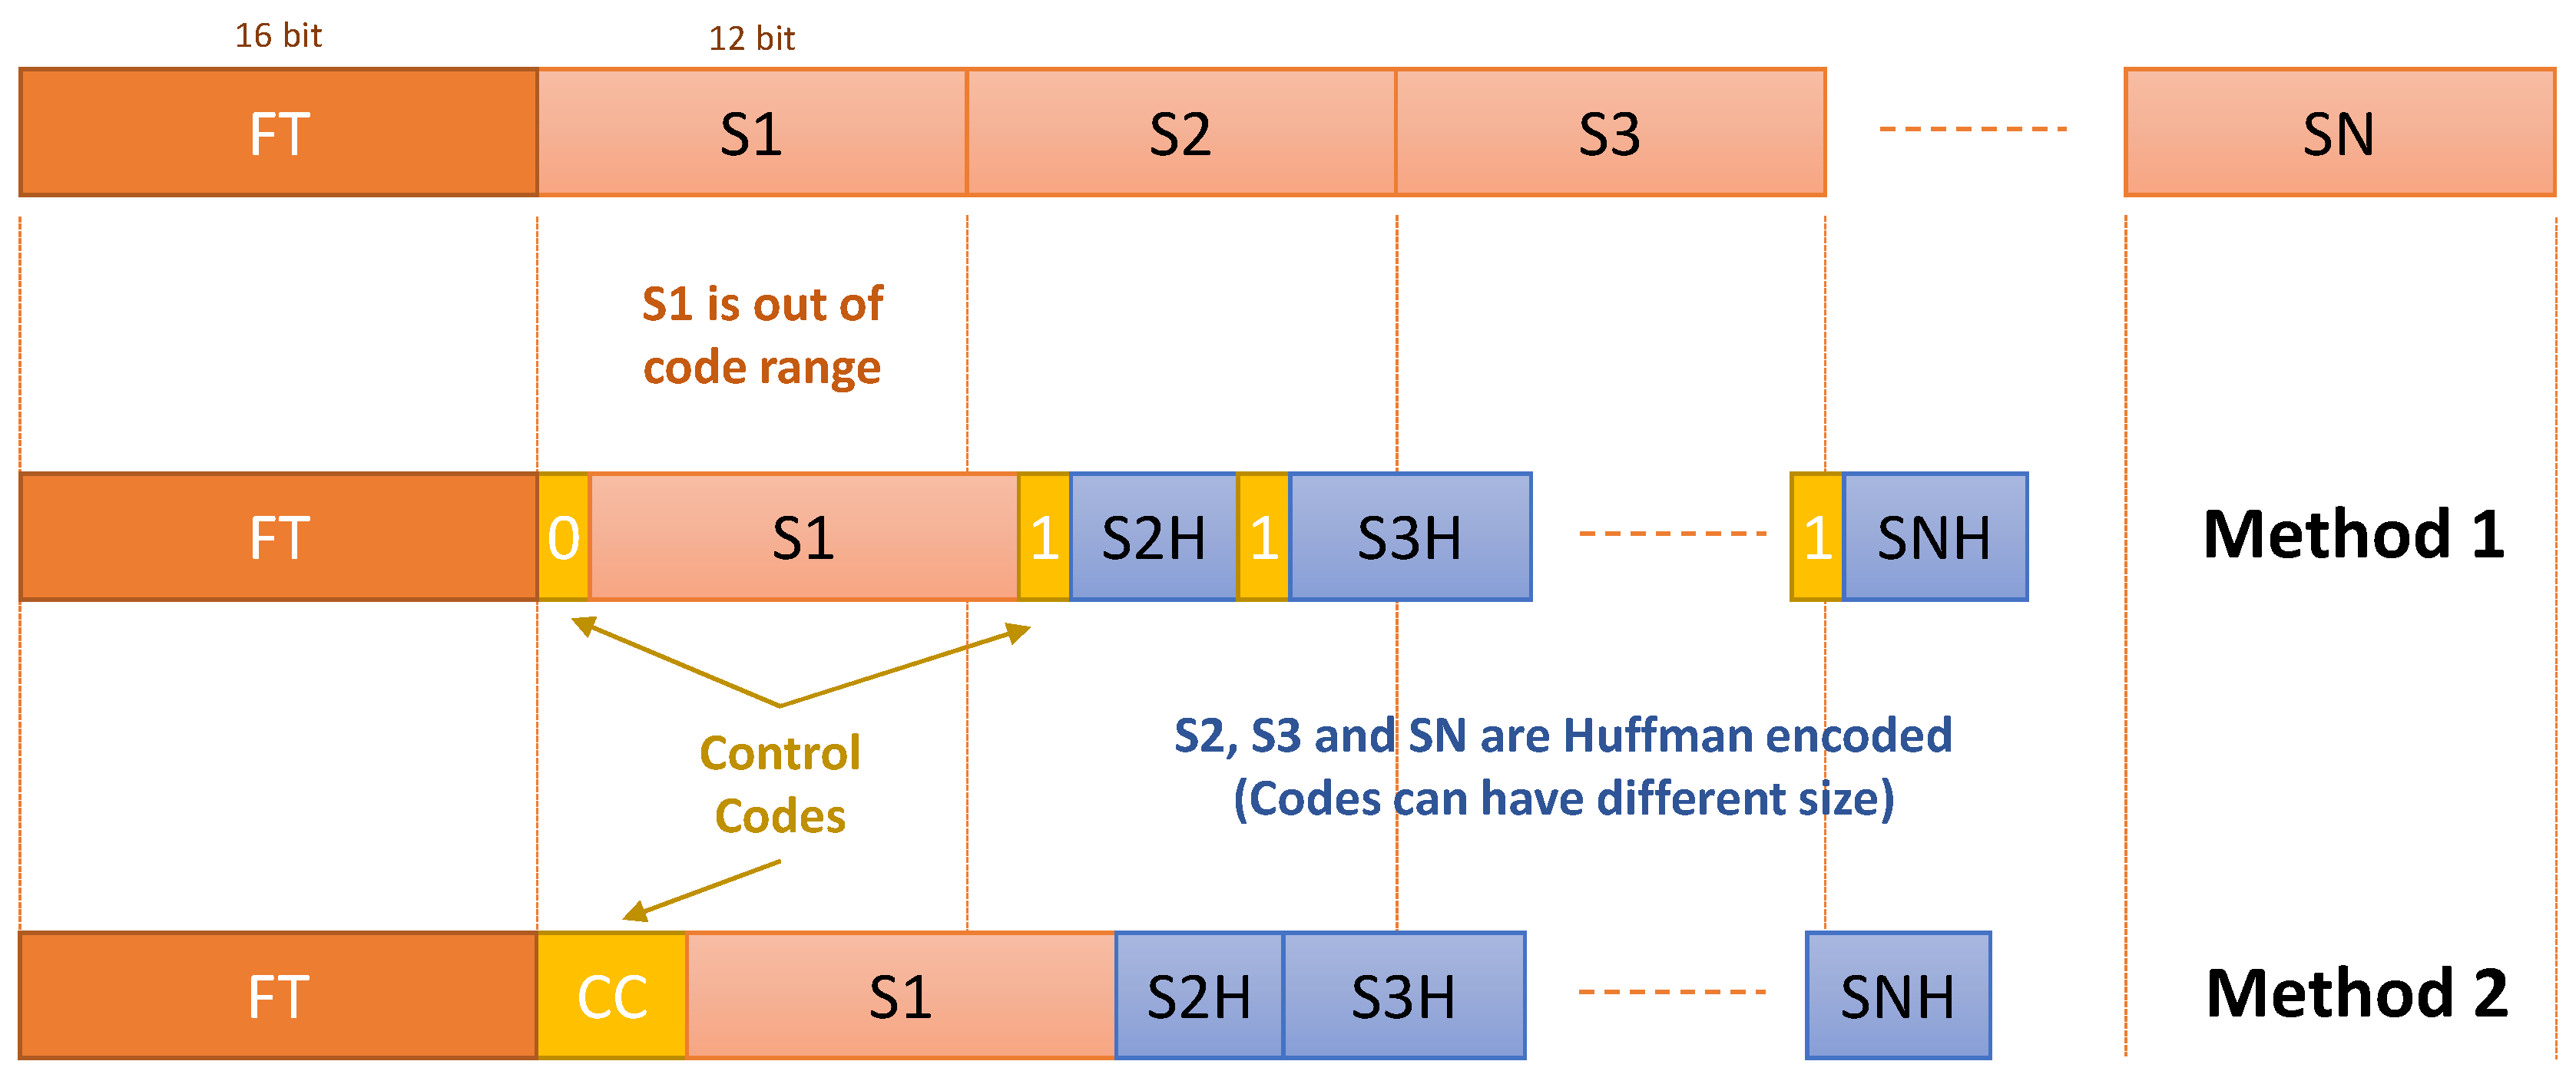
6.1. Control Codification
- Method 1. An additional control code of one bit is used to distinguish between encoded and non-encoded data.
- Method 2. Only non-encoded data are flagged. In this case, a non-used Huffman code can be used prior to sending the non-encoded data.
6.2. Huffman Encoding Implementation
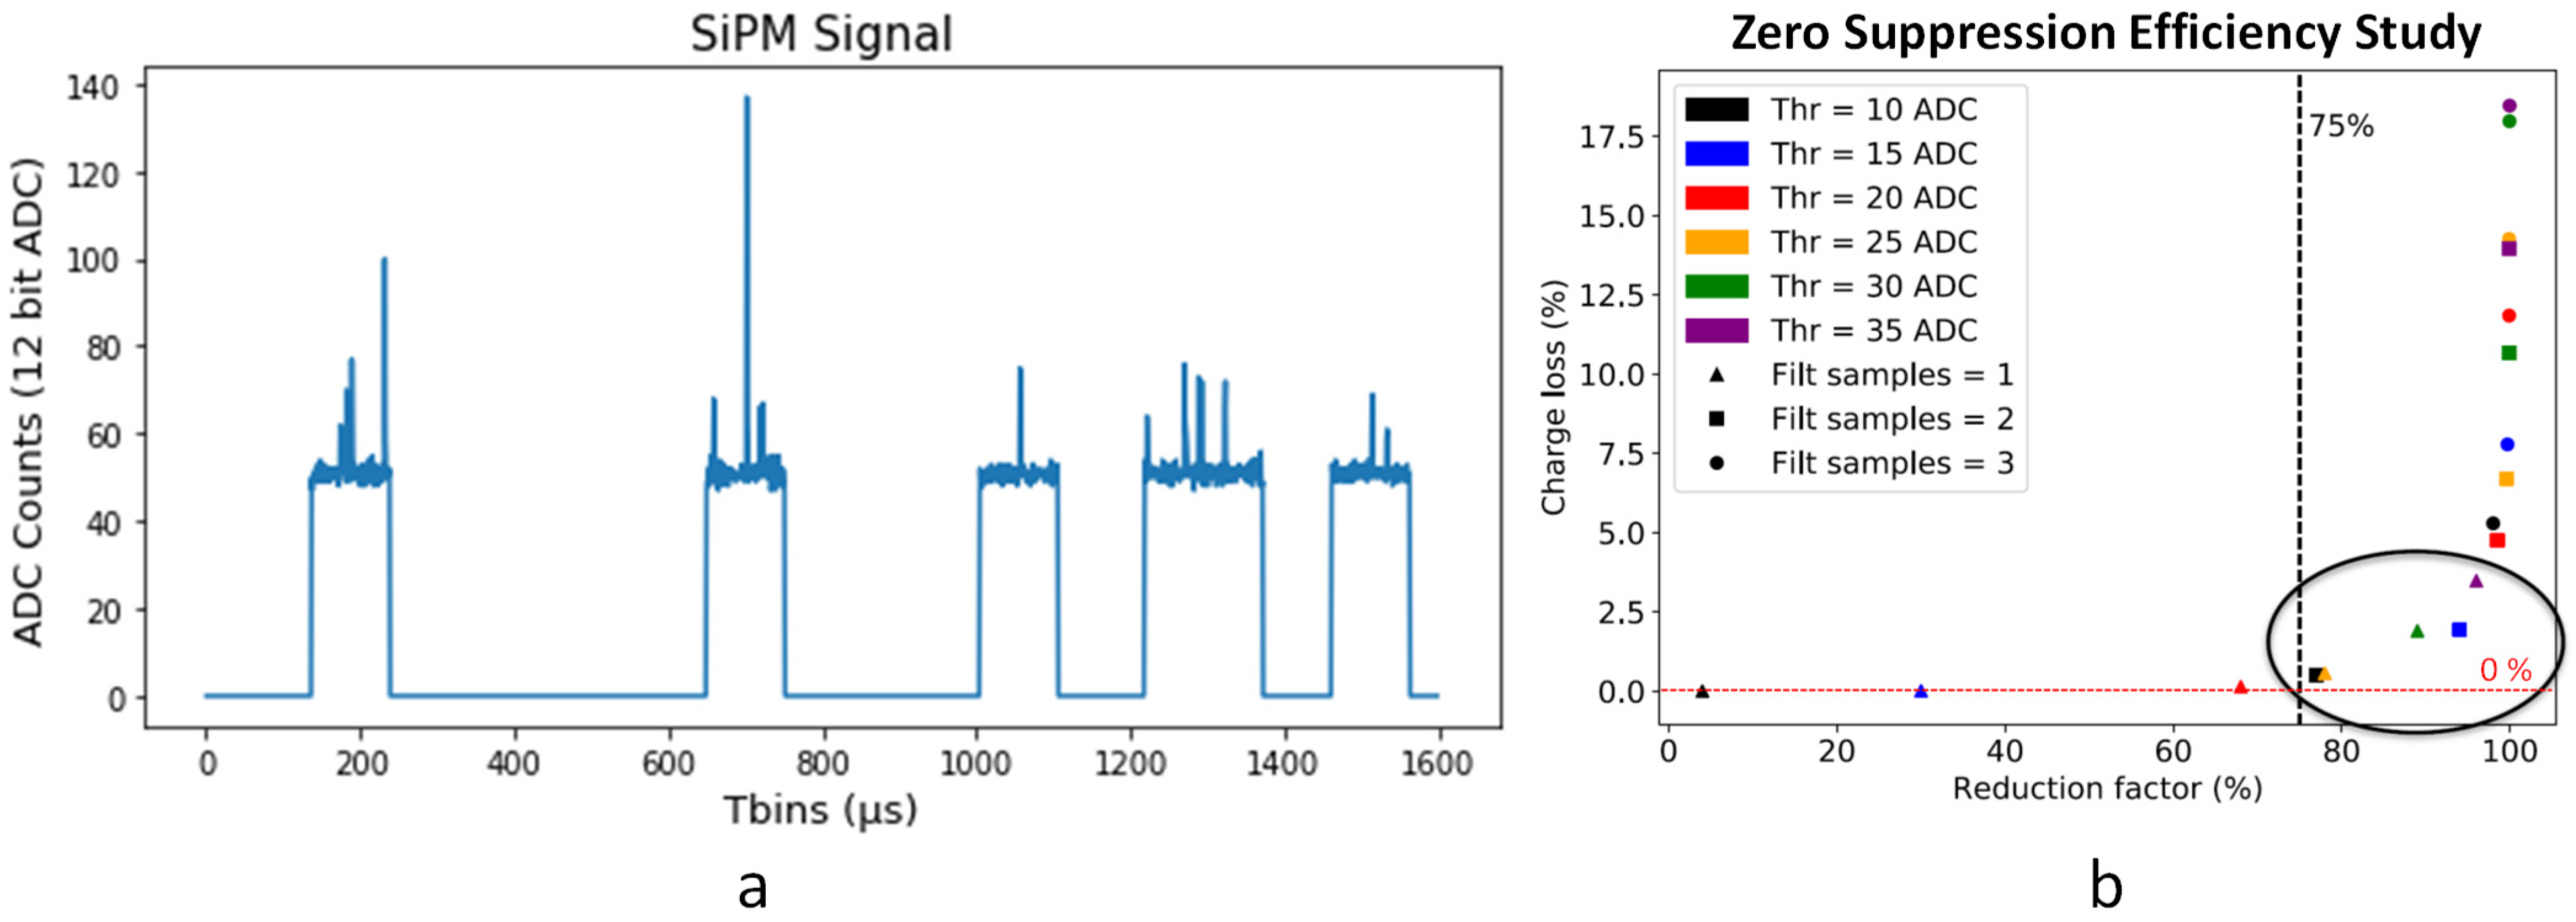
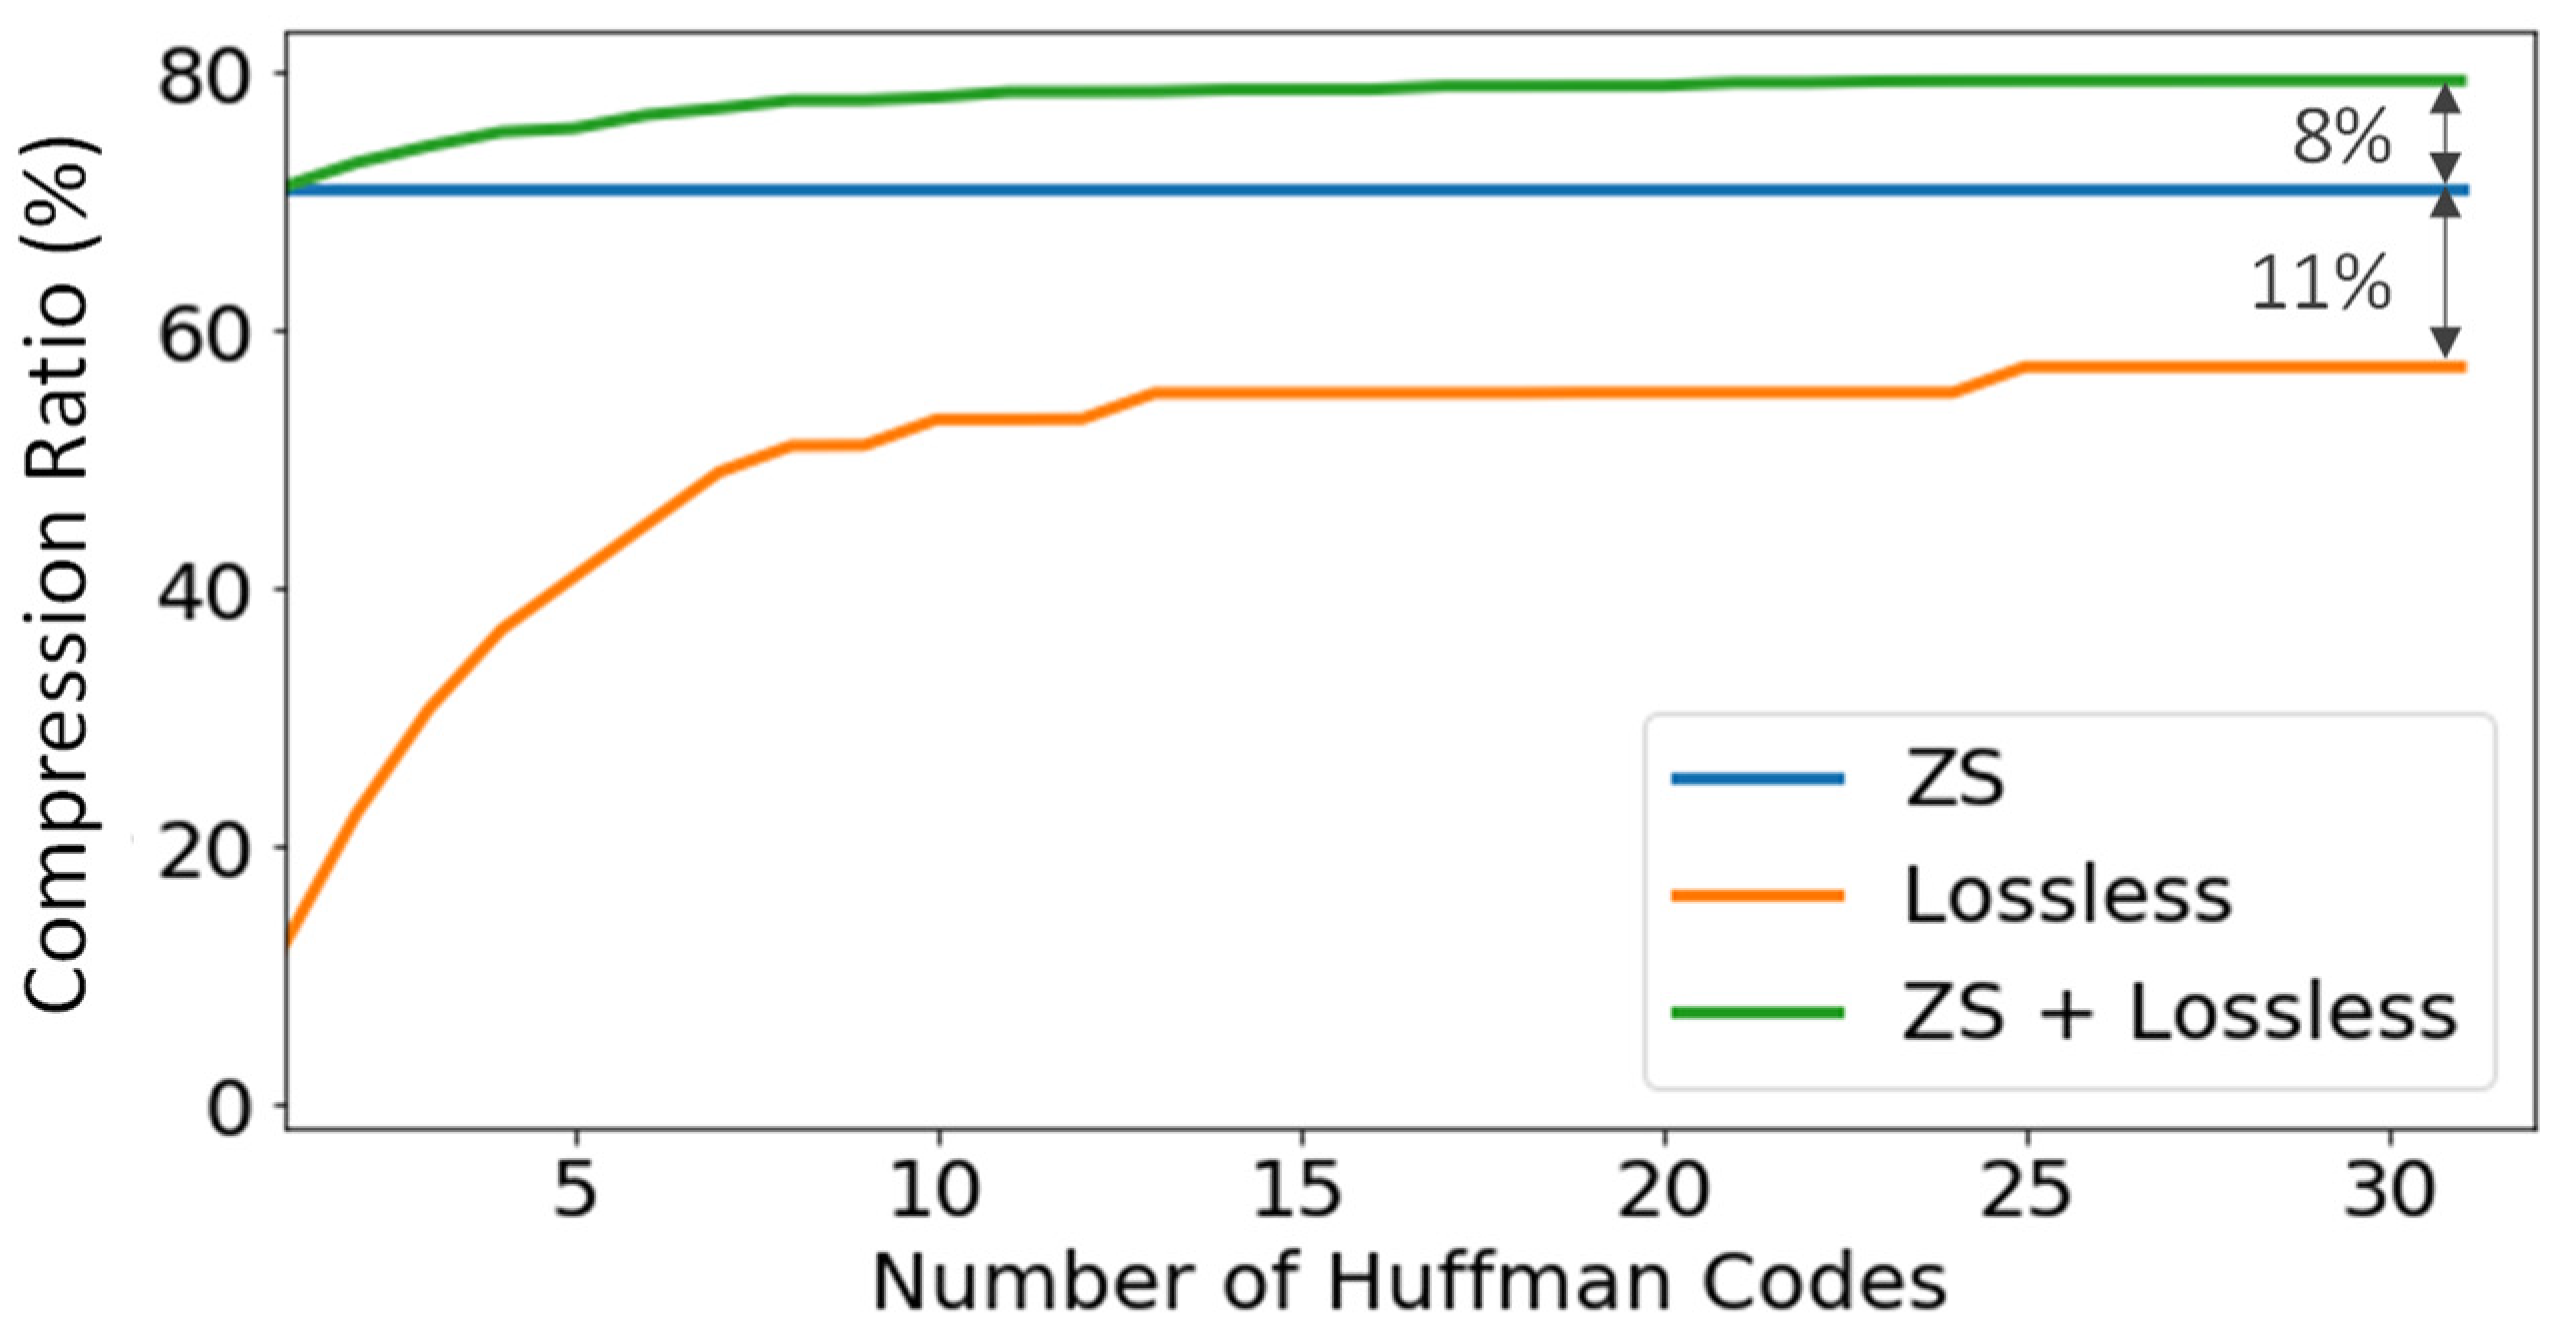
6.3. Huffman Encoding with Zero-Suppressed Data
6.4. Dynamic Versus Static Reconfiguration
- Statistics Module.
- 2.
- Tree Module.
- 3.
- Codification Module.
- 4.
- Dynamic Reconfiguration Control.
6.5. Decoding Software
7. Results
8. Summary and Conclusions
Author Contributions
Funding
Institutional Review Board Statement
Informed Consent Statement
Data Availability Statement
Conflicts of Interest
References
- Álvarez, V.; Borges, F.I.G.M.; Cárcel, S.; Carmona, J.M.; Castel, J.; Catalá, J.M.; Cebrián, S.; Cervera, A.; Chan, D.; Conde, C.; et al. NEXT-100 Technical Design Report (TDR). Executive summary. JINST 2012, 7, T06001. [Google Scholar] [CrossRef]
- Martín-Albo, J.; Muñoz Vidal, J.; Ferrario, P.; Nebot-Guinot, M.; Gómez-Cadenas, J.J.; Álvarez, V.; Azevedo, C.D.R.; Borges, G.; Cárcel, S.; Carrión, J.V.; et al. Sensitivity of NEXT-100 to neutrinoless double beta decay. JHEP 2016, 159. [Google Scholar] [CrossRef] [Green Version]
- Adams, C.; Álvarez, V.; Arazi, L.; Arnquist, I.J.; Azevedo, C.D.; Bailey, K.; Ballester, F.; Benlloch-Rodríguez, J.M.; Borges, F.I.; Byrnes, N.; et al. Sensitivity of a tonne-scale NEXT detector for neutrinoless double-beta decay searches. JHEP 2021, 164. [Google Scholar] [CrossRef]
- Renner, J.; López, G.D.; Ferrario, P.; Morata, J.H.; Kekic, M.; Martínez-Lema, G.; Monrabal, F.; Gómez-Cadenas, J.J.; Adams, C.; Álvare, V.; et al. Energy calibration of the NEXT-White detector with 1% resolution near Qββ of 136Xe. JHEP 2019, 230. [Google Scholar] [CrossRef] [Green Version]
- Simón, A.; Felkai, R.; Martínez-Lema, G.; Monrabal, F.; González-Díaz, D.; Sorel, M.; Hernando, J.A.; Gómez-Cadenas, J.; Adams, C.; Álvarez, V.; et al. Electron drift properties in high pressure gaseous xenon. JINST 2018, 13, P07013. [Google Scholar] [CrossRef] [Green Version]
- Martínez-Lema, G.; Hernando, J.A.; Palmeiro, B.; Botas, A.; Ferrario, P.; Monrabal, F.; Laing, A.; Renner, J.; Simón, A.; Para, A.; et al. Calibration of the NEXT-White detector using 83mKr decays. JINST 2018, 13, P10014. [Google Scholar] [CrossRef] [Green Version]
- Novella, P.; Palmeiro, B.; Sorel, M.; Usón, A.; Ferrario, P.; Gómez-Cadenas, J.J.; Adams, C.; Álvarez, V.; Arazi, L.; Arnquist, I.J.; et al. Radiogenic backgrounds in the NEXT double beta decay experiment. JHEP 2019, 51. [Google Scholar] [CrossRef] [Green Version]
- Monrabal, F.; Gómez-Cadenas, J.J.; Toledo, J.; Laing, A.; Álvarez, V.; Benlloch-Rodríguez, J.; Cárcel, S.; Carrión, J.; Esteve, R.; Felkai, R.; et al. The NEXT White (NEW) detector. JINST 2018, 13, P12010. [Google Scholar] [CrossRef] [Green Version]
- Esteve Bosch, R.; Toledo Alarcón, J.F.; Herrero Bosch, V.; Simón Estévez, A.; Monrabal Capilla, F.; Álvarez Puerta, V.; Rodríguez Samaniego, J.; Querol Segura, M.; Ballester Merelo, F. The Event Detection System in the NEXT-White detector. Sensors 2021, 21, 673. [Google Scholar] [CrossRef]
- Martoiu, S.; Muller, H.; Costa, F.; Tarazona, A.; Toledo, J.; Zang, F. The SRS scalable readout system for micropattern gas detectors and other applications. In Proceedings of the TWEPP Tropical Workshop on Electronics for Particle Physics, Oxford, UK, 17–21 September 2012. [Google Scholar]
- Toledo, J.; Muller, H.; Esteve, R.; Monzó, J.M.; Tarazona, A.; Martoiu, S. The front-end concentrator card for the RD51 scalable readout system. JINST 2011, 6, C11028. [Google Scholar] [CrossRef]
- Carena, F.; Carena, W.; Chapeland, S.; Chubante Barroso, V.; Costa, F.; Denes, E.; Divia, R.; Fuchs, U.; Grigore, A.; Kiss, T.; et al. The ALICE data acquisition system. Nucl. Instr. Methods in Phys. Res. Sec. A Accel. Spectrom. Detect. Assoc. Equip. 2014, 741, 130–162. [Google Scholar] [CrossRef]
- Tarazona, A.; Gnanvo, K.; Martoiu, S.; Muller, H.; Toledo, J. A point-to-point link for data, trigger, clock and control over copper or fibre. JINST 2014, 9, T06004. [Google Scholar] [CrossRef] [Green Version]
- Rodriguez, J.; Toledo, J.; Esteve, R.; Lorca, D.; Monrabal, F.; Alarcón, J.F.T. The front-end electronics for the 1.8-kchannel SiPM tracking plane in the NEW detector. JINST 2015, 10, C01025. [Google Scholar] [CrossRef] [Green Version]
- Lee, T.; Park, J. Design and implementation for static Huffman encoding hardware with parallel shifting algorithm. IEEE Trans. Nuclear Sci. 2004, 51, 5. [Google Scholar] [CrossRef]
- Abratenko, P.; Alrashed, M.; An, R.; Anthony, J.; Asaadi, J.; Ashkenazi, A.; Balasubramanian, S.; Baller, B.; Barnes, C.; Barr, G.; et al. The continuous readout stream of the MicroBooNE liquid argon time projection chamber for detection of supernova burst neutrinos. JINST 2021, 16, P02008. [Google Scholar] [CrossRef]
- Shen, Z.; Wang, S.; Li, C.; Feng, C.; Liu, S. Study on the Real-Time Lossless Data Compression Method Used in the Readout System for Micropattern Gas Detector. IEEE Trans. Nucl. Sci. 2019, 66, 8. [Google Scholar] [CrossRef] [Green Version]
- Patauner, C.; Marchioro, A.; Bonacini, S.; Ur Rehman, A.; Pribyl, W. A Lossless Data Compression System for a Real-Time Application in HEP Data Acquisition. IEEE Trans. Nuclear Sci. 2011, 58, 4. [Google Scholar] [CrossRef]
- Huffman, D.A. A Method for the Construction of Minimum-Redundancy Codes. Proc. Inst. Radio Eng 1952, 40, 40–1098. [Google Scholar] [CrossRef]
- Robinson, A.H.; Cherry, C. Results of a prototype television bandwidth compression scheme. Proc. IEEE 1967, 55, 356–364. [Google Scholar] [CrossRef]
- Willems, F.M.J.; Shtarkov, Y.M.; Tjalkens, T.J. The context-tree weighting method: Basic properties. IEEE Trans. Inform. Theory 1995, 41, 653–664. [Google Scholar] [CrossRef] [Green Version]
- Ziv, J.; Lempel, A. Compression of individual sequences via variable-rate coding. IEEE Trans. Inform. Theory 1978, 24, 530–536. [Google Scholar] [CrossRef] [Green Version]
- Simón, A.; Ifergan, Y.; Redwine, A.B.; Weiss-Babai, R.; Arazi, L.; Adams, C.; Almazán, H.; Álvarez, V.; Aparicio, B.; Aranburu, A.I.; et al. Boosting background suppression in the NEXT experiment through Richardson-Lucy deconvolution. JHEP 2021, 146. [Google Scholar] [CrossRef]
- Álvarez, V.; Herrero-Bosch, V.; Esteve, R.; Laing, A.; Rodríguez, J.; Querol, M.; Monrabal, F.; Toledo, J.; Gómez-Cadenas, J. The electronics of the energy plane of the NEXT-White detector. NIM A 2019, 917, 68–76. [Google Scholar] [CrossRef] [Green Version]
- The HDF Group, Hierarchical Data Format, Version 5, 1997–2022. Available online: https://www.hdfgroup.org/solutions/hdf5/ (accessed on 11 June 2022).


| Compression Ratio (%) | |||
|---|---|---|---|
| EP DAQ Module | TP DAQ Module | ||
| Raw | Raw | ZS | |
| Method 1 | 80.07 | 57.14 | 80.12 |
| Method 2 | 86.23 | 63.27 | 80.85 |
| Method 2b | 85.26 | 63.27 | 80.85 |
| EP DAQ Module | TP DAQ Module | |||
|---|---|---|---|---|
| Compression Module | Total | Compression Module | Total | |
| Slice Registers | 0.15% | 12% | 0.11% | 10% |
| Slice LUTs | 0.57% | 36% | 0.44% | 20% |
| Occupied Slices | 0.88% | 46% | 0.79% | 45% |
| RAM36E | 0% | 24% | 0% | 20% |
| RAM18E | 0% | 5% | 0.12% | 5% |
| DSP48E | 0.26% | 40% | 0.13% | 0.13% |
| Dynamic Reconfiguration Module | DAQ Modules | ||
|---|---|---|---|
| Used | Utilization | Utilization | |
| Slice Registers | 3527 | 3.79% | 12/10% |
| Slice LUTs | 3609 | 7.75% | 36/20% |
| Occupied Slices | 1158 | 9.95% | 46/45% |
| RAM18E | 3 | 0.96% | 5/5% |
| Compression | Data Size (MBytes) | Compression Ratio (%) | |
|---|---|---|---|
| Run 7299 | OFF | 18,601.53 | 0 |
| Run 7298 | ON | 3283.47 | 82.35 |
| ZS | Compression | Data Size (MBytes) | Compression Ratio (%) | Ratio Events/Losts | Processing Time (s) | |
|---|---|---|---|---|---|---|
| Run 11233 | OFF | OFF | 6109.31 | 0 | 1.80 | 270.96 |
| Run 11234 | ON | OFF | 2140.18 | 71.06 | 1.27 | 132.85 |
| Run 11235 | ON | ON | 1316.90 | 78.44 | 1.20 | 151.83 |
| Run 11236 | OFF | ON | 2346.04 | 61.60 | 1.34 | 347.09 |
Publisher’s Note: MDPI stays neutral with regard to jurisdictional claims in published maps and institutional affiliations. |
© 2022 by the authors. Licensee MDPI, Basel, Switzerland. This article is an open access article distributed under the terms and conditions of the Creative Commons Attribution (CC BY) license (https://creativecommons.org/licenses/by/4.0/).
Share and Cite
Esteve Bosch, R.; Rodríguez Ponce, J.; Simón Estévez, A.; Benlloch Rodríguez, J.M.; Herrero Bosch, V.; Toledo Alarcón, J.F. Data Compression in the NEXT-100 Data Acquisition System. Sensors 2022, 22, 5197. https://0-doi-org.brum.beds.ac.uk/10.3390/s22145197
Esteve Bosch R, Rodríguez Ponce J, Simón Estévez A, Benlloch Rodríguez JM, Herrero Bosch V, Toledo Alarcón JF. Data Compression in the NEXT-100 Data Acquisition System. Sensors. 2022; 22(14):5197. https://0-doi-org.brum.beds.ac.uk/10.3390/s22145197
Chicago/Turabian StyleEsteve Bosch, Raúl, Jorge Rodríguez Ponce, Ander Simón Estévez, José María Benlloch Rodríguez, Vicente Herrero Bosch, and José Francisco Toledo Alarcón. 2022. "Data Compression in the NEXT-100 Data Acquisition System" Sensors 22, no. 14: 5197. https://0-doi-org.brum.beds.ac.uk/10.3390/s22145197