
Smart Immunosensors for Point-of-Care Serological Tests Aimed at Assessing Natural or Vaccine-Induced SARS-CoV-2 Immunity

 , , , , ,
  , and
, and 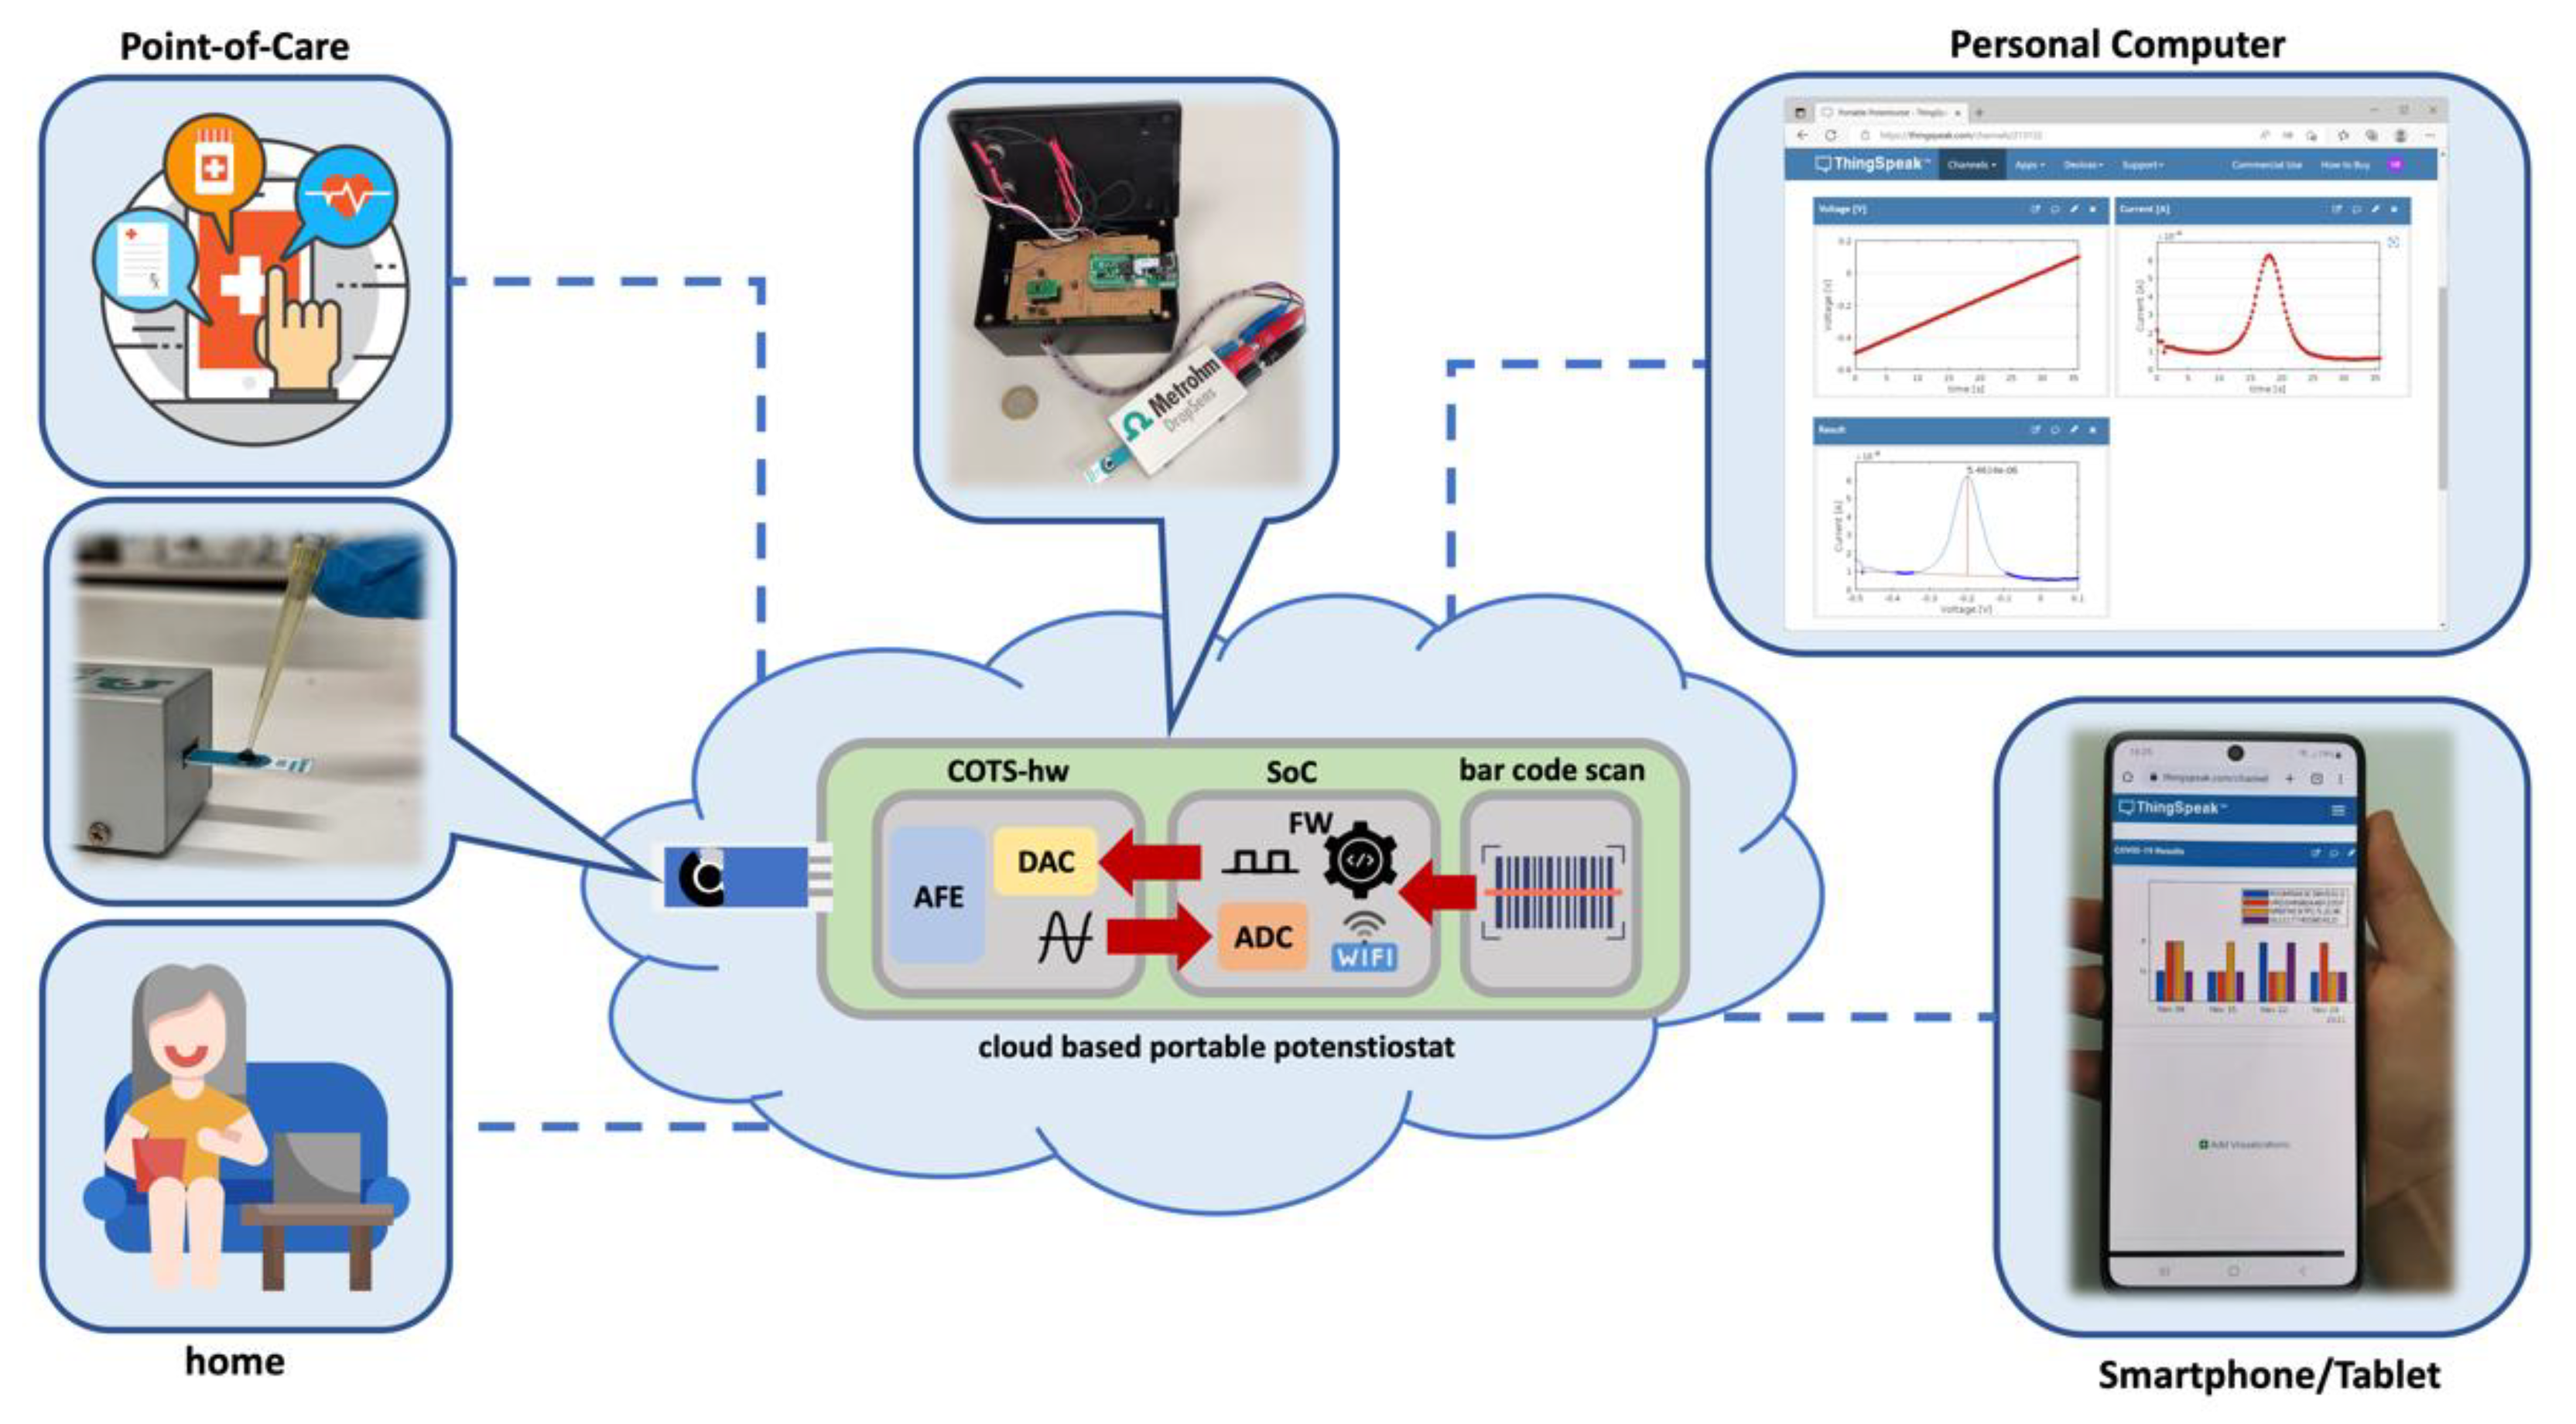
Abstract
:1. Introduction
2. Materials and Methods
2.1. Materials
2.2. Buffer Composition
2.3. Equipment for Data Acquisition
2.4. Serum Specimens
2.5. Anti-N Immunosensor Fabrication
2.6. Anti-S Immunosensor Fabrication
2.7. Validation of SARS-CoV-2 Anti-N and Anti-S Immunosensors
3. Results and Discussion
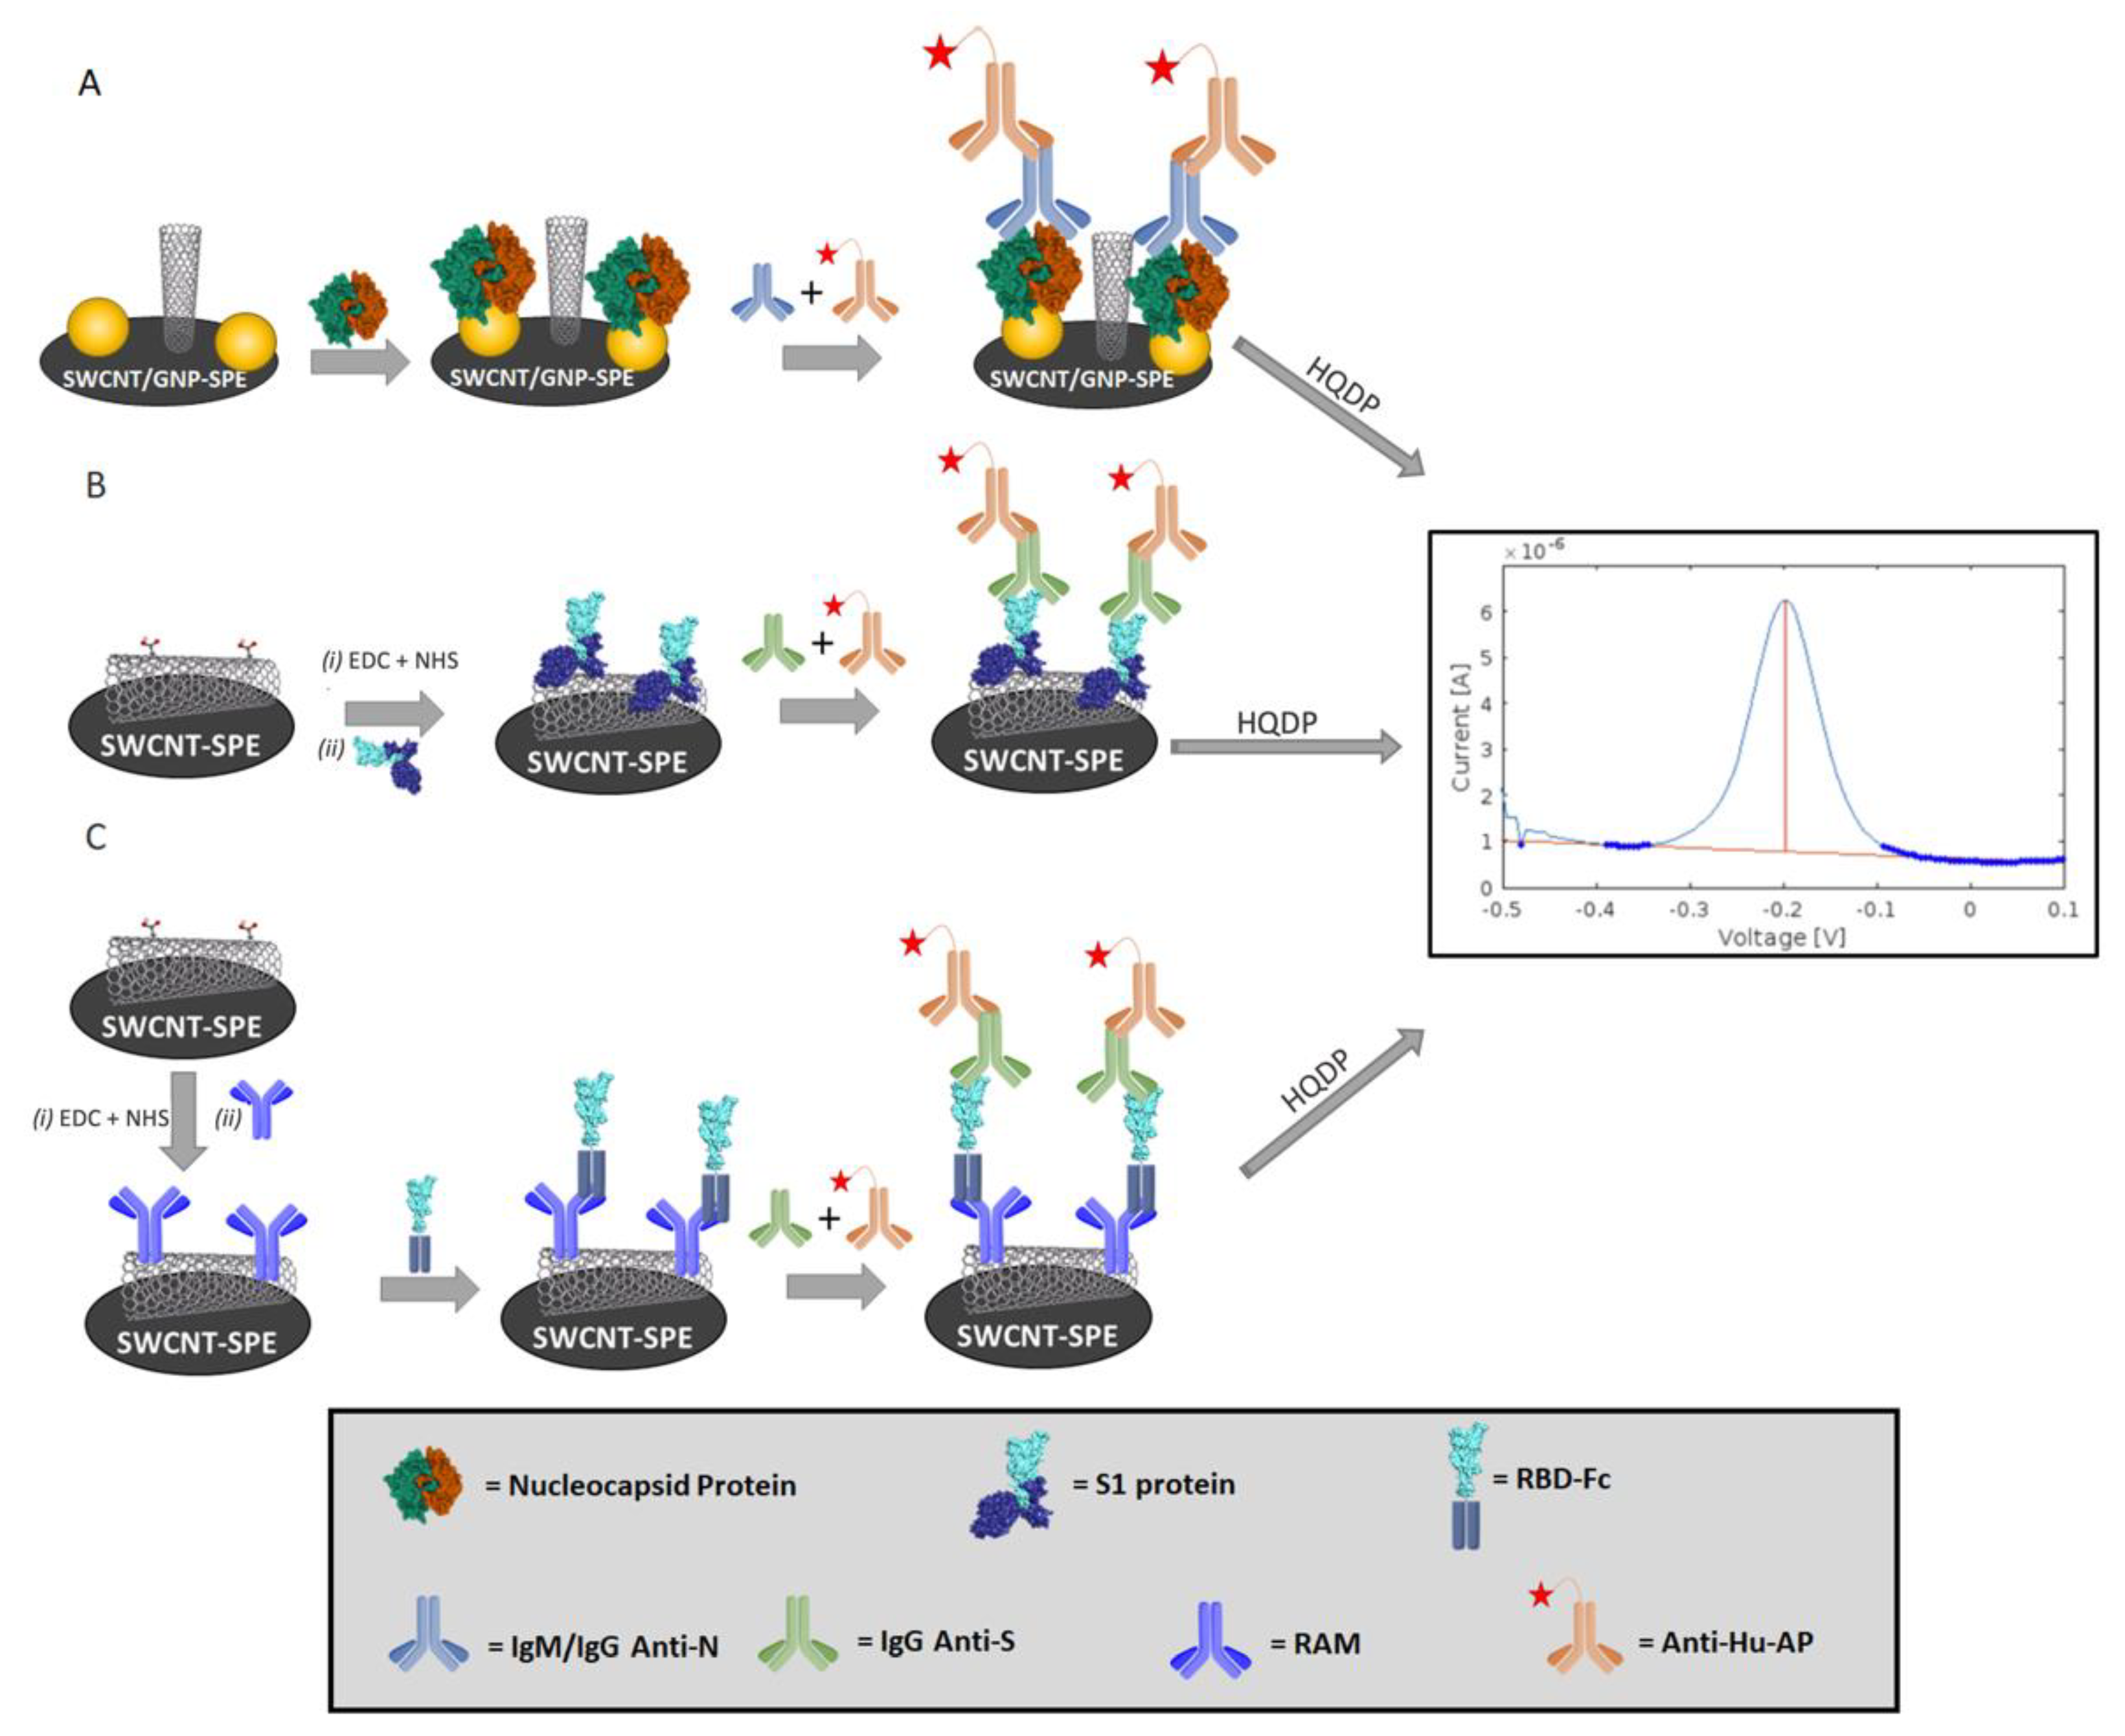
3.1. Immunosensors Setup
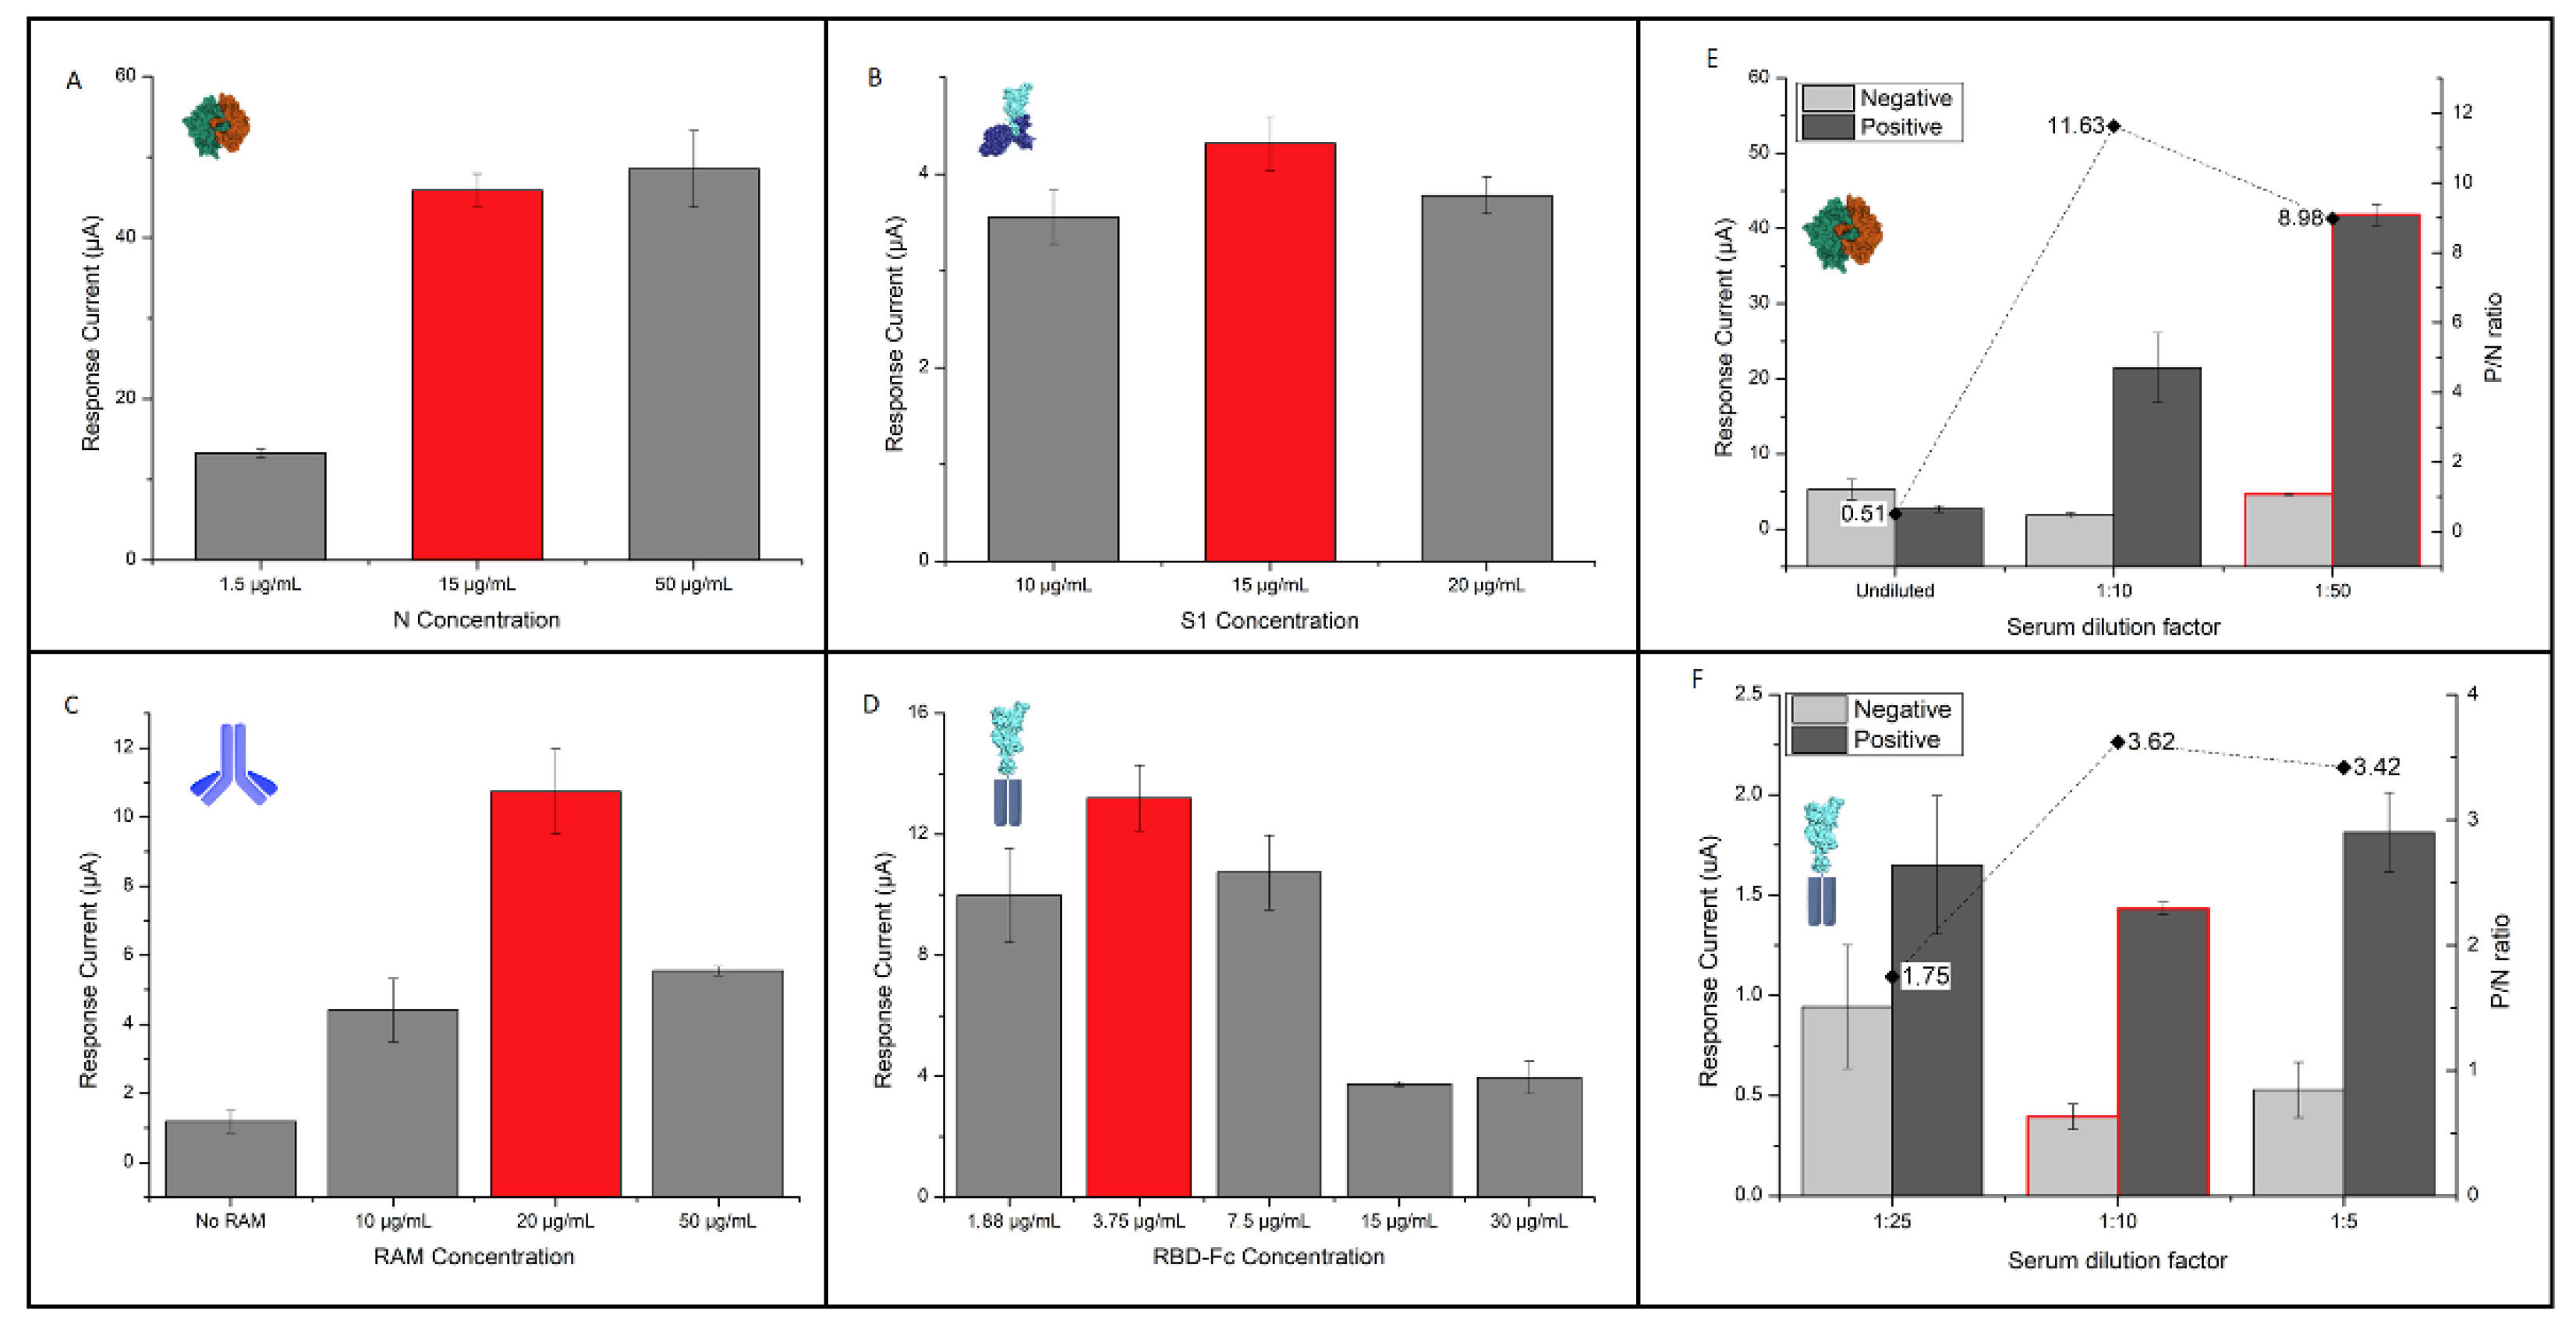
3.2. Receptor Antigen Immobilization Methods and Chemistries
3.3. Effect of Serum Matrix
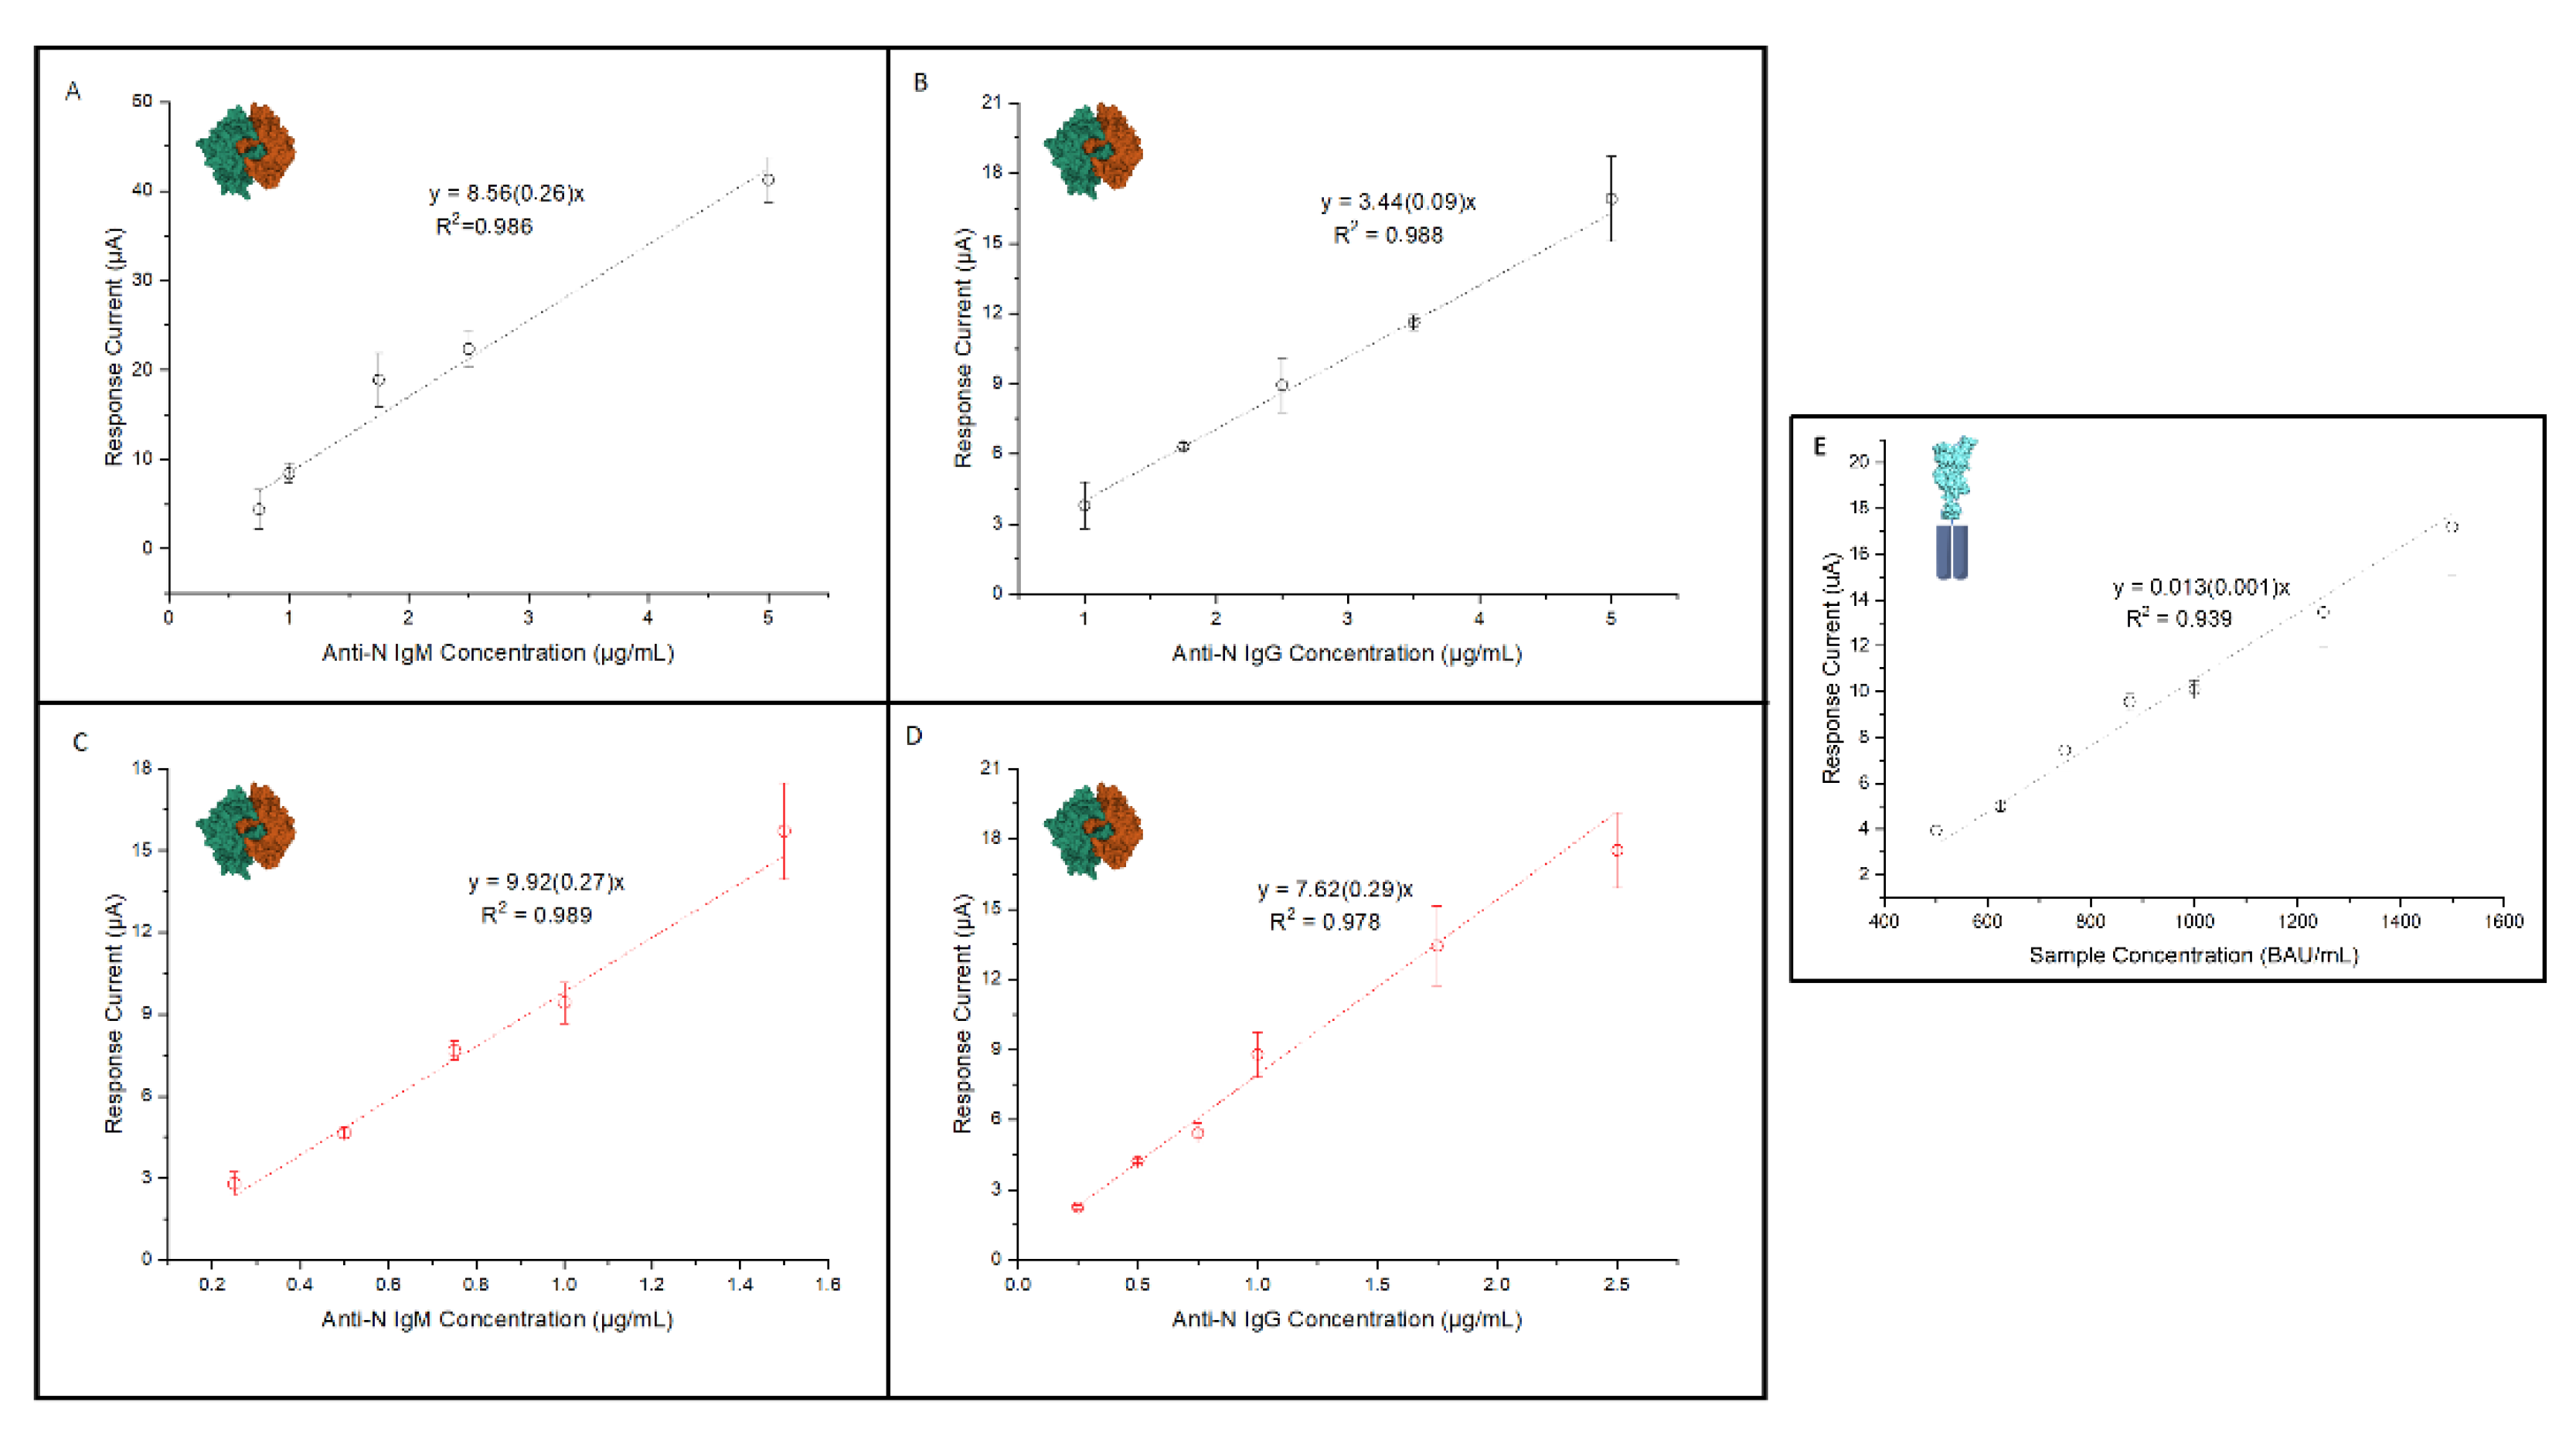
3.4. Linearity and Sensitivity Assessment of SARS-CoV-2 Anti-N and Anti-S Immunosensors
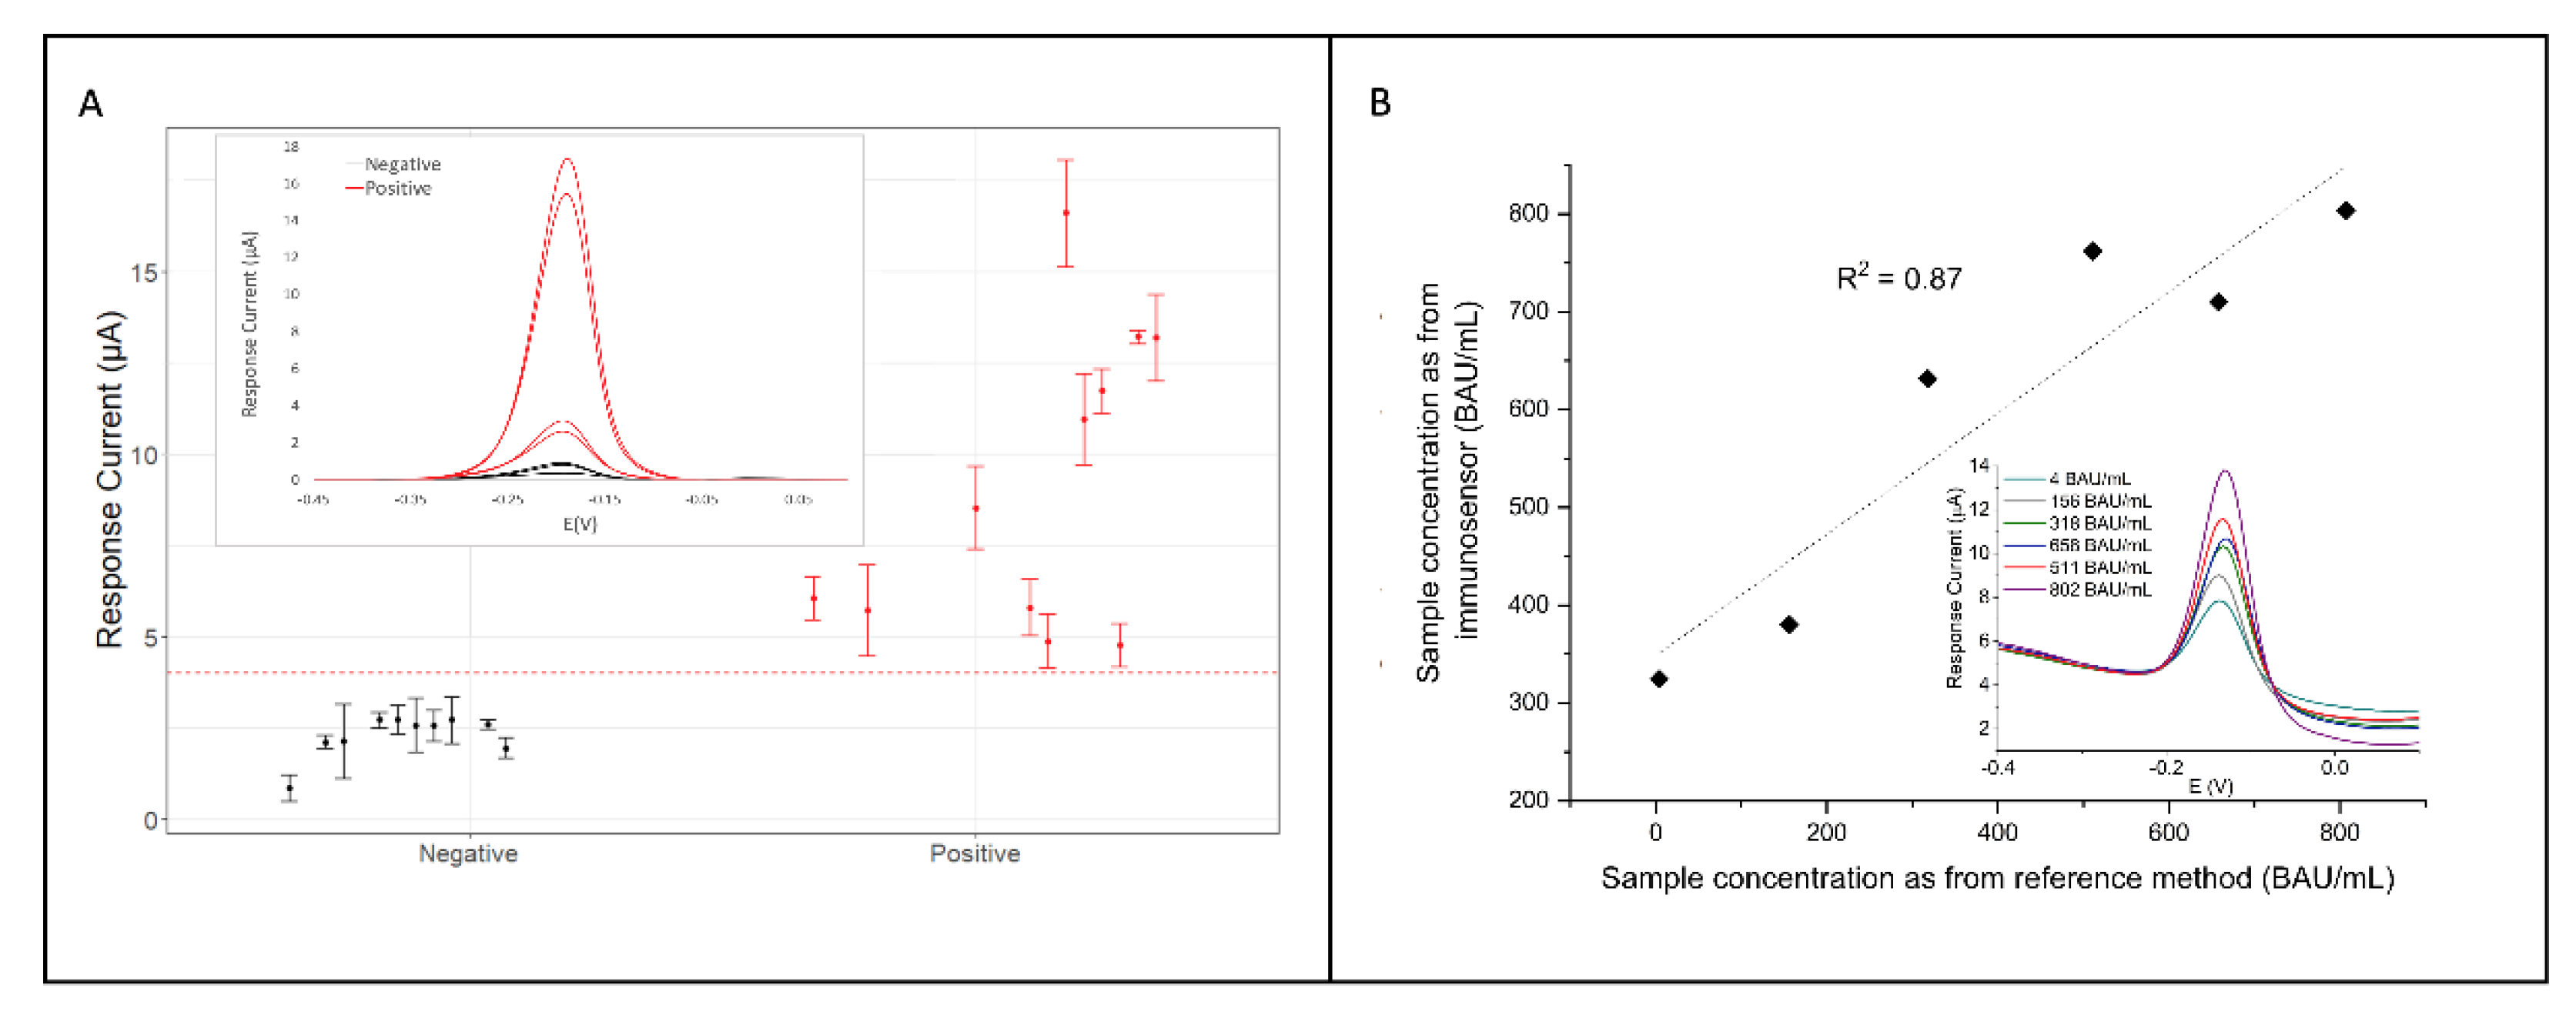
3.5. Performance of the Immunosensors in Clinical Specimens
- (i)
- having also dealt with the detection and determination of anti-N antibodies, in addition to anti-S, thus providing more informative results;
- (ii)
- the use of working standards of anti-S from vaccinated subjects cross-calibrated against the international standard from the WHO [20] for the determination of anti-S antibodies in clinical sera of infected patients;
- (iii)
- having demonstrated reliability in real serum samples through a thorough validation of the immunosensors both in serum matrix and clinical samples.
3.6. Performance of the Readout Instrumentation
4. Conclusions
Supplementary Materials
Author Contributions
Funding
Data Availability Statement
Acknowledgments
Conflicts of Interest
References
- World Health Organization. WHO Director-General’s Opening Remarks at the Media Briefing on COVID-19. 2020. Available online: https://www.who.int/director-general/speeches/detail/who-director-general-s-opening-remarks-at-the-media-briefing-on-covid-19---20-march-2020 (accessed on 29 March 2022).
- World Health Organization. Weekly Epidemiological Update on COVID-19-22 March 2022. Available online: https://www.who.int/publications/m/item/weekly-epidemiological-update-on-covid-19---1-june-2022 (accessed on 16 June 2022).
- Ji, T.; Liu, Z.; Wang, G.Q.; Guo, X.; Akbar Khan, S.; Lai, C.; Chen, H.; Huang, S.; Xia, S.; Chen, B.; et al. Detection of COVID-19: A Review of the Current Literature and Future Perspectives. Biosens. Bioelectron. 2020, 166, 112455. [Google Scholar] [CrossRef] [PubMed]
- Xu, L.; Li, D.; Ramadan, S.; Li, Y.; Klein, N. Facile Biosensors for Rapid Detection of COVID-19. Biosens. Bioelectron. 2020, 170, 112673. [Google Scholar] [CrossRef] [PubMed]
- Polack, F.P.; Thomas, S.J.; Kitchin, N.; Absalon, J.; Gurtman, A.; Lockhart, S.; Perez, J.L.; Pérez Marc, G.; Moreira, E.D.; Zerbini, C.; et al. Safety and Efficacy of the BNT162b2 MRNA Covid-19 Vaccine. N. Engl. J. Med. 2020, 383, 2603–2615. [Google Scholar] [CrossRef]
- Hussein, H.A.; Hassan, R.Y.A.; Chino, M.; Febbraio, F. Point-of-Care Diagnostics of Covid-19: From Current Work to Future Perspectives. Sensors 2020, 20, 4289. [Google Scholar] [CrossRef] [PubMed]
- Kaushik, A.K.; Dhau, J.S.; Gohel, H.; Mishra, Y.K.; Kateb, B.; Kim, N.-Y.; Goswami, D.Y. Electrochemical SARS-CoV-2 Sensing at Point-of-Care and Artificial Intelligence for Intelligent COVID-19 Management. ACS Appl. Bio Mater. 2020, 3, 7306–7325. [Google Scholar] [CrossRef] [PubMed]
- Rasmi, Y.; Li, X.; Khan, J.; Ozer, T.; Choi, J.R. Emerging Point-of-Care Biosensors for Rapid Diagnosis of COVID-19: Current Progress, Challenges, and Future Prospects. Anal. Bioanal. Chem. 2021, 413, 4137–4159. [Google Scholar] [CrossRef] [PubMed]
- Schuler, C.F.; Gherasim, C.; O’Shea, K.; Manthei, D.M.; Chen, J.; Giacherio, D.; Troost, J.P.; Baldwin, J.L.; Baker, J.R. Accurate Point-of-Care Serology Tests for COVID-19. PLoS ONE 2021, 16, e0248729. [Google Scholar] [CrossRef]
- La Rosa Fabián, C.; Urquizo Briceño, L. Anti-SARS-Cov-2 IgA in Current Scenario of IgM and IgG Rapid Test: A New Alternative for the Diagnostic of COVID-19. SN Compr. Clin. Med. 2020, 2, 2167–2169. [Google Scholar] [CrossRef]
- Gong, F.; Wei, H.; Li, Q.; Liu, L.; Li, B. Evaluation and Comparison of Serological Methods for COVID-19 Diagnosis. Front. Mol. Biosci. 2021, 8, 682405. [Google Scholar] [CrossRef]
- Dowlatshahi, S.; Shabani, E.; Abdekhodaie, M.J. Serological Assays and Host Antibody Detection in Coronavirus-Related Disease Diagnosis. Arch. Virol. 2021, 166, 715–731. [Google Scholar] [CrossRef]
- Burbelo, P.D.; Riedo, F.X.; Morishima, C.; Rawlings, S.; Smith, D.; Das, S.; Strich, J.R.; Chertow, D.S.; Davey, R.T.; Cohen, J.I. Sensitivity in Detection of Antibodies to Nucleocapsid and Spike Proteins of Severe Acute Respiratory Syndrome Coronavirus 2 in Patients with Coronavirus Disease 2019. J. Infect. Dis. 2020, 222, 206–213. [Google Scholar] [CrossRef] [PubMed]
- Prendecki, M.; Clarke, C.; Brown, J.; Cox, A.; Gleeson, S.; Guckian, M.; Randell, P.; Pria, A.D.; Lightstone, L.; Xu, X.-N.; et al. Effect of Previous SARS-CoV-2 Infection on Humoral and T-Cell Responses to Single-Dose BNT162b2 Vaccine. Lancet 2021, 397, 1178–1181. [Google Scholar] [CrossRef]
- Mahshid, S.S.; Flynn, S.E.; Mahshid, S. The Potential Application of Electrochemical Biosensors in the COVID-19 Pandemic: A Perspective on the Rapid Diagnostics of SARS-CoV-2. Biosens. Bioelectron. 2021, 176, 112905. [Google Scholar] [CrossRef] [PubMed]
- Torrente-Rodríguez, R.M.; Lukas, H.; Tu, J.; Min, J.; Yang, Y.; Xu, C.; Rossiter, H.B.; Gao, W. SARS-CoV-2 RapidPlex: A Graphene-Based Multiplexed Telemedicine Platform for Rapid and Low-Cost COVID-19 Diagnosis and Monitoring. Matter 2020, 3, 1981–1998. [Google Scholar] [CrossRef]
- Yakoh, A.; Pimpitak, U.; Rengpipat, S.; Hirankarn, N.; Chailapakul, O.; Chaiyo, S. Paper-Based Electrochemical Biosensor for Diagnosing COVID-19: Detection of SARS-CoV-2 Antibodies and Antigen. Biosens. Bioelectron. 2021, 176, 112912. [Google Scholar] [CrossRef]
- Rashed, M.Z.; Kopechek, J.A.; Priddy, M.C.; Hamorsky, K.T.; Palmer, K.E.; Mittal, N.; Valdez, J.; Flynn, J.; Williams, S.J. Rapid Detection of SARS-CoV-2 Antibodies Using Electrochemical Impedance-Based Detector. Biosens. Bioelectron. 2021, 171, 112709. [Google Scholar] [CrossRef]
- Peng, R.; Pan, Y.; Li, Z.; Qin, Z.; Rini, J.M.; Liu, X. SPEEDS: A Portable Serological Testing Platform for Rapid Electrochemical Detection of SARS-CoV-2 Antibodies. Biosens. Bioelectron. 2022, 197, 113762. [Google Scholar] [CrossRef]
- Ferrari, D.; Clementi, N.; Spanò, S.M.; Albitar-Nehme, S.; Ranno, S.; Colombini, A.; Criscuolo, E.; Di Resta, C.; Tomaiuolo, R.; Viganó, M.; et al. Harmonization of Six Quantitative SARS-CoV-2 Serological Assays Using Sera of Vaccinated Subjects. Clin. Chim. Acta 2021, 522, 144–151. [Google Scholar] [CrossRef]
- World Health Organization. Establishment of the WHO International Standard and Reference Panel for Anti-SARS-CoV-2 antibody. 2020. Available online: https://www.who.int/publications/m/item/WHO-BS-2020.2403 (accessed on 29 March 2022).
- World Health Organization. Who Recommendations for the Preparation, Characterization and Establishment of International and Other Biological Reference Standards (Revised 2004). 2006. Available online: https://apps.who.int/iris/rest/bitstreams/1233352/retrieve (accessed on 29 March 2022).
- Zhu, W.; Zeng, N.; Wang, N. Sensitivity, Specificity, Accuracy, Associated Confidence Interval and ROC Analysis with Practical SAS Implementations. In Proceedings of the NESUG Proceedings: Health Care and Life Sciences, Baltimore, MD, USA, 14–17 November 2010. [Google Scholar]
- Giannetto, M.; Bianchi, V.; Gentili, S.; Fortunati, S.; De Munari, I.; Careri, M. An Integrated IoT-Wi-Fi Board for Remote Data Acquisition and Sharing from Innovative Immunosensors. Case of Study: Diagnosis of Celiac Disease. Sens. Actuators B Chem. 2018, 273, 1395–1403. [Google Scholar] [CrossRef]
- Bianchi, V.; Mattarozzi, M.; Giannetto, M.; Boni, A.; De Munari, I.; Careri, M. A Self-Calibrating IoT Portable Electrochemical Immunosensor for Serum Human Epididymis Protein 4 as a Tumor Biomarker for Ovarian Cancer. Sensors 2020, 20, 2016. [Google Scholar] [CrossRef] [Green Version]
- Bianchi, V.; Boni, A.; Bassoli, M.; Giannetto, M.; Fortunati, S.; Careri, M.; De Munari, I. IoT and Biosensors: A Smart Portable Potentiostat with Advanced Cloud-Enabled Features. IEEE Access 2021, 9, 141544–141554. [Google Scholar] [CrossRef]
- Adrover-Jaume, C.; Alba-Patiño, A.; Clemente, A.; Santopolo, G.; Vaquer, A.; Russell, S.M.; Barón, E.; del Mar González del Campo, M.; Ferrer, J.M.; Berman-Riu, M.; et al. Paper Biosensors for Detecting Elevated IL-6 Levels in Blood and Respiratory Samples from COVID-19 Patients. Sens. Actuators B Chem. 2021, 330, 129333. [Google Scholar] [CrossRef] [PubMed]
- Tao, Y.; Luo, F.; Lin, Y.; Dong, N.; Li, C.; Lin, Z. Quantitative Gold Nanorods Based Photothermal Biosensor for Glucose Using a Thermometer as Readout. Talanta 2021, 230, 122364. [Google Scholar] [CrossRef]
- Bianchi, V.; Boni, A.; Fortunati, S.; Giannetto, M.; Careri, M.; De Munari, I. A Wi-Fi Cloud-Based Portable Potentiostat for Electrochemical Biosensors. IEEE Trans. Instrum. Meas. 2020, 69, 3232–3240. [Google Scholar] [CrossRef]
- Ferrari, D.; Di Resta, C.; Tomaiuolo, R.; Sabetta, E.; Pontillo, M.; Motta, A.; Locatelli, M. Long-Term Antibody Persistence and Exceptional Vaccination Response on Previously SARS-CoV-2 Infected Subjects. Vaccine 2021, 39, 4256–4260. [Google Scholar] [CrossRef] [PubMed]
- Magnusson, B. The Fitness for Purpose of Analytical Methods: A Laboratory Guide to Method Validation and Related Topics, Eurachem Guidelines. Available online: https://www.eurachem.org/index.php/publications/guides/mv (accessed on 29 March 2022).
- O’Brien, J.C.; Jones, V.W.; Porter, M.D.; Mosher, C.L.; Henderson, E. Immunosensing Platforms Using Spontaneously Adsorbed Antibody Fragments on Gold. Anal. Chem. 2000, 72, 703–710. [Google Scholar] [CrossRef] [Green Version]
- Hermanson, G.T. Bioconjugate Techniques; Elsevier: Amsterdam, The Netherlands, 2013. [Google Scholar]
- Lew, T.T.S.; Aung, K.M.M.; Ow, S.Y.; Amrun, S.N.; Sutarlie, L.; Ng, L.F.P.; Su, X. Epitope-Functionalized Gold Nanoparticles for Rapid and Selective Detection of SARS-CoV-2 IgG Antibodies. ACS Nano 2021, 15, 12286–12297. [Google Scholar] [CrossRef]
- Gevaerd, A.; Watanabe, E.Y.; Belli, C.; Marcolino-Junior, L.H.; Bergamini, M.F. A complete lab-made point of care device for non-immunological electrochemical determination of cortisol levels in salivary samples. Sens. Actuators B Chem. 2021, 332. [Google Scholar] [CrossRef]
- Ainla, A.; Mousavi, M.P.S.; Tsaloglou, M.-N.; Redston, J.; Bell, J.G.; Fernández-Abedul, M.T.; Whitesides, G.M. Open-Source Potentiostat for Wireless Electrochemical Detection with Smartphones. Anal. Chem. 2018, 90, 6240–6246. [Google Scholar] [CrossRef] [Green Version]
- Monge, J.; Postolache, O.; Trandabat, A.; Macovei, S.; Burlacu, R. Mobile Potentiostat IoT Compatible. In Proceedings of the 2019 International Conference on Sensing and Instrumentation in IoT Era (ISSI), Lisbon, Portugal, 29–30 August 2019; pp. 1–6. [Google Scholar]
- EmStat4S-PalmSens. Available online: https://www.palmsens.com/product/emstat4s/ (accessed on 30 June 2022).
- Electrochemistry–A Workbook for 910 PSTAT Mini|Metrohm. Available online: https://www.metrohm.com/shared/it/products/8/1085/81085020.html (accessed on 30 June 2022).
- CS100 Portable Potentiostat-Corrtest Instruments. Available online: https://www.corrtestinstruments.com/en/extendedseries/1234.html?gclid=CjwKCAjwquWVBhBrEiwAt1Kmwtrz0JcEPvWjuUx-T1-21UlJf_I7mLvPoiF3-d8yCDGIwuZcV3OwpRoCJTgQAvD_BwE (accessed on 30 June 2022).
- Thingspeak. Available online: https://thingspeak.com (accessed on 30 June 2022).


Publisher’s Note: MDPI stays neutral with regard to jurisdictional claims in published maps and institutional affiliations. |
© 2022 by the authors. Licensee MDPI, Basel, Switzerland. This article is an open access article distributed under the terms and conditions of the Creative Commons Attribution (CC BY) license (https://creativecommons.org/licenses/by/4.0/).
Share and Cite
Fortunati, S.; Giannetto, M.; Giliberti, C.; Bolchi, A.; Ferrari, D.; Locatelli, M.; Bianchi, V.; Boni, A.; De Munari, I.; Careri, M. Smart Immunosensors for Point-of-Care Serological Tests Aimed at Assessing Natural or Vaccine-Induced SARS-CoV-2 Immunity. Sensors 2022, 22, 5463. https://0-doi-org.brum.beds.ac.uk/10.3390/s22145463
Fortunati S, Giannetto M, Giliberti C, Bolchi A, Ferrari D, Locatelli M, Bianchi V, Boni A, De Munari I, Careri M. Smart Immunosensors for Point-of-Care Serological Tests Aimed at Assessing Natural or Vaccine-Induced SARS-CoV-2 Immunity. Sensors. 2022; 22(14):5463. https://0-doi-org.brum.beds.ac.uk/10.3390/s22145463
Chicago/Turabian StyleFortunati, Simone, Marco Giannetto, Chiara Giliberti, Angelo Bolchi, Davide Ferrari, Massimo Locatelli, Valentina Bianchi, Andrea Boni, Ilaria De Munari, and Maria Careri. 2022. "Smart Immunosensors for Point-of-Care Serological Tests Aimed at Assessing Natural or Vaccine-Induced SARS-CoV-2 Immunity" Sensors 22, no. 14: 5463. https://0-doi-org.brum.beds.ac.uk/10.3390/s22145463