
Intelligent System for Detecting Deterioration of Life Satisfaction as Tool for Remote Mental-Health Monitoring

Abstract
:1. Introduction
- Improve the objectivity of the test results;
- Reduce measurement uncertainty;
- Enable a more accurate estimation of the current state of quality of life;
- Make it possible to predict future values of quality of life;
- Make it possible to identify a trend to reverse the direction of unfavorable changes;
- Make it possible to build a family of solutions based on similar computational mechanisms.
2. Material and Methods
2.1. Materials
2.2. Methods
2.3. Statistical Analysis
2.4. Computational Methods
2.5. Algorithm of Data Processing
- In the rules—operation of aggregation of premises—PROD;
- Implication operator—MIN;
- Operation of accumulation, also called aggregation of results, from the rules—MAX;
- Operation of defuzzification-center of gravity (COG).
- -
- PSS10-Perceived Stress Score
- Interval of values XPSS = (0;40);
- Basic linguistic interpretation: the lower values mean the better situation;
- There is a suggestion of three potential output states in the specificity of the interpretation.
- -
- SWLS
- Interval of values XSWLS = (5;35);
- Basic linguistic interpretation: the higher values mean a better situation;
- In the specificity of the interpretation, there are suggestions of six potential output states, yet the numerical interval is quite narrow, so the context of the outputs was paired. Finally, three potential output states were defined.
- -
- NMQ-Nordic Musculoskeletal Questionnaire
- Range of values XNMQ = (0;40);
- General interpretation: the lower value means the better situation;
- The basics of the interpretation do not suggest any specific number of outputs.
- -
- “Emotional exhaustion” Xem
- Range of values Xem = (0;54);
- General interpretation: the lower value means a better psychological condition.
- -
- “Depersonalization” Xdep
- Range of values Xdep = (0;30);
- General interpretation: the lower value means a better psychological condition.
- -
- “Lack of personal achievements” Xachiev
- Range of values Xachiev = (0;48);
- General interpretation: the higher value means a better psychological condition, the opposite direction to the other MBI factors.
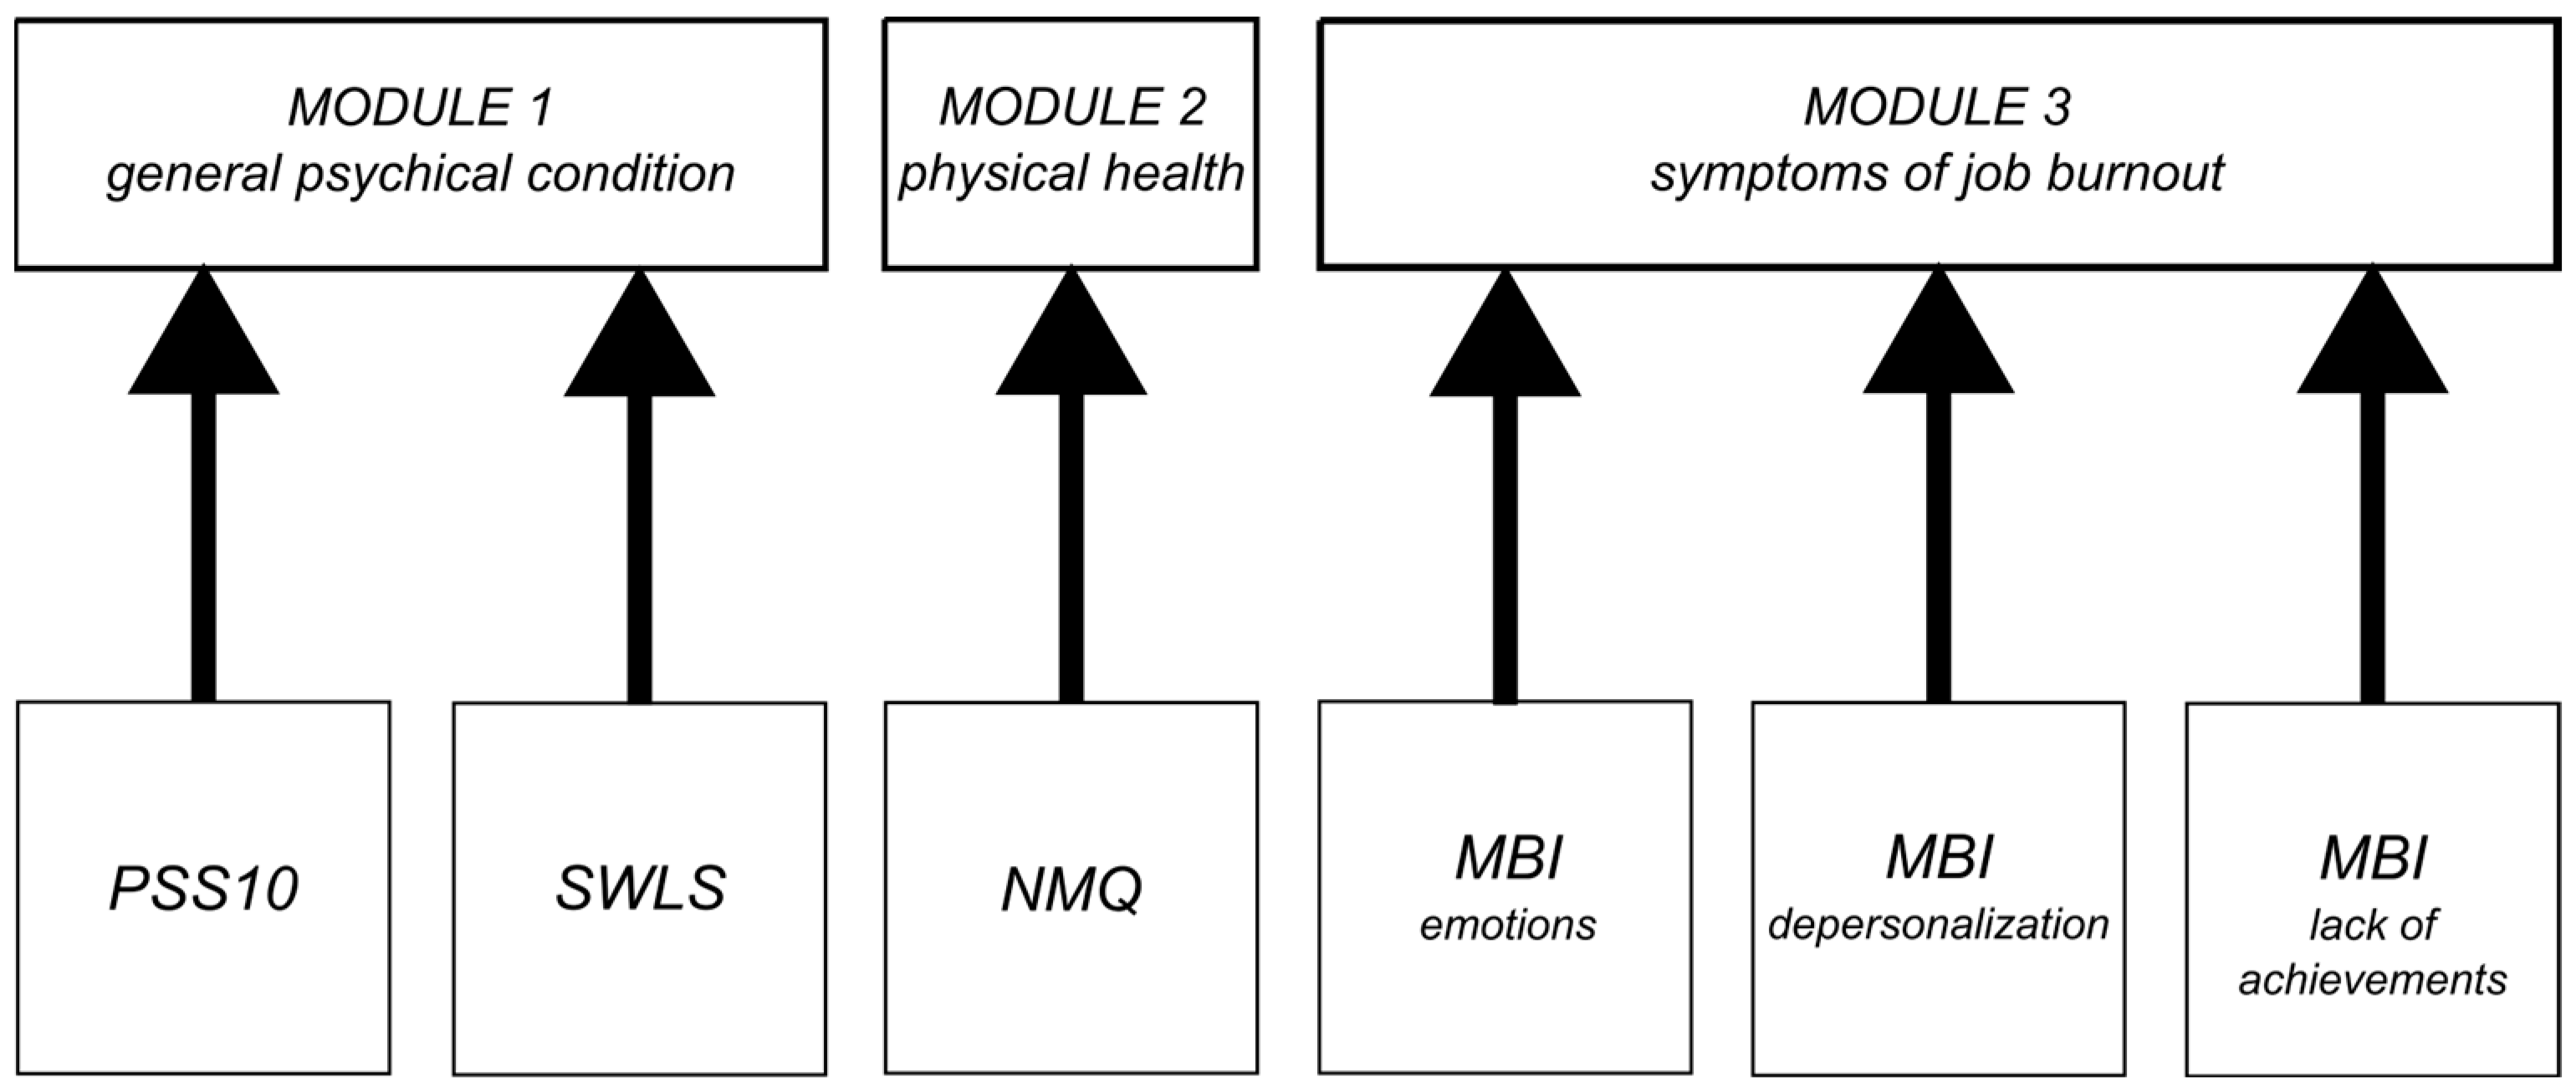
- PSS10 and SWLS–general opinion about the own life of the respondent.
- NMQ–physical state.
- MBI factors–job burnout.
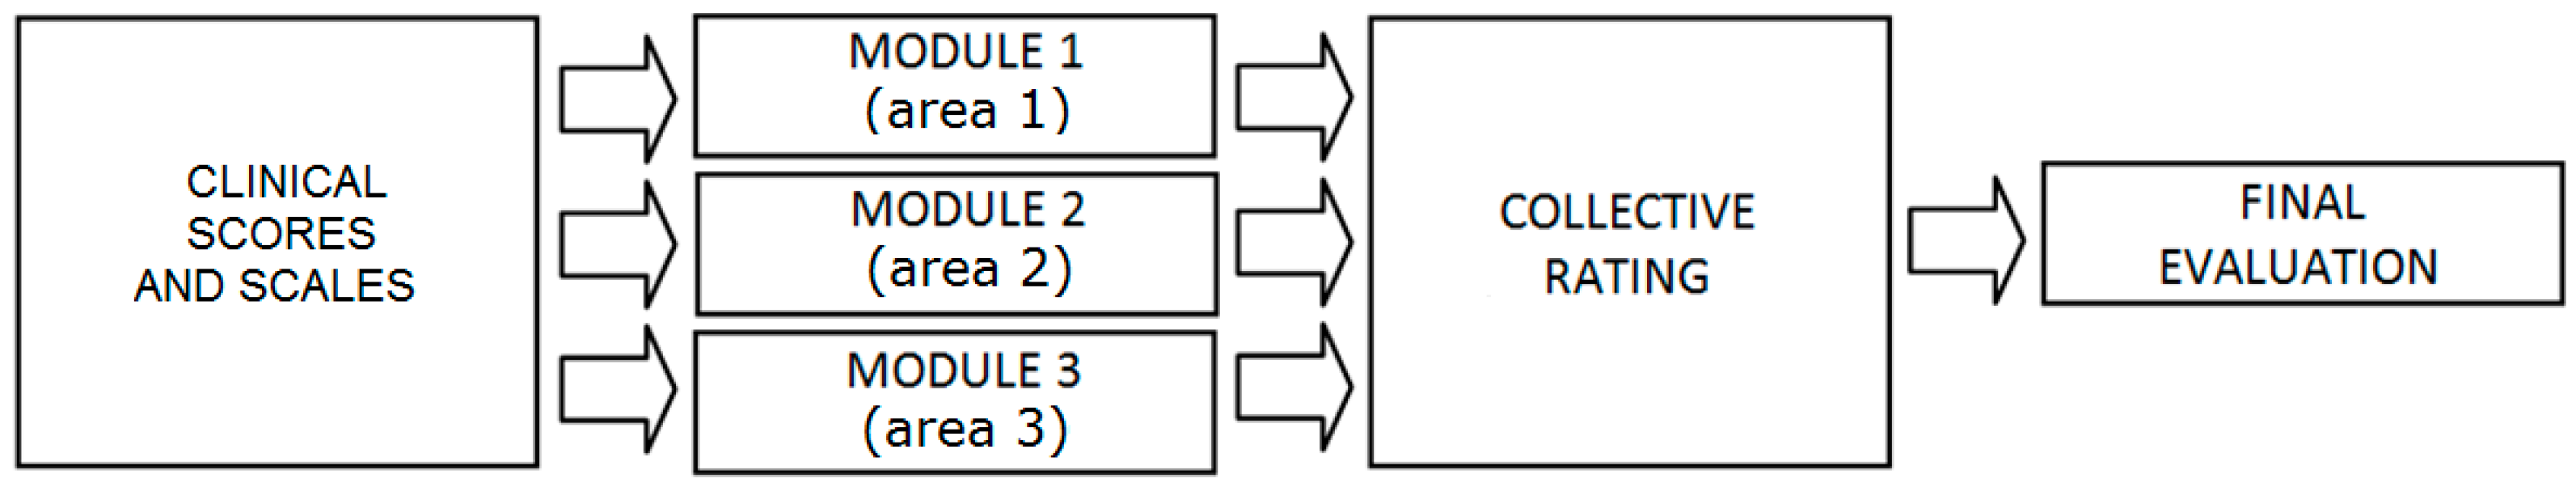
- Mental state assessment module-collecting data from PSS10 and SWLS;
- Physical condition assessment module that collects data from NMQ questionnaires;
- Burnout assessment module based on MBI, divided into three features: emotions, depersonalization, and lack of achievement; a simplified structure of the approach from the article by Prokopowicz and Mikołajewski [12].
3. Results
3.1. General Results
3.2. Fuzzy Evaluation Model
- Mental state assessment module, collecting data from PSS10 and SWLS;
- Burnout assessment module collecting data from MBI (in three areas: emotions, depersonalization and lack of achievement);
- A physical condition assessment module, collecting data from NMQ (Table 7).
4. Discussion
4.1. Comparison with Other Studies
- From a scientific point of view, our approach is not only technologically and cognitively new but also offers wider opportunities for development, opening up new research fields for computer science and computational neuroscience;
- From a practical (clinical) point of view, it is possible to screen faster and more widely for the changes in health associated with a faster pace of life and the emergence of problems on a global scale that can cause changes in mental health and health-related quality of life;
- From an economic point of view, the automation of early diagnosis may help to detect certain detrimental phenomena such as earlier burnout, implement prevention strategies, reduce absenteeism and improve work efficiency;
- From a societal point of view, it will enable the launch, in good time, of preventive and therapeutic actions at the level of entire communities, which may be necessary forsituations of massive, dynamic changes, such as a pandemic, an energy crisis, environmental pollution or the threat of war.
4.2. Limitations of the Own Study
4.3. Directions for Further Research
5. Conclusions
Author Contributions
Funding
Institutional Review Board Statement
Informed Consent Statement
Data Availability Statement
Conflicts of Interest
References
- Mezzi, R.; Yahyaoui, A.; Krir, M.W.; Boulila, W.; Koubaa, A. Mental Health Intent Recognition for Arabic-Speaking Patients Using the Mini International Neuropsychiatric Interview (MINI) and BERT Model. Sensors 2022, 22, 846. [Google Scholar] [CrossRef] [PubMed]
- Komatsu, H.; Watanabe, E.; Fukuchi, M. Psychiatric Neural Networks and Precision Therapeutics by Machine Learning. Biomedicines 2021, 9, 403. [Google Scholar] [CrossRef] [PubMed]
- Xie, B.; Tao, C.; Li, J.; Hilsabeck, R.C.; Aguirre, A. Artificial Intelligence for Caregivers of Persons With Alzheimer’s Disease and Related Dementias: Systematic Literature Review. JMIR Med. Inform. 2020, 8, e18189. [Google Scholar] [CrossRef] [PubMed]
- Saunders, S.; Muniz-Terrera, G.; Watson, J.; Clarke, C.L.; Luz, S.; Evans, A.R.; Ritchie, C.W. Participant outcomes and preferences in Alzheimer’s disease clinical trials: The electronic Person-Specific Outcome Measure (ePSOM) development program. Alzheimers Dement. 2018, 4, 694–702. [Google Scholar] [CrossRef] [PubMed]
- Bzdok, D.; Meyer-Lindenberg, A. Machine Learning for Precision Psychiatry: Opportunities and Challenges. Biol. Psychiatry Cognneurosci. Neuroimaging 2018, 3, 223–230. [Google Scholar] [CrossRef] [Green Version]
- Lin, E.; Tsai, S.J. Machine Learning in Neural Networks. Adv. Exp. Med. Biol. 2019, 1192, 127–137. [Google Scholar] [CrossRef]
- Jayatilake, S.M.D.A.C.; Ganegoda, G.U. Involvement of Machine Learning Tools in Healthcare Decision Making. J. Healthc Eng. 2021, 2021, 6679512. [Google Scholar] [CrossRef]
- Proto, E.; Rustichini, A. A Reassessment of the Relationship between GDP and Life Satisfaction. PLoS ONE 2013, 8, e79358. [Google Scholar] [CrossRef] [Green Version]
- Easterlin, R.A.; Angelescu, L. Happiness and growth the world over: Time series evidence on the happiness-income paradox. In IZA Discussion Papers; Institute for the Study of Labor (IZA): Bonn, Germany, 2009; Volume 4060, Available online: https://nbn-resolving.de/urn:nbn:de:101:1-20090327277 (accessed on 14 October 2022).
- Mi, Z.; Weipeng, L. Adaptability and Life Satisfaction: The Moderating Role of Social Support. Front. Psychol. 2016, 7, 1134. Available online: https://www.frontiersin.org/article/10.3389/fpsyg.2016.01134 (accessed on 14 October 2022).
- Ruggeri, K.; Garcia-Garzon, E.; Maguire, Á.; Matz, S.; Huppert, F.A. Well-being is more than happiness and life satisfaction: A multidimensional analysis of 21 countries. Health Qual. Life Outcomes 2020, 18, 192. [Google Scholar] [CrossRef]
- Krys, K.; Park, J.; Kocimska-Zych, A.; Kosiarczyk, A.; Selim, H.A.; Wojtczuk-Turek, A.; Haas, B.W.; Uchida, Y.; Torres, C.; Capaldi, C.A.; et al. Personal Life Satisfaction as a Measure of Societal Happiness is an Individualistic Presumption: Evidence from Fifty Countries. J. Happiness Stud. 2021, 22, 2197–2214. [Google Scholar] [CrossRef]
- Mikołajewska, E. Work-related musculoskeletal injuries in physiotherapists. Med. Pract. 2013, 64, 681–687. [Google Scholar] [CrossRef] [PubMed] [Green Version]
- Mikołajewska, E. Strategies of prevention of the work-related injuries in physiotherapists. Med Pract. 2016, 67, 673–679. [Google Scholar] [CrossRef] [PubMed] [Green Version]
- Mikołajewski, D.; Prokopowicz, P. Effect of COVID-19 on selected characteristics of life satisfaction reflected in a fuzzy model. Appl. Sci. 2022, 12, 7376. [Google Scholar] [CrossRef]
- Zadeh, L. Fuzzy sets. Inf. Control. 1965, 8, 338–353. [Google Scholar] [CrossRef] [Green Version]
- Zadeh, L. From computing with numbers to computing with words—From manipulation of measurements to manipulation of perceptions. Int. J. Appl. Math. Comput. Sci. 2002, 12, 307–324. [Google Scholar]
- Prokopowicz, P. The use of Ordered Fuzzy Numbers for modeling changes in dynamic processes. Information Sciences 2019, 470, 1–14. [Google Scholar] [CrossRef]
- Prokopowicz, P.; Mikołajewski, D.; Tyburek, K.; Mikołajewska, E. Computational gait analysis for post-stroke rehabilitation purposes using fuzzy numbers, fractal dimension and neural networks. Bull. Pol. Acad. Sci. Tech. Sci. 2020, 68, 191–198. [Google Scholar]
- Mikołajewska, E.; Prokopowicz, P.; Mikołajewski, D. Computational gait analysis using fuzzy logic for everyday clinical purposes—Preliminary findings. Bio-Algorithms Med-Syst. 2017, 13, 37–42. [Google Scholar] [CrossRef]
- Prokopowicz, P.; Mikołajewski, D. Fuzzy Approach to Computational Classification of Burnout—Preliminary Findings. Appl. Sci. 2022, 12, 3767. [Google Scholar] [CrossRef]
- Prokopowicz, P.; Mikołajewski, D.; Tyburek, K.; Mikołajewska, E.; Kotlarz, P. AI-Based Analysis of SelectedGaitParameters in Post-stroke Patients. In Image Processing and Communications: Techniques, Algorithms and Applications; Choraś, M., Choraś, R.S., Eds.; Advances in Intelligent Systems and Computing Book Series; Springer: Cham, Switzerland, 2020; Volume 1062, pp. 197–205. [Google Scholar] [CrossRef]
- Prokopowicz, P.; Mikołajewski, D.; Mikołajewska, E.; Kotlarz, P. Fuzzy System as anAssessmentTool for Analysis of the Health-RelatedQuality of Life for the People afterStroke. In Proceedings of the ArtificialIntelligence and SoftComputing: 16th International Conference, ICAISC 2017, Part I, Zakopane, Poland, 11–15June 2017; Rutkowski, L., Korytkowski, M., Scherer, R., Tadeusiewicz, R., Zadeh, L.A., Zurada, J.M., Eds.; Lecture Notes in Artificial Intelligence Book Series. Springer: Cham, Switzerland, 2017; pp. 710–721. [Google Scholar] [CrossRef]
- Cohen, S.; Kamarck, T.; Mermelstein, R. A global measure of perceived stress. J. Health Soc. Behav. 1983, 24, 385–396. [Google Scholar] [CrossRef] [PubMed]
- Maslach, C.; Jackson, S.E. The Measurement of Experienced Burnout. J. Organ. Behav. 1981, 2, 99–113. [Google Scholar] [CrossRef]
- Diener, E.; Emmons, R.A.; Larsen, R.J.; Griffin, S. The Satisfaction with Life Scale. J. Pers. Assess. 1985, 49, 71–75. [Google Scholar] [CrossRef] [PubMed]
- Crawford, J.O. The Nordic Musculoskeletal Questionnaire. Occup. Med. 2007, 57, 300–301. [Google Scholar] [CrossRef] [Green Version]
- Baik, S.H.; Fox, R.S.; Mills, S.D.; Roesch, S.C.; Sadler, G.R.; Klonoff, E.A.; Malcarne, V.L. Reliability and validity of the Perceived Stress Scale-10 in Hispanic Americans with English or Spanish language preference. J. Health Psychol. 2019, 24, 628–639. [Google Scholar] [CrossRef] [PubMed]
- Wickramasinghe, N.D.; Dissanayake, D.S.; Abeywardena, G.S. Validity and reliability of the Maslach Burnout Inventory-Student Survey in Sri Lanka. BMC Psychol. 2018, 6, 52. [Google Scholar] [CrossRef]
- 30. Descatha, A.; Roquelaure, Y.; Chastang, J.F.; Evanoff, B.; Melchior, M.; Mariot, C.; Ha, C.; Imbernon, E.; Goldberg, M.; Leclerc, A. Validity of Nordic-style questionnaires in the surveillance of upper-limb work-related musculoskeletal disorders. Scand. J. Work Environ. Health. 2007, 33, 58–65. [Google Scholar] [CrossRef] [Green Version]
- López-Ortega, M.; Torres-Castro, S.; Rosas-Carrasco, O. Psychometric properties of the Satisfaction with Life Scale (SWLS): Secondary analysis of the Mexican Health and Aging Study. Health Qual. Life Outcomes 2016, 14, 170. [Google Scholar] [CrossRef] [Green Version]
- Bavel, J.J.V.; Baicker, K.; Boggio, P.S.; Capraro, V.; Cichocka, A.; Cikara, M.; Crockett, M.J.; Crum, A.J.; Douglas, K.M.; Druckman, J.N.; et al. Using social and behavioural science to support COVID-19 pandemic response. Nat. Hum. Behav. 2020, 4, 460–471. [Google Scholar] [CrossRef]
- Szcześniak, D.; Gładka, A.; Misiak, B.; Cyran, A.; Rymaszewska, J. The SARS-CoV-2 and mental health: From biological mechanisms to social consequences. Prog. Neuropsychopharmacol. Biol. Psychiatry. 2021, 104, 110046. [Google Scholar] [CrossRef]
- Galanis, P.; Vraka, I.; Fragkou, D.; Bilali, A.; Kaitelidou, D. Nurses’ burnout and associated risk factors during the COVID-19 pandemic: A systematic review and meta-analysis. J. Adv. Nurs. 2021, 77, 3286–3302. [Google Scholar] [CrossRef] [PubMed]
- Jácome, C.; Seixas, A.; Serrão, C.; Teixeira, A.; Castro, L.; Duarte, I. Burnout in Portuguese physiotherapists during COVID-19 pandemic. Physiother. Res. Int. 2021, 26, e1915. [Google Scholar] [CrossRef] [PubMed]
- de Sire, A.; Marotta, N.; Raimo, S.; Lippi, L.; Inzitari, M.T.; Tasselli, A.; Gimigliano, A.; Palermo, L.; Invernizzi, M.; Ammendolia, A. Psychological Distress and Work Environment Perception by Physical Therapists from Southern Italy during COVID-19 Pandemic: The C.A.L.A.B.R.I.A Study. Int. J. Environ. Res. Public Health 2021, 18, 9676. [Google Scholar] [CrossRef] [PubMed]
- Didkowska, J.A.; Barańska, K.; Wojciechowska, U.; Tyczyński, J.E. War in Ukraine creates challenges for the cancer care system in Poland. Lancet Oncol. 2022, 22, 00384–00389. [Google Scholar] [CrossRef] [PubMed]
- Ociepa-Kicińska, E.; Gorzałczyńska-Koczkodaj, M. Forms of Aid Provided to Refugees of the 2022 Russia-Ukraine War: The Case of Poland. Int. J. Environ. Res. Public Health 2022, 19, 7085. [Google Scholar] [CrossRef]
- Keebayoon, A.; Mungmunpuntipantip, R.; Wiwanitkit, V. Ukraine, war and cardiac surgical practice: Correspondence. Cardiol. Young 2022, 32, 1191. [Google Scholar] [CrossRef]
- Keebayoon, A.; Mungmunpuntipantip, R.; Wiwanitkit, V. War in Ukraine and women’s and perinatal health: Correspondence. Sex Reprod. Healthc. 2022, 33, 100750. [Google Scholar] [CrossRef]
- Jain, N.; Prasad, S.; Czárth, Z.C.; Chodnekar, S.Y.; Mohan, S.; Savchenko, E.; Panag, D.S.; Tanasov, A.; Betka, M.M.; Platos, E.; et al. War Psychiatry: Identifying and Managing the Neuropsychiatric Consequences of Armed Conflicts. J. Prim. Care Community Health 2022, 13, 21501319221106625. [Google Scholar] [CrossRef]
- Levy, B.S.; Leaning, J. Russia’s War in Ukraine—The Devastation of Health and Human Rights. N. Engl. J. Med. 2022, 387, 102–105. [Google Scholar] [CrossRef]
- Thukral, S.; Rana, V. Versatility of fuzzy logic in chronic diseases: A review. Med. Hypotheses 2019, 122, 150–156. [Google Scholar] [CrossRef]
- Azar, A.T.; Hassanien, A.E. Scientific Research Group in Egypt (SRGE). Editorial on: Fuzzy Logic in Biomedicine. Comput. Biol. Med. 2015, 64, 321–322. [Google Scholar] [CrossRef]
- Kosiński, W.; Prokopowicz, P.; Rosa, A. Defuzzification Functionals of Ordered Fuzzy Numbers. IEEE Trans. Fuzzy Syst. 2013, 21, 1163–1169. [Google Scholar] [CrossRef]
- Ahmadi, H.; Gholamzadeh, M.; Shahmoradi, L.; Nilashi, M.; Rashvand, P. Diseases diagnosis using fuzzy logic methods: A systematic and meta-analysis review. Comput Methods Programs Biomed. 2018, 161, 145–172. [Google Scholar] [CrossRef]
- Hernández-Julio, Y.F.; Prieto-Guevara, M.J.; Nieto-Bernal, W.; Meriño-Fuentes, I.; Guerrero-Avendaño, A. Framework for the Development of Data-Driven Mamdani-Type Fuzzy Clinical Decision Support Systems. Diagnostics 2019, 9, 52. [Google Scholar] [CrossRef] [PubMed] [Green Version]
- Farzandipour, M.; Nabovati, E.; Saeedi, S.; Fakharian, E. Fuzzy decision support systems to diagnose musculoskeletal disorders: A systematic literature review. Comput. Methods Programs Biomed. 2018, 163, 101–109. [Google Scholar] [CrossRef]
- Rojek, I.; Mikołajewski, D.; Dostatni, E. Digital twins in product lifecycle for sustainability in manufacturing and maintenance. Appl. Sci. 2021, 11, 31. [Google Scholar] [CrossRef]
- Rojek, I.; Mikołajewski, D.; Dostatni, E.; Macko, M. AI-optimized technological aspects of the material used in 3D printing processes for selected medical applications. Materials 2020, 13, 5437. [Google Scholar] [CrossRef]
- Taylor, M.L.; Thomas, E.E.; Snoswell, C.L.; Smith, A.C.; Caffery, L.J. Does remote patient monitoring reduce acute care use? A systematic review. BMJ Open 2021, 11, e040232. [Google Scholar] [CrossRef] [PubMed]
- Markiewicz, R.; Masiak, J. Evaluation of cognitive deficits in schizophrenia using event-related potentials and rehabilitation influences using EEG biofeedback in patients diagnosed with schizophrenia. Psychiatr. Pol. 2019, 53, 1261–1273. [Google Scholar] [CrossRef]
- Byeon, H. Influence of the COVID-19 Pandemic on the Subjective Life Satisfaction of South Korean Adults: Bayesian Nomogram Approach. Diagnostics 2022, 12, 761. [Google Scholar] [CrossRef]
- Kosinski, W.; Prokopowicz, P. Fuzziness—Representation of dynamicchanges? InNew Dimensions in Fuzzy Logic and Related Technologies; Stepnicka, M., Novak, V., Bodenhofer, U., Eds.; University of Ostrava: Ostrava, Czechia, 2007; Volume I, pp. 449–456. [Google Scholar]
- Prokopowicz, P.; Golsefid, S.M.M. Aggregation Operator for Ordered Fuzzy Numbers Concerning the Direction. In Lecture Notes in Computer Science, Proceedings of the ArtificialIntelligence and Soft Computing, ICAISC 2014, Zakopane, Poland, 1–5 June 2014; Rutkowski, L., Korytkowski, M., Scherer, R., Tadeusiewicz, R., Zadeh, L.A., Zurada, J.M., Eds.; Springer: Cham, Switzerland, 2014; Volume 8467. [Google Scholar] [CrossRef]
- Prokopowicz, P.; Czerniak, J.; Mikołajewski, D.; Apiecionek, Ł.; Ślęzak, D. Theory and Applications of Ordered Fuzzy Number: A Tribute to Professor Witold Kosiński. In Studies in Fuzziness and Soft Computing; Springer: Berlin/Heidelberg, Germany, 2017; Volume 356. [Google Scholar]
- Clemente-Suárez, V.J.; Navarro-Jiménez, E.; Ruisoto, P.; Dalamitros, A.A.; Beltran-Velasco, A.I.; Hormeño-Holgado, A.; Laborde-Cárdenas, C.C.; Tornero-Aguilera, J.F. Performance of Fuzzy Multi-Criteria Decision Analysis of Emergency System in COVID-19 Pandemic. An Extensive Narrative Review. Int. J. Environ. Res. Public Health 2021, 18, 5208. [Google Scholar] [CrossRef] [PubMed]
- Zaidan, A.A.; Zaidan, B.B.; Al-Haiqi, A.; Kiah, M.L.; Hussain, M.; Abdulnabi, M. Evaluation and selection of open-source EMR software packages based on integrated AHP and TOPSIS. J. Biomed. Inform. 2015, 53, 390–404. [Google Scholar] [CrossRef] [PubMed] [Green Version]
- Maija, K.; Katri, K. The moral orders of work and health: A case of sick leave due to burnout. Sociol. Health Illn. 2019, 41, 219–233. [Google Scholar] [CrossRef]
- Dong, J.; Yan, S. A Multicriteria Approach for Measuring Employee Well-Being. Front. Psychol. 2022, 13, 795960. [Google Scholar] [CrossRef] [PubMed]
- Na, H.; Park, S.; Dong, S.-Y. Mixed Reality-Based Interaction between Human and Virtual Cat for Mental Stress Management. Sensors 2022, 22, 1159. [Google Scholar] [CrossRef] [PubMed]
- Rahimi Sardo, F.; Rayegani, A.; Matin Nazar, A.; Balaghiinaloo, M.; Saberian, M.; Mohsan, S.A.H.; Alsharif, M.H.; Cho, H.S. Recent Progress of Triboelectric Nanogenerators for Biomedical Sensors: From Design to Application. Biosensors 2022, 12, 697. [Google Scholar] [CrossRef] [PubMed]


| Study Group | Reference Group | |
|---|---|---|
| (n = 20, 100%) | (n = 20, 100%) | |
| Age [years] | ||
| Mean | 27.40 | 26.55 |
| SD | 3.89 | 4.06 |
| Min | 22 | 22 |
| Q1 | 24 | 23.5 |
| Median | 24 | 25.5 |
| Q3 | 29.5 | 28 |
| Max | 34 | 35 |
| Seniority [years] | ||
| Mean | 3.45 | 3.6 |
| SD | 2.61 | 2.52 |
| Min | 1 | 1 |
| Q1 | 1 | 2 |
| Median | 3 | 3 |
| Q3 | 5.5 | 4.5 |
| Max | 8 | 9 |
| Gender: | ||
| Females (F) | 8 (40%) | 9 (45%) |
| Males (M) | 12 (60%) | 11 (55%) |
| Scale Name | Change Direction | Test Scoring |
|---|---|---|
| PSS10 | a higher score means higher stress | 1–4: low, 5–6 moderate, 7–10: high |
| MBI | a higher score means higher stress | Three subscales are measured separately: (1) emotional exhaustion (9 items), (2) depersonalization (5 items), (3) personal achievements (8 items) |
| SWLS | a higher score means a higher quality of life | whole range is 5–35, where 5–9 extremely dissatisfied with life, 20 neutral, 31–35 extremely satisfied with life |
| NMQ | a higher score means a higher number of pain problems | how often problems with locomotion are observed |
| Scale | PSS10 | MBI | SWLS | NMQ |
|---|---|---|---|---|
| Before COVID | ||||
| Mean | 29.20 | 48.75 | 16.3 | 0.70 |
| SD | 2.71 | 15.50 | 3.57 | 0.73 |
| Min | 25 | 32 | 12 | 0 |
| Q1 | 28 | 37.5 | 14.25 | 0 |
| Median | 28 | 45.5 | 25.5 | 1 |
| Q3 | 31.25 | 53.75 | 17 | 1 |
| Max | 34 | 79 | 25 | 2 |
| Distribution | not normal | not normal | not normal | not normal |
| After COVID | ||||
| Mean | 30.85 | 56.75 | 14.90 | 0.70 |
| SD | 2.25 | 12.67 | 3.42 | 0.73 |
| Min | 27 | 40 | 11 | 0 |
| Q1 | 30 | 44.25 | 13 | 0 |
| Median | 30.5 | 54.5 | 14 | 1 |
| Q3 | 32.25 | 65.25 | 15.25 | 1 |
| Max | 35 | 79 | 25 | 2 |
| Distribution | Normal | not normal | not normal | not normal |
| During War in the Neighboring Country | ||||
| Mean | 33.2 | 63.50 | 10.95 | 0.55 |
| SD | 2.19 | 8.99 | 2.26 | 0.61 |
| Min | 30 | 50 | 8 | 0 |
| Q1 | 32 | 55 | 10 | 0 |
| Median | 33 | 62.5 | 10 | 0.5 |
| Q3 | 35 | 69.25 | 13 | 1 |
| Max | 37 | 78 | 17 | 2 |
| Distribution | Normal | normal | not normal | not normal |
| Scale | PSS10 | MBI | SWLS | NMQ |
|---|---|---|---|---|
| Before COVID | ||||
| Mean | 18.55 | 17.25 | 53.55 | 0.45 |
| SD | 3.50 | 2.94 | 17.55 | 0.51 |
| Min | 10 | 14 | 25 | 0 |
| Q1 | 16 | 15 | 42.5 | 0 |
| Median | 19.5 | 16.5 | 56.5 | 0 |
| Q3 | 20.25 | 18.5 | 69 | 1 |
| Max | 24 | 24 | 77 | 1 |
| Distribution | Normal | not normal | not normal | not normal |
| After COVID | ||||
| Mean | 16.1 | 13.95 | 62.5 | 0.50 |
| SD | 2.75 | 2.42 | 16.39 | 0.51 |
| Min | 10 | 10 | 41 | 0 |
| Q1 | 15 | 12.5 | 49.5 | 0 |
| Median | 16 | 13.5 | 60 | 0.5 |
| Q3 | 18 | 15 | 76.75 | 1 |
| Max | 21 | 20 | 87 | 1 |
| Distribution | Normal | not normal | not normal | not normal |
| During War in the Neighboring Country | ||||
| Mean | 18.05 | 16.10 | 55.95 | 0.50 |
| SD | 3.53 | 2.10 | 14.06 | 0.51 |
| Min | 11 | 13 | 36 | 0 |
| Q1 | 16 | 14 | 42.5 | 0 |
| Median | 17,5 | 16 | 52 | 0.5 |
| Q3 | 20 | 18 | 69.5 | 1 |
| Max | 24 | 20 | 79 | 1 |
| Distribution | Normal | normal | normal | not normal |
| Before COVID | ||||
|---|---|---|---|---|
| Scale | PSS10 | MBI | SWLS | NMQ |
| PSS10 | - | 0.480 p = 0.032 | n.s. | n.s. |
| MBI | 0.480 p = 0.032 | - | n.s | n.s. |
| SWLS | n.s. | n.s. | - | n.s. |
| NMQ | n.s. | n.s. | n.s. | - |
| After COVID | ||||
| PSS10 | - | 0.563 p = 0.009 | n.s | n.s. |
| MBI | 0.563 p = 0.009 | - | −0.437 p = 0.044 | n.s. |
| SWLS | n.s. | −0.437 p = 0.044 | - | n.s. |
| NMQ | n.s. | n.s. | n.s. | - |
| During War in the Neighboring Country | ||||
| PSS10 | - | n.s | 0.462 p = 0.040 | n.s. |
| MBI | n.s. | - | n.s. | n.s. |
| SWLS | 0.462 p = 0.040 | n.s. | - | n.s. |
| NMQ | n.s. | n.s. | n.s. | - |
| Before COVID | ||||
|---|---|---|---|---|
| Scale | PSS10 | MBI | SWLS | NMQ |
| PSS10 | - | n.s. | n.s. | 0.264 p = 0.026 |
| MBI | n.s. | - | n.s | −0.257 p = 0.027 |
| SWLS | n.s. | n.s. | - | 0.811 p = 0.000 |
| NMQ | 0.264 p = 0.026 | −0.257 p = 0.027 | 0.811 p = 0.000 | - |
| After COVID | ||||
| PSS10 | - | n.s. | n.s | n.s. |
| MBI | n.s. | - | n.s. | n.s. |
| SWLS | n.s. | n.s. | - | 0.590 p = 0.006 |
| NMQ | n.s. | n.s. | 0.590 p = 0.006 | - |
| During War in the Neighboring Country | ||||
| PSS10 | - | n.s | n.s. | 0.297 p = 0.020 |
| MBI | n.s. | - | n.s. | n.s. |
| SWLS | n.s. | n.s. | - | 0.792 p = 0.000 |
| NMQ | 0.297 p = 0.020 | n.s | 0.792 p = 0.000 | - |
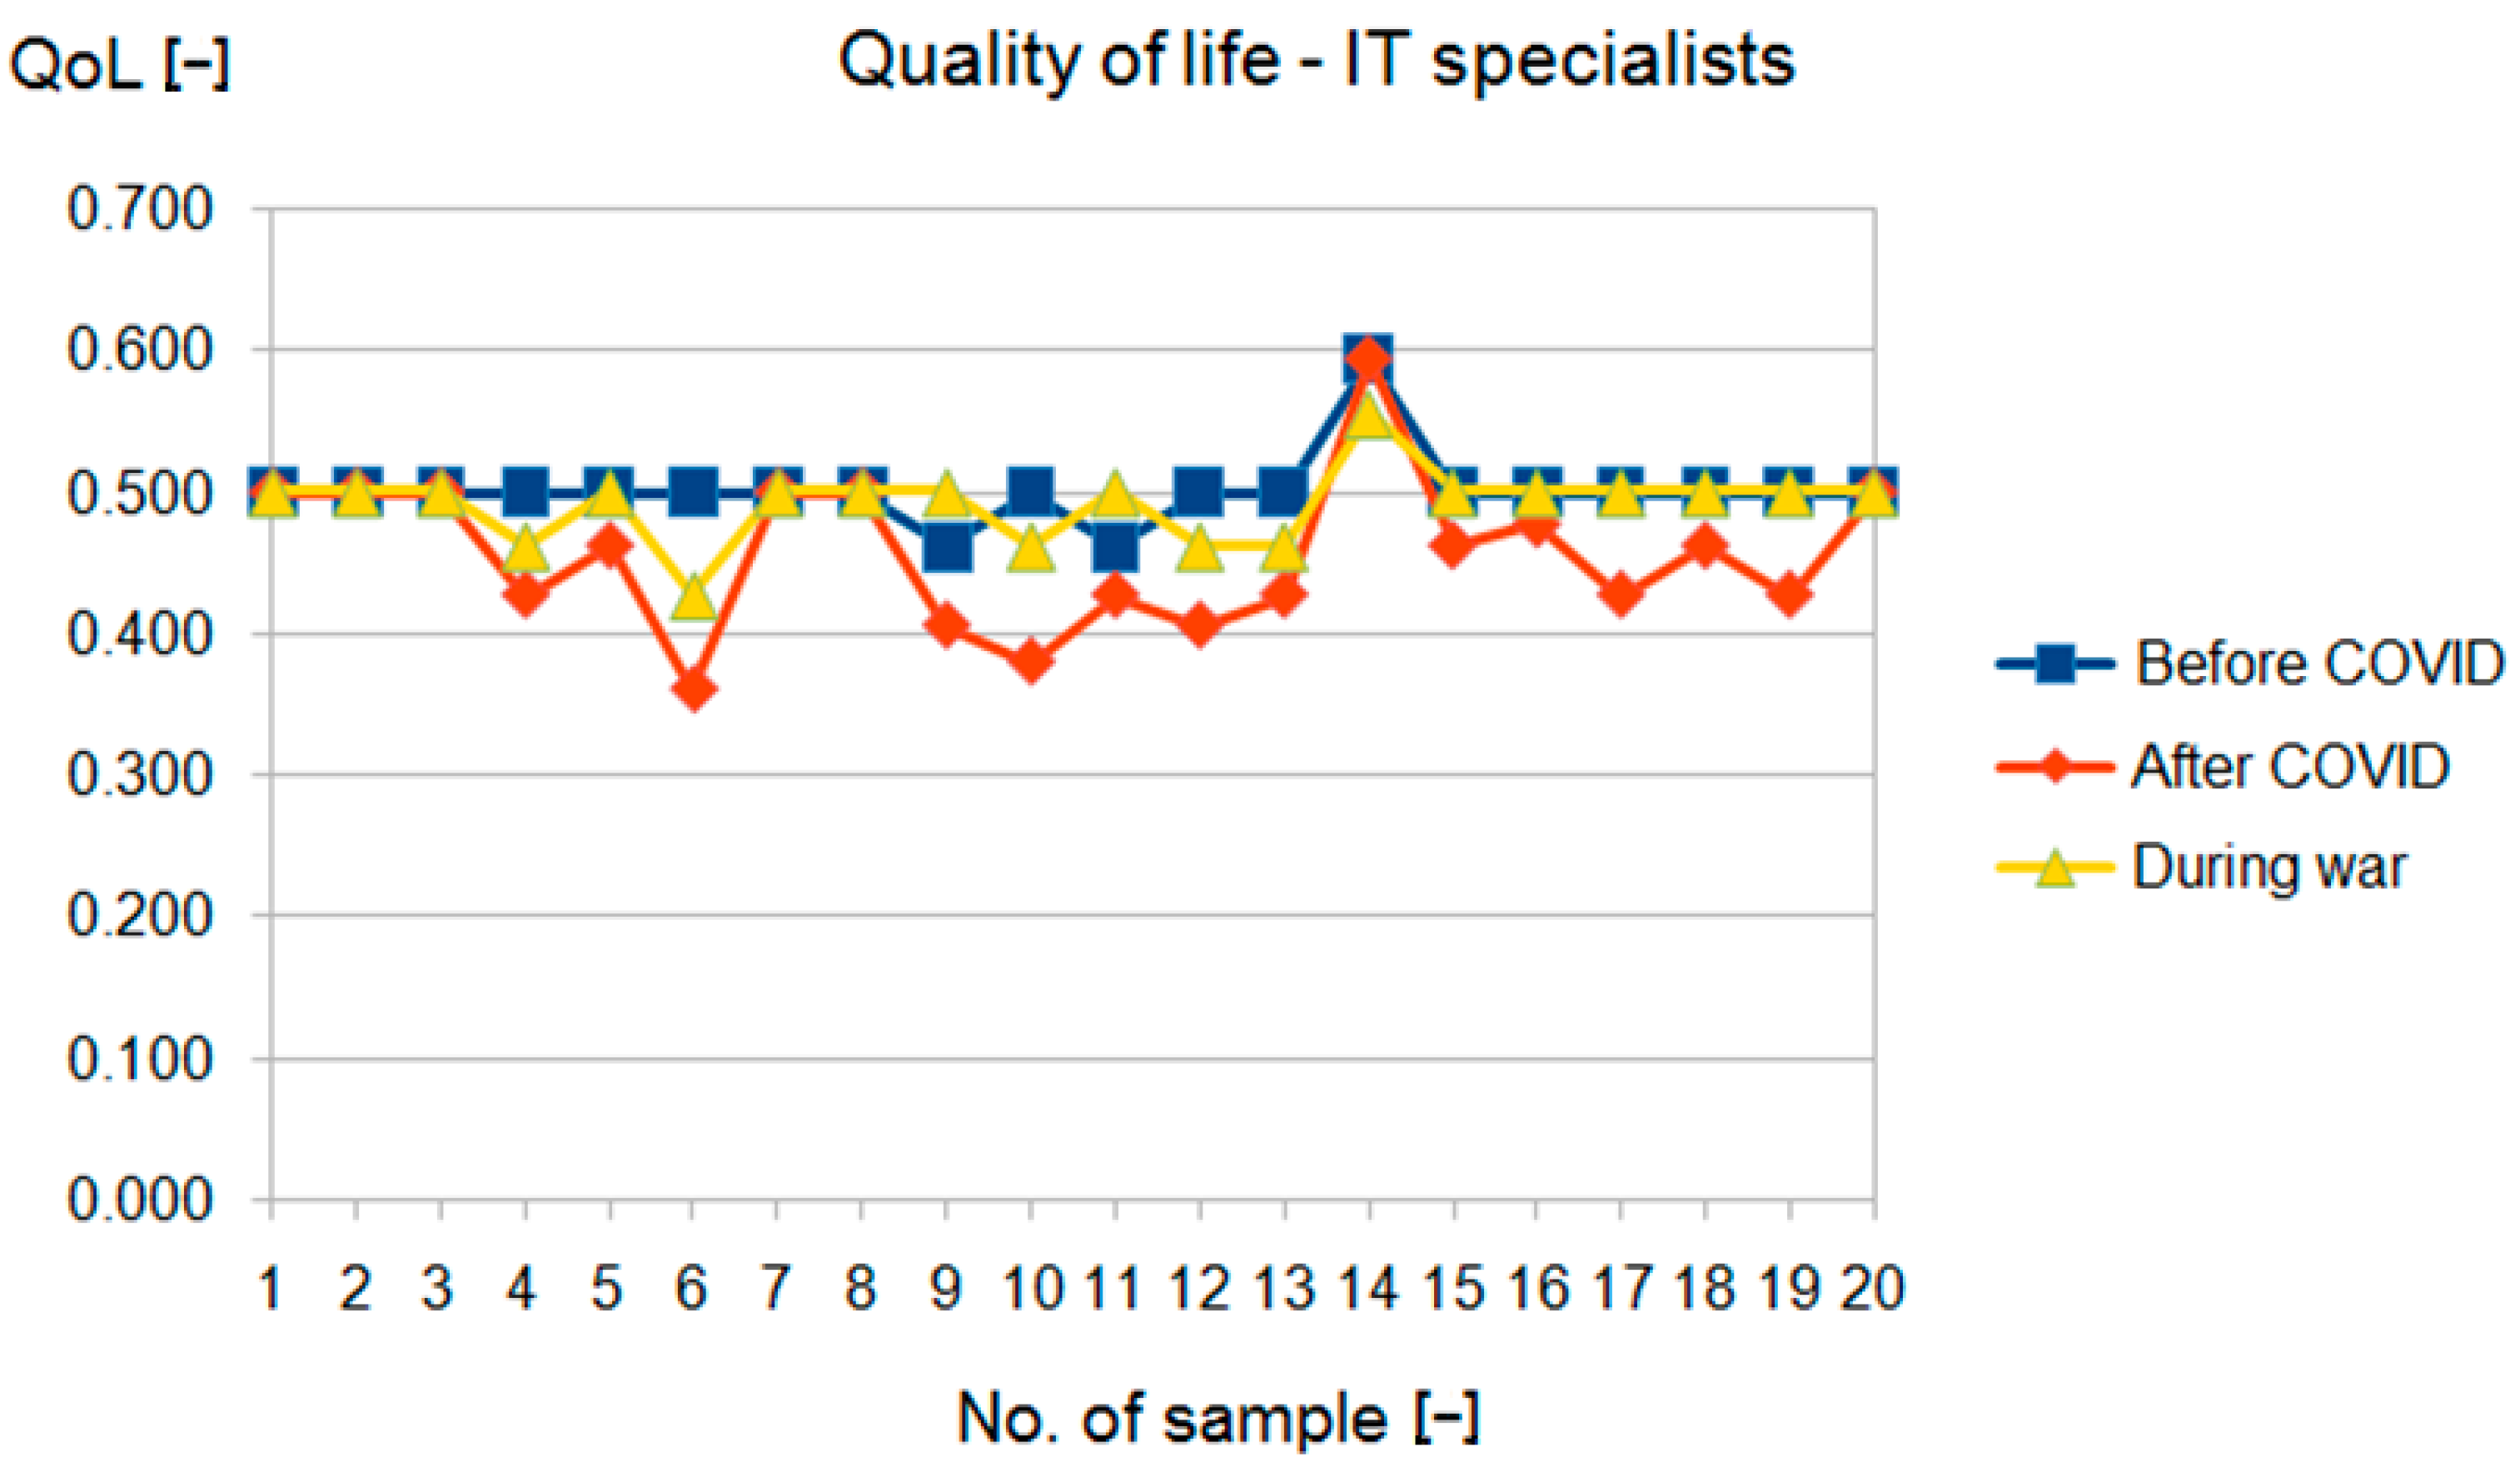
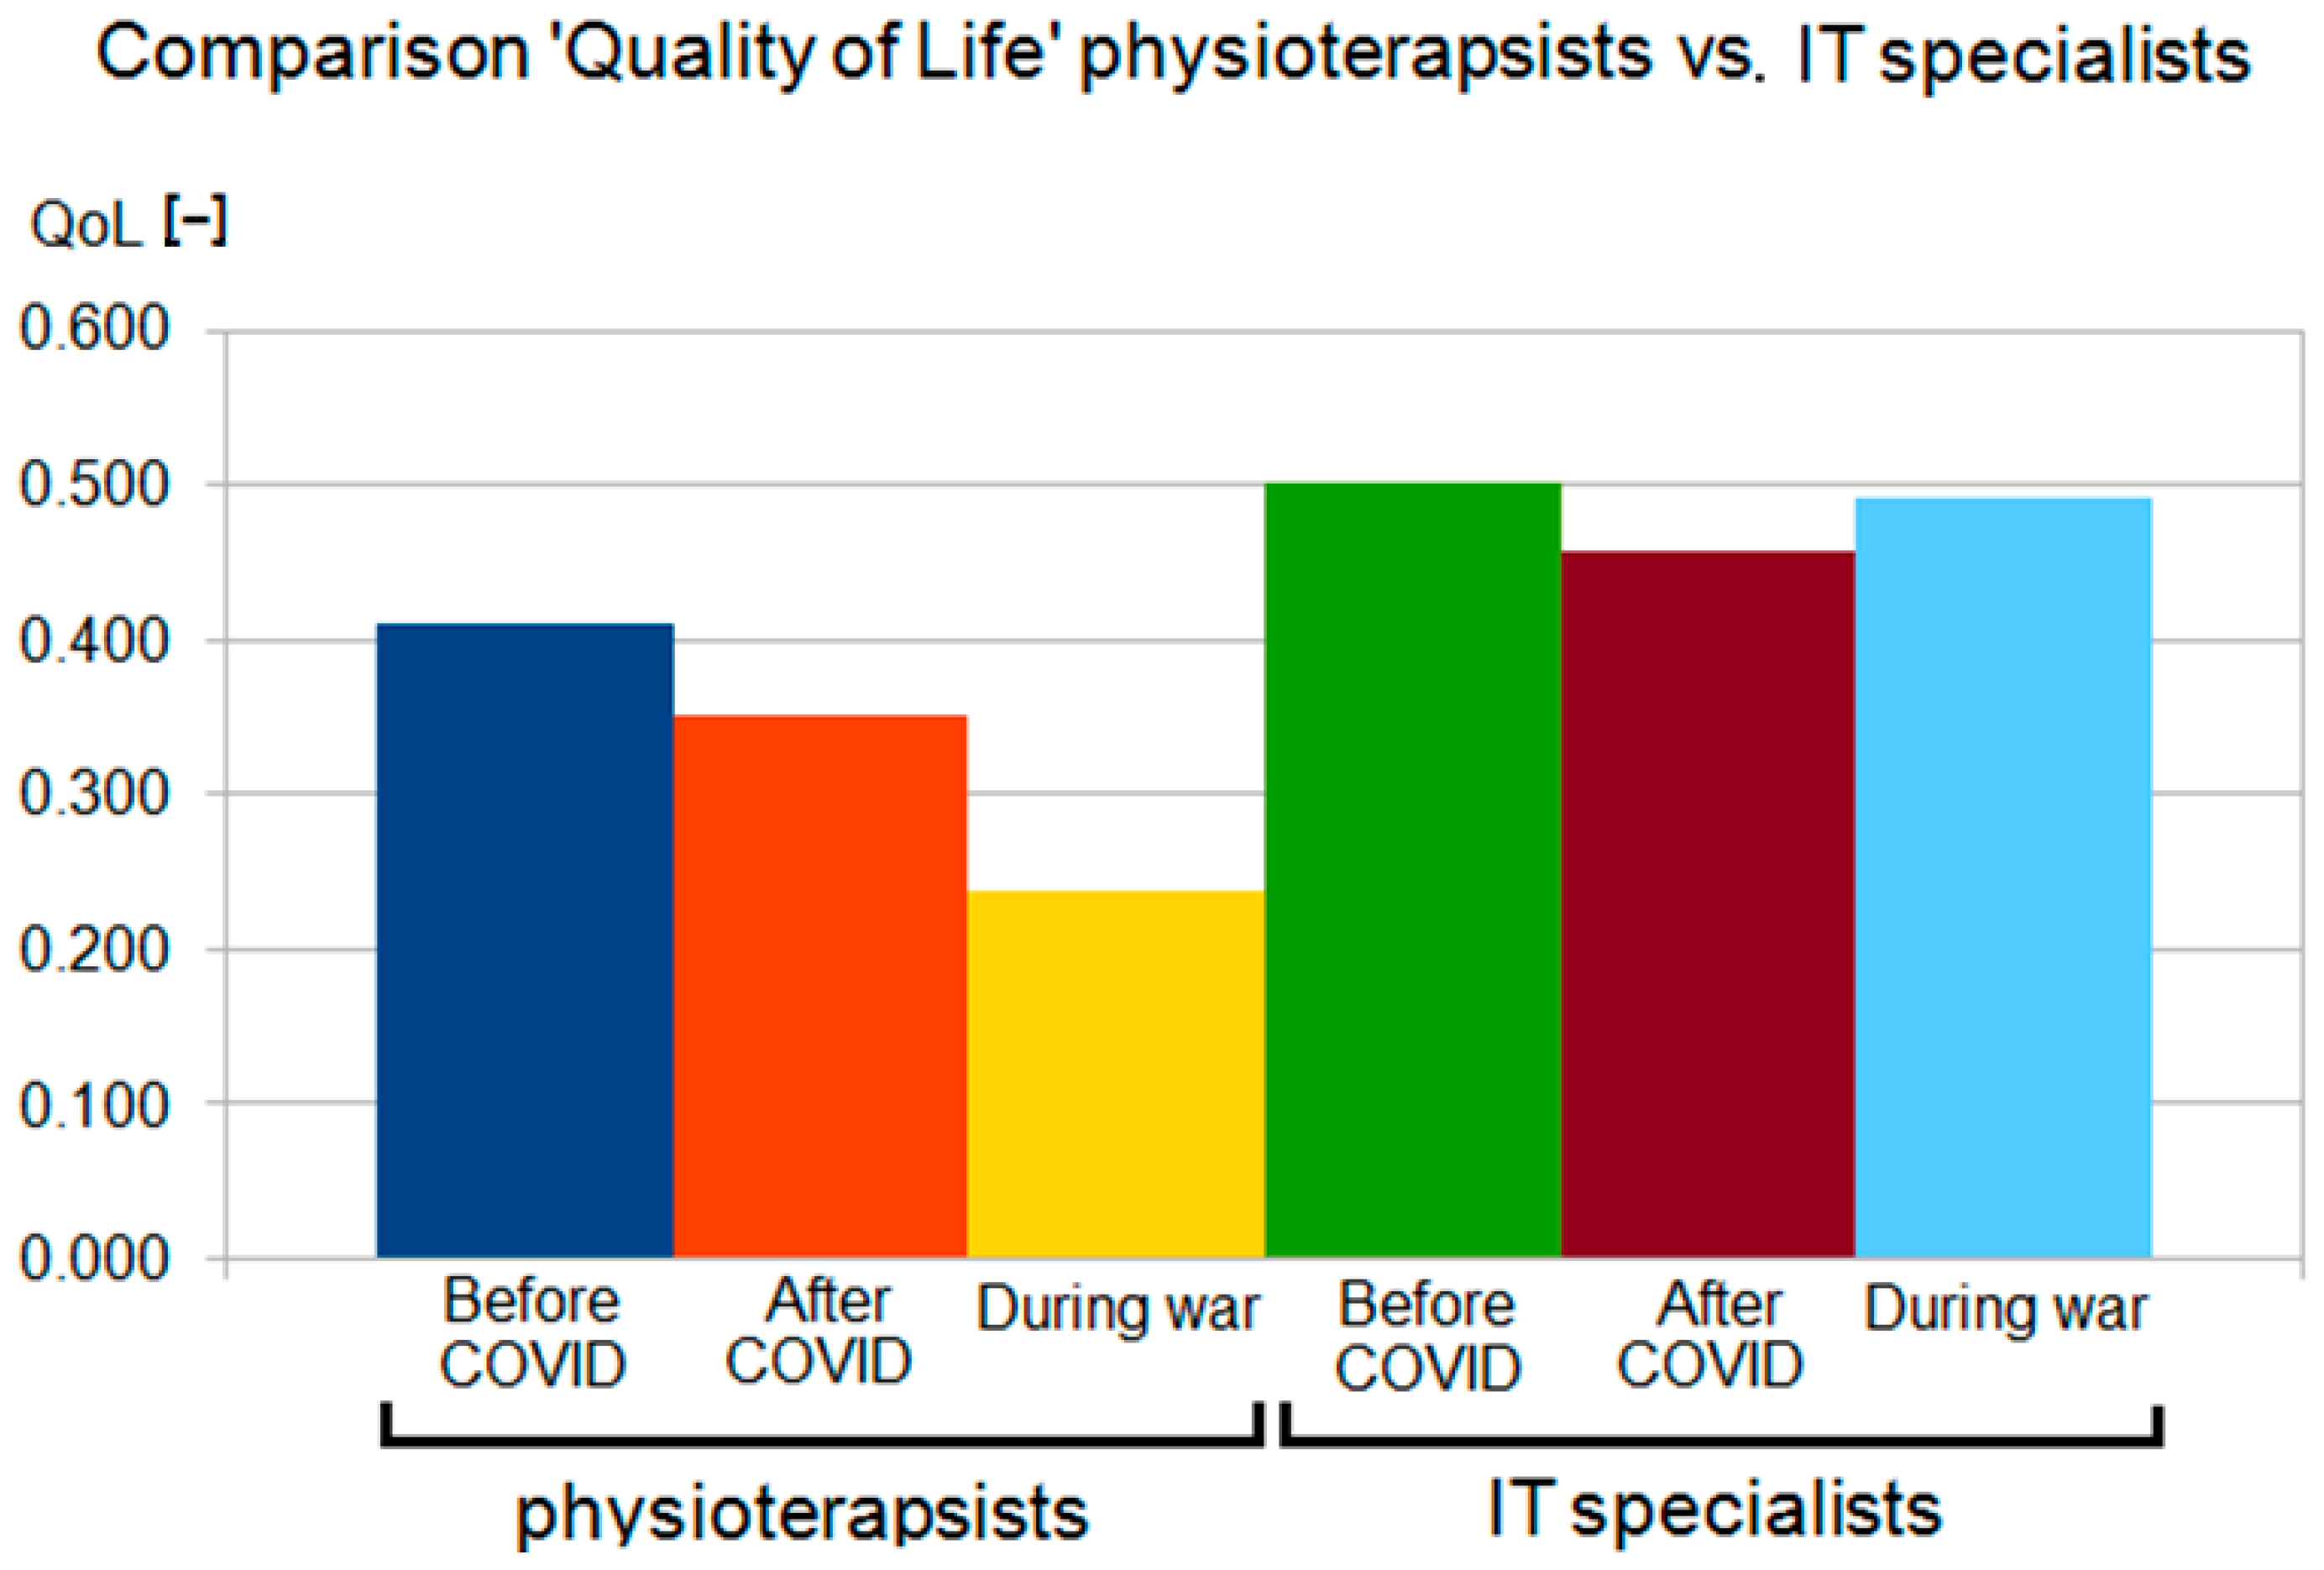
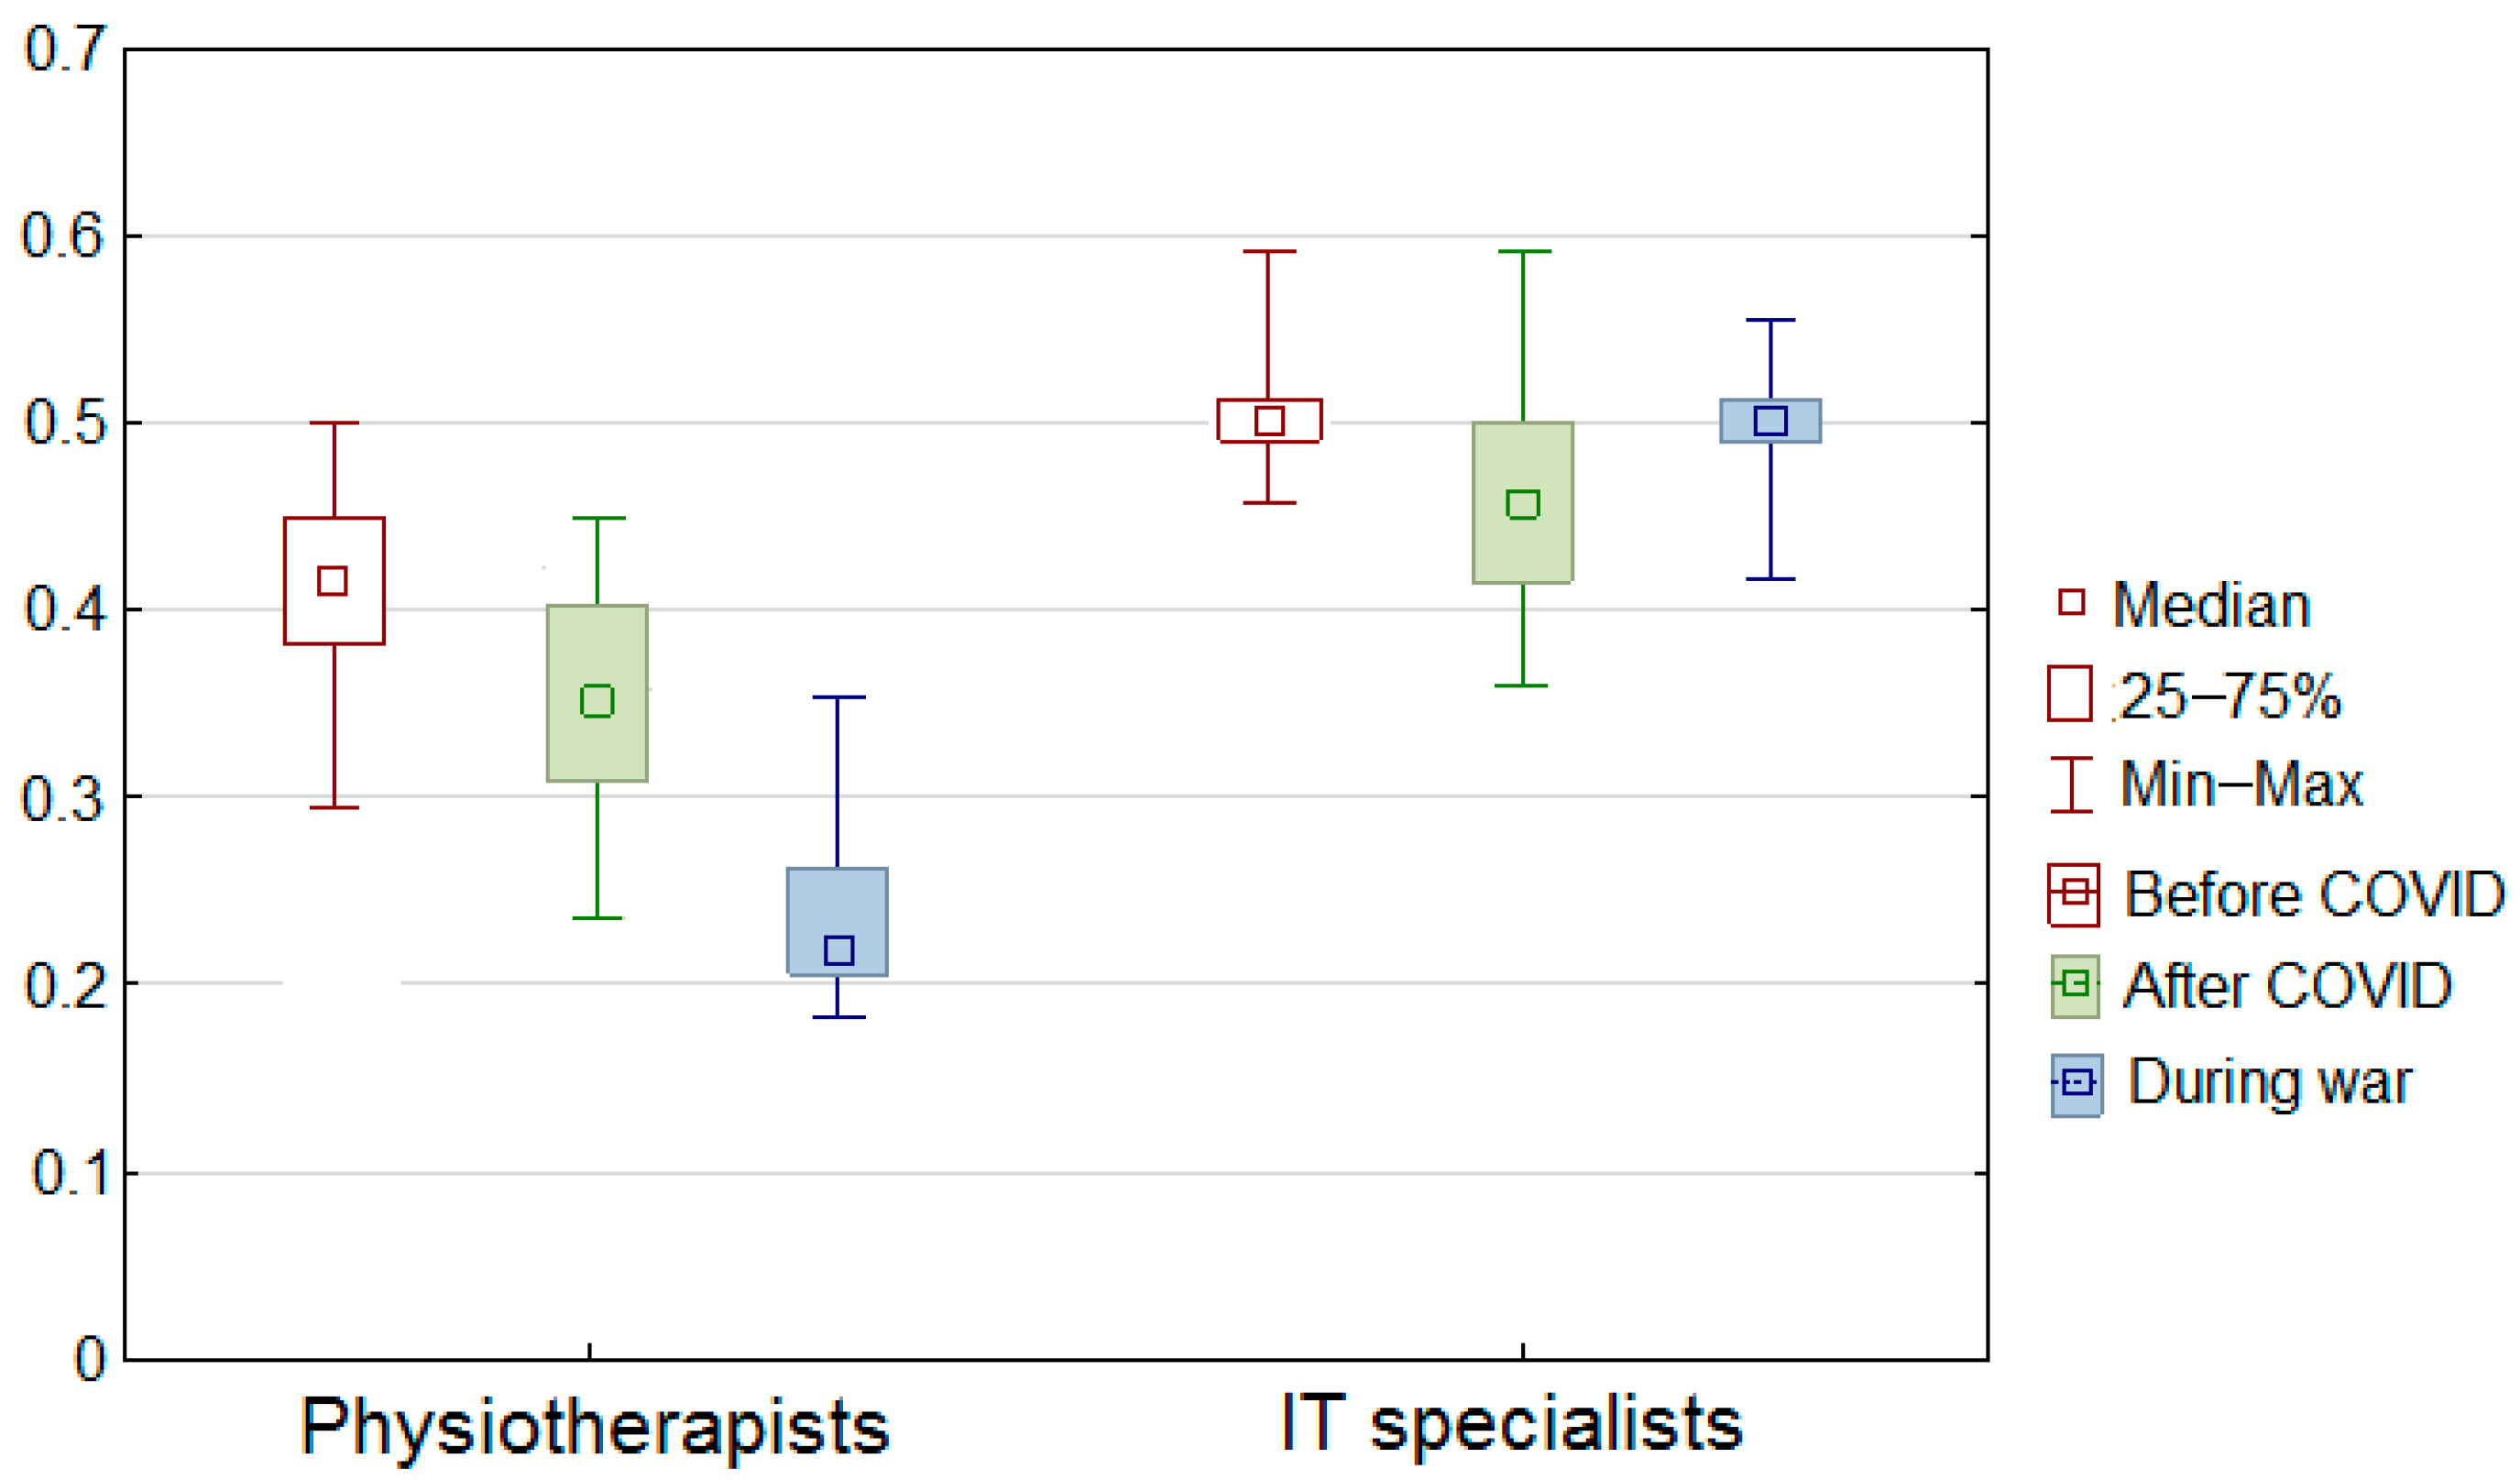
| No. | Physical Therapists | Informaticians | ||||
|---|---|---|---|---|---|---|
| Before COVID | After COVID | During War | Before COVID | After COVID | During War | |
| 1 | 0.297 | 0.236 | 0.222 | 0.500 | 0.500 | 0.500 |
| 2 | 0.428 | 0.339 | 0.244 | 0.500 | 0.500 | 0.500 |
| 3 | 0.445 | 0.406 | 0.191 | 0.500 | 0.500 | 0.500 |
| 4 | 0.426 | 0.395 | 0.361 | 0.500 | 0.428 | 0.462 |
| 5 | 0.324 | 0.315 | 0.182 | 0.500 | 0.462 | 0.500 |
| 6 | 0.391 | 0.391 | 0.241 | 0.500 | 0.361 | 0.428 |
| 7 | 0.482 | 0.445 | 0.278 | 0.500 | 0.500 | 0.500 |
| 8 | 0.361 | 0.286 | 0.210 | 0.500 | 0.500 | 0.500 |
| 9 | 0.500 | 0.406 | 0.247 | 0.462 | 0.406 | 0.500 |
| 10 | 0.391 | 0.376 | 0.206 | 0.500 | 0.380 | 0.462 |
| 11 | 0.406 | 0.350 | 0.217 | 0.462 | 0.428 | 0.500 |
| 12 | 0.445 | 0.322 | 0.200 | 0.500 | 0.406 | 0.462 |
| 13 | 0.445 | 0.406 | 0.297 | 0.500 | 0.428 | 0.462 |
| 14 | 0.445 | 0.253 | 0.213 | 0.594 | 0.594 | 0.555 |
| 15 | 0.324 | 0.315 | 0.188 | 0.500 | 0.462 | 0.500 |
| 16 | 0.468 | 0.445 | 0.322 | 0.500 | 0.477 | 0.500 |
| 17 | 0.445 | 0.293 | 0.221 | 0.500 | 0.428 | 0.500 |
| 18 | 0.352 | 0.338 | 0.291 | 0.500 | 0.462 | 0.500 |
| 19 | 0.406 | 0.297 | 0.195 | 0.500 | 0.428 | 0.500 |
| 20 | 0.445 | 0.400 | 0.235 | 0.500 | 0.500 | 0.500 |
| Summary of the data set | ||||||
| Sum | 8.223 | 7.014 | 4.761 | 10.017 | 9.149 | 9.831 |
| Min | 0.297 | 0.236 | 0.182 | 0.462 | 0.361 | 0.428 |
| Q1 | 0.383 | 0.311 | 0.204 | 0.500 | 0.428 | 0.491 |
| Median | 0.428 | 0.350 | 0.222 | 0.500 | 0.462 | 0.500 |
| Q3 | 0.445 | 0.401 | 0.255 | 0.500 | 0.500 | 0.500 |
| Max | 0.500 | 0.445 | 0.361 | 0.594 | 0.594 | 0.555 |
| Mean | 0.411 | 0.351 | 0.238 | 0.501 | 0.457 | 0.492 |
| SD | 0.056 | 0.061 | 0.049 | 0.025 | 0.054 | 0.026 |
| Group 1 (Physical Therapists) | |
|---|---|
| Change of PSS10 | −0.658 p = 0.023 |
| Change of MBI | n.s. |
| Change of SWLS | 0.438 p = 0.011 |
| Change of NMQ | n.s. |
| Group 2 (Informaticians) | |
| Change of PSS10 | n.s. |
| Change of MBI | n.s. |
| Change of SWLS | −0.521 p = 0.031 |
| Change of NMQ | −0.550 p = 0.035 |
| Scale | PSS10 | MBI | SWLS | NMQ |
|---|---|---|---|---|
| Direction of change in group 1 (physiotherapists) | High erstress | Higher stress | Lower quality of living | Higher number of problems |
| Direction of change in group 2 (informaticians) | Low erstress | Lower stress | Higher quality of living | No change |
| Area | Approach | |||
|---|---|---|---|---|
| Work Burnout/Life Burnout | QoL | PLUS | ||
| Every day activity | Physical health | Not considered | Partially considered | Considered–module 2 |
| Job satisfaction | Considered | Partially considered | Considered–module 3 | |
| Life satisfaction | Partially considered | Partially considered | Considered–module 1 | |
| Specific context influence | Not applicable | Not applicable | Applicable through modular construction–by adding another module with a specific evaluation | |
Publisher’s Note: MDPI stays neutral with regard to jurisdictional claims in published maps and institutional affiliations. |
© 2022 by the authors. Licensee MDPI, Basel, Switzerland. This article is an open access article distributed under the terms and conditions of the Creative Commons Attribution (CC BY) license (https://creativecommons.org/licenses/by/4.0/).
Share and Cite
Prokopowicz, P.; Mikołajewski, D.; Mikołajewska, E. Intelligent System for Detecting Deterioration of Life Satisfaction as Tool for Remote Mental-Health Monitoring. Sensors 2022, 22, 9214. https://0-doi-org.brum.beds.ac.uk/10.3390/s22239214
Prokopowicz P, Mikołajewski D, Mikołajewska E. Intelligent System for Detecting Deterioration of Life Satisfaction as Tool for Remote Mental-Health Monitoring. Sensors. 2022; 22(23):9214. https://0-doi-org.brum.beds.ac.uk/10.3390/s22239214
Chicago/Turabian StyleProkopowicz, Piotr, Dariusz Mikołajewski, and Emilia Mikołajewska. 2022. "Intelligent System for Detecting Deterioration of Life Satisfaction as Tool for Remote Mental-Health Monitoring" Sensors 22, no. 23: 9214. https://0-doi-org.brum.beds.ac.uk/10.3390/s22239214