
Enhanced Deep Learning Model for Classification of Retinal Optical Coherence Tomography Images
 ,
,  , , and
Abstract
:1. Introduction
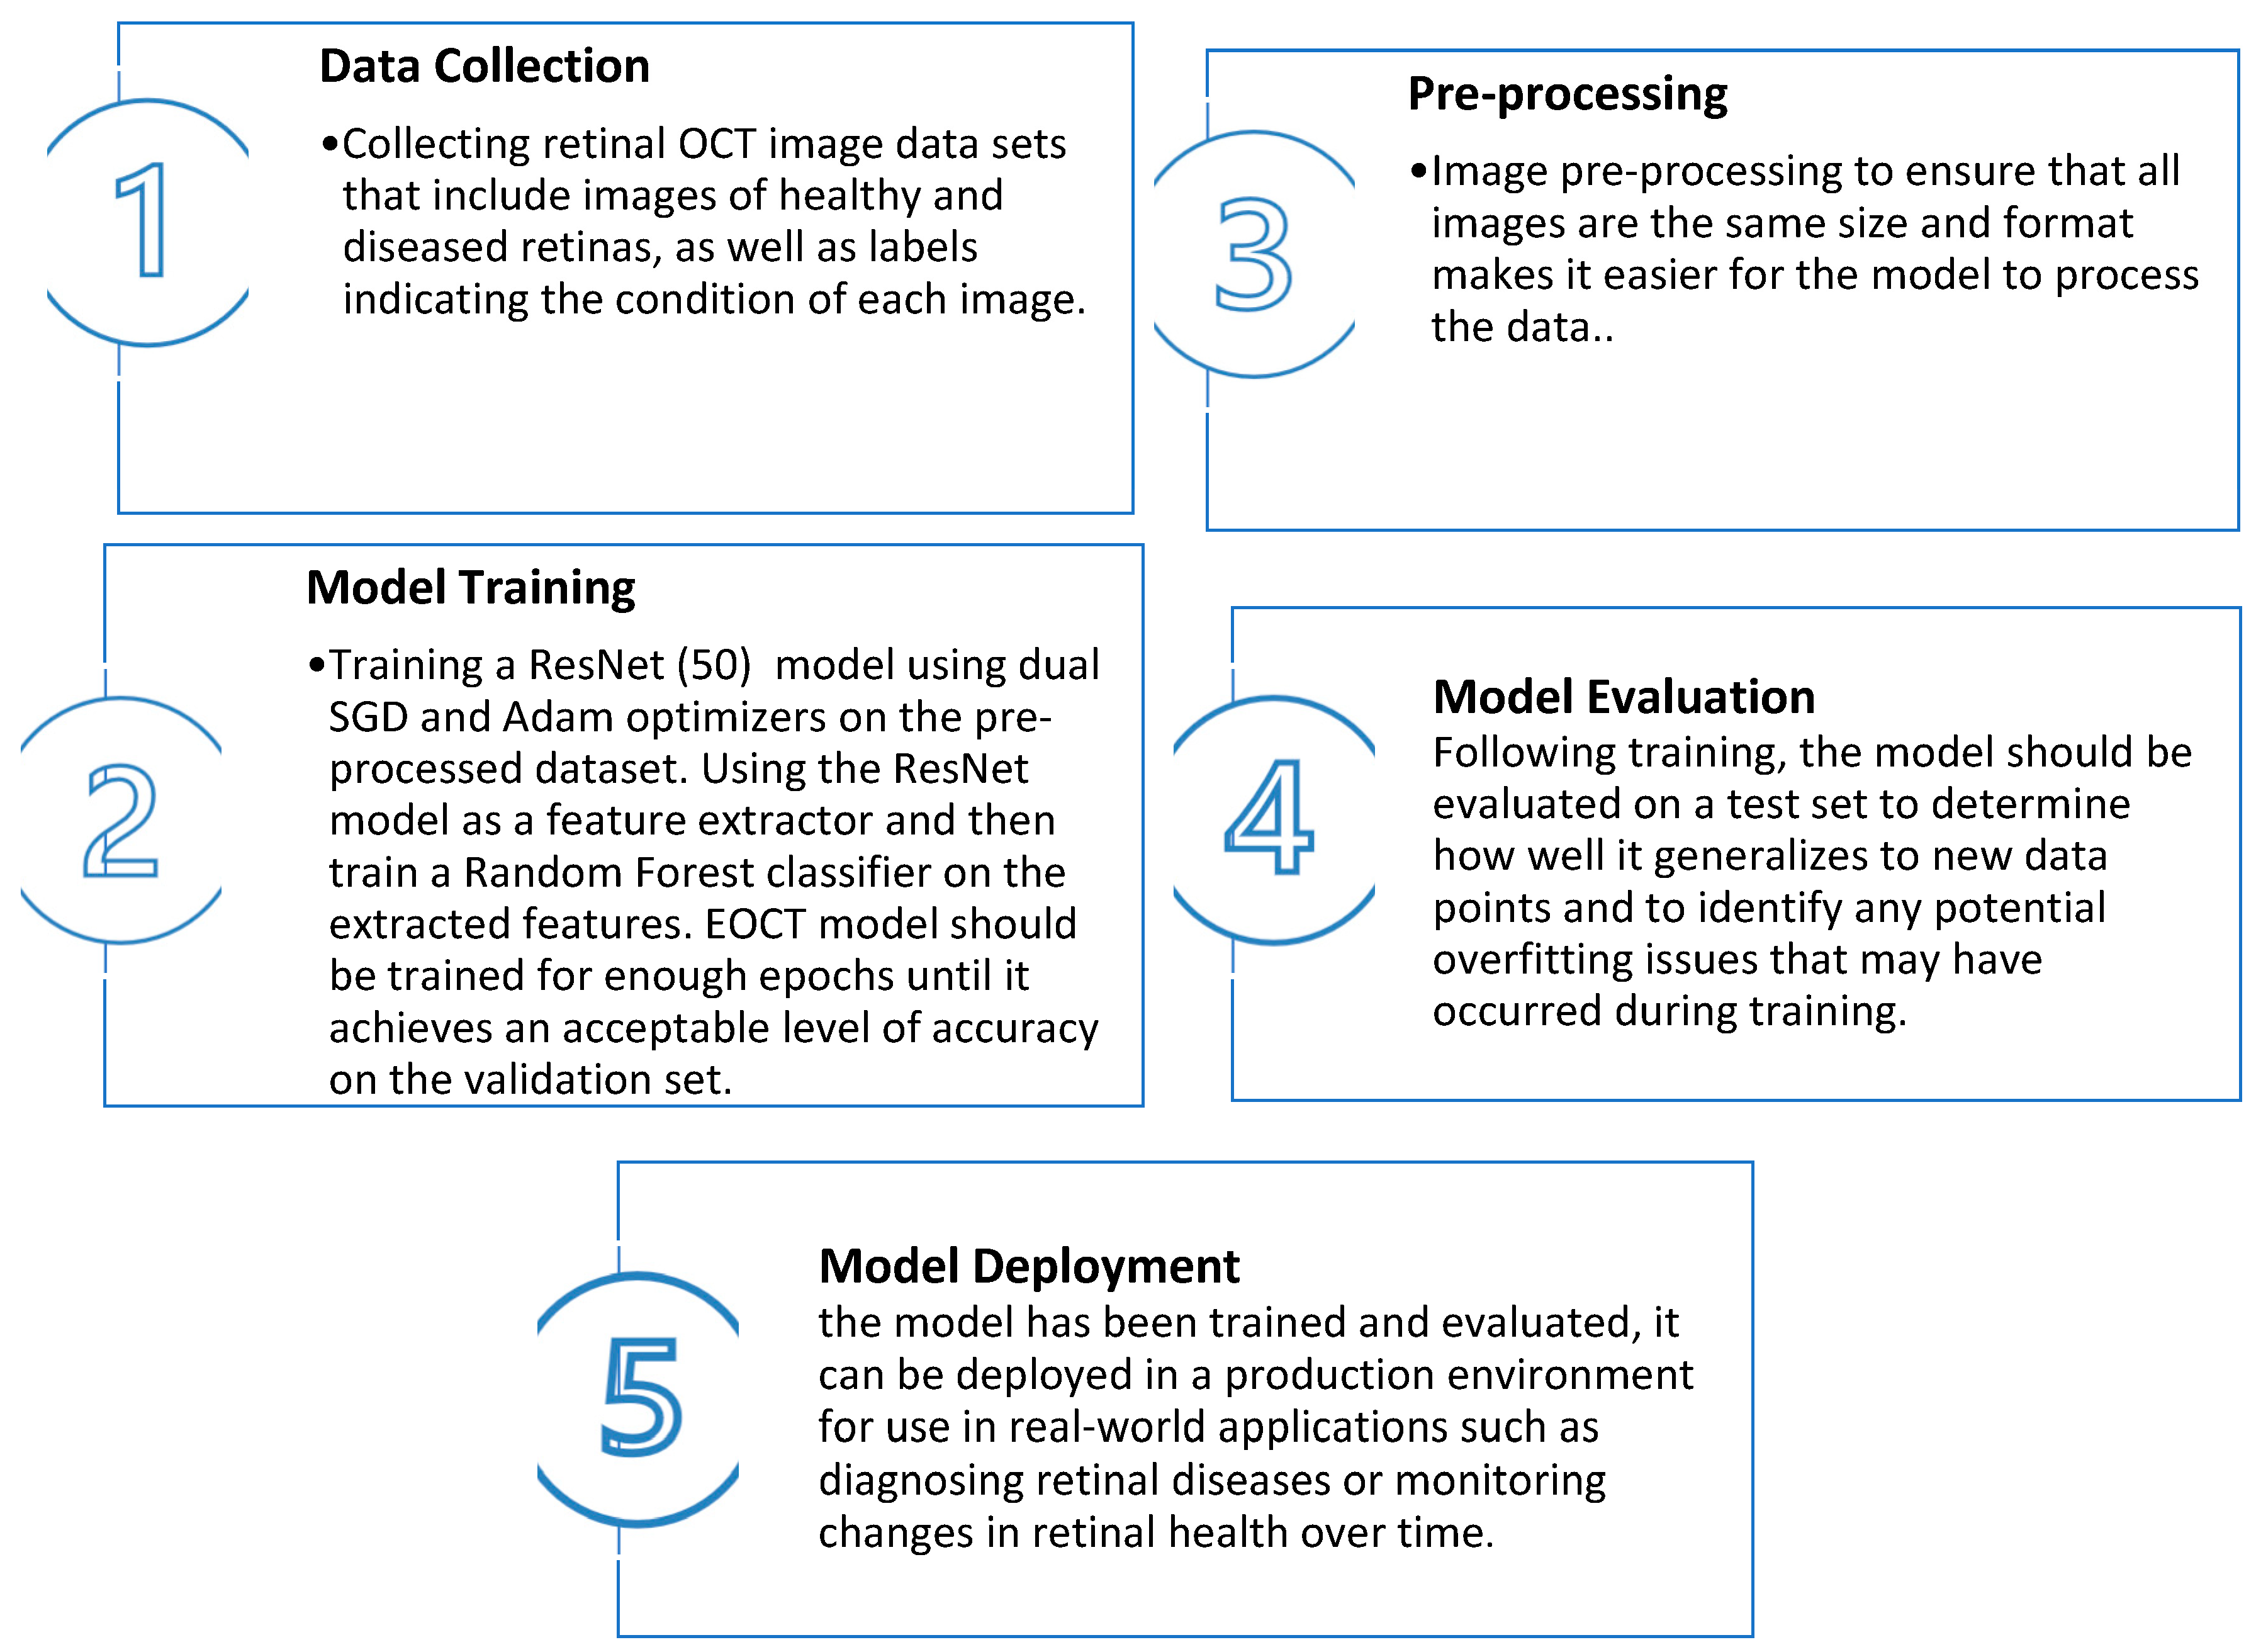
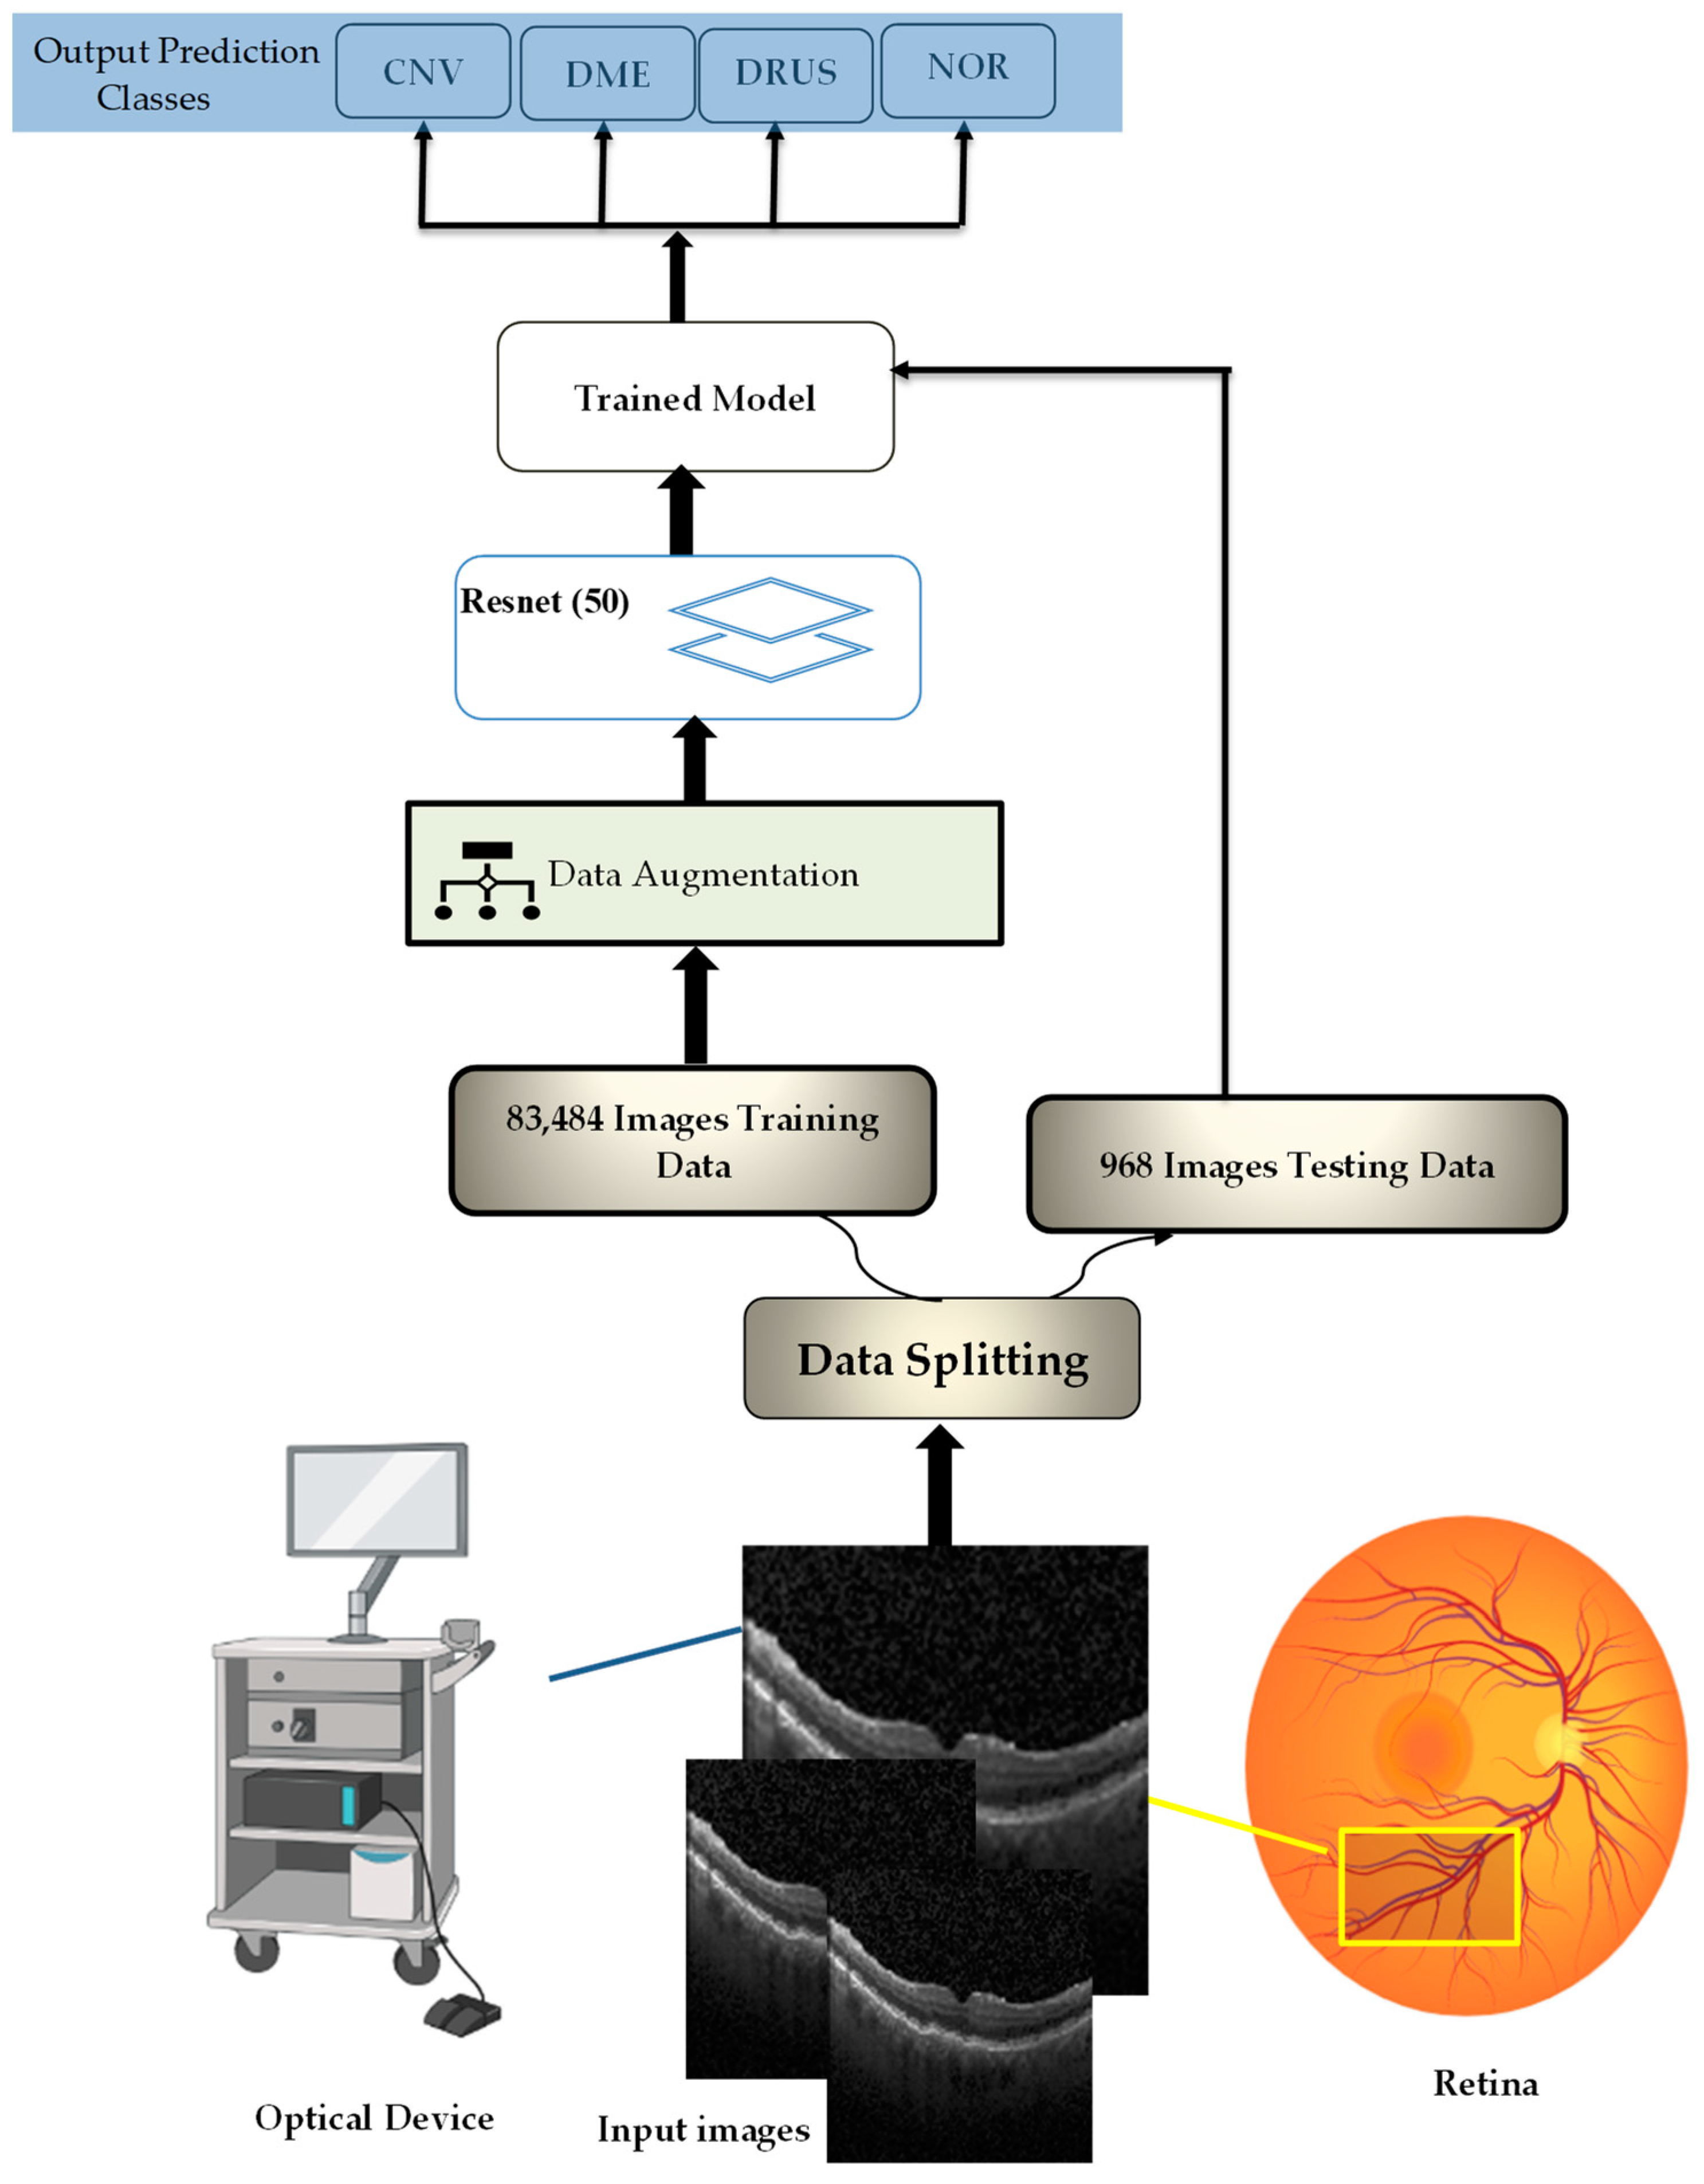
2. Enhanced Optical Coherence Tomography (EOCT) Model
| Algorithm 1: Model Building Algorithm |
|
2.1. Spatial Separable Convolutions (SSCs)
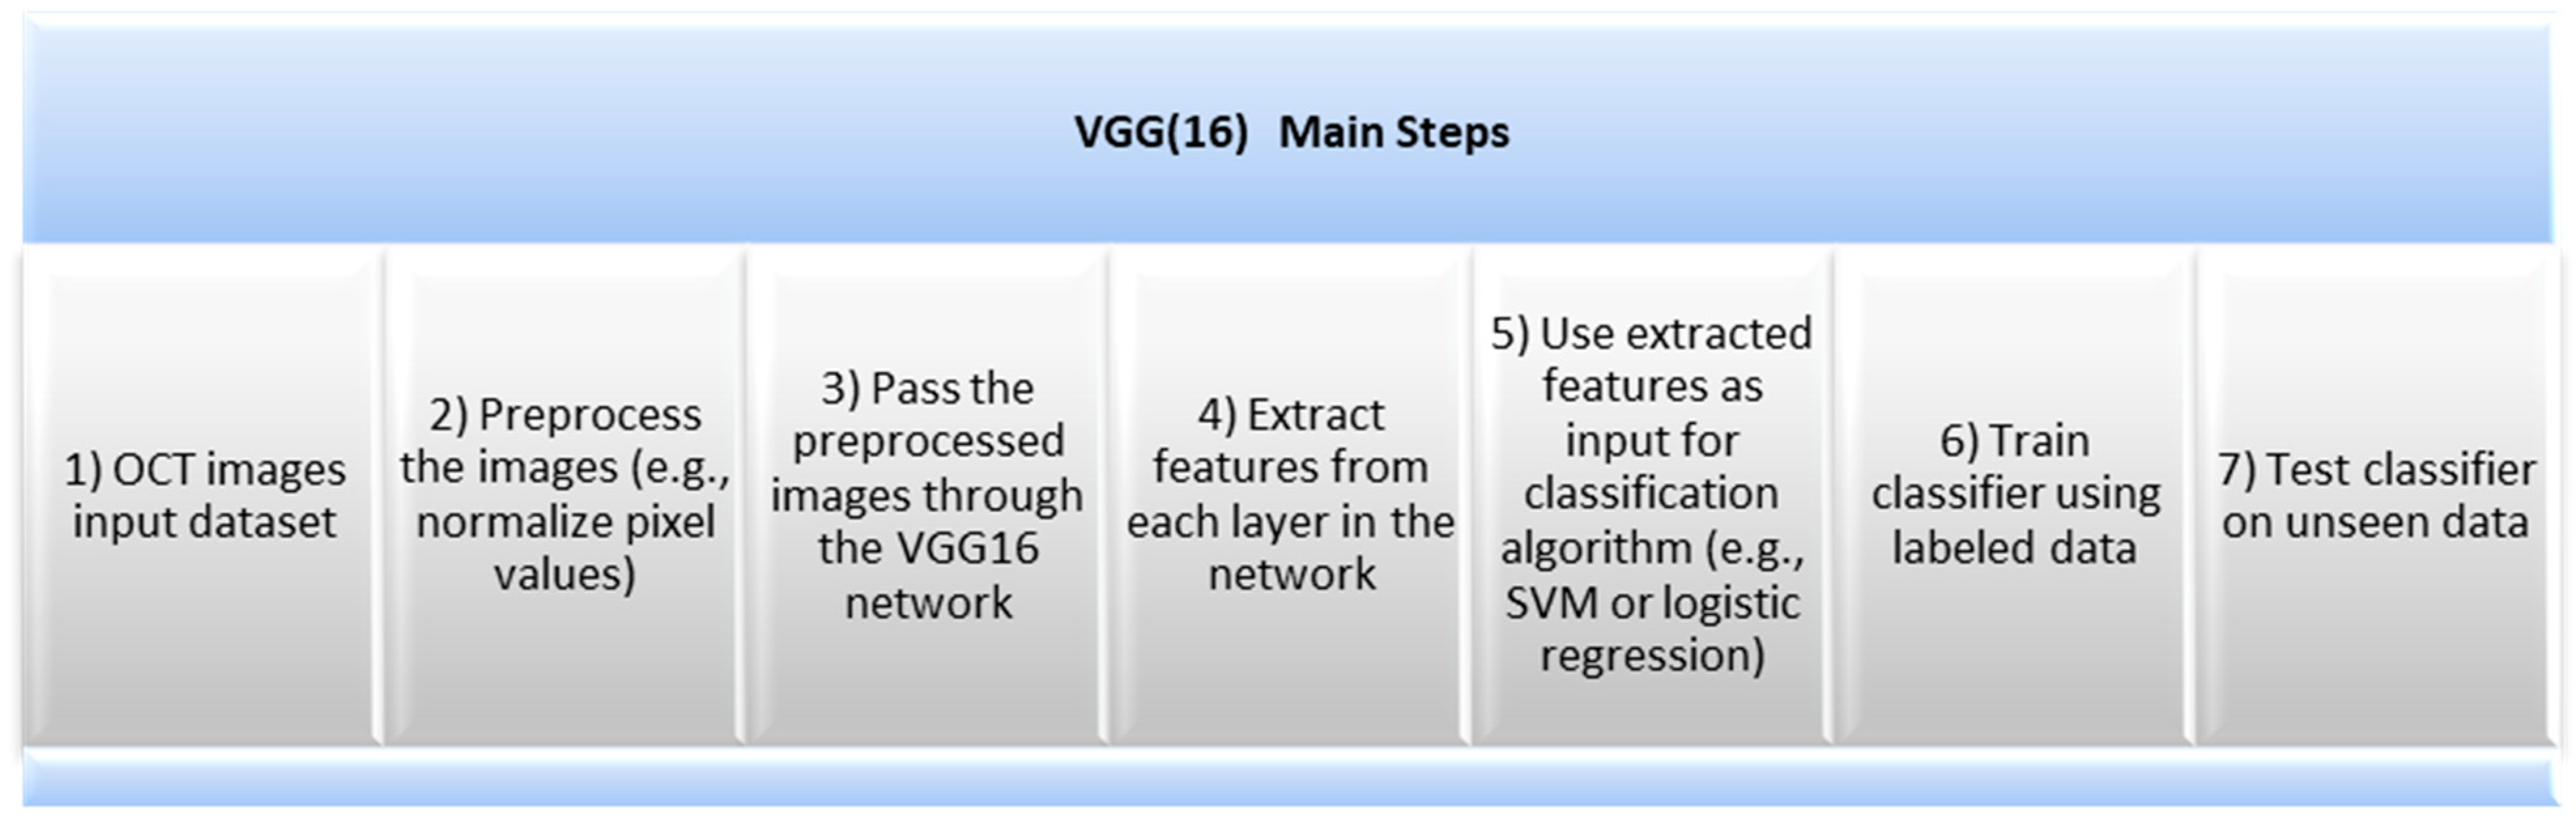
2.2. VGG(16) Architecture
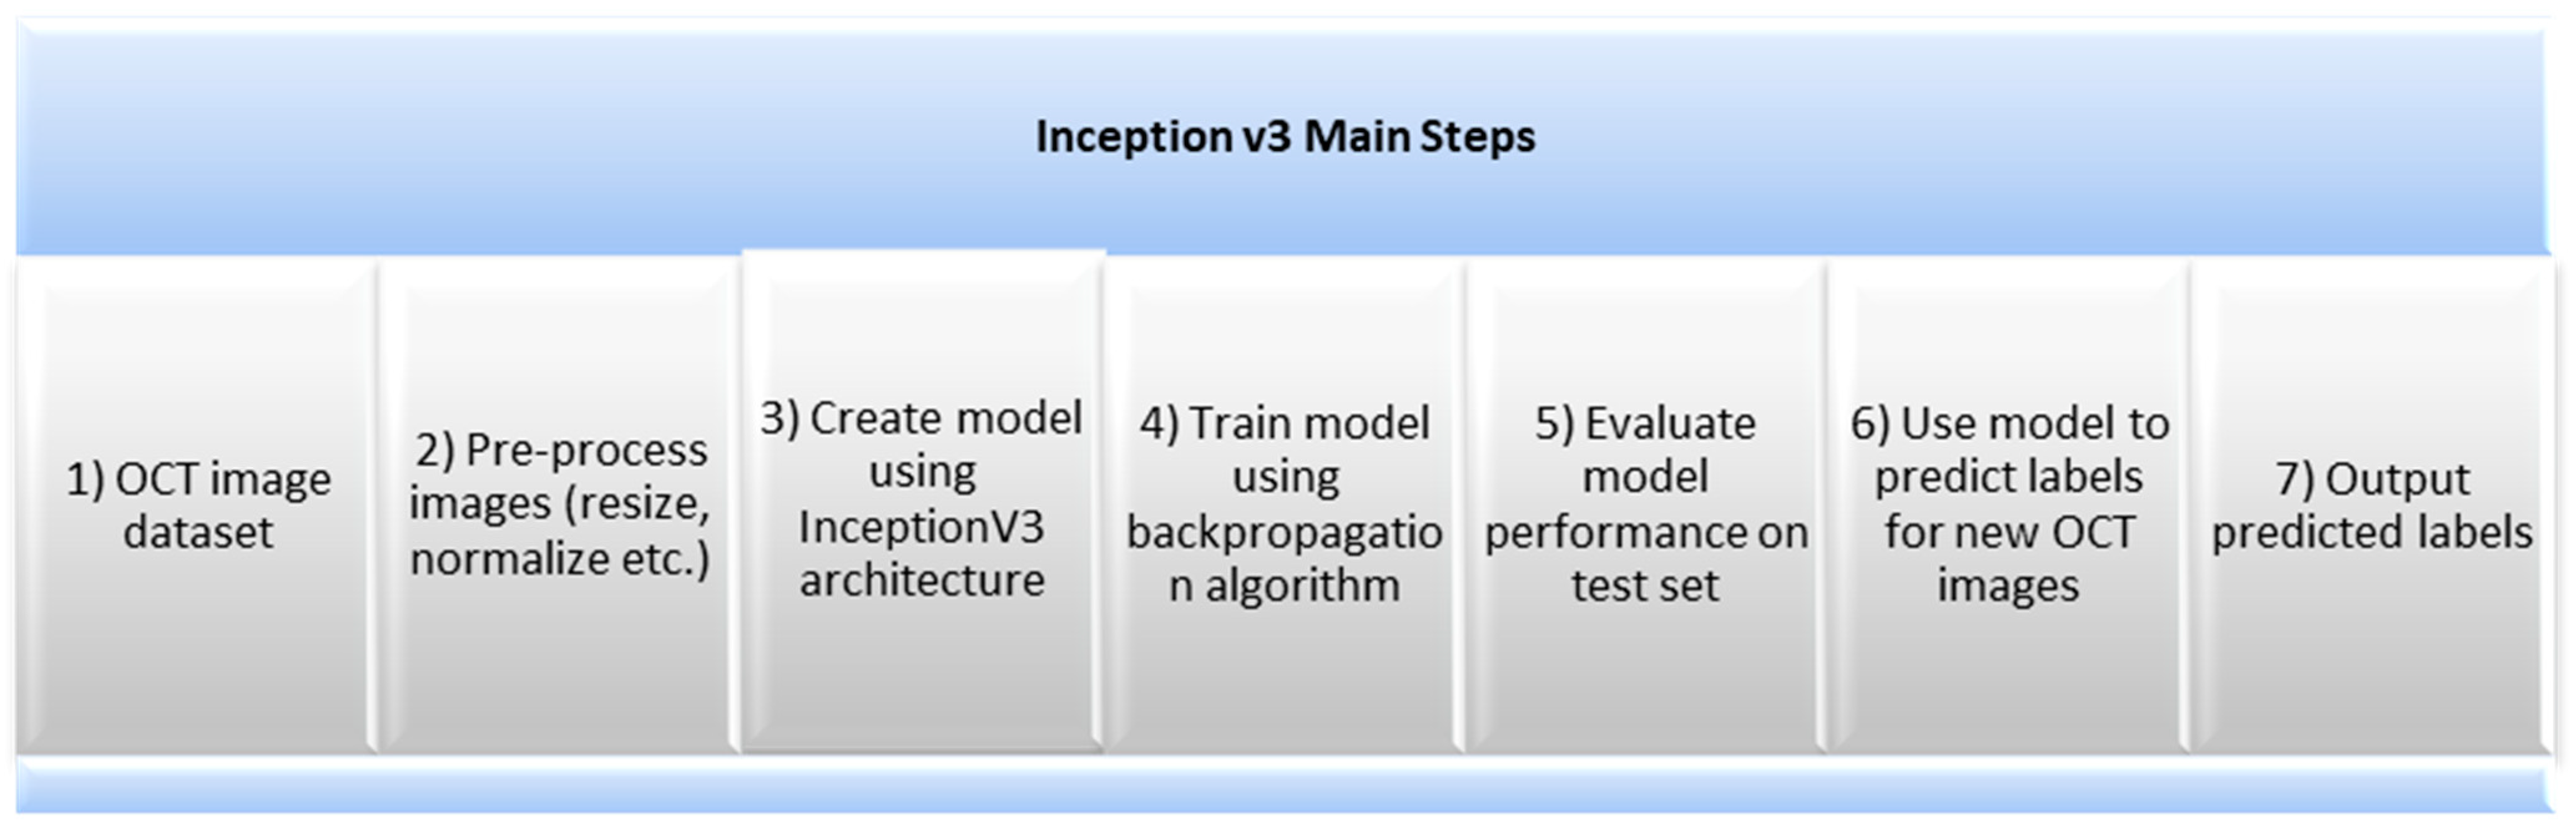
2.3. Inception v3
3. Experimental and Results
Dataset
4. Discussion
5. Conclusions
Author Contributions
Funding
Data Availability Statement
Acknowledgments
Conflicts of Interest
References
- Wang, W.; Lo, A.C.Y. Diabetic Retinopathy: Pathophysiology and Treatments. Int. J. Mol. Sci. 2018, 19, 1816. [Google Scholar] [CrossRef] [PubMed] [Green Version]
- De Bernardo, M.; Cione, F.; Capasso, L.; Coppola, A.; Rosa, N. A formula to improve the reliability of optical axial length measurement in IOL power calculation. Sci. Rep. 2022, 12, 18845. [Google Scholar] [CrossRef] [PubMed]
- Romero-Aroca, P.; Baget-Bernaldiz, M.; Pareja-Rios, A.; Lopez-Galvez, M.; Navarro-Gil, R.; Verges, R. Diabetic Macular Edema Pathophysiology: Vasogenic versus Inflammatory. J. Diabetes Res. 2016, 2016, 2156273. [Google Scholar] [CrossRef] [PubMed] [Green Version]
- Picillo, M.; Salerno, G.; Tepedino, M.F.; Abate, F.; Cuoco, S.; Gioia, M.; Coppola, A.; Erro, R.; Pellecchia, M.T.; Rosa, N.; et al. Retinal thinning in progressive supranuclear palsy: Differences with healthy controls and correlation with clinical variables. Neurol. Sci. 2022, 43, 4803–4809. [Google Scholar] [CrossRef] [PubMed]
- Bek, T. Diameter Changes of Retinal Vessels in Diabetic Retinopathy. Curr. Diabetes Rep. 2017, 17, 82. [Google Scholar] [CrossRef] [PubMed]
- Stewart, M.W. Pathophysiology of diabetic retinopathy. Ochsner J. 2013, 13, 343–350. [Google Scholar]
- Kern, T.S.; Antonetti, D.A.; Smith, L.E. Pathophysiology of diabetic retinopathy: Contribution and limitations of laboratory research. Ophthalmic Res. 2019, 62, 196–202. [Google Scholar] [CrossRef] [PubMed]
- Wong, T.Y.; Sun, J.; Kawasaki, R.; Ruamviboonsuk, P.; Gupta, N.; Lansingh, V.C.; Maia, M.; Mathenge, W.; Moreker, S.; Muqit, M.M.; et al. Guidelines on diabetic eye care: The international council of ophthalmology recommendations for screening, follow-up, referral, and treatment based on resource settings. Ophthalmology 2018, 125, 1608–1622. [Google Scholar] [CrossRef] [PubMed] [Green Version]
- Windisch, R.; Windisch, B.K.; Cruess, A.F. Use of fluorescein and indocyanine green angiography in polypoidal choroidal vasculopathy patients following photodynamic therapy. Can. J. Ophthalmol. 2008, 43, 678–682. [Google Scholar] [CrossRef] [PubMed]
- Hussain, A.; Bhuiyan, A.; Luu, C.D.; Smith, R.T.; Guymer, R.H.; Ishikawa, H.; Schuman, J.S.; Ramamohanarao, K. Classification of healthy and diseased retina using SD-OCT imaging and Random Forest algorithm. PLoS ONE 2018, 13, e0198281. [Google Scholar] [CrossRef] [PubMed]
- Carrera-Escalé, L.; Benali, A.; Rathert, A.-C.; Martín-Pinardel, R.; Bernal-Morales, C.; Alé-Chilet, A.; Barraso, M.; Marín-Martinez, S.; Feu-Basilio, S.; Rosinés-Fonoll, J.; et al. Radiomics-Based Assessment of OCT Angiography Images for Diabetic Retinopathy Diagnosis. Ophthalmol. Sci. 2023, 3, 100259. [Google Scholar] [CrossRef] [PubMed]
- Vimala, G.S.A.G.; Sungeetha, D.; Preetha, R.; Kishanlal, M.S.M. Analysis of human retinal morphology using random forest classifier. AIP Conf. Proc. 2022, 2405, 020029. [Google Scholar]
- Jung, Y.; Kim, D. Feature Extraction of Non-proliferative Diabetic Retinopathy Using Faster R-CNN and Automatic Severity Classification System Using Random Forest Method. J. Inf. Process. Syst. 2022, 18, 599–613. [Google Scholar]
- Ran, A.R.; Cheung, C.Y.; Wang, X.; Chen, H.; Luo, L.-Y.; Chan, P.P.; Wong, M.O.M.; Chang, R.T.; Mannil, S.S.; Young, A.L.; et al. Detection of glaucomatous optic neuropathy with spectral-domain optical coherence tomography: A retrospective training and validation deep-learning analysis. Lancet Digit. Health 2019, 1, e172–e182. [Google Scholar] [CrossRef] [PubMed] [Green Version]
- Balyen, L.; Peto, T. Promising Artificial Intelligence-Machine Learning-Deep Learning Algorithms in Ophthalmology. Asia-Pac. J. Ophthalmol. 2019, 8, 264–272. [Google Scholar]
- Talaat, F.M.; Gamel, S.A. RL based hyper-parameters optimization algorithm (ROA) for convolutional neural network. J. Ambient. Intell. Humaniz. Comput. 2022. [Google Scholar] [CrossRef]
- Keenan, T.D.; Dharssi, S.; Peng, Y.; Chen, Q.; Agrón, E.; Wong, W.T.; Lu, Z.; Chew, E.Y. A deep learning approach for automated detection of geographic atrophy from color fundus photographs. Ophthalmology 2019, 126, 1533–1540. [Google Scholar] [CrossRef] [Green Version]
- Milea, D.; Najjar, R.P.; Jiang, Z.; Ting, D.; Vasseneix, C.; Xu, X.; Aghsaei Fard, M.; Fonseca, P.; Vanikieti, K.; Lagrèze, W.A.; et al. Artificial intelligence to detect papilledema from ocular fundus photographs. N. Engl. J. Med. 2020, 382, 1687–1695. [Google Scholar] [CrossRef]
- Fujimoto, J.G.; Swanson, E. The Development, Commercialization, and Impact of Optical Coherence Tomography. Investig. Opthalmology Vis. Sci. 2016, 57, OCT1–OCT13. [Google Scholar] [CrossRef] [Green Version]
- Diao, S.; Su, J.; Yang, C.; Zhu, W.; Xiang, D.; Chen, X.; Peng, Q.; Shi, F. Classification and segmentation of OCT images for age-related macular degeneration based on dual guidance networks. Biomed. Signal Process. Control 2023, 84, 104810. [Google Scholar] [CrossRef]
- Heisler, M.; Karst, S.; Lo, J.; Mammo, Z.; Yu, T.; Warner, S.; Maberley, D.; Beg, M.F.; Navajas, E.V.; Sarunic, M.V. Ensemble deep learning for diabetic retinopathy detection using optical coherence tomography angiography. Transl. Vis. Sci. Technol. 2020, 9, 20. [Google Scholar] [CrossRef] [PubMed] [Green Version]
- Eladawi, N.; Elmogy, M.; Helmy, O.; Aboelfetouh, A.; Riad, A.; Sandhu, H.; Schaal, S.; El-Baz, A. Automatic blood vessels segmentation based on different retinal maps from OCTA scans. Comput. Biol. Med. 2017, 89, 150–161. [Google Scholar] [CrossRef] [PubMed]
- Le, D.; Alam, M.; Yao, C.K.; Lim, J.I.; Hsieh, Y.T.; Chan, R.V.; Toslak, D.; Yao, X. Transfer learning for automated OCTA detection of diabetic retinopathy. Transl. Vis. Sci. Technol. 2020, 9, 35. [Google Scholar] [CrossRef] [PubMed]
- Alam, M.; Le, D.; Son, T.; Lim, J.I.; Yao, X. AV-Net: Deep learning for fully automated artery-vein classification in optical coherence tomography angiography. Biomed. Opt. Express 2020, 11, 5249–5257. [Google Scholar] [CrossRef]
- Díaz, M.; Novo, J.; Cutrín, P.; Gómez-Ulla, F.; Penedo, M.G.; Ortega, M. Automatic segmentation of the foveal avascular zone in ophthalmological OCT-A images. PLoS ONE 2019, 14, e0212364. [Google Scholar] [CrossRef]
- Kim, K.; You, J.I.; Park, J.R.; Kim, E.S.; Oh, W.Y.; Yu, S.Y. Quantification of retinal microvascular parameters by severity of diabetic retinopathy using wide-field swept-source optical coherence tomography angiography. Graefe’s Arch. Clin. Exp. Ophthalmol. 2021, 259, 2103–2111. [Google Scholar] [CrossRef]
- Marino, A.V.; Gioia, M.; Reda, L.; Marca, A.L. Choroidal Thickness and Retinal Vein Occlusions. Clin. Ophthalmol. 2023, 17, 747–748. [Google Scholar] [CrossRef]
- He, J.; Wang, J.; Han, Z.; Ma, J.; Wang, C.; Qi, M. An interpretable transformer network for retinal disease classification using optical coherence tomography. Sci. Rep. 2023, 13, 3637. [Google Scholar] [CrossRef]
- Teussink, M.M.; Breukink, M.B.; van Grinsven, M.J.; Hoyng, C.B.; Klevering, B.J.; Boon, C.J.; de Jong, E.K.; Theelen, T. OCT angiography compared to fluorescein and indocyanine green angiography in chronic central serous chorioretinopathy. Investig. Ophthalmol. Vis. Sci. 2015, 56, 5229–5237. [Google Scholar] [CrossRef] [Green Version]
- De Carlo, T.E.; Romano, A.; Waheed, N.K.; Duker, J.S. A review of optical coherence tomography angiography (OCTA). Int. J. Retin. Vitr. 2015, 1, 5. [Google Scholar] [CrossRef] [Green Version]
- He, K.; Zhang, X.; Ren, S.; Sun, J. Deep Residual Learning for Image Recognition. December 2015. Available online: http://arxiv.org/abs/1512.03385 (accessed on 24 May 2023).
- LeCun, Y.; Bengio, Y.; Hinton, G. Deep learning. Nature 2015, 521, 436–444. [Google Scholar] [CrossRef] [PubMed]
- Ting, D.S.W.; Cheung, C.Y.L.; Lim, G.; Tan, G.S.W.; Quang, N.D.; Gan, A.; Hamzah, H.; Garcia-Franco, R.; San Yeo, I.Y.; Lee, S.Y.; et al. Development and validation of a deep learning system for diabetic retinopathy and related eye diseases using retinal images from multiethnic populations with diabetes. JAMA 2017, 318, 2211–2223. [Google Scholar] [CrossRef] [PubMed]
- Owais, M.; Arsalan, M.; Choi, J.; Park, K.R. Effective diagnosis and treatment through content-based medical image retrieval (CBMIR) by using artificial intelligence. J. Clin. Med. 2019, 8, 462. [Google Scholar] [CrossRef] [PubMed] [Green Version]
- Shen, C.; Yan, S.; Du, M.; Zhao, H.; Shao, L.; Hu, Y. Assessment of capillary dropout in the superficial retinal capillary plexus by optical coherence tomography angiography in the early stage of diabetic retinopathy. BMC Ophthalmol. 2018, 18, 113. [Google Scholar] [CrossRef] [PubMed]
- Elgafi, M.; Sharafeldeen, A.; Elnakib, A.; Elgarayhi, A.; Alghamdi, N.S.; Sallah, M.; El-Baz, A. Detection of Diabetic Retinopathy Using Extracted 3D Features from OCT Images. Sensors 2022, 22, 7833. [Google Scholar] [CrossRef]
- Ong, J.X.; Kwan, C.C.; Cicinelli, M.V.; Fawzi, A.A. Superficial capillary perfusion on optical coherence tomography angiography differentiates moderate and severe nonproliferative diabetic retinopathy. PLoS ONE 2020, 15, e0240064. [Google Scholar] [CrossRef]
- Hamwood, J.; Alonso-Caneiro, D.; Read, S.A.; Vincent, S.; Collins, M.J. Effect of patch size and network architecture on a convolutional neural network approach for automatic segmentation of OCT retinal layers. Biomed. Opt. Express 2018, 9, 3049–3066. [Google Scholar] [CrossRef] [Green Version]
- Elsharkawy, M.; Elrazzaz, M.; Sharafeldeen, A.; Alhalabi, M.; Khalifa, F.; Soliman, A.; Elnakib, A.; Mahmoud, A.; Ghazal, M.; El-Daydamony, E.; et al. The Role of Different Retinal Imaging Modalities in Predicting Progression of Diabetic Retinopathy: A Survey. Sensors 2022, 22, 3490. [Google Scholar] [CrossRef]


| Model | Sensitivity | Specificity | Precision | NPV | FPR | FDR | FNR | Accuracy | F1-Score | MCC |
|---|---|---|---|---|---|---|---|---|---|---|
| EOCT | 0.9836 | 0.9615 | 0.9740 | 0.9756 | 0.0385 | 0.0260 | 0.0164 | 0.9747 | 0.9788 | 0.9474 |
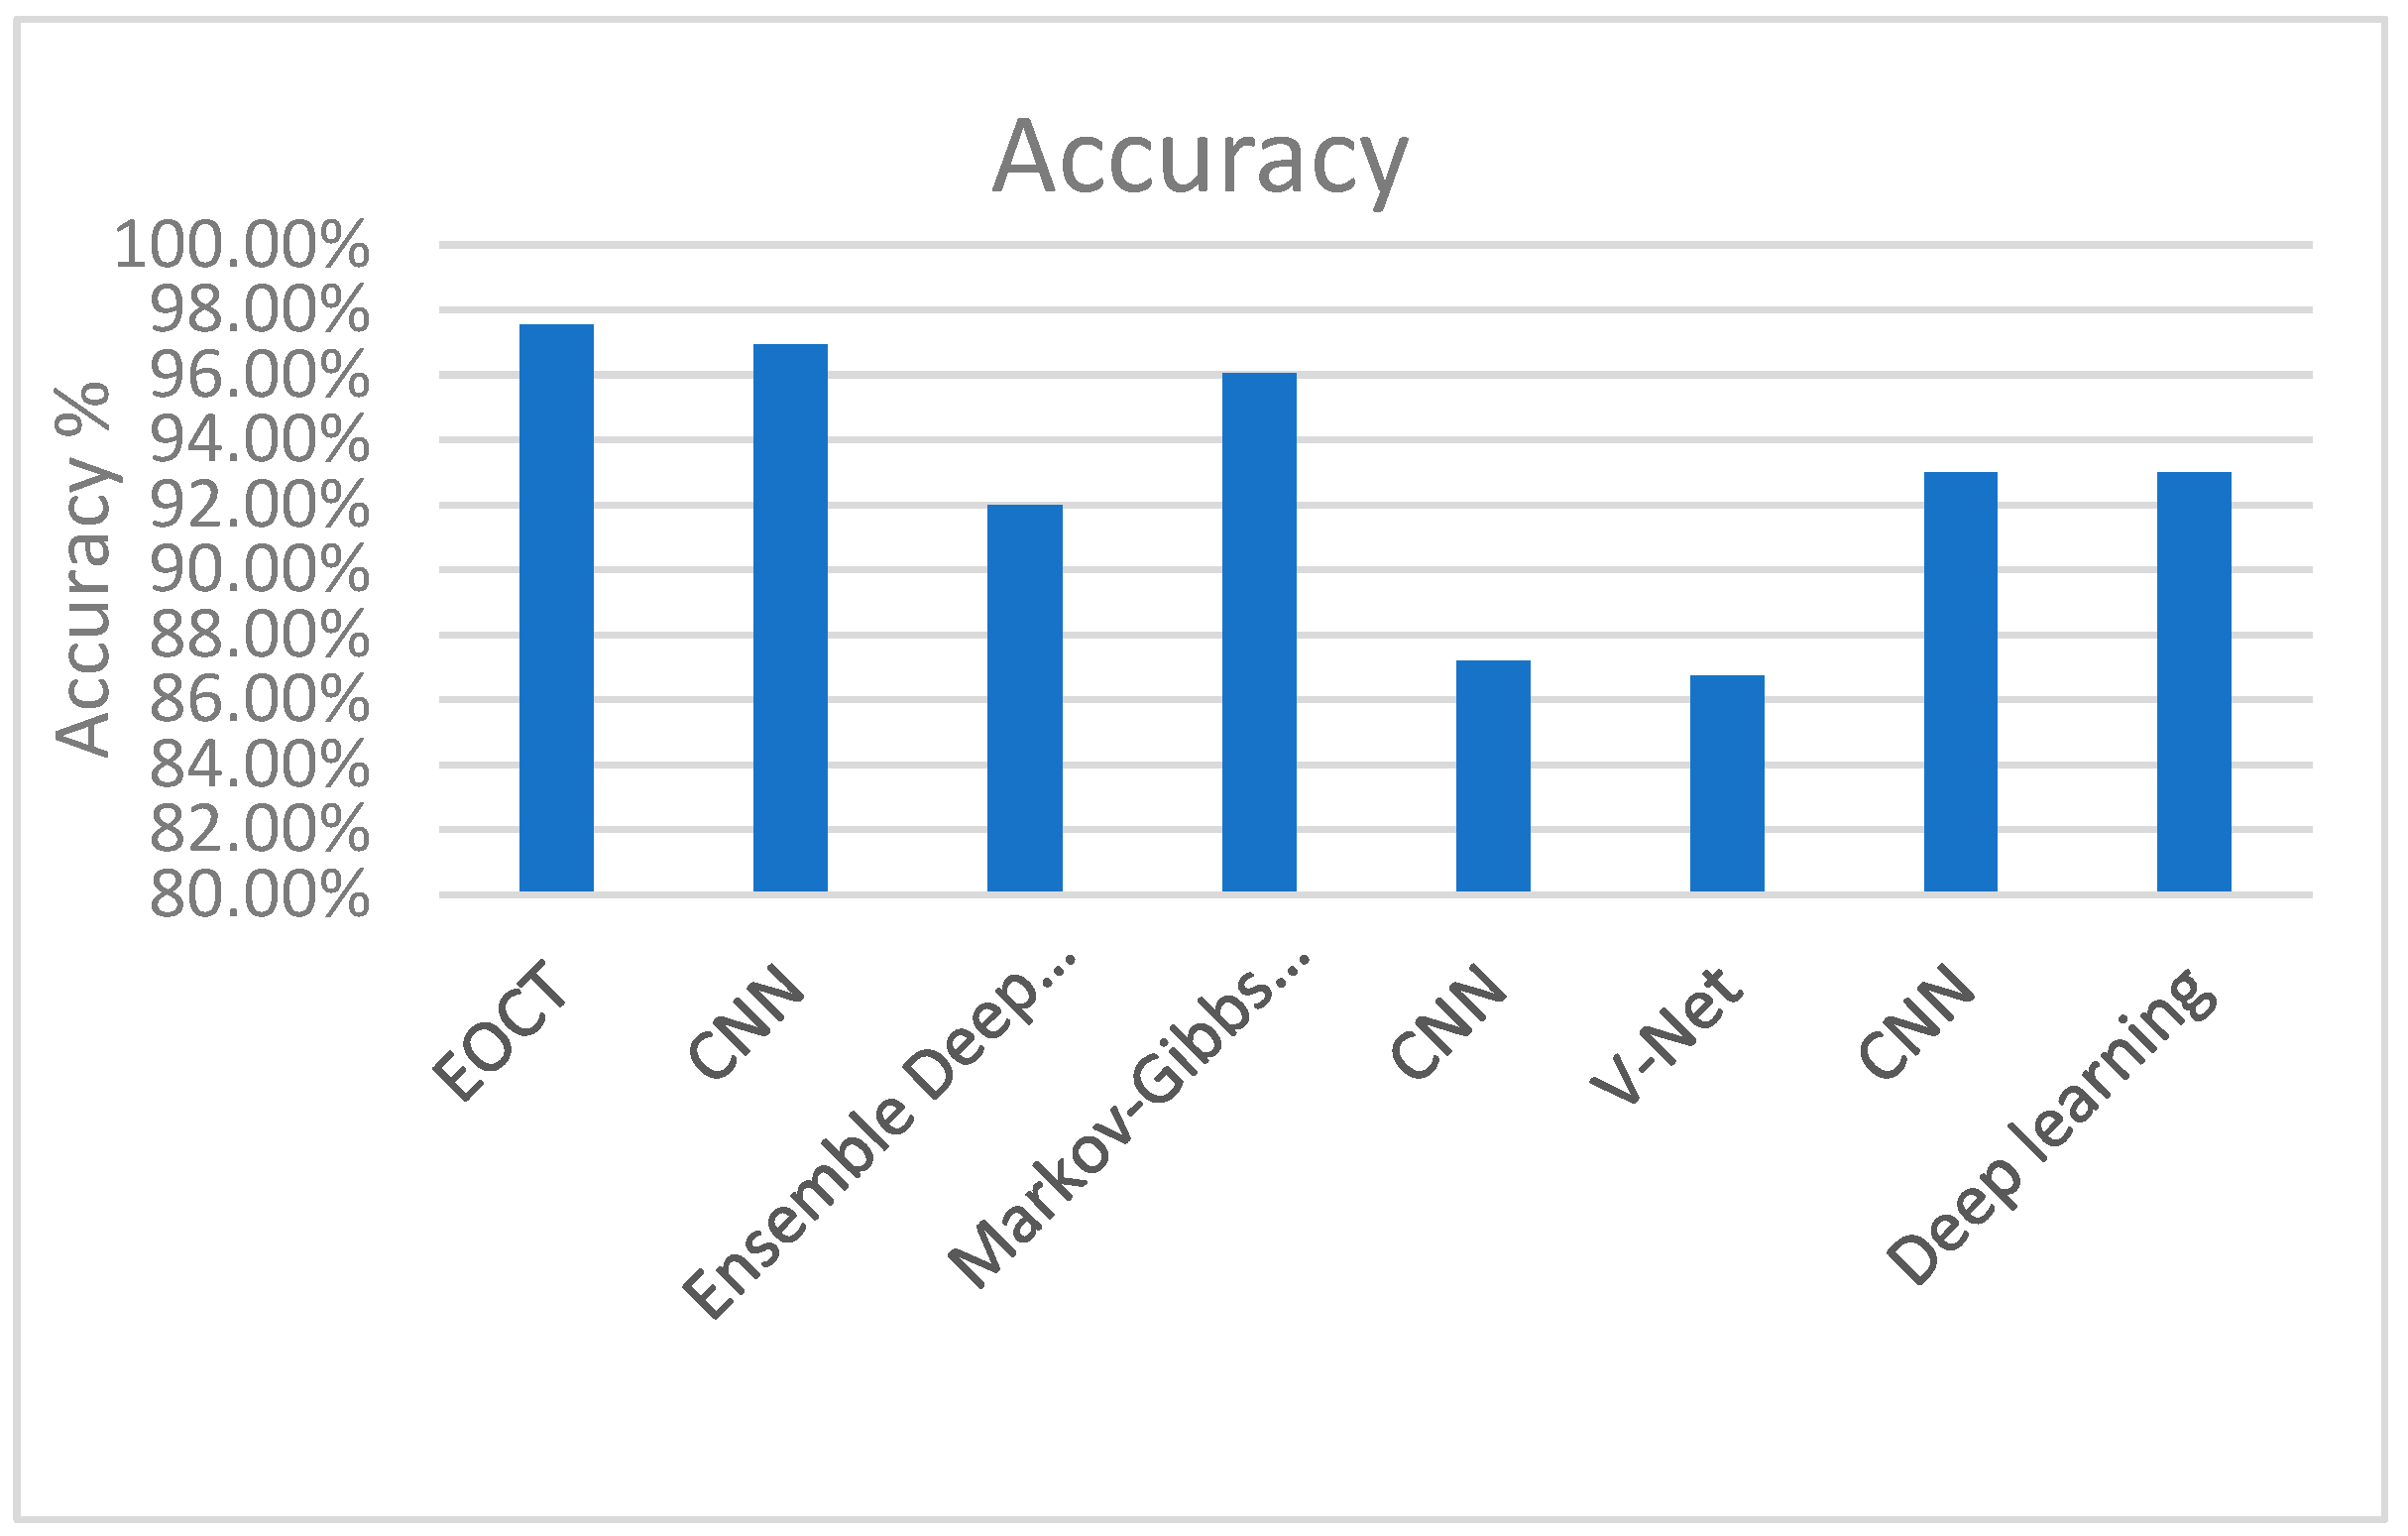
| Year | Reference | Model | Dataset | Data Size | Accuracy |
|---|---|---|---|---|---|
| 2023 | The proposed work | EOCT | OCT2017 | 84,495 X-ray images | 97.47% |
| 2023 | Diao et al. [20] | CNN | OCT2017 | _ | 96.93% |
| 2020 | Heisler et al. [21] | Ensemble Deep Learning | OCT2017 | _ | 92% |
| 2017 | Eladawi et al. [22] | Markov–Gibbs Random Field | OCT2017 | _ | 96.04% |
| 2020 | Le et al. [23] | CNN | OCT2017 | _ | 87.2% |
| 2020 | Alam et al. [24]. | V-Net | OCT2017 | _ | 86.75% |
| 2019 | Dáz et al. [25] | CNN | OCT2017 | _ | 93% |
| 2021 | Kim et al. [26] | Deep Learning | OCT2017 | _ | 93% |
| Year | Reference | Model | Task | Dataset | Evaluation Metrics (%) |
|---|---|---|---|---|---|
| 2023 | Diao et al. [20] | CNN | Retinal OCT Disease Classification | OCT2017 | ACC = 96.93 |
| 2018 | Shen et al. [35] | Structure-Oriented Transformer | Retinal OCT Disease Classification | N/A | |
| 2020 | Heisler et al. [21] | Ensemble Deep Learning | Retinal OCT Disease Classification | ACC = 92 | |
| 2017 | Eladawi et al. [22] | Markov–Gibbs Random Field | Retinal OCT Disease segmentation | DSC = 96.04%. | |
| 2020 | Le et al. [23] | CNN | Retinal OCT Disease classification | ACC = 87.2 | |
| 2020 | Alam et al. [24] | V-Net | Retinal OCT Disease classification | ACC = 86.75 | |
| 2019 | Diáz et al. [25] | CNN | Retinal OCT Disease classification | ACC = 93 | |
| 2021 | Kim et al. [26] | Deep learning | Retinal OCT Disease Classification | ACC = 0.93 | |
| 2020 | Ong et al. [37] | Deep Capillary Plexus (DCP) | Retinal OCT Disease Classification | Sensitivity = 83.3% | |
| 2018 | Hamwood et al. [38] | CNN | Retinal OCT Disease Classification | N/A | |
| 2016 | He et al. [31] | OCT Disease Classification | Image Classification | ACC = 86.65 |
Disclaimer/Publisher’s Note: The statements, opinions and data contained in all publications are solely those of the individual author(s) and contributor(s) and not of MDPI and/or the editor(s). MDPI and/or the editor(s) disclaim responsibility for any injury to people or property resulting from any ideas, methods, instructions or products referred to in the content. |
© 2023 by the authors. Licensee MDPI, Basel, Switzerland. This article is an open access article distributed under the terms and conditions of the Creative Commons Attribution (CC BY) license (https://creativecommons.org/licenses/by/4.0/).
Share and Cite
Hassan, E.; Elmougy, S.; Ibraheem, M.R.; Hossain, M.S.; AlMutib, K.; Ghoneim, A.; AlQahtani, S.A.; Talaat, F.M. Enhanced Deep Learning Model for Classification of Retinal Optical Coherence Tomography Images. Sensors 2023, 23, 5393. https://0-doi-org.brum.beds.ac.uk/10.3390/s23125393
Hassan E, Elmougy S, Ibraheem MR, Hossain MS, AlMutib K, Ghoneim A, AlQahtani SA, Talaat FM. Enhanced Deep Learning Model for Classification of Retinal Optical Coherence Tomography Images. Sensors. 2023; 23(12):5393. https://0-doi-org.brum.beds.ac.uk/10.3390/s23125393
Chicago/Turabian StyleHassan, Esraa, Samir Elmougy, Mai R. Ibraheem, M. Shamim Hossain, Khalid AlMutib, Ahmed Ghoneim, Salman A. AlQahtani, and Fatma M. Talaat. 2023. "Enhanced Deep Learning Model for Classification of Retinal Optical Coherence Tomography Images" Sensors 23, no. 12: 5393. https://0-doi-org.brum.beds.ac.uk/10.3390/s23125393