
Naturalistic Hyperscanning with Wearable Magnetoencephalography
 , , ,
, , , 
Abstract
:1. Introduction
2. Materials and Methods
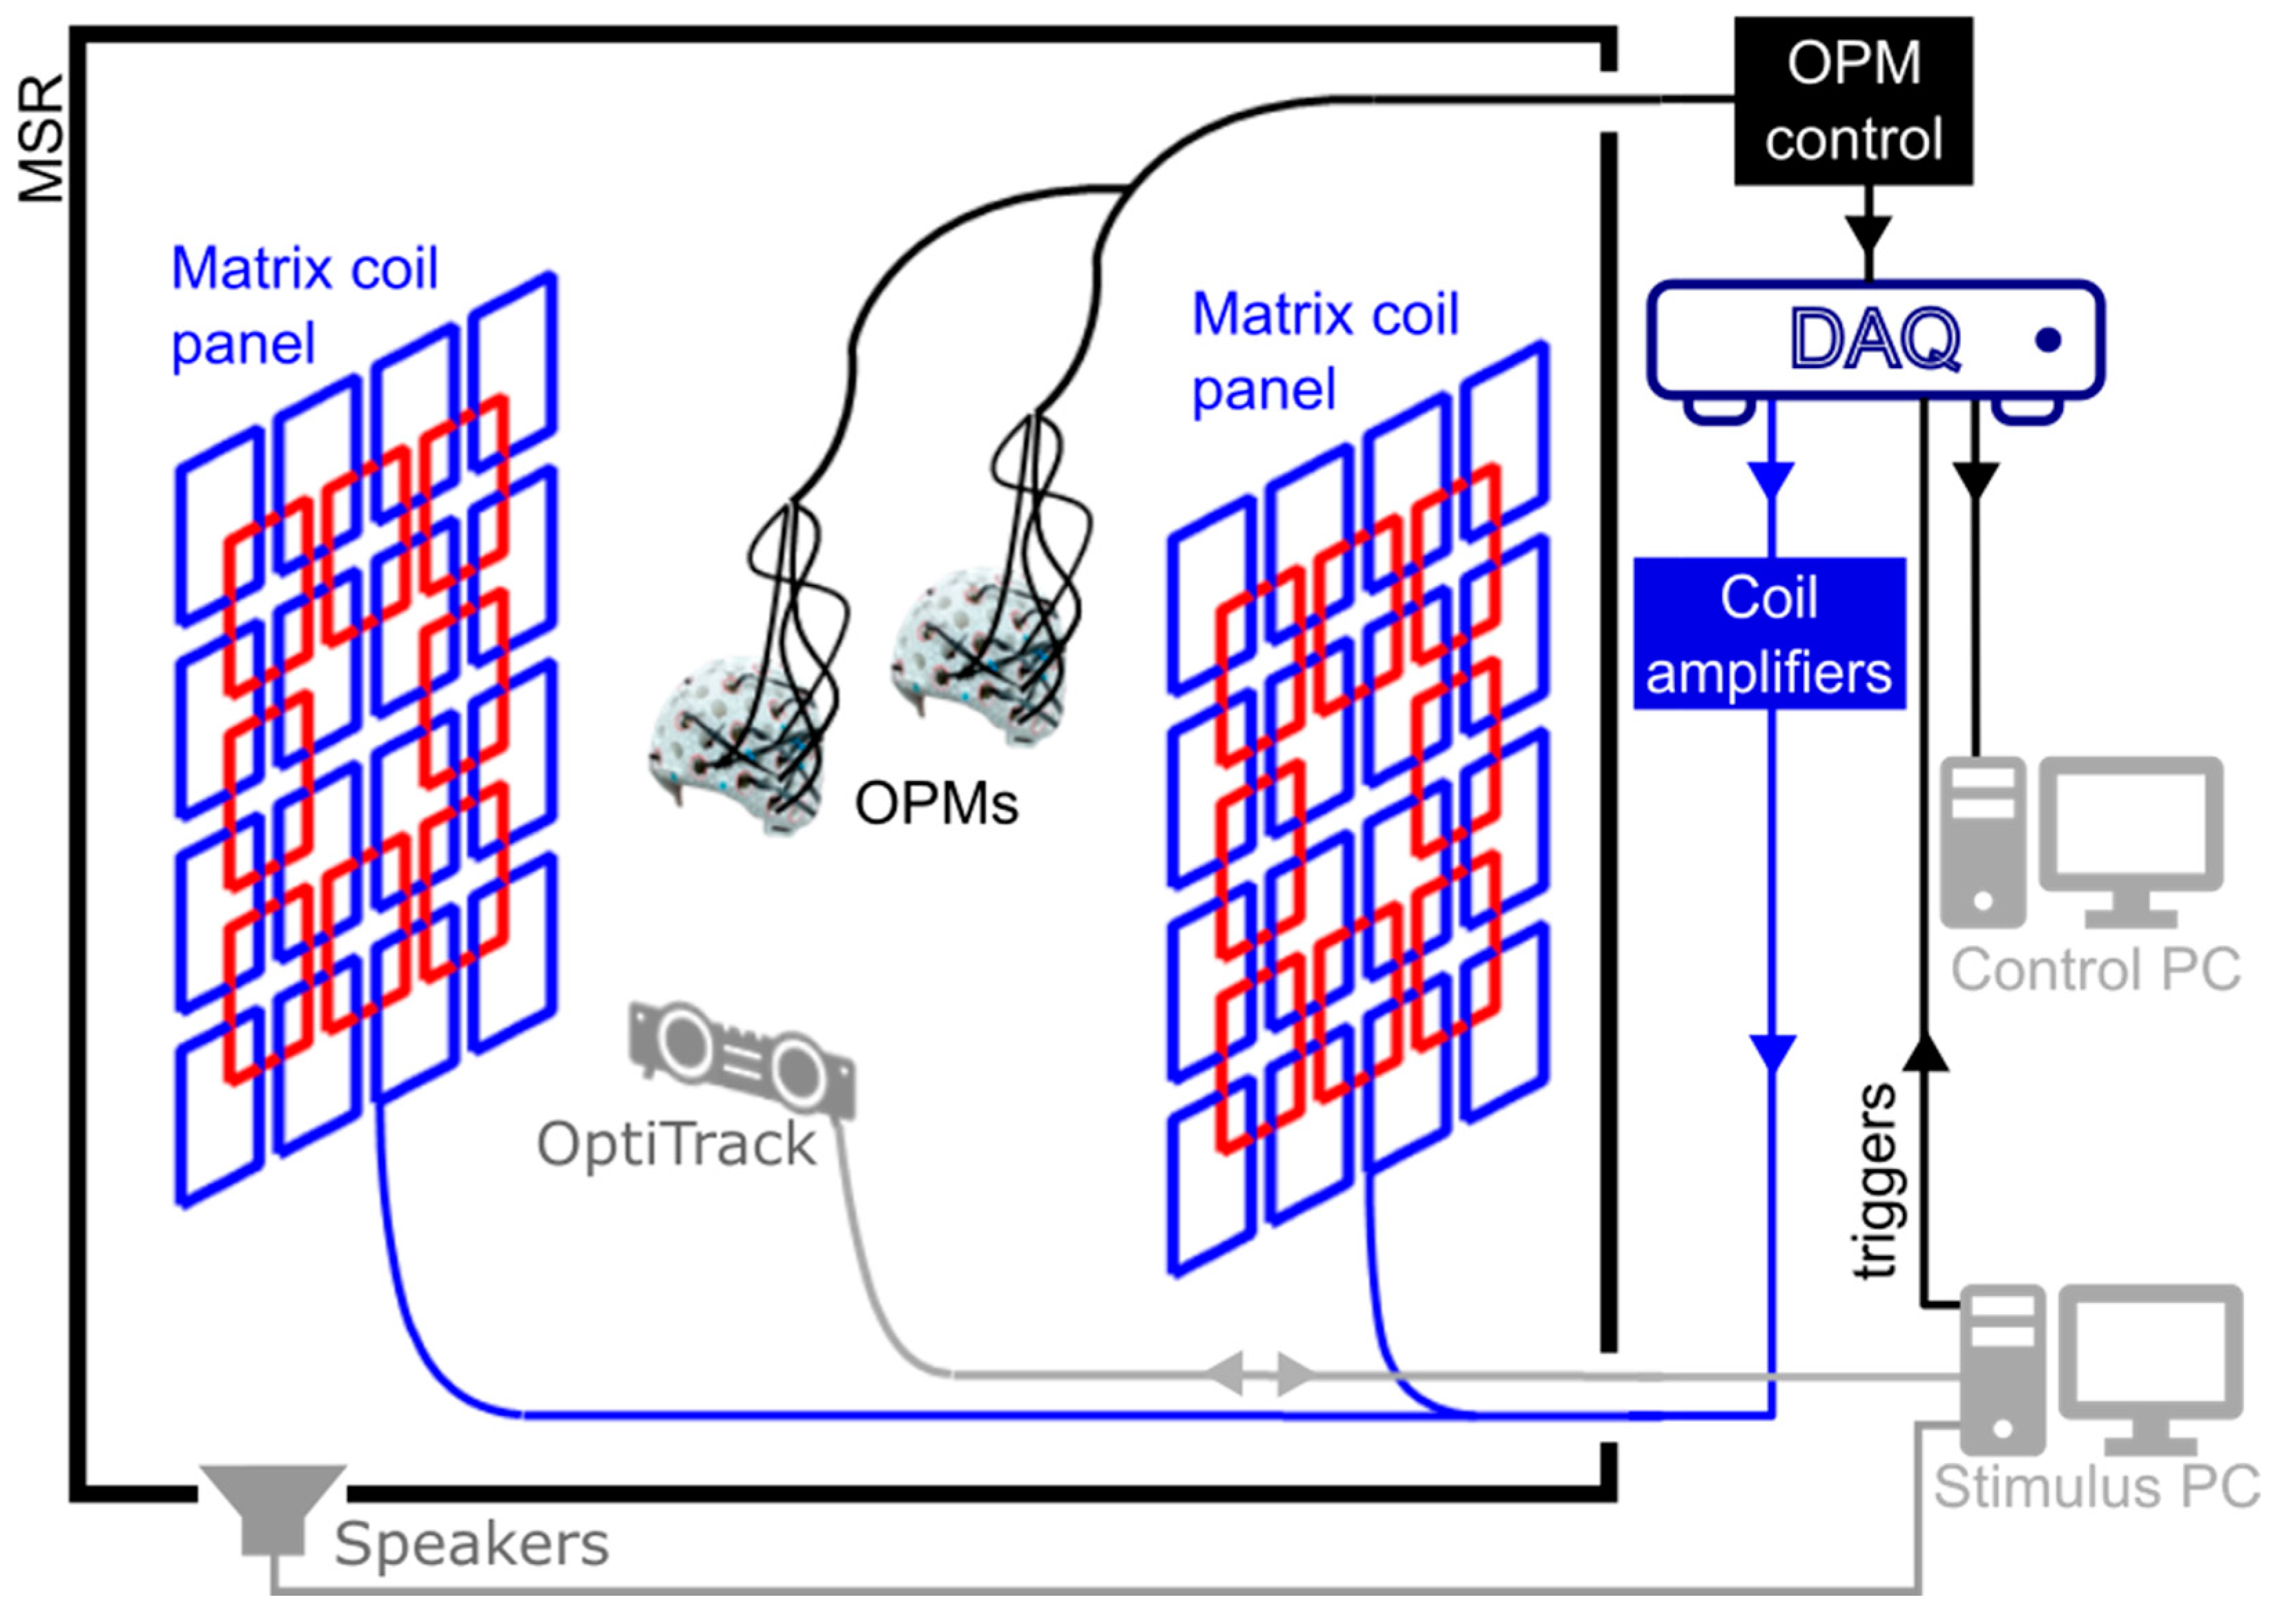
2.1. OPM-MEG System
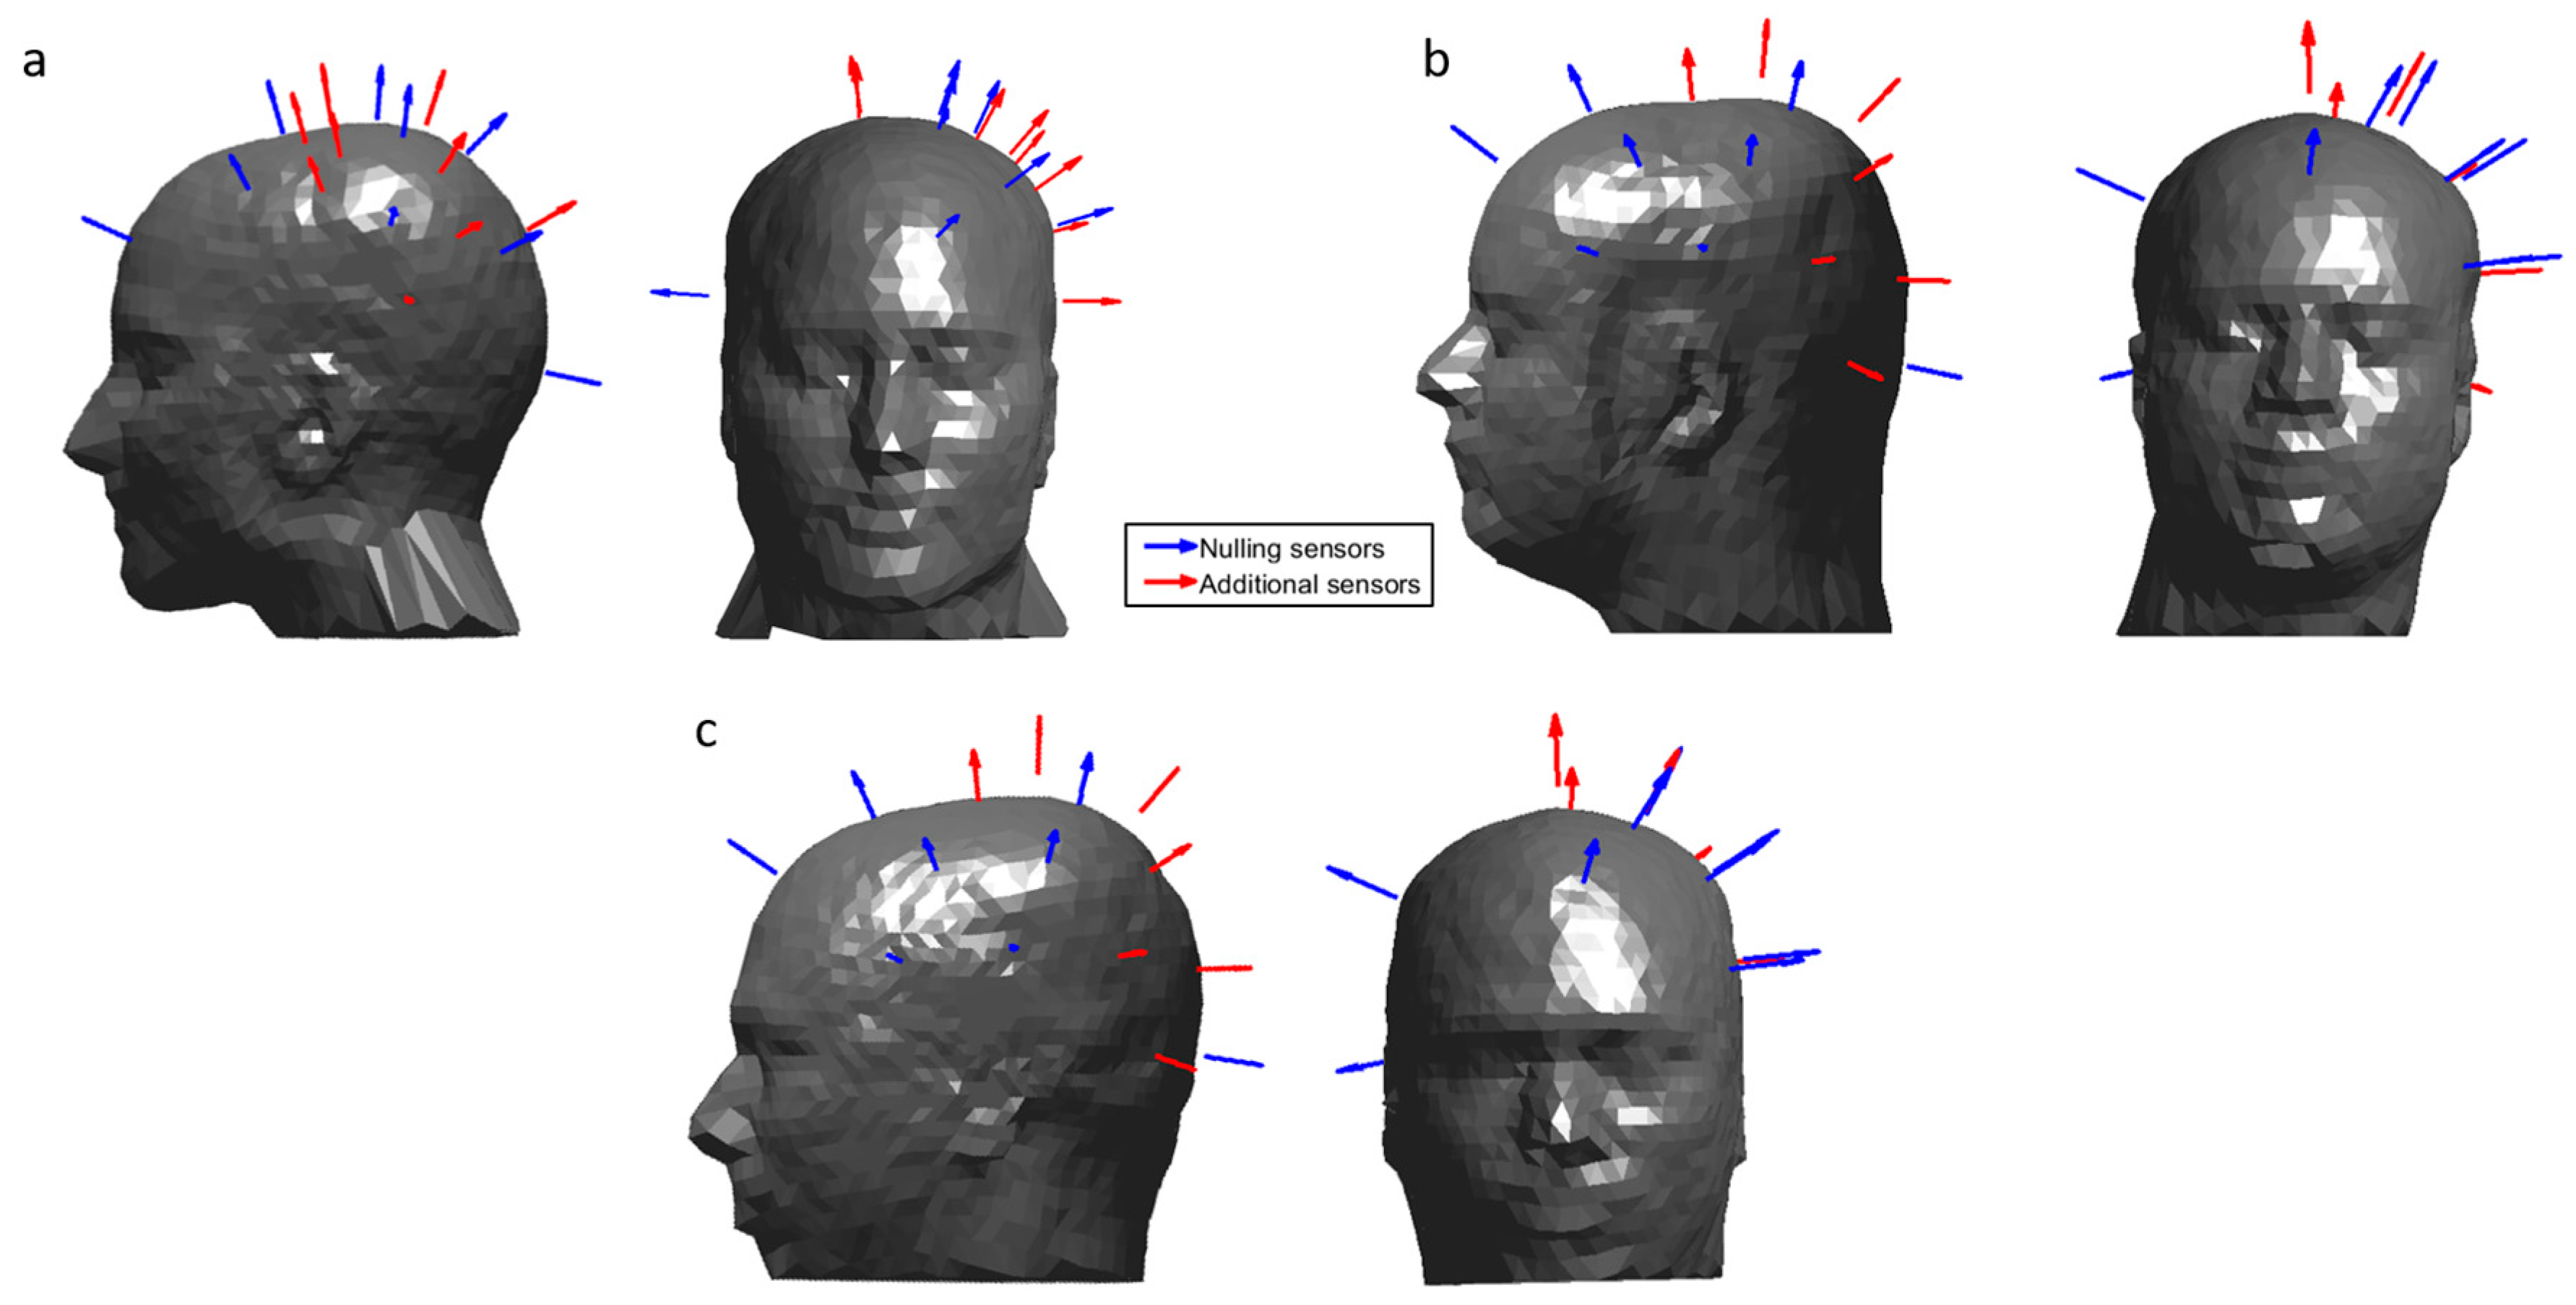
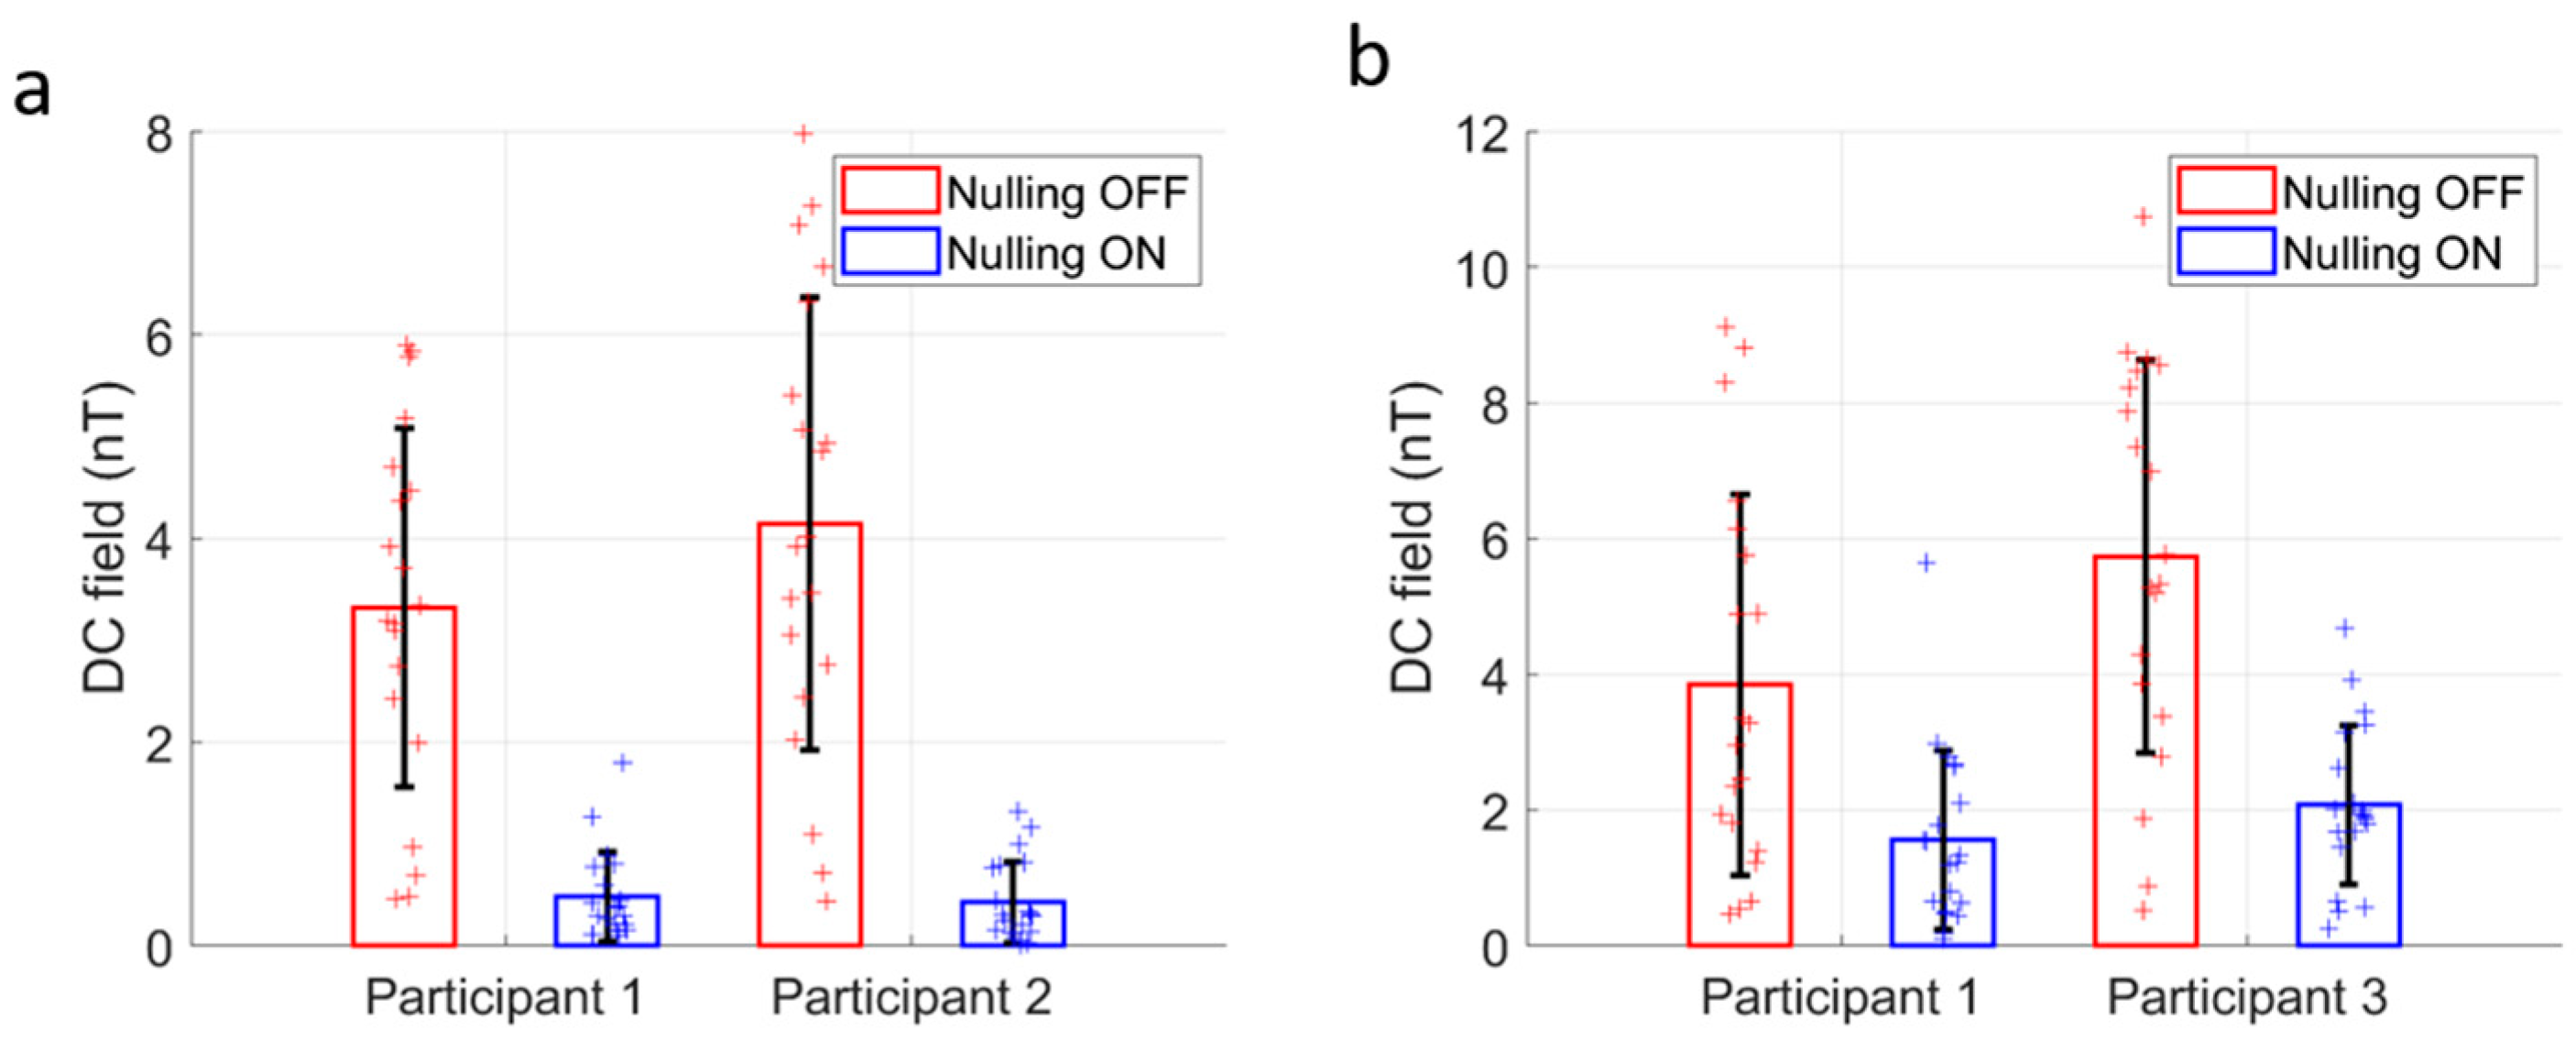
2.2. Matrix Coils
2.3. Data Acquisition
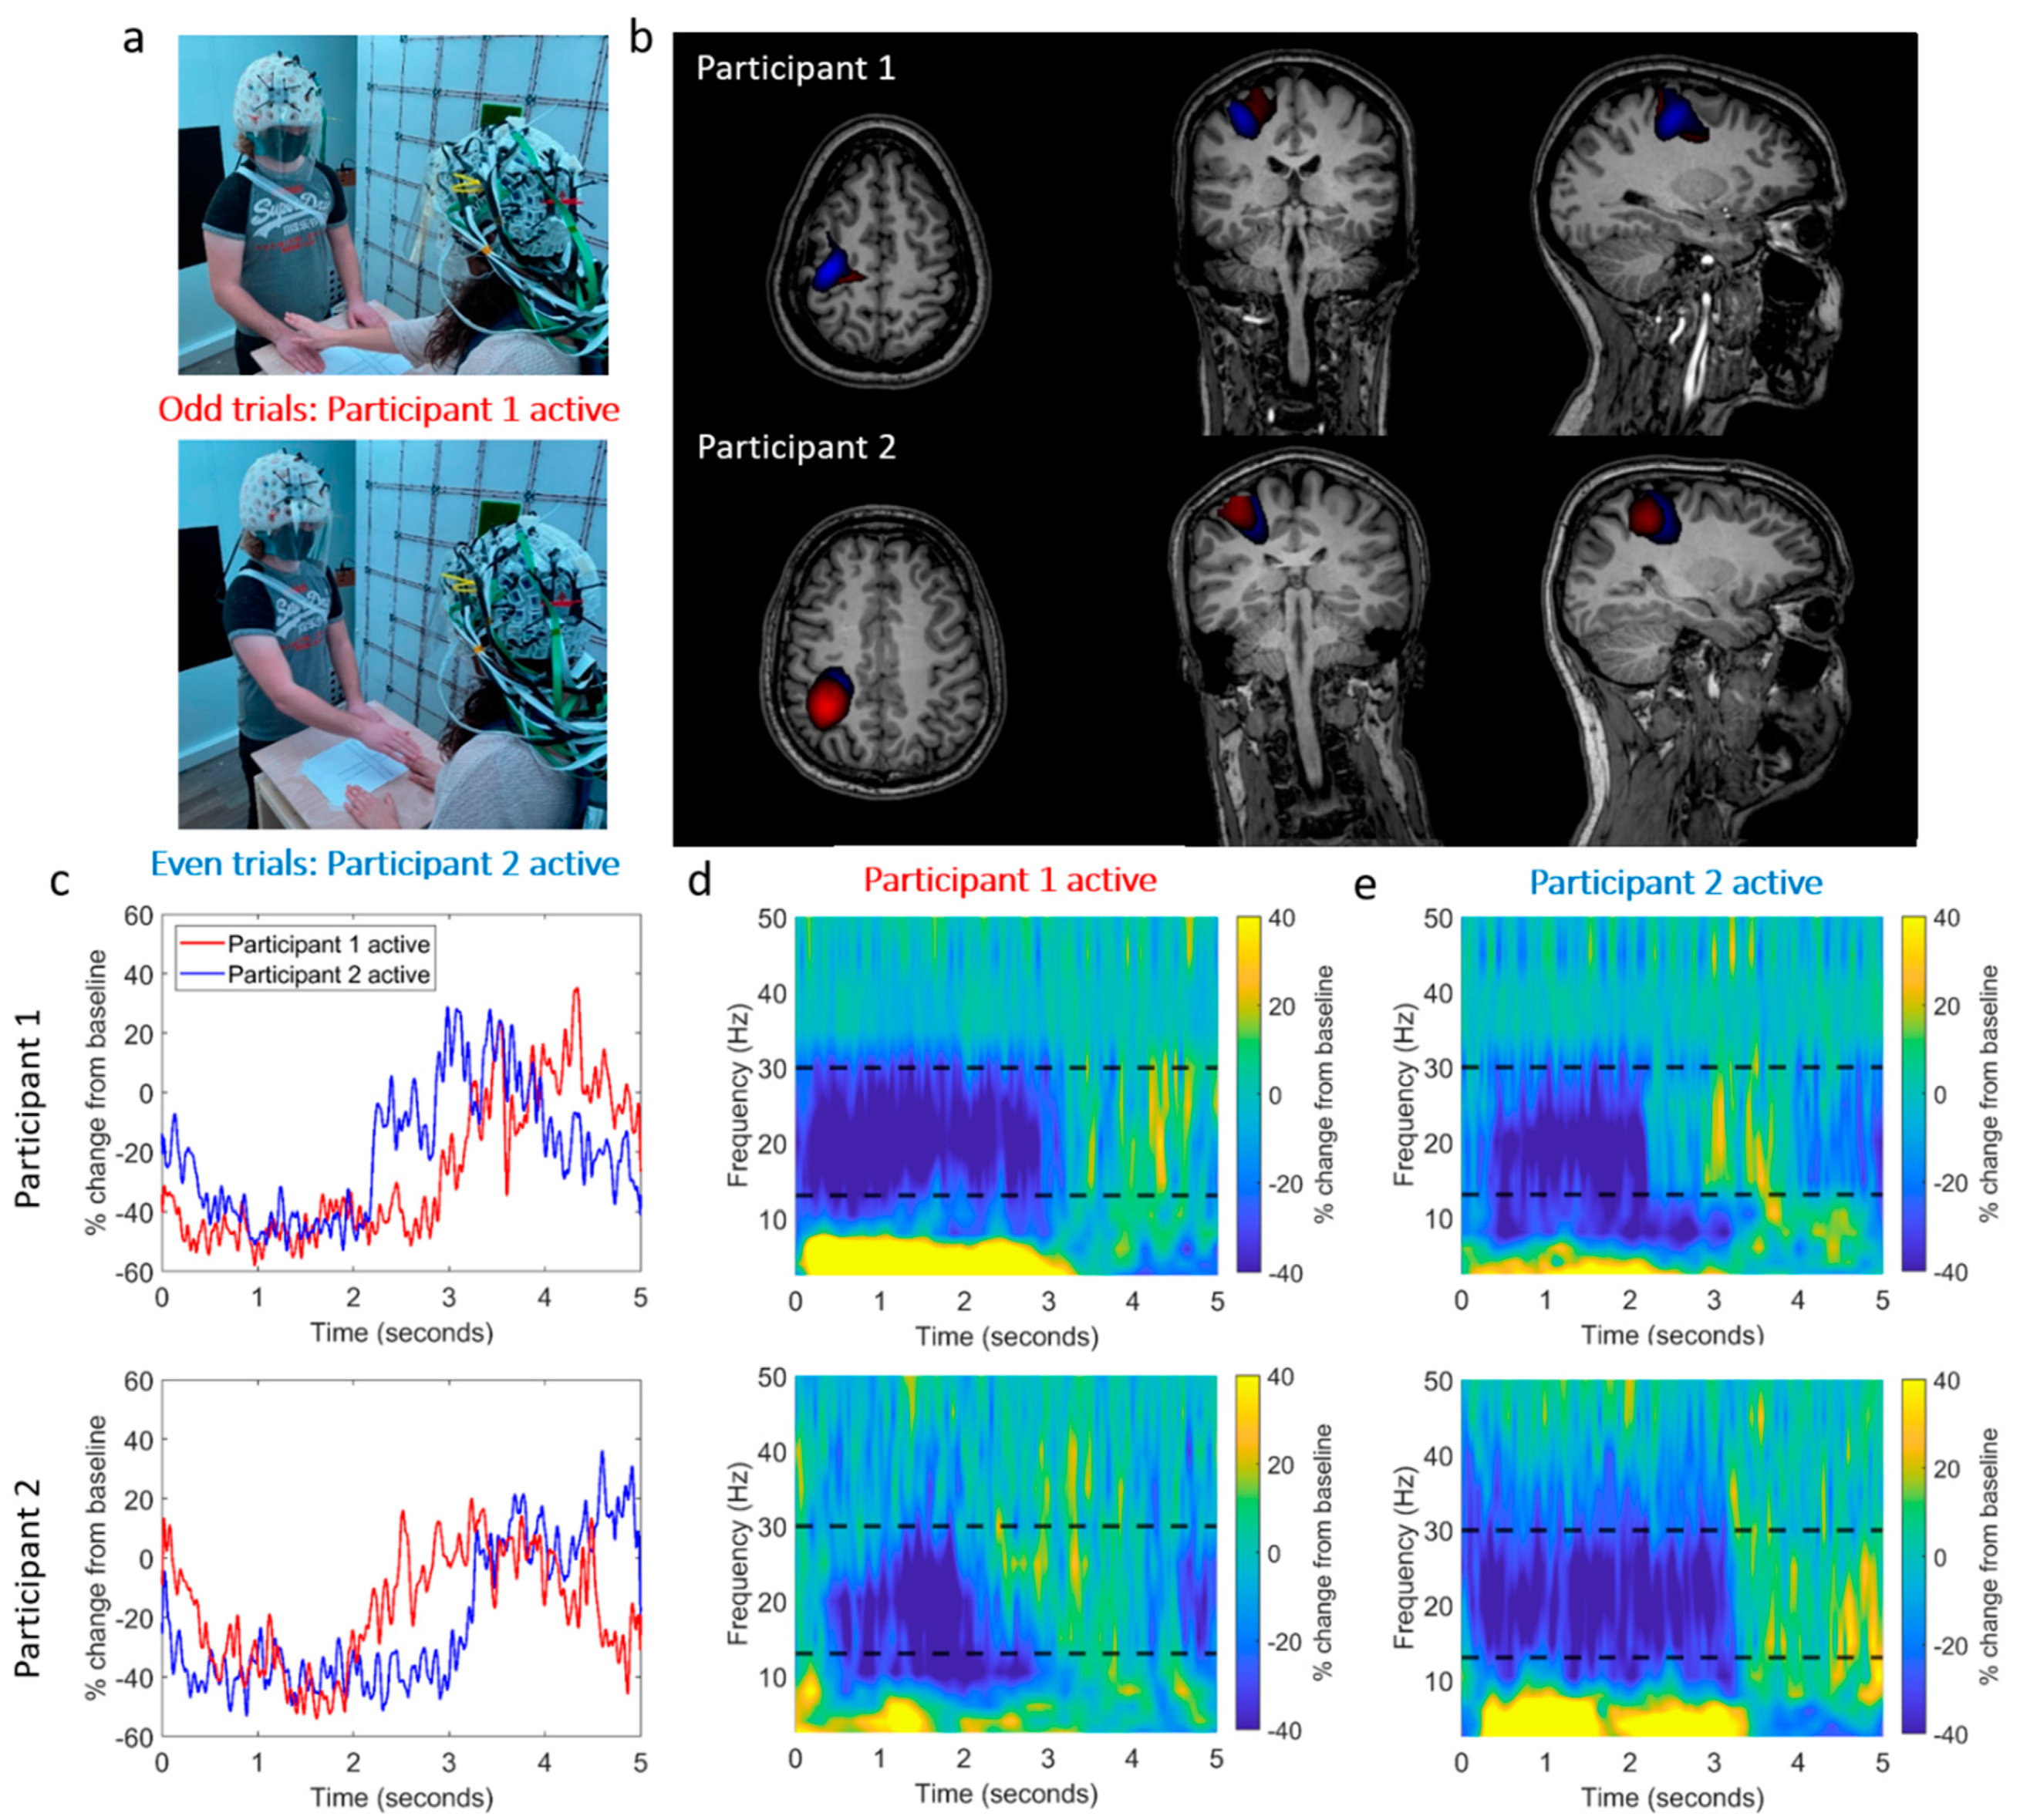
3. Two-Person Touching Task
3.1. Methods
3.2. Results
4. Two-Person Ball Game
4.1. Methods
4.2. Results
5. Discussion
6. Conclusions
Author Contributions
Funding
Institutional Review Board Statement
Informed Consent Statement
Data Availability Statement
Conflicts of Interest
References
- Hari, R.; Henriksson, L.; Malinen, S.; Parkkonen, L. Centrality of Social Interaction in Human Brain Function. Neuron 2015, 88, 181–193. [Google Scholar] [CrossRef] [PubMed] [Green Version]
- Hari, R.; Kujala, M.V. Brain Basis of Human Social Interaction: From Concepts to Brain Imaging. Physiol. Rev. 2009, 89, 453–479. [Google Scholar] [CrossRef] [PubMed] [Green Version]
- Czeszumski, A.; Eustergerling, S.; Lang, A.; Menrath, D.; Gerstenberger, M.; Schuberth, S.; Schreiber, F.; Rendon, Z.Z.; König, P. Hyperscanning: A Valid Method to Study Neural Inter-Brain Underpinnings of Social Interaction. Front. Hum. Neurosci. 2020, 14, 39. [Google Scholar] [CrossRef] [PubMed] [Green Version]
- Renvall, V.; Kauramäki, J.; Malinen, S.; Hari, R.; Nummenmaa, L. Imaging Real-Time Tactile Interaction with Two-Person Dual-Coil FMRI. Front. Psychiatry 2020, 11, 279. [Google Scholar] [CrossRef]
- Lee, R.F.; Dai, W.; Jones, J. Decoupled Circular-Polarized Dual-Head Volume Coil Pair for Studying Two Interacting Human Brains with Dyadic FMRI. Magn. Reson. Med. 2012, 68, 1087–1096. [Google Scholar] [CrossRef] [PubMed]
- Montague, P.R.; Berns, G.S.; Cohen, J.D.; McClure, S.M.; Pagnoni, G.; Dhamala, M.; Wiest, M.C.; Karpov, I.; King, R.D.; Apple, N.; et al. Hyperscanning: Simultaneous FMRI during Linked Social Interactions. Neuroimage 2002, 16, 1159–1164. [Google Scholar] [CrossRef]
- King-Casas, B.; Tomlin, D.; Anen, C.; Camerer, C.F.; Quartz, S.R.; Montague, P.R. Getting to Know You: Reputation and Trust in a Two-Person Economic Exchange. Science 2005, 308, 78–83. [Google Scholar] [CrossRef] [Green Version]
- Ferrari, M.; Quaresima, V. A Brief Review on the History of Human Functional Near-Infrared Spectroscopy (FNIRS) Development and Fields of Application. Neuroimage 2012, 63, 921–935. [Google Scholar] [CrossRef]
- Lopes da Silva, F. EEG and MEG: Relevance to Neuroscience. Neuron 2013, 80, 1112–1128. [Google Scholar] [CrossRef] [Green Version]
- Leong, V.; Byrne, E.; Clackson, K.; Georgieva, S.; Lam, S.; Wass, S. Speaker Gaze Increases Information Coupling between Infant and Adult Brains. Proc. Natl. Acad. Sci. USA 2017, 114, 13290–13295. [Google Scholar] [CrossRef] [Green Version]
- Reindl, V.; Gerloff, C.; Scharke, W.; Konrad, K. Brain-to-Brain Synchrony in Parent-Child Dyads and the Relationship with Emotion Regulation Revealed by FNIRS-Based Hyperscanning. Neuroimage 2018, 178, 493–502. [Google Scholar] [CrossRef]
- Dikker, S.; Wan, L.; Davidesco, I.; Kaggen, L.; Oostrik, M.; McClintock, J.; Rowland, J.; Michalareas, G.; Van Bavel, J.J.; Ding, M.; et al. Brain-to-Brain Synchrony Tracks Real-World Dynamic Group Interactions in the Classroom. Curr. Biol. 2017, 27, 1375–1380. [Google Scholar] [CrossRef]
- Muthukumaraswamy, S.D. High-Frequency Brain Activity and Muscle Artifacts in MEG/EEG: A Review and Recommendations. Front. Hum. Neurosci. 2013, 7, 138. [Google Scholar] [CrossRef] [Green Version]
- Cohen, D. Magnetoencephalography: Evidence of Magnetic Fields Produced by Alpha-Rhythm Currents. Science 1968, 161, 784–786. [Google Scholar] [CrossRef]
- Hämäläinen, M.; Hari, R.; Ilmoniemi, R.J.; Knuutila, J.; Lounasmaa, O.V. Magnetoencephalography Theory, Instrumentation, and Applications to Noninvasive Studies of the Working Human Brain. Rev. Mod. Phys. 1993, 65, 413–497. [Google Scholar] [CrossRef] [Green Version]
- Baillet, S. Magnetoencephalography for Brain Electrophysiology and Imaging. Nat. Neurosci. 2017, 20, 327–339. [Google Scholar] [CrossRef]
- Boto, E.; Seedat, Z.A.; Holmes, N.; Leggett, J.; Hill, R.M.; Roberts, G.; Shah, V.; Fromhold, T.M.; Mullinger, K.J.; Tierney, T.M.; et al. Wearable Neuroimaging: Combining and Contrasting Magnetoencephalography and Electroencephalography. Neuroimage 2019, 201, 116099. [Google Scholar] [CrossRef]
- Cohen, D. Magnetoencephalography: Detection of the Brain’s Electrical Activity with a Superconducting Magnetometer. Science 1972, 175, 664–666. [Google Scholar] [CrossRef]
- Hirata, M.; Ikeda, T.; Kikuchi, M.; Kimura, T.; Hiraishi, H.; Yoshimura, Y.; Asada, M. Hyperscanning MEG for Understanding Mother-Child Cerebral Interactions. Front. Hum. Neurosci. 2014, 8, 118. [Google Scholar] [CrossRef] [Green Version]
- Baess, P.; Zhdanov, A.; Mandel, A.; Parkkonen, L.; Hirvenkari, L.; Mäkelä, J.P.; Jousmäki, V.; Hari, R. MEG Dual Scanning: A Procedure to Study Real-Time Auditory Interaction between Two Persons. Front. Hum. Neurosci. 2012, 6, 83. [Google Scholar] [CrossRef] [Green Version]
- Zhdanov, A.; Nurminen, J.; Baess, P.; Hirvenkari, L.; Jousmäki, V.; Mäkelä, J.P.; Mandel, A.; Meronen, L.; Hari, R.; Parkkonen, L. An Internet-Based Real-Time Audiovisual Link for Dual MEG Recordings. PLoS ONE 2015, 10, e0128485. [Google Scholar] [CrossRef] [PubMed] [Green Version]
- Levy, J.; Goldstein, A.; Feldman, R. Perception of Social Synchrony Induces Mother-Child Gamma Coupling in the Social Brain. Soc. Cogn. Affect. Neurosci. 2017, 12, 1036–1046. [Google Scholar] [CrossRef] [PubMed]
- Levy, J.; Lankinen, K.; Hakonen, M.; Feldman, R. The Integration of Social and Neural Synchrony: A Case for Ecologically Valid Research Using MEG Neuroimaging. Soc. Cogn. Affect. Neurosci. 2021, 16, 143–152. [Google Scholar] [CrossRef] [PubMed]
- Boto, E.; Holmes, N.; Leggett, J.; Roberts, G.; Shah, V.; Meyer, S.S.; Muñoz, L.D.; Mullinger, K.J.; Tierney, T.M.; Bestmann, S.; et al. Moving Magnetoencephalography towards Real-World Applications with a Wearable System. Nature 2018, 555, 657–661. [Google Scholar] [CrossRef] [PubMed] [Green Version]
- Brookes, M.J.; Leggett, J.; Rea, M.; Hill, R.M.; Holmes, N.; Boto, E.; Bowtell, R. Magnetoencephalography with Optically Pumped Magnetometers (OPM-MEG): The next Generation of Functional Neuroimaging. Trends Neurosci. 2022, 45, 621–634. [Google Scholar] [CrossRef]
- Boto, E.; Bowtell, R.; Krüger, P.; Fromhold, T.M.; Morris, P.G.; Meyer, S.S.; Barnes, G.R.; Brookes, M.J. On the Potential of a New Generation of Magnetometers for MEG: A Beamformer Simulation Study. PLoS ONE 2016, 11, e0157655. [Google Scholar] [CrossRef] [Green Version]
- Iivanainen, J.; Stenroos, M.; Parkkonen, L. Measuring MEG Closer to the Brain: Performance of on-Scalp Sensor Arrays. Neuroimage 2017, 147, 542–553. [Google Scholar] [CrossRef]
- Roberts, G.; Holmes, N.; Alexander, N.; Boto, E.; Leggett, J.; Hill, R.M.; Shah, V.; Rea, M.; Vaughan, R.; Maguire, E.A.; et al. Towards OPM-MEG in a Virtual Reality Environment. Neuroimage 2019, 199, 408–417. [Google Scholar] [CrossRef]
- Rea, M.; Boto, E.; Holmes, N.; Hill, R.; Osborne, J.; Rhodes, N.; Leggett, J.; Rier, L.; Bowtell, R.; Shah, V.; et al. A 90-Channel Triaxial Magnetoencephalography System Using Optically Pumped Magnetometers. Ann. N. Y. Acad. Sci. 2022, 1517, 107–124. [Google Scholar] [CrossRef]
- Seymour, R.A.; Alexander, N.; Mellor, S.; O’Neill, G.C.; Tierney, T.M.; Barnes, G.R.; Maguire, E.A. Using OPMs to Measure Neural Activity in Standing, Mobile Participants. Neuroimage 2021, 244, 118604. [Google Scholar] [CrossRef]
- Hill, R.M.; Boto, E.; Holmes, N.; Hartley, C.; Seedat, Z.A.; Leggett, J.; Roberts, G.; Shah, V.; Tierney, T.M.; Woolrich, M.W.; et al. A Tool for Functional Brain Imaging with Lifespan Compliance. Nat. Commun. 2019, 10, 4785. [Google Scholar] [CrossRef] [Green Version]
- Feys, O.; Corvilain, P.; Aeby, A.; Sculier, C.; Holmes, N.; Brookes, M.; Goldman, S.; Wens, V.; De Tiège, X. On-Scalp Optically Pumped Magnetometers versus Cryogenic Magnetoencephalography for Diagnostic Evaluation of Epilepsy in School-Aged Children. Radiology 2022, 304, 429–434. [Google Scholar] [CrossRef]
- Allred, J.C.; Lyman, R.N.; Kornack, T.W.; Romalis, M.V. High-Sensitivity Atomic Magnetometer Unaffected by Spin-Exchange Relaxation. Phys. Rev. Lett. 2002, 89, 130801. [Google Scholar] [CrossRef] [Green Version]
- Holmes, N.; Leggett, J.; Boto, E.; Roberts, G.; Hill, R.M.; Tierney, T.M.; Shah, V.; Barnes, G.R.; Brookes, M.J.; Bowtell, R. A Bi-Planar Coil System for Nulling Background Magnetic Fields in Scalp Mounted Magnetoencephalography. Neuroimage 2018, 181, 760–774. [Google Scholar] [CrossRef]
- Iivanainen, J.; Zetter, R.; Grön, M.; Hakkarainen, K.; Parkkonen, L. On-Scalp MEG System Utilizing an Actively Shielded Array of Optically-Pumped Magnetometers. Neuroimage 2019, 194, 244–258. [Google Scholar] [CrossRef]
- Borna, A.; Carter, T.R.; Colombo, A.P.; Jau, Y.Y.; McKay, J.; Weisend, M.; Taulu, S.; Stephen, J.M.; Schwindt, P.D.D. Non-Invasive Functional-Brain-Imaging with an OPM-Based Magnetoencephalography System. PLoS ONE 2020, 15, e0227684. [Google Scholar] [CrossRef] [Green Version]
- Holmes, N.; Tierney, T.M.; Leggett, J.; Boto, E.; Mellor, S.; Roberts, G.; Hill, R.M.; Shah, V.; Barnes, G.R.; Brookes, M.J.; et al. Balanced, Bi-Planar Magnetic Field and Field Gradient Coils for Field Compensation in Wearable Magnetoencephalography. Sci. Rep. 2019, 9, 14196. [Google Scholar] [CrossRef] [Green Version]
- Holmes, N.; Rea, M.; Chalmers, J.; Leggett, J.; Edwards, L.J.; Nell, P.; Pink, S.; Patel, P.; Wood, J.; Murby, N.; et al. OPEN A Lightweight Magnetically Shielded Room with Active Shielding. Sci. Rep. 2022, 12, 13561. [Google Scholar] [CrossRef]
- Holmes, N.; Rea, M.; Hill, R.M.; Leggett, J.; Edwards, L.J.; Hobson, P.J.; Boto, E.; Tierney, T.M.; Rier, L.; Reina, G.; et al. NeuroImage Enabling Ambulatory Movement in Wearable Magnetoencephalography with Matrix Coil Active Magnetic Shielding. Neuroimage 2023, 274, 120157. [Google Scholar] [CrossRef]
- Hill, R.M.; Boto, E.; Rea, M.; Holmes, N.; Leggett, J.; Coles, L.A.; Papastavrou, M.; Everton, S.K.; Hunt, B.A.E.; Sims, D.; et al. Multi-Channel Whole-Head OPM-MEG: Helmet Design and a Comparison with a Conventional System. Neuroimage 2020, 219, 116995. [Google Scholar] [CrossRef]
- Altarev, I.; Fierlinger, P.; Lins, T.; Marino, M.G.; Nießen, B.; Petzoldt, G.; Reisner, M.; Stuiber, S.; Sturm, M.; Taggart Singh, J.; et al. Minimizing Magnetic Fields for Precision Experiments. J. Appl. Phys. 2015, 117, 233903. [Google Scholar] [CrossRef] [Green Version]
- Voigt, J.; Knappe-Grüneberg, S.; Schnabel, A.; Körber, R.; Burghoff, M. Measures to Reduce the Residual Field and Field Gradient inside a Magnetically Shielded Room by a Factor of More than 10. Metrol. Meas. Syst. 2013, 20, 237–248. [Google Scholar] [CrossRef] [Green Version]
- Tierney, T.M.; Holmes, N.; Mellor, S.; López, J.D.; Roberts, G.; Hill, R.M.; Boto, E.; Leggett, J.; Shah, V.; Brookes, M.J.; et al. Optically Pumped Magnetometers: From Quantum Origins to Multi-Channel Magnetoencephalography. Neuroimage 2019, 199, 598–608. [Google Scholar] [CrossRef] [PubMed]
- Schofield, H.; Boto, E.; Shah, V.; Hill, R.M.; Osborne, J.; Rea, M.; Doyle, C.; Holmes, N.; Bowtell, R.; Woolger, D.; et al. Quantum Enabled Functional Neuroimaging: The Why and How of Magnetoencephalography Using Optically Pumped Magnetometers. Contemp. Phys. 2023. [Google Scholar] [CrossRef]
- Shah, V.; Osborne, J.; Orton, J.; Alem, O. Fully Integrated, Standalone Zero Field Optically Pumped Magnetometer for Biomagnetism. Steep Dispers. Eng. Opto-At. Precis. Metrol. XI 2018, 51, 89–95. [Google Scholar] [CrossRef]
- Boto, E.; Meyer, S.S.; Shah, V.; Alem, O.; Knappe, S.; Kruger, P.; Fromhold, T.M.; Lim, M.; Glover, P.M.; Morris, P.G.; et al. A New Generation of Magnetoencephalography: Room Temperature Measurements Using Optically-Pumped Magnetometers. Neuroimage 2017, 149, 404–414. [Google Scholar] [CrossRef]
- Zetter, R.; Iivanainen, J.; Parkkonen, L. Optical Co-Registration of MRI and On-Scalp MEG. Sci. Rep. 2019, 9, 5490. [Google Scholar] [CrossRef] [Green Version]
- Juchem, C.; Nixon, T.W.; McIntyre, S.; Rothman, D.L.; Graaf, R.A.D. Magnetic Field Modeling with a Set of Individual Localized Coils. J. Magn. Reson. 2010, 204, 281–289. [Google Scholar] [CrossRef] [Green Version]
- Garda, B.; Galias, Z. Tikhonov Regularization and Constrained Quadratic Programming for Magnetic Coil Design Problems. Int. J. Appl. Math. Comput. Sci. 2014, 24, 249–257. [Google Scholar] [CrossRef] [Green Version]
- Juchem, C.; Umesh Rudrapatna, S.; Nixon, T.W.; de Graaf, R.A. Dynamic Multi-Coil Technique (DYNAMITE) Shimming for Echo-Planar Imaging of the Human Brain at 7 Tesla. Neuroimage 2015, 105, 462–472. [Google Scholar] [CrossRef] [Green Version]
- Juchem, C.; Nixon, T.W.; McIntyre, S.; Boer, V.O.; Rothman, D.L.; De Graaf, R.A. Dynamic Multi-Coil Shimming of the Human Brain at 7 T. J. Magn. Reson. 2011, 212, 280–288. [Google Scholar] [CrossRef] [Green Version]
- Shah, V.; Hughes, J.K. Method for Detecting Zero-Field Resonance 2015. U.S. Patent No. 9,116,201, 25 August 2015. [Google Scholar]
- Pfurtscheller, G.; Lopes Da Silva, F.H. Event-Related EEG/MEG Synchronization and Desynchronization: Basic Principles. Clin. Neurophysiol. 1999, 110, 1842–1857. [Google Scholar] [CrossRef]
- Vrba, J.; Robinson, S.E. Signal Processing in Magnetoencephalography. Methods 2001, 25, 249–271. [Google Scholar] [CrossRef] [Green Version]
- Sarvas, J. Basic Mathematical and Electromagnetic Concepts of the Biomagnetic Inverse Problem. Phys. Med. Biol. 1987, 32, 11. [Google Scholar] [CrossRef] [Green Version]
- Dunbar, R.I.M. The Social Brain Hypothesis. Evol. Anthropol. 1998, 6, 178–190. [Google Scholar] [CrossRef]
- Nugent, A.C.; Benitez Andonegui, A.; Holroyd, T.; Robinson, S.E. On-Scalp Magnetocorticography with Optically Pumped Magnetometers: Simulated Performance in Resolving Simultaneous Sources. Neuroimage Rep. 2022, 2, 100093. [Google Scholar] [CrossRef]
- Borna, A.; Iivanainen, J.; Carter, T.R.; McKay, J.; Taulu, S.; Stephen, J.; Schwindt, P.D.D. Cross-Axis Projection Error in Optically Pumped Magnetometers and Its Implication for Magnetoencephalography Systems. Neuroimage 2022, 247, 118818. [Google Scholar] [CrossRef]


Disclaimer/Publisher’s Note: The statements, opinions and data contained in all publications are solely those of the individual author(s) and contributor(s) and not of MDPI and/or the editor(s). MDPI and/or the editor(s) disclaim responsibility for any injury to people or property resulting from any ideas, methods, instructions or products referred to in the content. |
© 2023 by the authors. Licensee MDPI, Basel, Switzerland. This article is an open access article distributed under the terms and conditions of the Creative Commons Attribution (CC BY) license (https://creativecommons.org/licenses/by/4.0/).
Share and Cite
Holmes, N.; Rea, M.; Hill, R.M.; Boto, E.; Leggett, J.; Edwards, L.J.; Rhodes, N.; Shah, V.; Osborne, J.; Fromhold, T.M.; et al. Naturalistic Hyperscanning with Wearable Magnetoencephalography. Sensors 2023, 23, 5454. https://0-doi-org.brum.beds.ac.uk/10.3390/s23125454
Holmes N, Rea M, Hill RM, Boto E, Leggett J, Edwards LJ, Rhodes N, Shah V, Osborne J, Fromhold TM, et al. Naturalistic Hyperscanning with Wearable Magnetoencephalography. Sensors. 2023; 23(12):5454. https://0-doi-org.brum.beds.ac.uk/10.3390/s23125454
Chicago/Turabian StyleHolmes, Niall, Molly Rea, Ryan M. Hill, Elena Boto, James Leggett, Lucy J. Edwards, Natalie Rhodes, Vishal Shah, James Osborne, T. Mark Fromhold, and et al. 2023. "Naturalistic Hyperscanning with Wearable Magnetoencephalography" Sensors 23, no. 12: 5454. https://0-doi-org.brum.beds.ac.uk/10.3390/s23125454