Article

An Integrated Design Framework for Safety Interventions on Existing Urban Roads—Development and Case Study Application

Department of Civil, Environmental, Land, Building Engineering, and Chemistry, Polytechnic University of Bari, 4 via Orabona, 70126 Bari, Italy
*
Authors to whom correspondence should be addressed.
Submission received: 30 December 2018 / Revised: 24 February 2019 / Accepted: 26 February 2019 / Published: 6 March 2019

Abstract

:
The need for improving urban road safety, livability, and sustainability is evident. Quantitative estimates and qualitative methods/strategies can be used by road safety practitioners to design safety interventions. This study proposes a flexible integrated design framework for safety interventions on existing urban road segments and intersections that integrates quantitative and qualitative methods. The proposed design framework is divided into four stages of the safety management process: End of Network Screening, Diagnosis, Selection of Countermeasures, and Economic Assessment. Pilot applications of the proposed method were performed on existing roads of the urban road network of the Municipality of Bari, Italy. Results from the application were useful to highlight some possible problems in the different stages of the design process. In particular, the discussed problems include a lack of crash and traffic data, difficulties with defining the road functional classifications, including rural-to-urban transitions, a lack of local inspection procedures, the recurrent problems from diagnosis, difficulties regarding the safety assessment of cycling infrastructures and sight distances, the criteria for grouping countermeasures into sets, and the choice of appropriate predictive methods. In response, appropriate solutions to the highlighted problems were presented. The usefulness of the proposed method for both practitioners and researchers was shown.

1. Introduction

Persons killed in urban crashes account on average for about 15,000 deaths per year in the European Union (EU-28: 1999–2014 data [1]). These figures make up slightly more than one-third of persons killed in all road crashes in the same period. However, considering also injuries, urban crashes are the most frequent crashes on the network (e.g., about 70% of all crashes in Italy [2]). They may cause injuries to Vulnerable Road Users (VRUs: pedestrians/cyclists) with different regional impacts.
To improve urban safety and livability, safety-based concepts are essential at the design stage. However, the design of safety interventions on existing urban roads should be based on the analysis of current conditions, which may reflect outdated road configurations (i.e., in historical towns). Moreover, while recent road standards and guidelines often include safety-oriented provisions and recommendations for the design of new roads, similar provisions may be not available and/or applicable to interventions on existing roads [3]. Hence, attempts at defining frameworks for the design of safety-based interventions on existing roads are needed. They should necessarily be based on both quantitative predictions for estimating different intervention scenarios based on previous research and technical documents (e.g., [4,5]), and qualitative site-specific assessments of existing conditions. A synthetic background section is presented as follows for each of the two mentioned strategies, which form the basis for the integrated design framework proposed.

1.1. Background on Quantitative Methods for Road Safety Interventions

Frameworks for the design of safety-based interventions on existing urban roads should include quantitative estimation methods. In fact, they may help practitioners design and assess those interventions. For example, Safety Performance Functions (SPFs) [6] and Crash Modification Factors (CMFs) [7] are essential to quantify before/after performances [5].
Safety Performance Functions (SPFs) relate crash frequency (and/or severity) to road and traffic features. Different modeling techniques are used [8]. A SPF can be defined as follows:
N S P F = e β 0 · L β 1 · A A D T β 2 · i = 3 n e β i X i
where:
  • NSPF = average predicted crash frequency from the SPF for a specific road element class, such as in the urban case: segments, three/four-legged, signalized/unsignalized intersections, roundabouts (possibly referred to specific severity classes) (crashes/year);
  • L = length of the road segment (km), which is not present in SPFs for road intersections;
  • AADT = annual average daily traffic volume, possibly disaggregated in multiplicand components for considering diverse traffic units (motor vehicles, cyclists, and pedestrians) or the importance of the segments intersecting at road intersections (major/minor roads), and having separate coefficient estimates for each volume component (motor vehicles, cyclists, or pedestrians/year);
  • Xi = set of predictor variables related to road, traffic features, environmental variables, and context variables;
  • βi = set of regression coefficients, which include β0, β1, and β2 as well.
The estimates obtained from basic SPFs may be adjusted through the sequential application of multiplier Crash Modification Factors (CMFs) [5,7], to account for the differences between the base SPF conditions and the local conditions. More reliable frequency estimates [9,10] are obtained by applying the Empirical Bayesian (EB) method, thus combining past observed crashes (Nobserved) with predicted crashes (Npredicted). The resulting estimate (which overcomes the regression-to-the-mean error) is computed as follows [5]:
N e x p e c t e d = N p r e d i c t e d · w + N o b s e r v e d · ( 1 w )
where:
  • N p r e d i c t e d = N S P F · i C M F i (crashes/year), average predicted crash frequency, eventually adjusted for local conditions through the application of CMFs on the road element;
  • N o b s e r v e d = average observed crash frequency on the same road element (crashes/year);
  • w = 1 1 + k i = 1 y e a r s N p r e d i c t e d , i = statistical weight assigned to the N p r e d i c t e d , dependent on the over-dispersion parameter k of the associated SPF and the total predicted crashes in the period (-).
Those estimates are used to determine the safety benefits of different countermeasures (by comparing before/after conditions), and then to compare project alternatives or conduct cost–benefit analyses. They can take into account the local crash site-specific history of crashes. Some studies that document the SPF modeling and specify the significant predictors are collected in the online repository of the EU PRACT Project ([11], see also [12]) (European PRACT (Predicting Road Accidents - a Transferable methodology across Europe) Project). Detailed SPFs are provided by the HSM (Highway Safety Manual) [5]. Given the aims of this study, urban SPFs considering detailed crash predictors are specifically taken into account herein. The development of several urban SPFs was documented (see e.g., [13,14,15,16]). These studies were mostly developed in North America, while those provided for the European context are scarce.
The determination of CMFs is documented in other studies. Most of them are collected in compendium sources [4,5,11,17,18]. These studies estimate the effects of modifications in geometric/operational features and other boundary conditions. In some cases, CMFs are coupled together with the corresponding SPFs (see e.g., [5,19]).
However, SPFs (and CMFs) may not be available for the specific road type in the studied area. Hence, the issue of the predictive method transferability arises (e.g., [20]). In several cases, previous research advised against transferring SPFs from other countries/states without transferability assessments (e.g., [21]). Differences between states in the same country [22] or cities in the same area [21] may result in poor model transferability. Similar issues emerged as well for CMFs [12,23], which were even perplexed by their possible variation with other road features (see e.g., [24]). Hence, SPFs and CMFs should be calibrated before their application in other contexts, or at least their possible transferability should be assessed. If local predictive methods are available, they should be generally preferred.

1.2. Background on Qualitative Methods for Road Safety Interventions

Alongside with quantitative methods, qualitative methods and fundamental road safety macro-level strategies are complementary tools to be included in frameworks for the design of safety-based interventions on existing urban roads. In fact, the choice for specific safety measures can be surely strengthened if it is based on reliable quantitative predictions. However, very often, SPFs may not be systematically used [12]. In contrast, qualitative methods such as safety audits and inspections can be widely employed, mainly because they are often included in standards/guidelines.
The EU Directive on Safety Management of Road Infrastructures [25] stresses the importance of applying different types of qualitative assessments and analyses:
  • Safety audits (design stage), for new road projects or the enhancement of existing roads, by checking that road safety criteria are respected in the road project;
  • Safety inspections (management stage), for identifying safety issues on road elements, by highlighting sites needing interventions based on qualitative scores and judgments.
Moreover, procedures for assessing projects (planning stage) and ranking intervention sites are provided. Even if predictive methods may be useful, the EU Directive [25] does not specifically provide their use (such as in some local implementations [26]). This latter example presents detailed guidelines on safety inspections to be performed and variables to be assessed.
Non-quantitative methods should not be limited to audits and inspections, but they should include high-level strategies that need to be considered in the design stage. In fact, the design stage should be included within a “Safe System Approach” [27], in which stakeholders (designers, network managers, and road users) have shared responsibilities. The key principle should be the effort for reducing fatalities and severe injuries as a priority (i.e., “Vision Zero” [28]), thus achieving forgiving roads that are resilient with respect to human errors (see also [29]). Two aspects are indeed crucial:
  • The self-explanatory power of road design [30], which may address driving behavior e.g., in terms of urban speed choices, more than actual posted speed limits [31,32].
  • Speed management. There are well-known direct speed–crash (frequency/severity) relationships [33,34,35]. These relationships, alongside other sustainability issues, should be taken into account in urban networks, where the presence of VRUs is relevant [36].
The qualitative methods (inspections/audits) and the high-level strategies presented above could be easily applicable in different contexts, even if they should appropriately be put into context (e.g., [37,38]). On the other hand, reliable quantitative estimates based on high-quality predictive methods are typically only applicable in countries that have an advanced road safety culture [12]. Contrary to qualitative methods, their transferability is questionable, without any preliminary assessment.
Examples of the transferability of audits and assessments are present at the transnational level. For example, recommendations on audits and inspections in the EU Directive [25] are put into context at the national level for different road types. Moreover, the SaferBrain project worked on the transferability of European road safety audits, including corrective and preventive analyses to emerging countries, such as India and Brazil, by keeping the framework open for other contexts [39].

1.3. Objectives

Most of the existing research has focused on prediction models and transferability assessments. Moreover, there are several guidelines for the application of qualitative methods, with local corrections.
Both quantitative and qualitative methods should be considered when designing safety interventions on existing roads. However, current standards/guidelines often do not precisely indicate how to apply those strategies (predictive methods, audits/inspection) while enhancing existing roads. Hence, the need for integrated frameworks, which are flexible enough to be adapted in accordance with regulations, and consider international best practices, is paramount. Moreover, few studies have documented the application of such integrated frameworks to examples of road safety-based projects.
For these reasons, this study attempts to answer the following research questions, arising from the reported background:
  • Can quantitative and qualitative methods be integrated in a framework that is flexible enough to be applied in different contexts of safety interventions on existing roads?
  • What are the possible problems arising from the application of such an integrated framework, by also taking into account the different sources of data needed?
  • Which solutions may be provided for the problems that emerged during the application, useful for the future application of the proposed method to other cases?
Hence, this article documents the development of an integrated framework for designing safety interventions on existing urban roads and its application. It aims at being useful for: a) practitioners, who may benefit from applying the proposed design framework, while knowing in advance the associated possible problems and solutions; and b) researchers, since the identification of problems during the framework application may be useful to highlight areas in which research developments are needed to address current gaps. This study represents the continuation of a previous research project focused on rural road segments [3,40]. In this case, the study is focused on the urban environment, in the context of the Parco Scientifico della Sicurezza Stradale – Scientific Park for Road Safety (Pa.S.S.S.) research project (funded by the Italian Ministry of Infrastructures and Transport, and the Municipality of Bari, Italy, as the leading partner), focused on urban road safety. Hence, the design framework was applied to examples within the Municipality of Bari, Italy (about 320,000 inhabitants, 2700 inhabitants/km2, 120 km2 of area, 5 m of mean elevation above sea level). Then, the multiple applications in the same city can be considered within the framework of a systematic case study. Both urban road segments and intersections are considered, since they are hardly separable in a complex urban environment. Urban freeways and similar contexts are not considered, in order to strictly focus on urban networks with residential/commercial land use.
The methods used for developing the integrated framework are described as follows. Thereafter, the results from the framework application, which are useful to highlight possible practical problems and the related solutions, are presented. Finally, the results are discussed, especially focusing on both the main advantages and limitations of the proposed framework.

2. Methods

This study presents an integrated framework for the design of safety-based interventions on existing urban road sites, including both quantitative and qualitative methods. In this section, the methods used for organizing this framework are described. At a higher level, it was structured according to the different stages of the safety-based design process. These stages (Figure 1) are part of the typical road safety management process (see e.g., [5,25]), and include: Diagnosis, Selection of Countermeasures, and Economic Assessment (leading to the final project choice). At a lower level, that is within each design stage composing the integrated framework, different operational methods were selected to be sequentially applied, also as a function of the data needed. Details about these selected methods are provided for each considered stage, as follows. The design process simulated through stages starts from an intermediate stage between the Network Screening and Diagnosis stages is called “End of Network screening” (Figure 1). The “road site” is intended here as a generic small part of an urban network that is composed of both segments and intersections, which was previously targeted for safety interventions during the “Network Screening” stage (Figure 2).

2.1. Methods: End of Network Screening Stage

Several methods may have been used for the network screening to highlight sites needing interventions, even basic indicators such as crash frequencies/rates (see e.g., [25]) or more refined techniques. However, practitioners may be interested in knowing why a given site was selected for interventions, that is knowing its actual safety improvement potential. This may be useful for pondering the magnitude of the proposed safety measures. The actual site safety potential should be estimated by comparing the safety performance of the urban road segment/intersection (i.e., the expected site-specific number of crashes through Equation (2)) with an estimate of the average safety performance of the reference population (predicted number of crashes through an SPF for different segment or intersection types) [5]. The more this difference is, the more the safety interventions should be severe. A refined method for identifying the safety level of a given site by following the described approach was proposed [41]. It was selected, as it can also define different Levels of Service of Safety (LOSS), based on the difference between actual and average safety performances. It was previously deemed as useful also in the case of rural road segments [3]. However, its application requires recent traffic volume and crash data for the inquired site, and a local reference SPF for each urban road type (Equation (1)) or a calibrated transferred SPF from another country/state/region.

2.2. Methods: Diagnosis Stage

The diagnosis stage, which is the first step of the actual design process, aims at analyzing the site-specific safety problems. The following methods were selected for this stage.

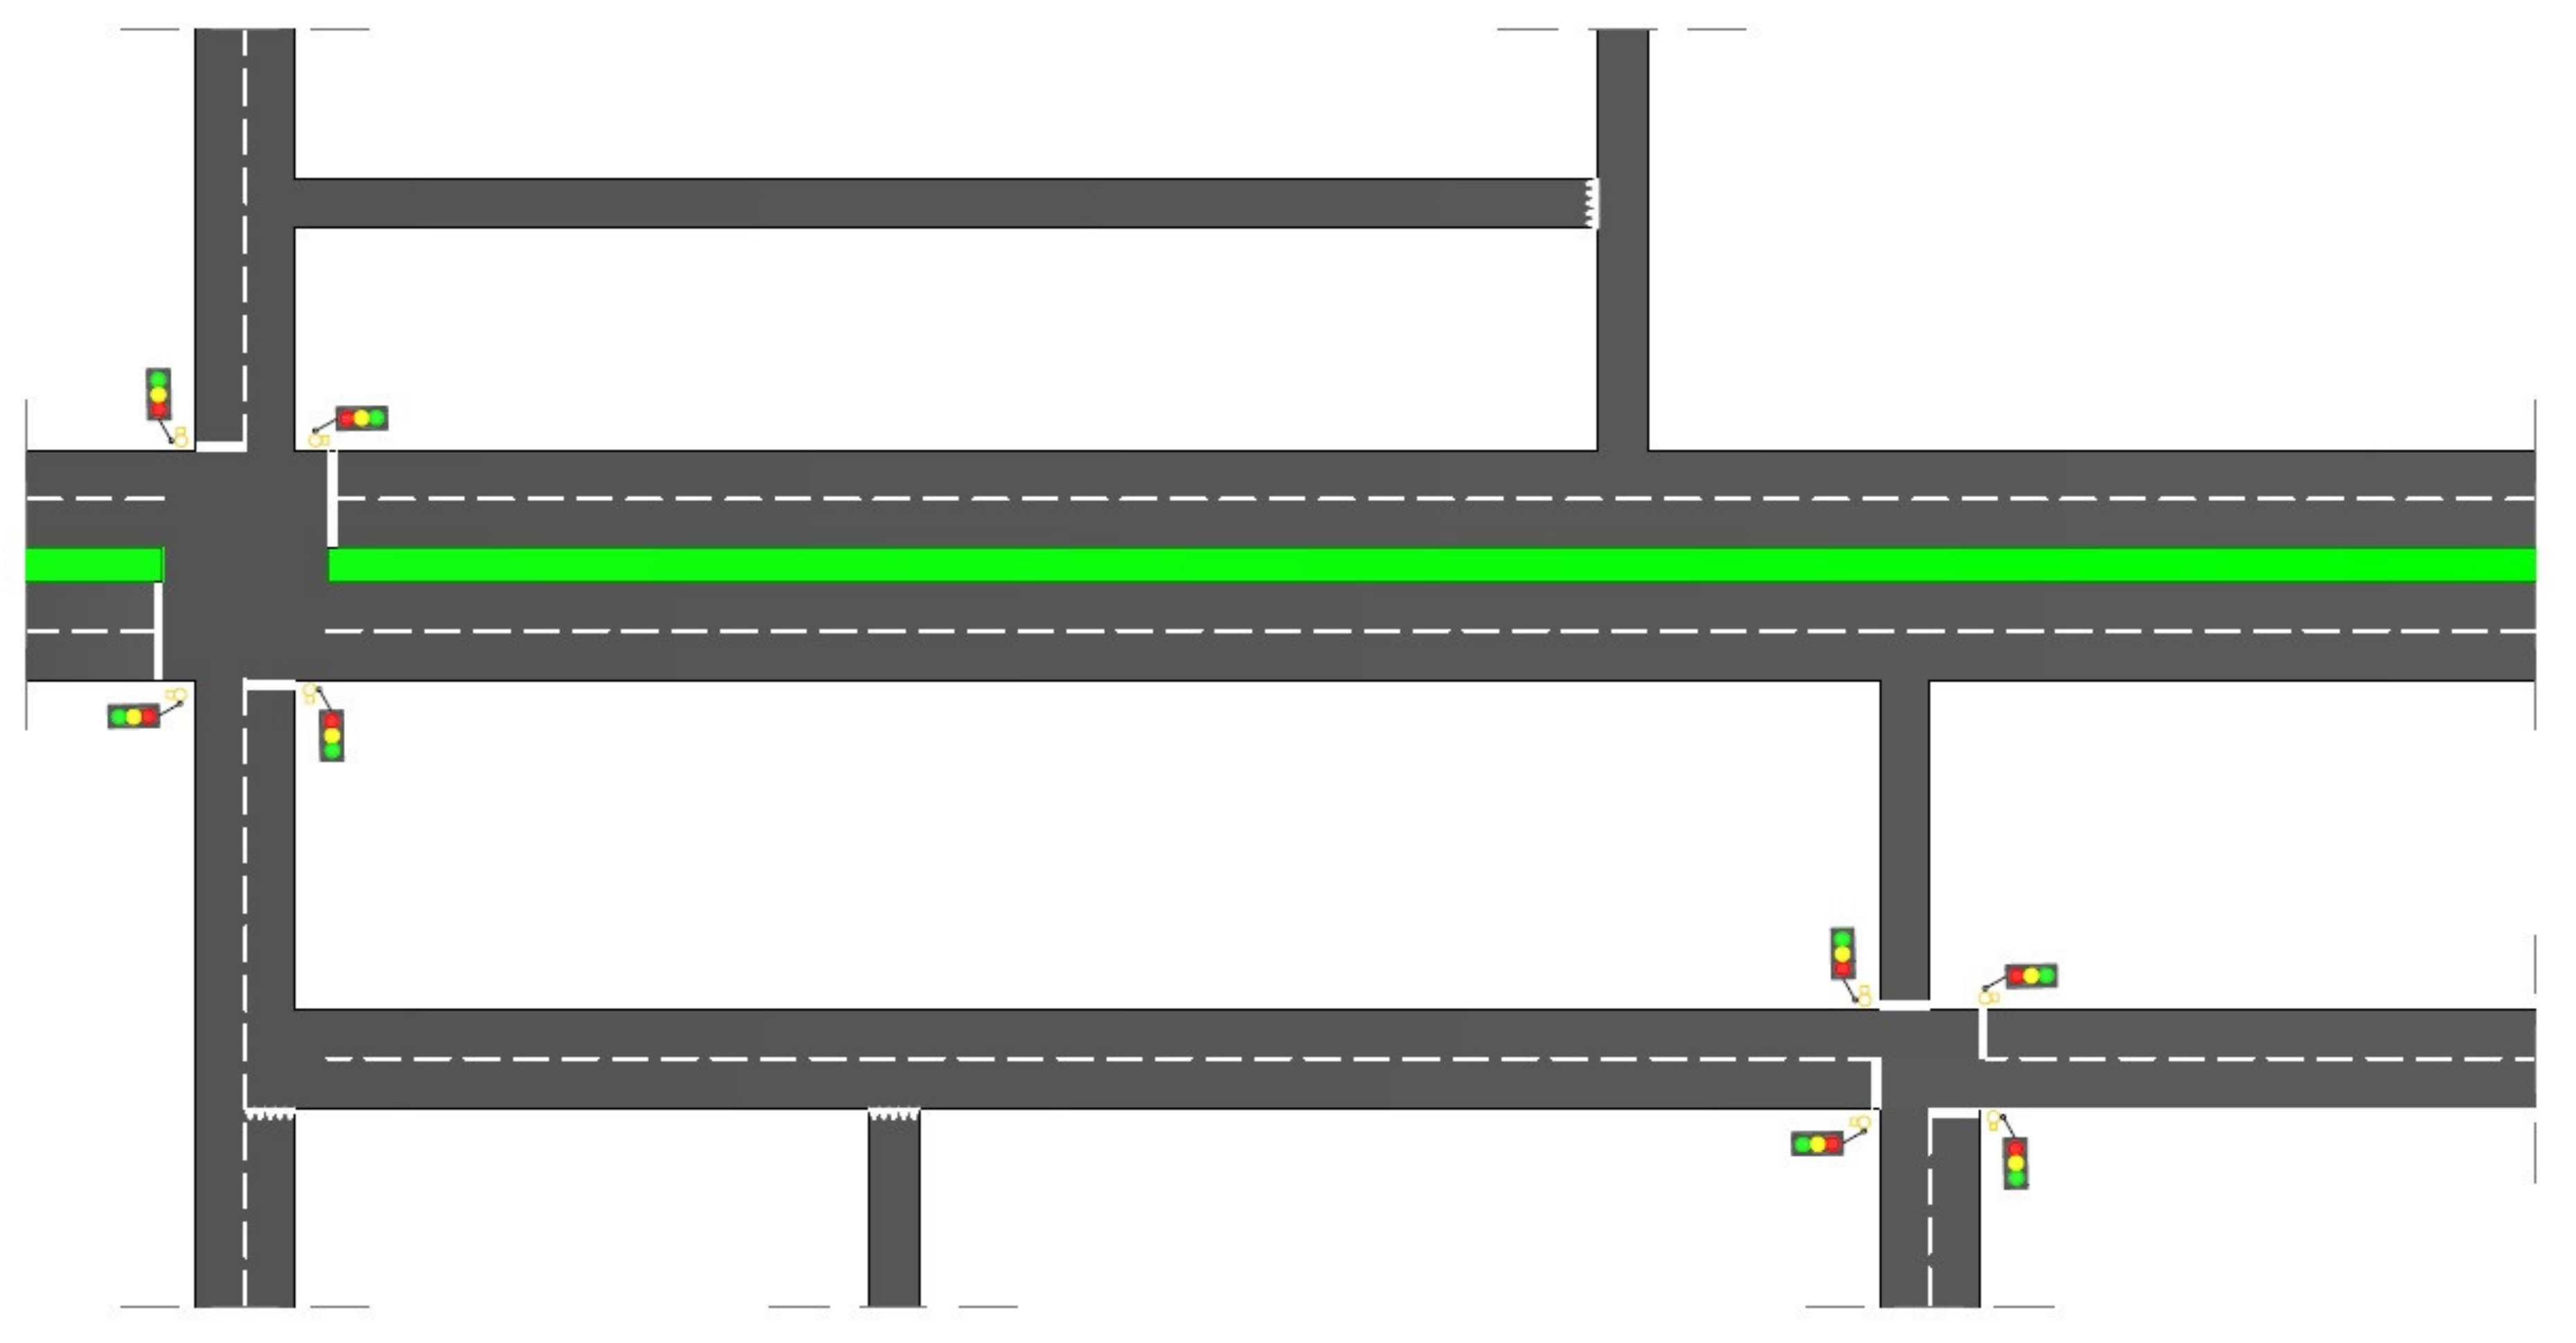
2.2.1. Reconstruction of road geometry

The diagnosis of the existing safety problems starts with the geometric reconstruction of the road site, which forms the basis for every subsequent step. Digital terrain and elevation models, cartography, and aerophotogrammetry are useful for this aim. However, as further explained, both the road horizontal alignment and elevation profile may not be reconstructed at a level of detail comparable to the corresponding rural case.

2.2.2. Individuation of homogeneous road elements

The generic urban road sites are assumed as composed of segments and intersections. However, the general criteria for safety analyses require each road site to be divided into homogeneous road segments based on their geometric and operational features [5,25]. In fact, typically, the application of predictive methods and audits/inspections is differentiated by road type and features, which may vary along the road site. Hence, intersections were separately treated as singular points as a prerequisite for the application of the design framework. Moreover, road segments placed between main intersections should be further divided into smaller homogeneous sub-segments as based on their features. Methods for the definition of homogeneous sub-segments that are included in the proposed framework are listed as follows.
  • Depending on the reference predictive method, which will be used for the safety predictions (Equation (1)), a sub-segment can be considered as homogeneous if all the road, traffic, and context variables included in the predictive method are reasonably not varying within it. If this step is undertaken at the early design stage, this may simplify the safety prediction applications.
  • Traditional variables related to the horizontal and vertical alignment (e.g., radius of curvature, longitudinal/cross slopes) could be overlooked for defining homogeneous urban sub-segments. The rationale for this is that such variables are typically not considered in urban safety predictions (see e.g., [42,43]), possibly depending on the lower speeds and the less demanding urban topography. Clearly, there could be some urban cases in which this assumption may fail, and those variables should be taken into account instead.

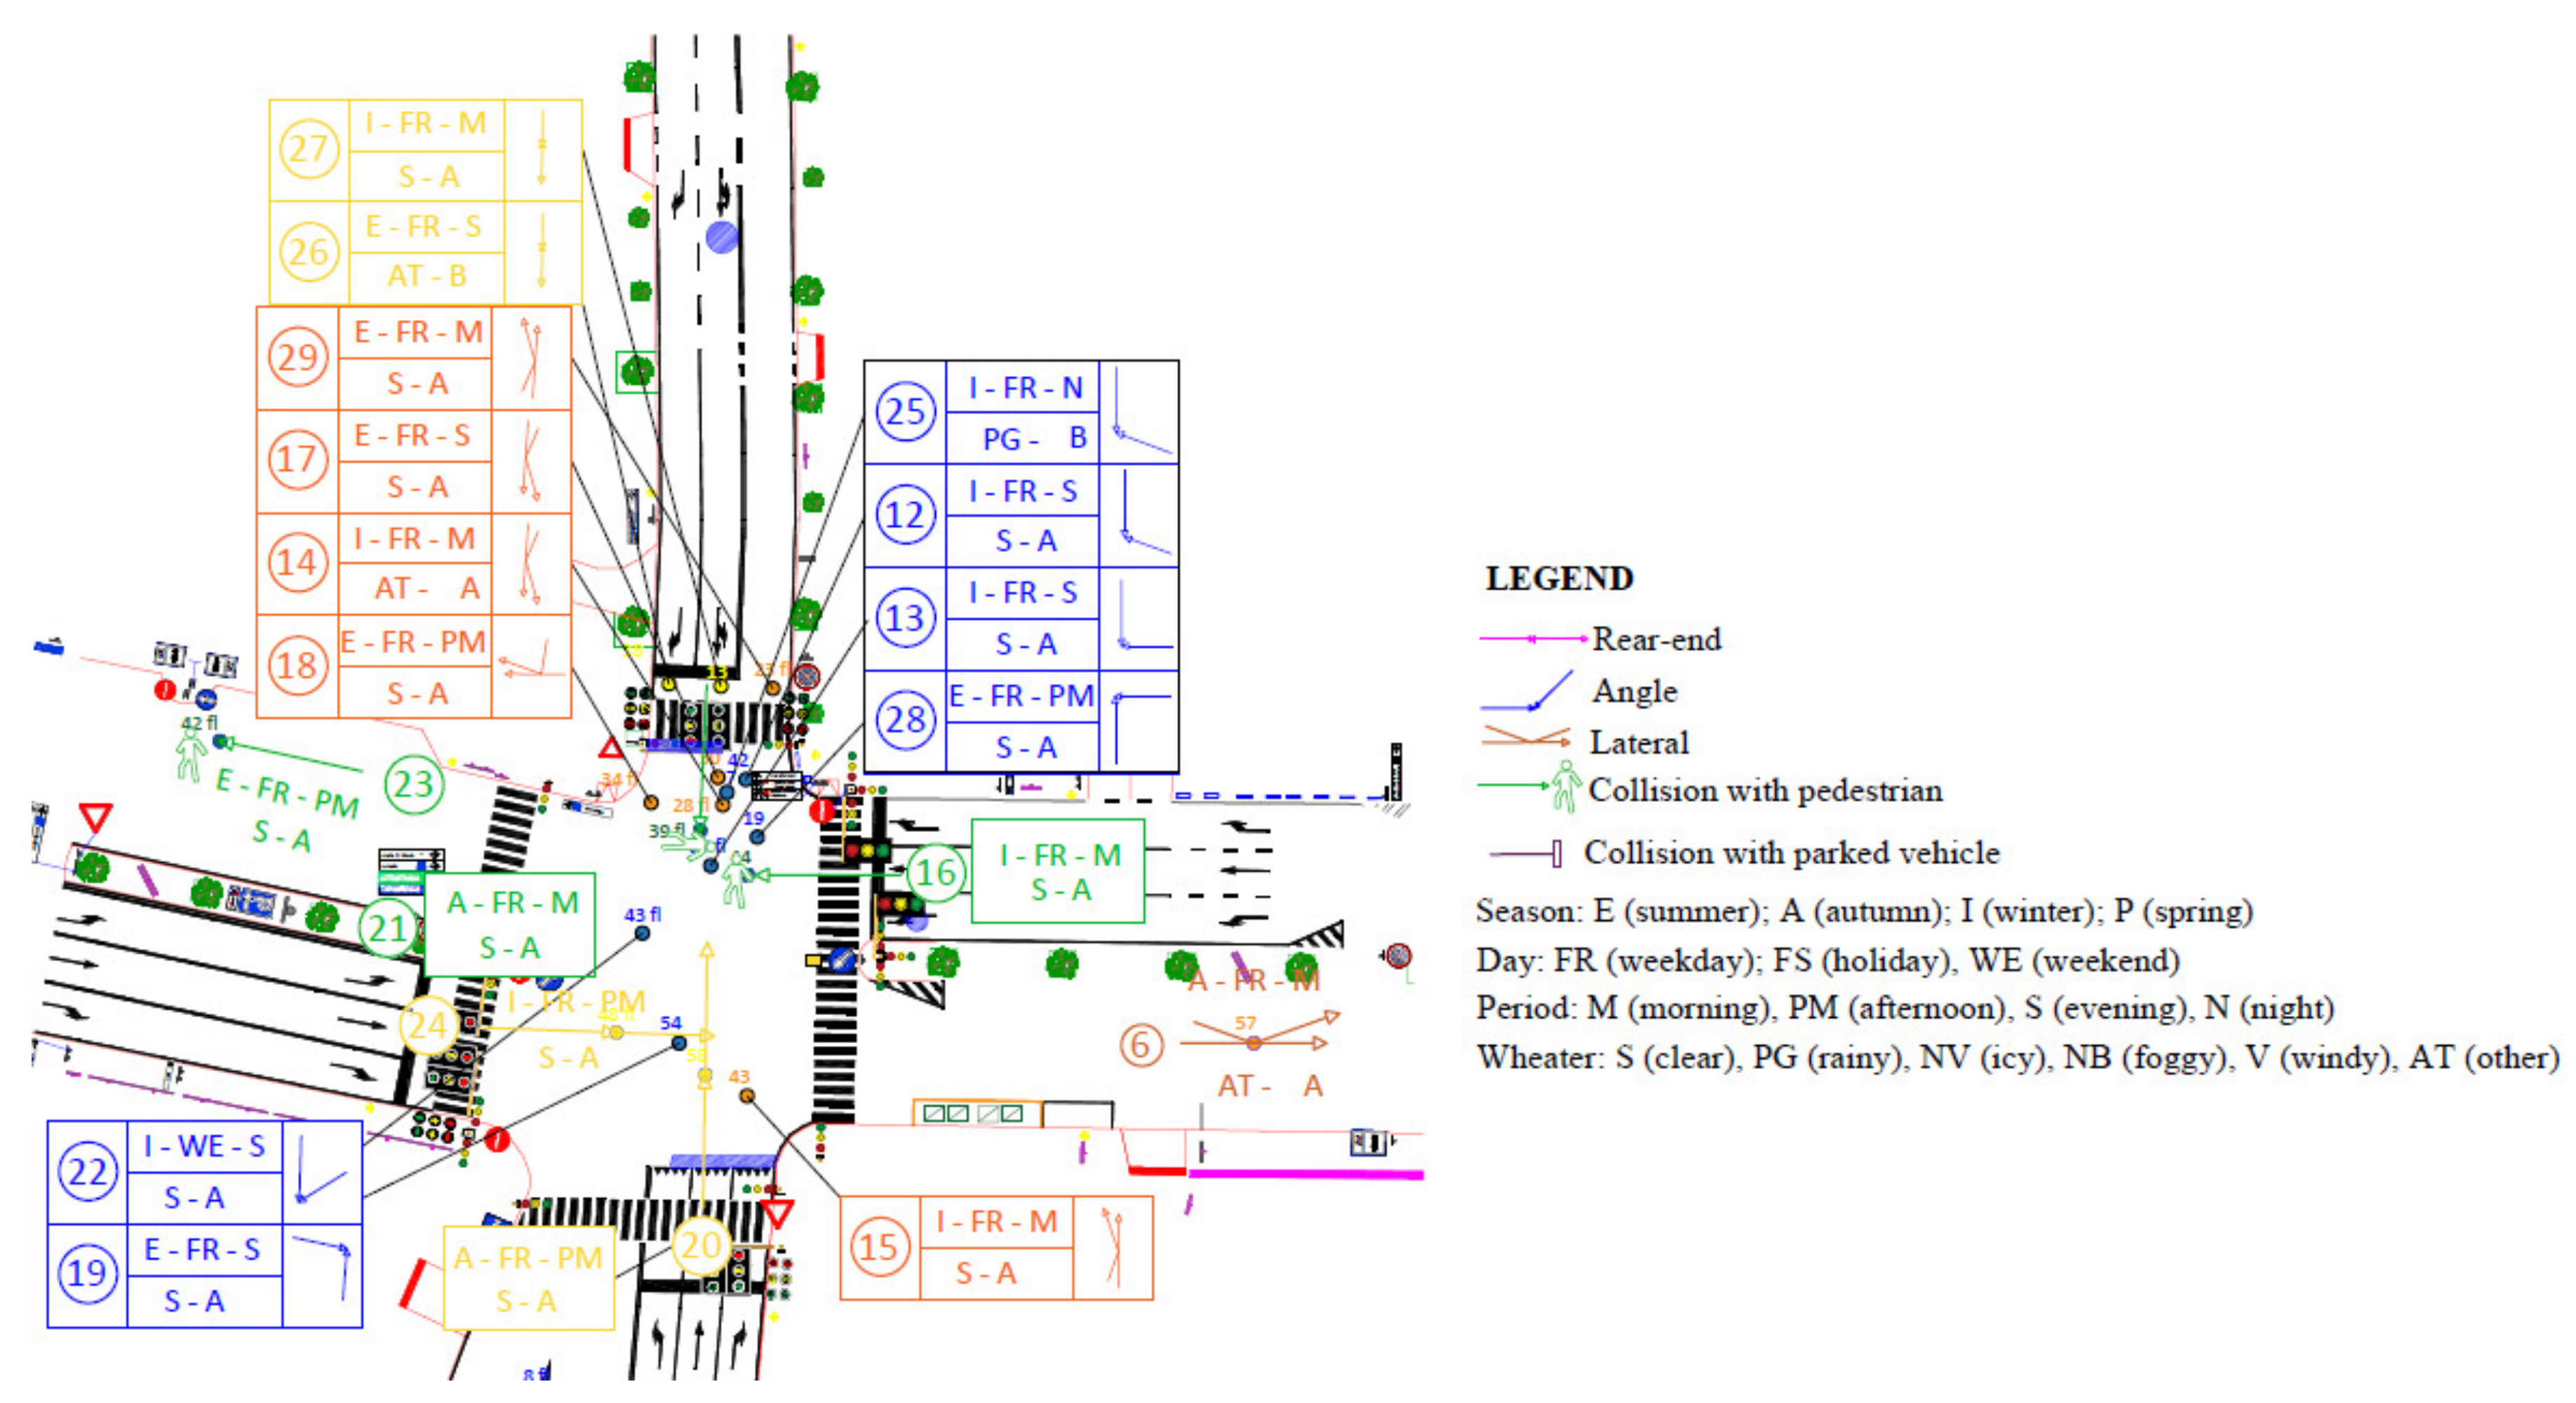
2.2.3. Reconstruction of crashes

The reconstruction of historic crash data series is suggested within the design framework for the following two main aims:
  • It contributes to numerical EB estimates of the road site crash frequency (Equation (2));
  • It summarizes the site-specific safety problems that have resulted in crash outcomes.
All the relevant crash-related information may be summarized in collision diagrams [5], which are used for identifying specific problems and recurrent crash patterns (see e.g., [44]). Clearly, crashes are rare and random outcomes, and so safety problems should be also independently analyzed on crash data.

2.2.4. Identification of the road function and related criticalities

While designing safety interventions on existing urban roads, it is essential to know their actual function in the network. The actual function is a preliminary information that is required for identifying the inconsistencies of the existing segments and intersections with respect to their appropriate operational and geometric features according to the road function. Actually, urban roads are generally classified (see e.g., [45]) into different hierarchical levels by considering traffic volumes, travel distances served, speeds, accesses, and lanes. However, several old urban roads may present standards that are not compliant with any modern regulation or planning decision. Hence, for the aim of identifying and checking the function of existing urban roads, the steps represented in Figure 3 may be followed. The main assumption is that, for existing roads, the main type of travel served and the related flows for a given road are known. Based on them, a main road function can be assigned and then compared with the required geometric and operational features.

2.2.5. Check of road geometric standards

Besides the checks for determining road standards’ adequacy with respect to their function, road standards should be checked for safety reasons as well. In urban road networks (excluding the case of major arterials such as freeways), some specific safety-related geometric checks of road elements (e.g., horizontal/vertical geometric and speed consistency, friction requirements) could not be necessary, as previously indicated. However, the following minimum checks are included in the framework, given their relevance to the urban environment:
  • Checks of sight distance at intersections and driveways, especially in residential contexts with several possible visual obstacles;
  • Checks of sight distance with specific regard to collisions with VRUs (see e.g., [46]).
Requirements for stopping sight distance on segments are not stressed, because of the average low speeds and curvature of the urban road segment types considered. Those checks should be conducted in compliance with local road standards/guidelines. In addition, the use of additional studies linking sight distance to safety performances (e.g., [47]) is suggested.

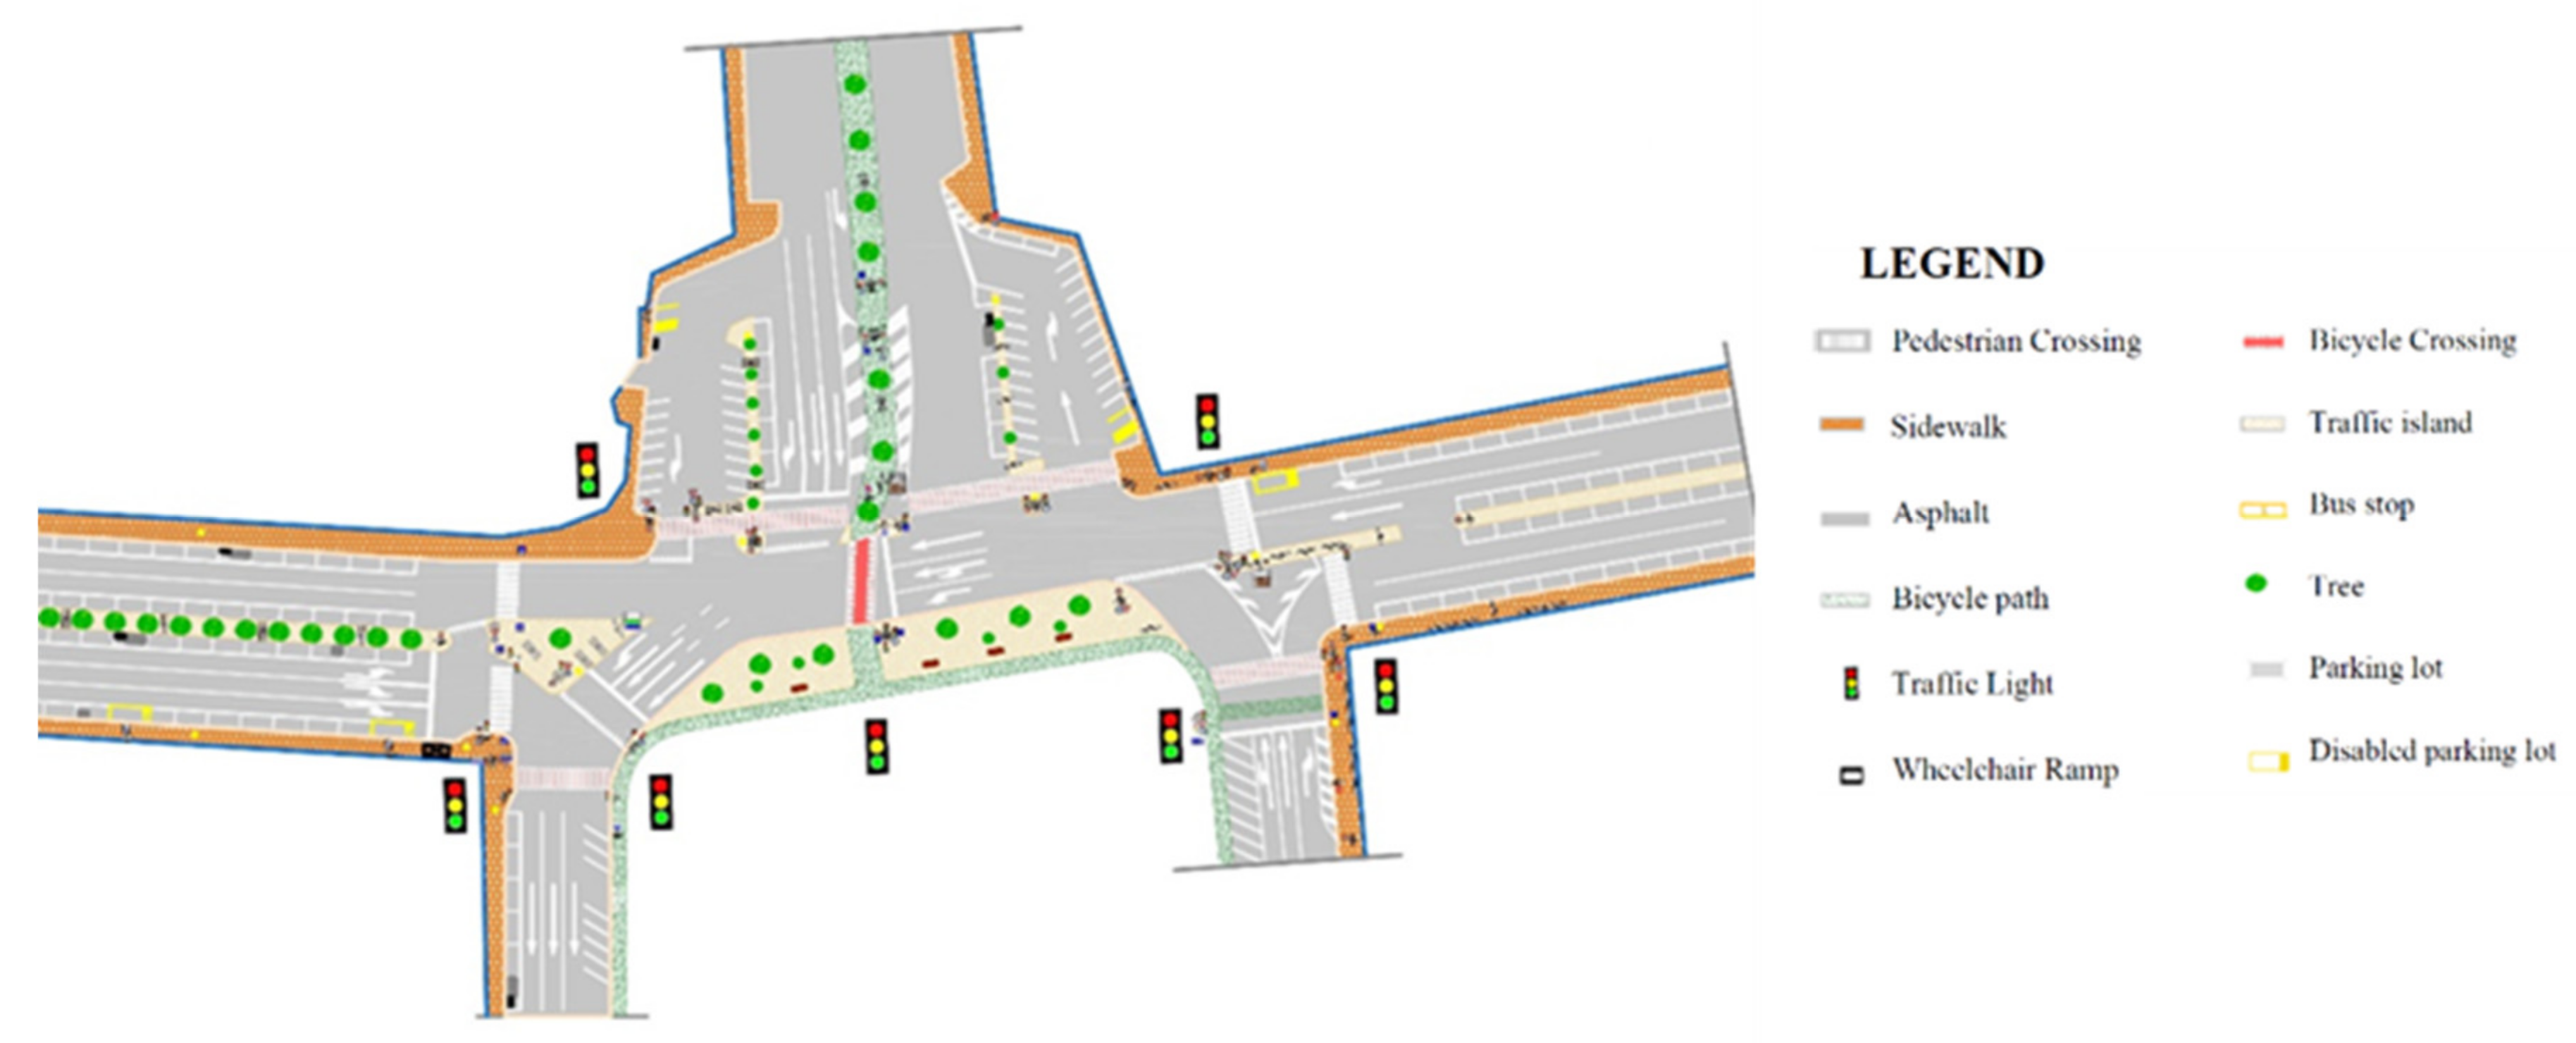
2.2.6. Road inspections

Road inspections belong to the qualitative methods that are included in the proposed design framework. Road inspections may be used in the process of identifying sites needing safety interventions (such as in the European Union [25]). However, in the context of safety-based intervention design on existing roads, inspections are suggested as an useful method to be employed at the diagnosis stage as well. In fact, they may be consistently used as a basis for identifying safety problems (see e.g., [48]) that are not linked with crash data. Lists of variables to be assessed while conducting road inspections, alongside with indications about how to conduct inspections (preliminary or punctual, daytime or nighttime, inspection travel speed) are provided at the local level [26]. These variables may include: carriageway, road-side, markings, road signs, traffic signals, driveways, pavement, and lighting.

2.2.7. Reconstruction of boundary conditions

The reconstruction of all the relevant urban site-specific conditions is included as the last stage of the diagnosis step in the framework. These may include: the presence of schools, shopping malls or other attractors, sight obstacles (e.g., trees, signs), pavement irregularities, and bus stops. A graphical overview of the boundary conditions can be obtained by reporting them upon the horizontal alignment. They are useful for putting the diagnosis results into context, and then providing additional elements to the critical analysis of safety issues.

2.3. Methods: Selection of Countermeasures

In this stage, safety measures should be designed based on all the highlighted issues in the previous stage. The selection of countermeasures should be based on both traditional road safety concepts and higher-level design approaches. The following methods were selected for this stage.

2.3.1. Selection of safety measures

Different types of interventions can be designed for a specific highlighted problem in the diagnosis stage, depending also on the project constraints (i.e., environmental or physical restrictions, budget limitations, and regulations). In fact, safety measures should be assessed at a project scale (by taking into account the effects on the adjacent network), and not only for solving punctual safety issues. The following steps are proposed for the selection of safety measures within the design framework.
  • Critical analysis of each safety issue from the diagnosis stage.
  • Selection of possible alternative safety measures supported by studies that may document their positive effect on safety. These sources include the CMFs database (e.g., [5,11,17]), systematic reviews based on meta-analyses [4] that also include cost–benefit indications (see also [49]), and examples of solutions that take drivers’ factors into account [50].
  • Critical comparison of findings related to the same safety measures, by taking into account the specific environment of each study (urban/rural, two-lane/multi-lane roads), the crash types and severities considered, and the robustness of the methods employed (i.e., through reliability ratings, see [17]). In fact, the CMFs (or functions) that have been developed for some of the specific conditions listed above may be not applicable to different contexts, and they may be actually very different (e.g., CMFs either greater or smaller than one for the same measure).
  • Assessment of possible transferability issues dependent on the degree of infrastructure development, and on geographic and socio-economic factors.
  • Assessment of the capability for each single measure (deemed as potentially applicable) to solve different identified safety issues in a consistent way. Measures that are able to solve safety issues at a project level should be preferred over punctual measures.

2.3.2. Selection of measures for enhancing sustainable mobility

Besides improving the safety of motor vehicle drivers or VRUs, the design of safety measures should be included in a higher-level design approach that is aimed at the general improvement of urban livability, accessibility, and sustainability. Hence, in parallel with traditional safety measures, those enhancing sustainable mobility should be assessed, which may have direct or indirect positive effects on safety (especially for VRUs, see e.g., [51]). In fact, traffic calming measures are desirable, since they may improve road safety, public health, and livability, especially if implemented at the area-wide level [52]. The following steps are proposed for selecting measures for enhancing sustainable mobility within the design framework.
  • Assessment of the need to apply such measures to the specific intervention road site. This should be based on: (1) available urban plans, such as Sustainable Urban Mobility Plans (SUMPs, see [53]), (2) the function of the road on which the intervention is planned within the relevant urban network, and (3) the boundary conditions, such as traffic volumes, including pedestrian and cyclist flows, carriageway width, and land use [54].
  • If needed, evaluation of possible infrastructure-related interventions: modify the existing horizontal alignment (i.e., through chicanes, pedestrian refuges, curb extensions, and chokers); the elevation profile (i.e., through speed bumps, humps, cushions, tables, raised pedestrian crossings, and intersections); or surface materials, texture, and color. Bike lanes/paths, alongside the related facilities, could be implemented where appropriate, if absent or inadequate.
  • If needed, the evaluation of possible management-related interventions, such as restrictions on vehicle speeds, maneuvers, and access.
  • Assessment of the effect of these measures on safety. Generally, these effects are varying, depending also on the application contexts, and some contrasting findings were reported indeed (see e.g., [4,55]). However, traffic calming measures, especially if implemented at the area-wide level, are effective, even if with variable outcomes. For example, reducing operating vehicular speeds down to 30 km/h leads to a consistent decrease in the fatality likelihood for pedestrians involved in crashes [56].

2.3.3. Definition of sets of countermeasures

Several different alternative countermeasures may be evaluated for solving the same problem or the same set of several problems. However, for better assessing and comparing different possible alternatives, sets of countermeasures may be defined. This will reduce the list of alternatives. On the other hand, countermeasures may be grouped in sets that are aimed at solving similar problems. The following sets of countermeasures are suggested within the design framework:
  • One/more sets of short-term safety measures that are relatively inexpensive, easily implementable, and do not require additional approvals, even if they are likely to have only a small positive impact on safety;
  • One/more sets of long-term safety measures, typically consisting of drastically modifying and re-shaping the road geometry, which is relatively expensive and requires additional approvals (e.g., for expropriating lands), but is likely to have a strong impact on safety;
  • Site-wide intervention composed of different measures, typically based on speed management (traffic calming), with different costs, benefits, and implementation issues.
For the reasons explained above, especially for long-term measures, the implementation and/or enhancement of infrastructures for the sustainable mobility should be coupled with safety measures. Specific subsets of safety measures should be dedicated to VRUs, where relevant.

2.4. Methods: Economic Assessment

The economic assessment stage is used to evaluate which alternative set of countermeasures may be selected for the actual implementation with regard to (implementation)cost–(safety)benefit analyses. The methods selected for the economic assessment are reported as follows.

2.4.1. Estimation of safety benefits

For this step, quantitative methods for estimating crash frequencies are typically used. In the proposed design framework, EB estimates are taken into account for obtaining reliable results (Equation (2)). The reference parameter of the road safety design is the difference between the expected number of crashes estimated before and after the designed intervention [5]. Then, it is multiplied by the average social cost of crashes (usually locally derivable) to quantify the safety benefit associated to each set of countermeasures:
S B i = A A S C   ( j = 1 n N e x p e c t e d , j , B E F O R E j = 1 n N e x p e c t e d , j , A F T E R ) i
where:
  • SBi = Safety benefit associated to the i-th set of countermeasures (€);
  • AASC = Average Crash Social Cost (€/crash);
  • N e x p e c t e d , j , B E F O R E = expected number of crashes (see Equation (2)) before the intervention (i-th set of countermeasures) on the j-th homogeneous sub-site (sub-segment or intersection) included in the examined road site (crashes);
  • N e x p e c t e d , j , A F T E R =   N e x p e c t e d , j , B E F O R E · k = 1 m C M F j , k = expected number of crashes (see Equation (2)) after the intervention (i-th set of countermeasures) on the j-th homogeneous sub-site (crashes);
  • C M F j , k = k-th Crash Modification Factor associated to the i-th set of countermeasures proposed for the j-th homonegeous site with respect to the original conditions (-).
The safety benefit can be computed as a sum of contributions associated to different crash severities and the corresponding different social costs. Traffic volumes are assumed as constant in Equation (3), even if their variation could be included in the computation.

2.4.2. Cost-benefit analyses

Different methods may be used for Cost–Benefit Analyses (CBA) to compare costs with the benefits of safety interventions. Among them (see e.g., [5]), three methods are taken into account in the design framework. The first two methods rely on the following measures:
Net Present Value   ( NPV ) i =   y = 0 Years of service life SB i ( 1 + discount rate ) y ;
Benefit Cos t   Ratio   ( BCR ) i =   Incremental   Benefits   over   the   service   life   ( discounted   value ) Incremental   Cos ts   over   the   service   life   ( discounted   value ) .
The third method is the incremental CBA, which consists of: (1) listing all the alternative sets of countermeasures in ascending order of costs; (2) conducting pairwise comparisons of the alternatives by means of the incremental benefit–cost ratio (BCR) ratio measure; and (3) choosing the best alternative after having conducted all the possible comparisons that may provide a positive BCR ratio.
The alternative set of countermeasures that may provide the highest benefits commensurate with its cost should be selected. However, specific safety measures, such as those reducing the severity of fatal-injury crashes may be prioritized in case of specific safety policies (e.g., Vision Zero [28], Safe System Approach [27]), independently of results from CBA analyses.

3. Results from the Case Study Application of the Integrated Framework

The proposed design framework for safety interventions on existing urban roads was applied to a case study composed of different pilot applications. Results obtained from the application are reported in this section. They are differentiated according to the same stages defined in the Methods section. The results are presented in a problem/solution structure for each stage in order to highlight which problems have arisen from the framework application and which relevant solutions may address them, according to the research questions. Examples taken from different pilot applications are presented. These applications conducted within the same city were useful to maintain a network-wide perspective while defining problems and solutions with respect to higher-level boundary conditions. While several of the presented problems and solutions may be potentially transferred to other areas, cases in which local conditions are particularly relevant are highlighted.

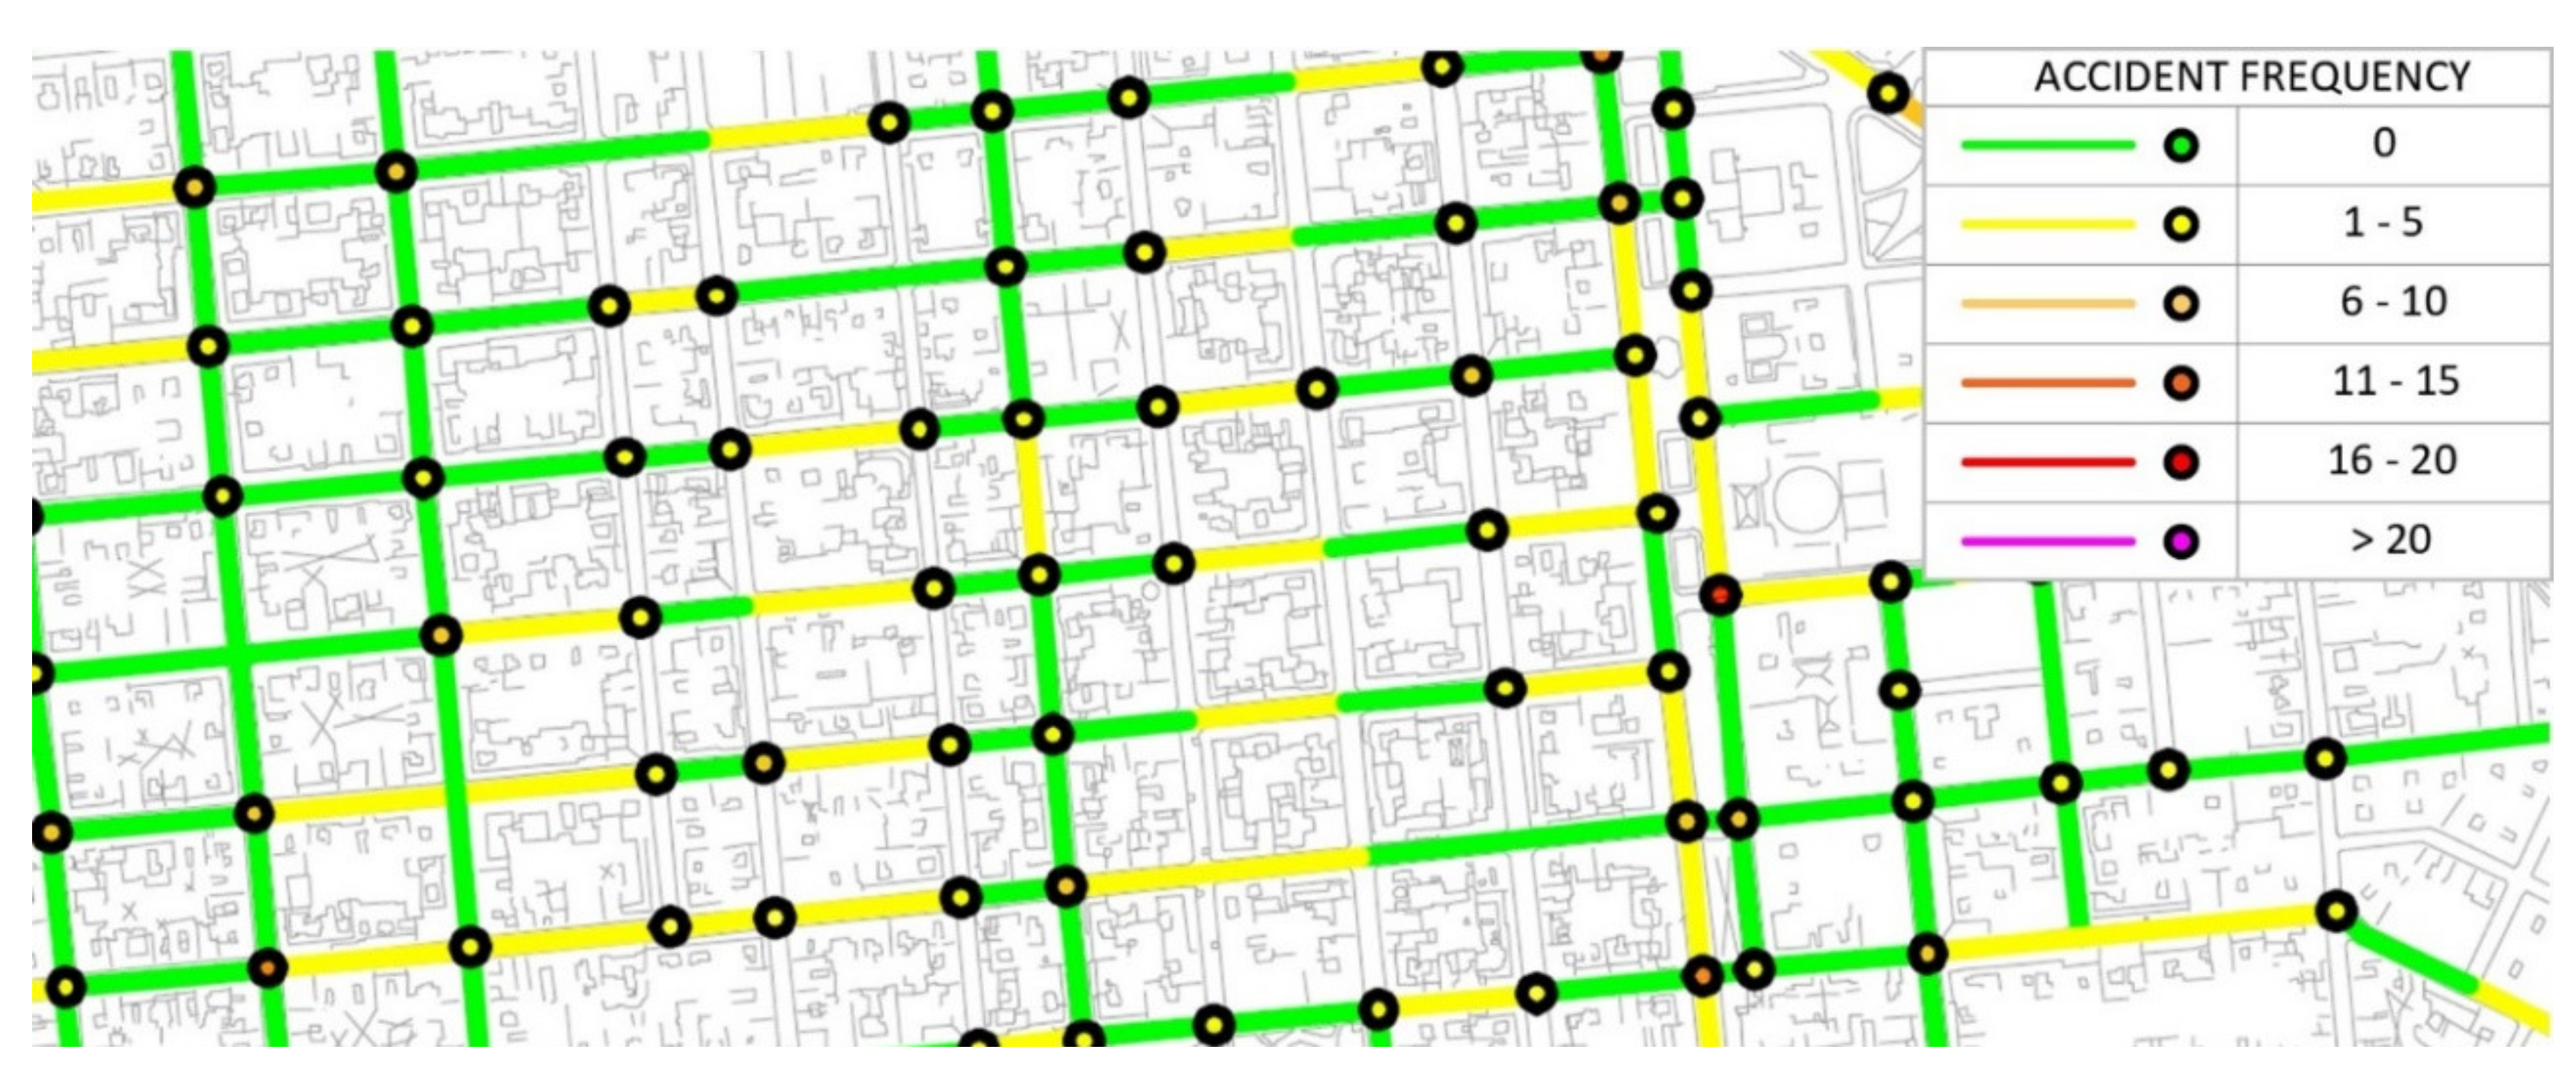
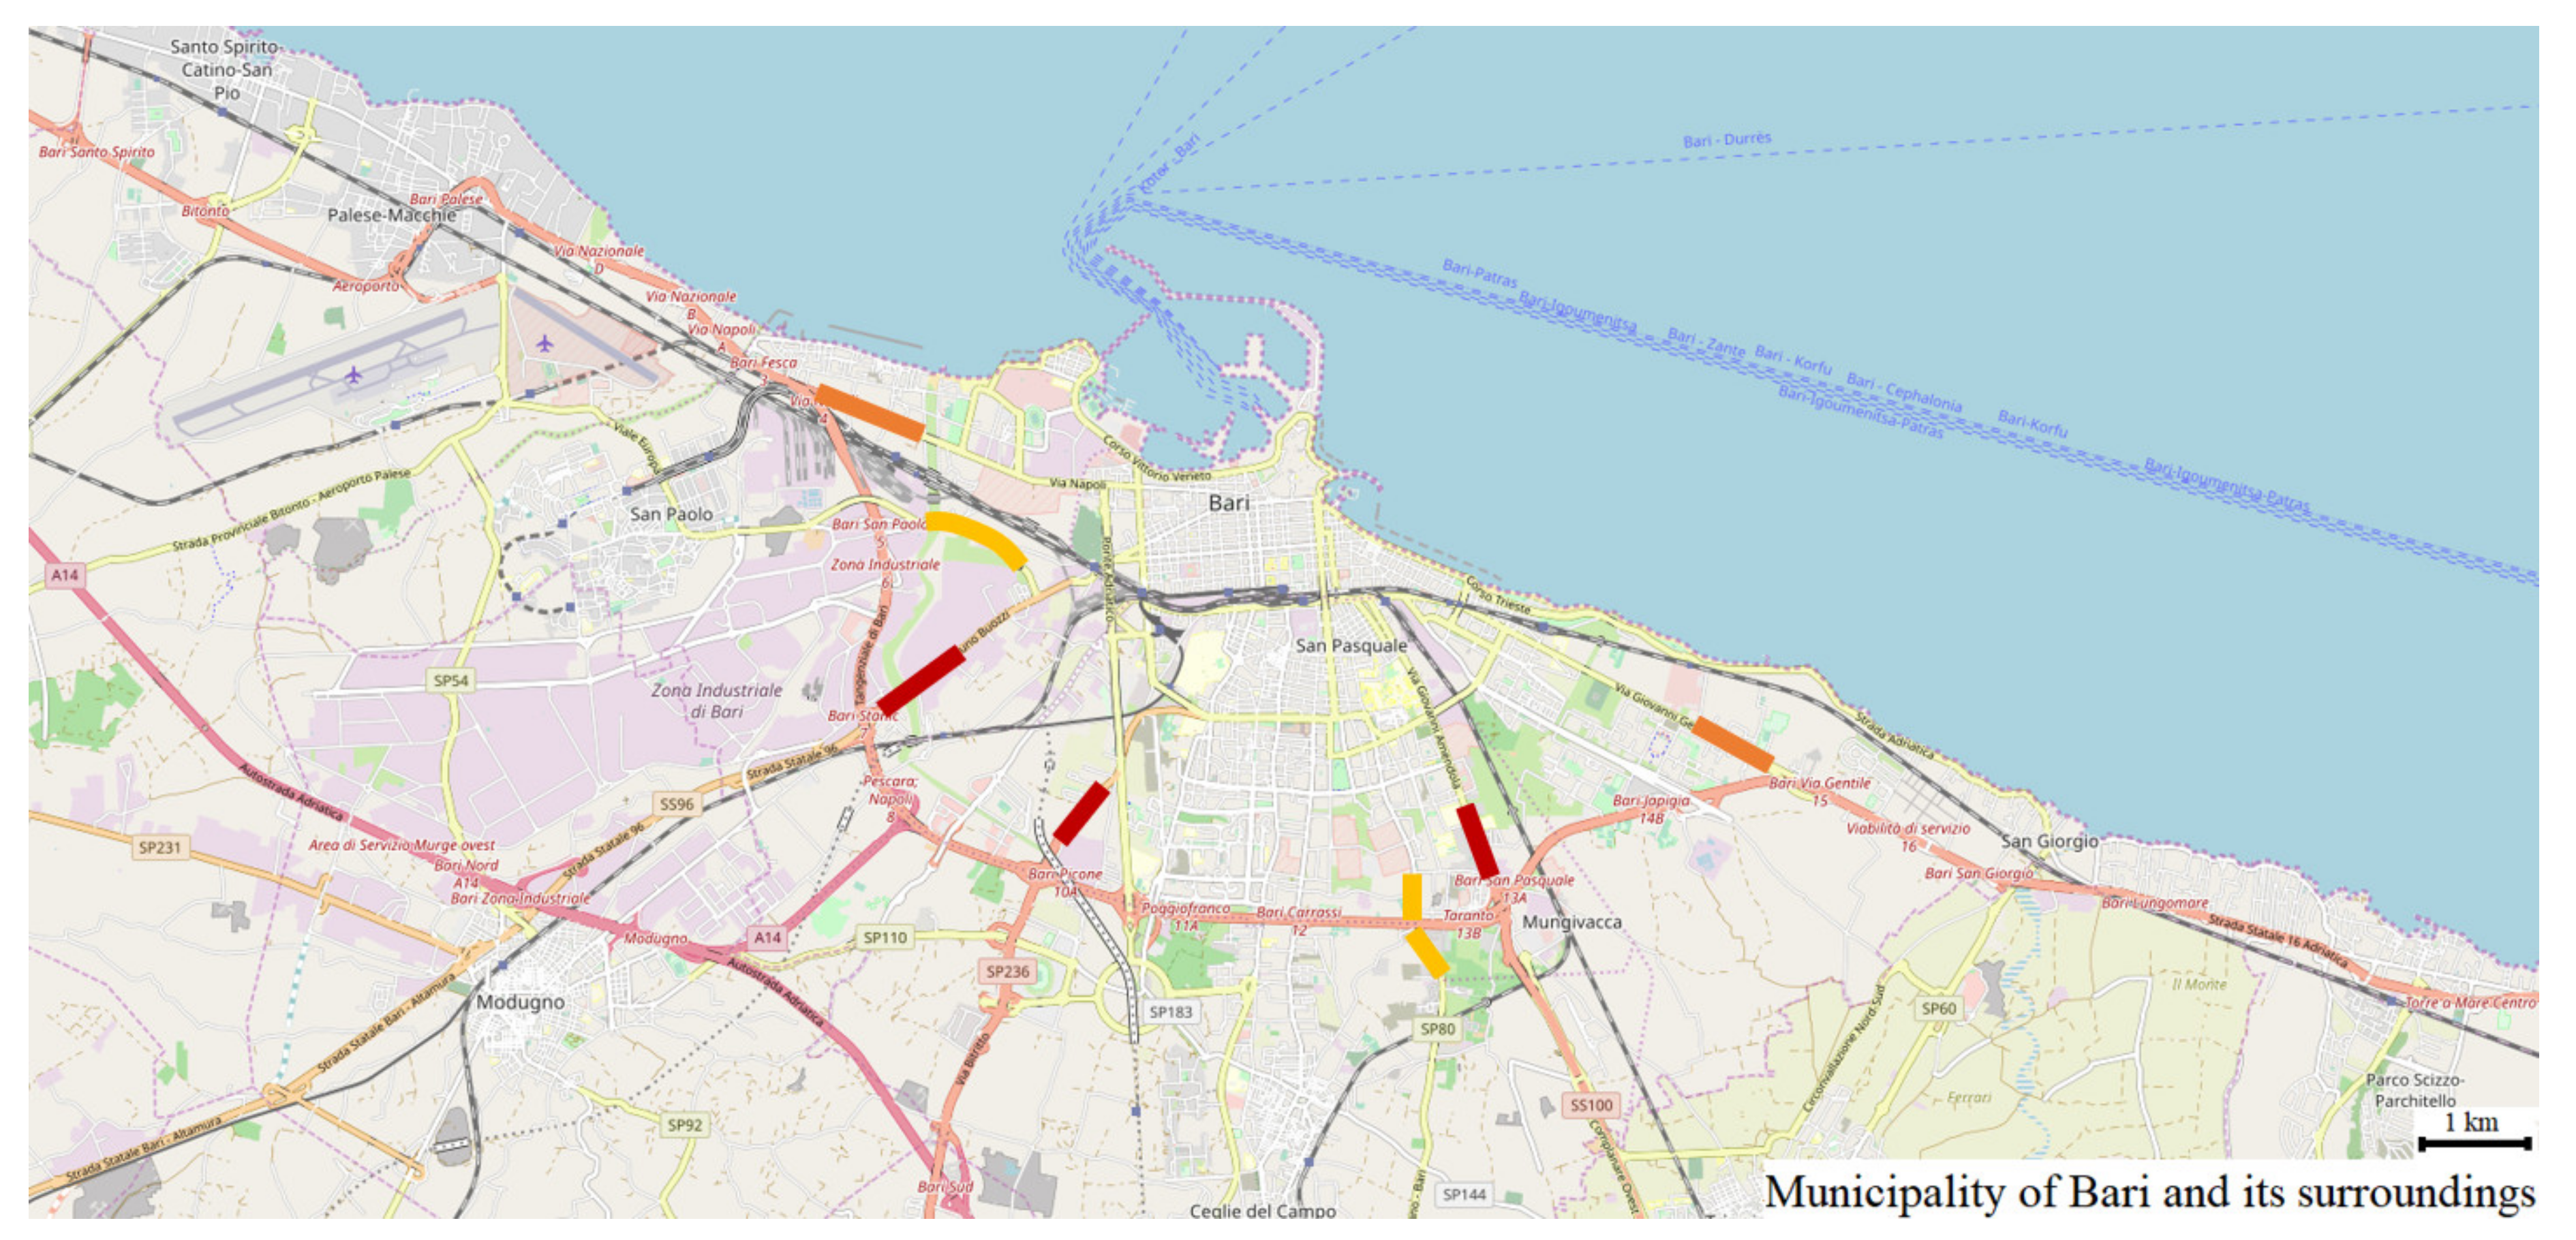
3.1. Results: End of Network Screening

Traffic volume and crash data were retrieved for the whole city of Bari (Italy). Traffic data were provided by the Municipality of Bari, but some field surveys were also repeated for each pilot application. Crash data belong to the National Institute of Statistics (ISTAT), and they were provided by the local agency ASSET [57]. They include only fatal + injury crashes (period: 2012–2016). In the network screening stage, the following problems have arisen, for which solutions are discussed.

3.1.1. Problem/Solution 3.1.A

Traffic volume data are hardly definable for the entire urban network, especially for secondary roads. They may be eventually obtained from traffic simulations, but they may still not include secondary roads. Thus, refined methods based on SPFs, such as the LOSS method [41] (but also simple evaluations based on crash rates), may have not been applied during the network screening. Hence, only basic indicators (i.e., the crash frequency) may have been adopted for the decision to enhance specific sites, e.g., by developing and assessing crash frequency maps (Figure 4). However, those indicators are often biased, because they do not take into account exposure and context variables. Thus, knowing in advance the potential of a specific site for improvement may be arduous in the urban environment, especially for secondary roads. The match with crash frequency maps (Figure 4) or tables can provide preliminary rough information about the site-specific improvement potential with respect to the reference population.

3.1.2. Problem/Solution 3.1.B

Most of the crash database includes fatal + injury (F + I) crashes only. In Italian urban environments, F + I crashes are estimated to be 12% of total crashes [59], which are less than half of the corresponding rural percentages (see e.g., American estimates [5]). This means that a consistent part of the complex crash phenomenon may be unknown. In some specific cases, such as congested traffic intersections with a relevant F + I crash history (see e.g., Figure 5, reporting a collision diagram of such case), the under-reporting may imply ignoring several crashes (see e.g., [60]). However, several road safety policies are oriented toward the reduction of F + I crashes (e.g., Vision Zero [28], Safe System Approach [27]). Hence, a given site may have been targeted for interventions based on a very small amount of crashes, and its resulting safety potential can be biased. However, the reduction of these few crashes is more urgent in urban environments, where VRU crashes necessarily cluster.

3.2. Results: Diagnosis

The diagnosis stage starts with the reconstruction of the geometric features of the road site on which the safety intervention should be designed (see Figure 6, in which boundary conditions are reported as well). Problems that have arisen at the diagnosis stage during the pilot applications of the design framework are highlighted in this section, together with the possible solutions.

3.2.1. Problem/Solution 3.2.A

An operational method to assign a functional class to existing urban roads was presented (Figure 3). After matching existing road standards with the ideal functional road features, radical differences have arisen in many cases of pilot applications. The enhancement of these features should be considered, especially in case of the following inconsistencies, which were observed:
  • Number of lanes (and/or carriageway width) not coherent with the function and the traffic flow (e.g., wide one-way minor collectors potentially allowing overtaking, double parking, and high speeds, in contrast with the presence of a relevant flow of VRUs, which may generate dangerous conflicts in residential areas);
  • Intersection type and/or dimensions not coherent with the function of the intersecting roads (e.g., signalized intersections without specialized lanes, traffic islands, dedicated signals for major collector roads intersecting);
  • Several accesses/minor intersections on arterial roads (which may be differently managed);
  • Absence of infrastructures and facilities for VRUs (even in case of their relevant presence).
The main design question is how to overcome these inconsistencies. Following the examples previously reported, a possible solution may be the prioritization of specifically solving safety-related inconsistencies. In contrast, the several minor differences with respect to current standards (e.g., slight discrepancies in lane and shoulder widths) may be eventually disregarded, if possible.

3.2.2. Problem/Solution 3.2.B

Closely related to 3.2.A, but independently considered due to its importance and uniqueness, there is the difficult classification of “transition” road sites. These are sites that formally belong to the urban network, and thus they should comply with urban standards, but they have completely different conditions and driver populations. This is the case for:
  • Arterial roads entering into the city, departing/being the continuation of rural roads (Figure 7);
  • High-level roads approaching to cities/towns, such as freeways or multi-lane highways.
In these cases, drivers who leave high-speed flows suddenly merge in lower speed flows, possibly leading to incorrect behaviors. If the rural-to-urban transition is not properly highlighted (e.g., [61]), drivers may form expectations of the road ahead based on their experience [62]. Hence, in the diagnosis stage, those situations should be particularly assessed by checking if the transition of road design elements is appropriate. Very often, standards/guidelines do not provide indications on how to perform this assessment. It should be rather focused on identifying if the features of urban roads, in which the rural traffic merges, are sufficiently different from the corresponding higher-level rural roads, and if they clearly indicate the urban entrance.

3.2.3. Problem/Solution 3.2.C

Road inspections were highlighted as a useful tool for the diagnosis stage. However, inspection sheets should be locally adapted, especially in the absence of local guidelines on how to conduct inspections. For example, inspection sheets for different rural road types, but only for one urban road category (undivided road segments) are provided in [26]. Hence, a generalized inspection sheet for road segments was developed [58], alongside with a separated new inspection sheet for urban intersections (see Table 1). Moreover, gaps were found in the operative guidelines to conduct inspections at intersections. In the developed integrated inspection sheet for intersections [58], the analysis is disaggregated for separately assessing the different sectors of the intersection (the central part, and each part of the segments ending into the intersection), in order to acquire detailed information about specifically located safety issues. In this way, safety measures can be eventually differentiated for the sectors at which specific issues were noted.

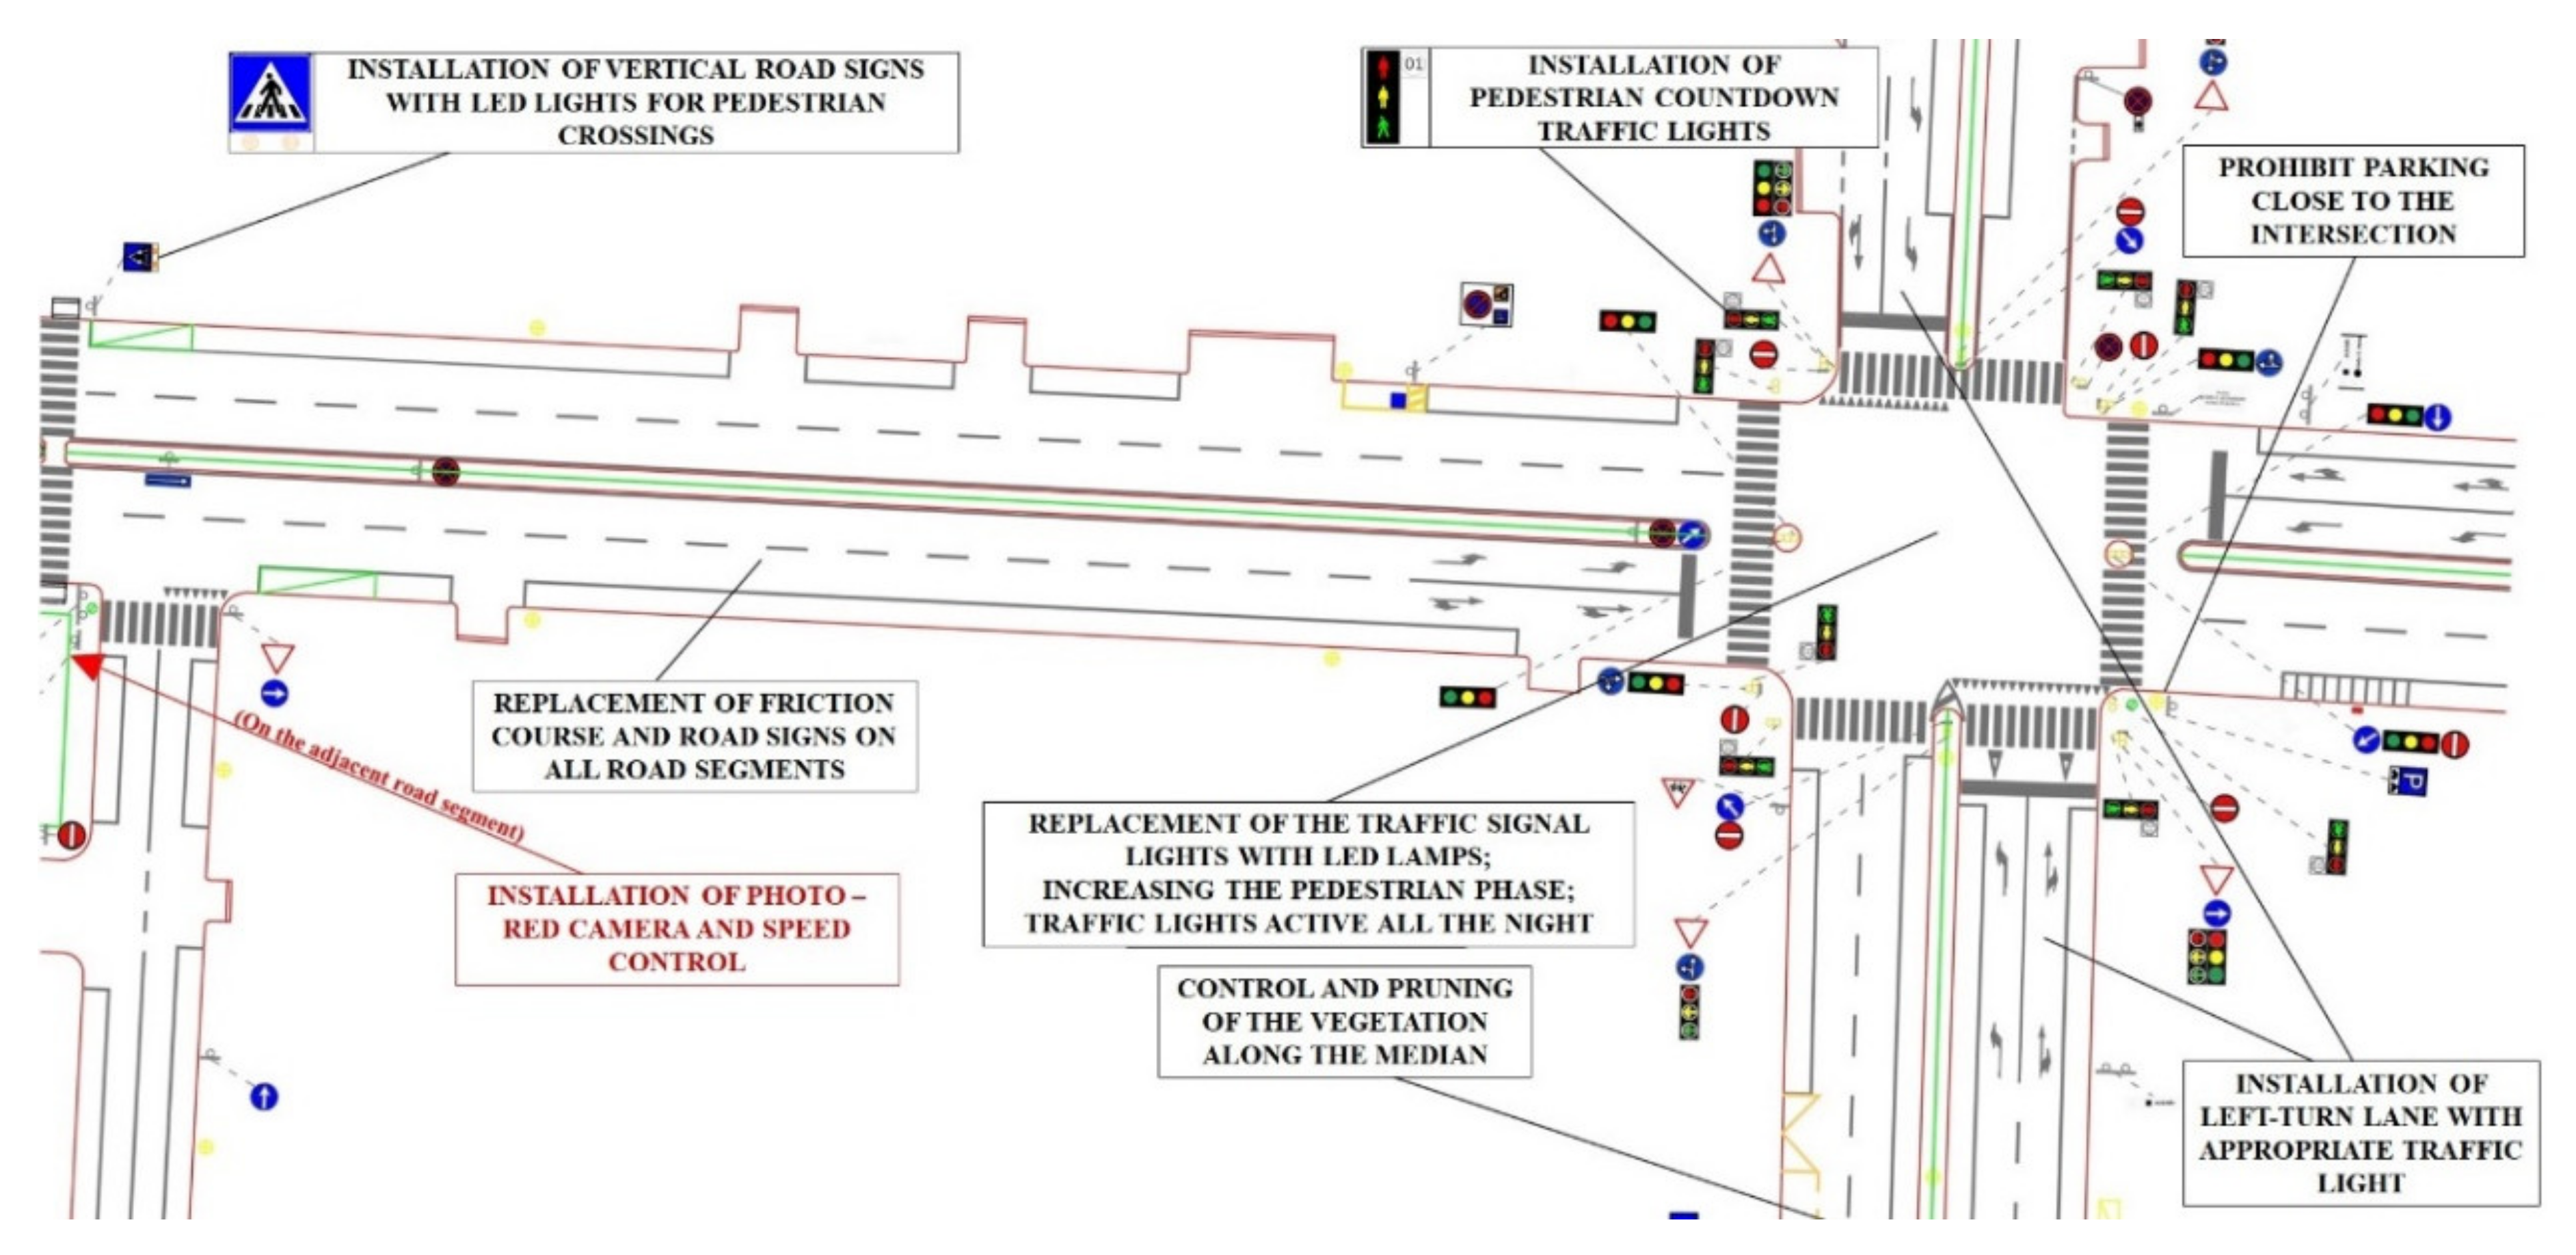
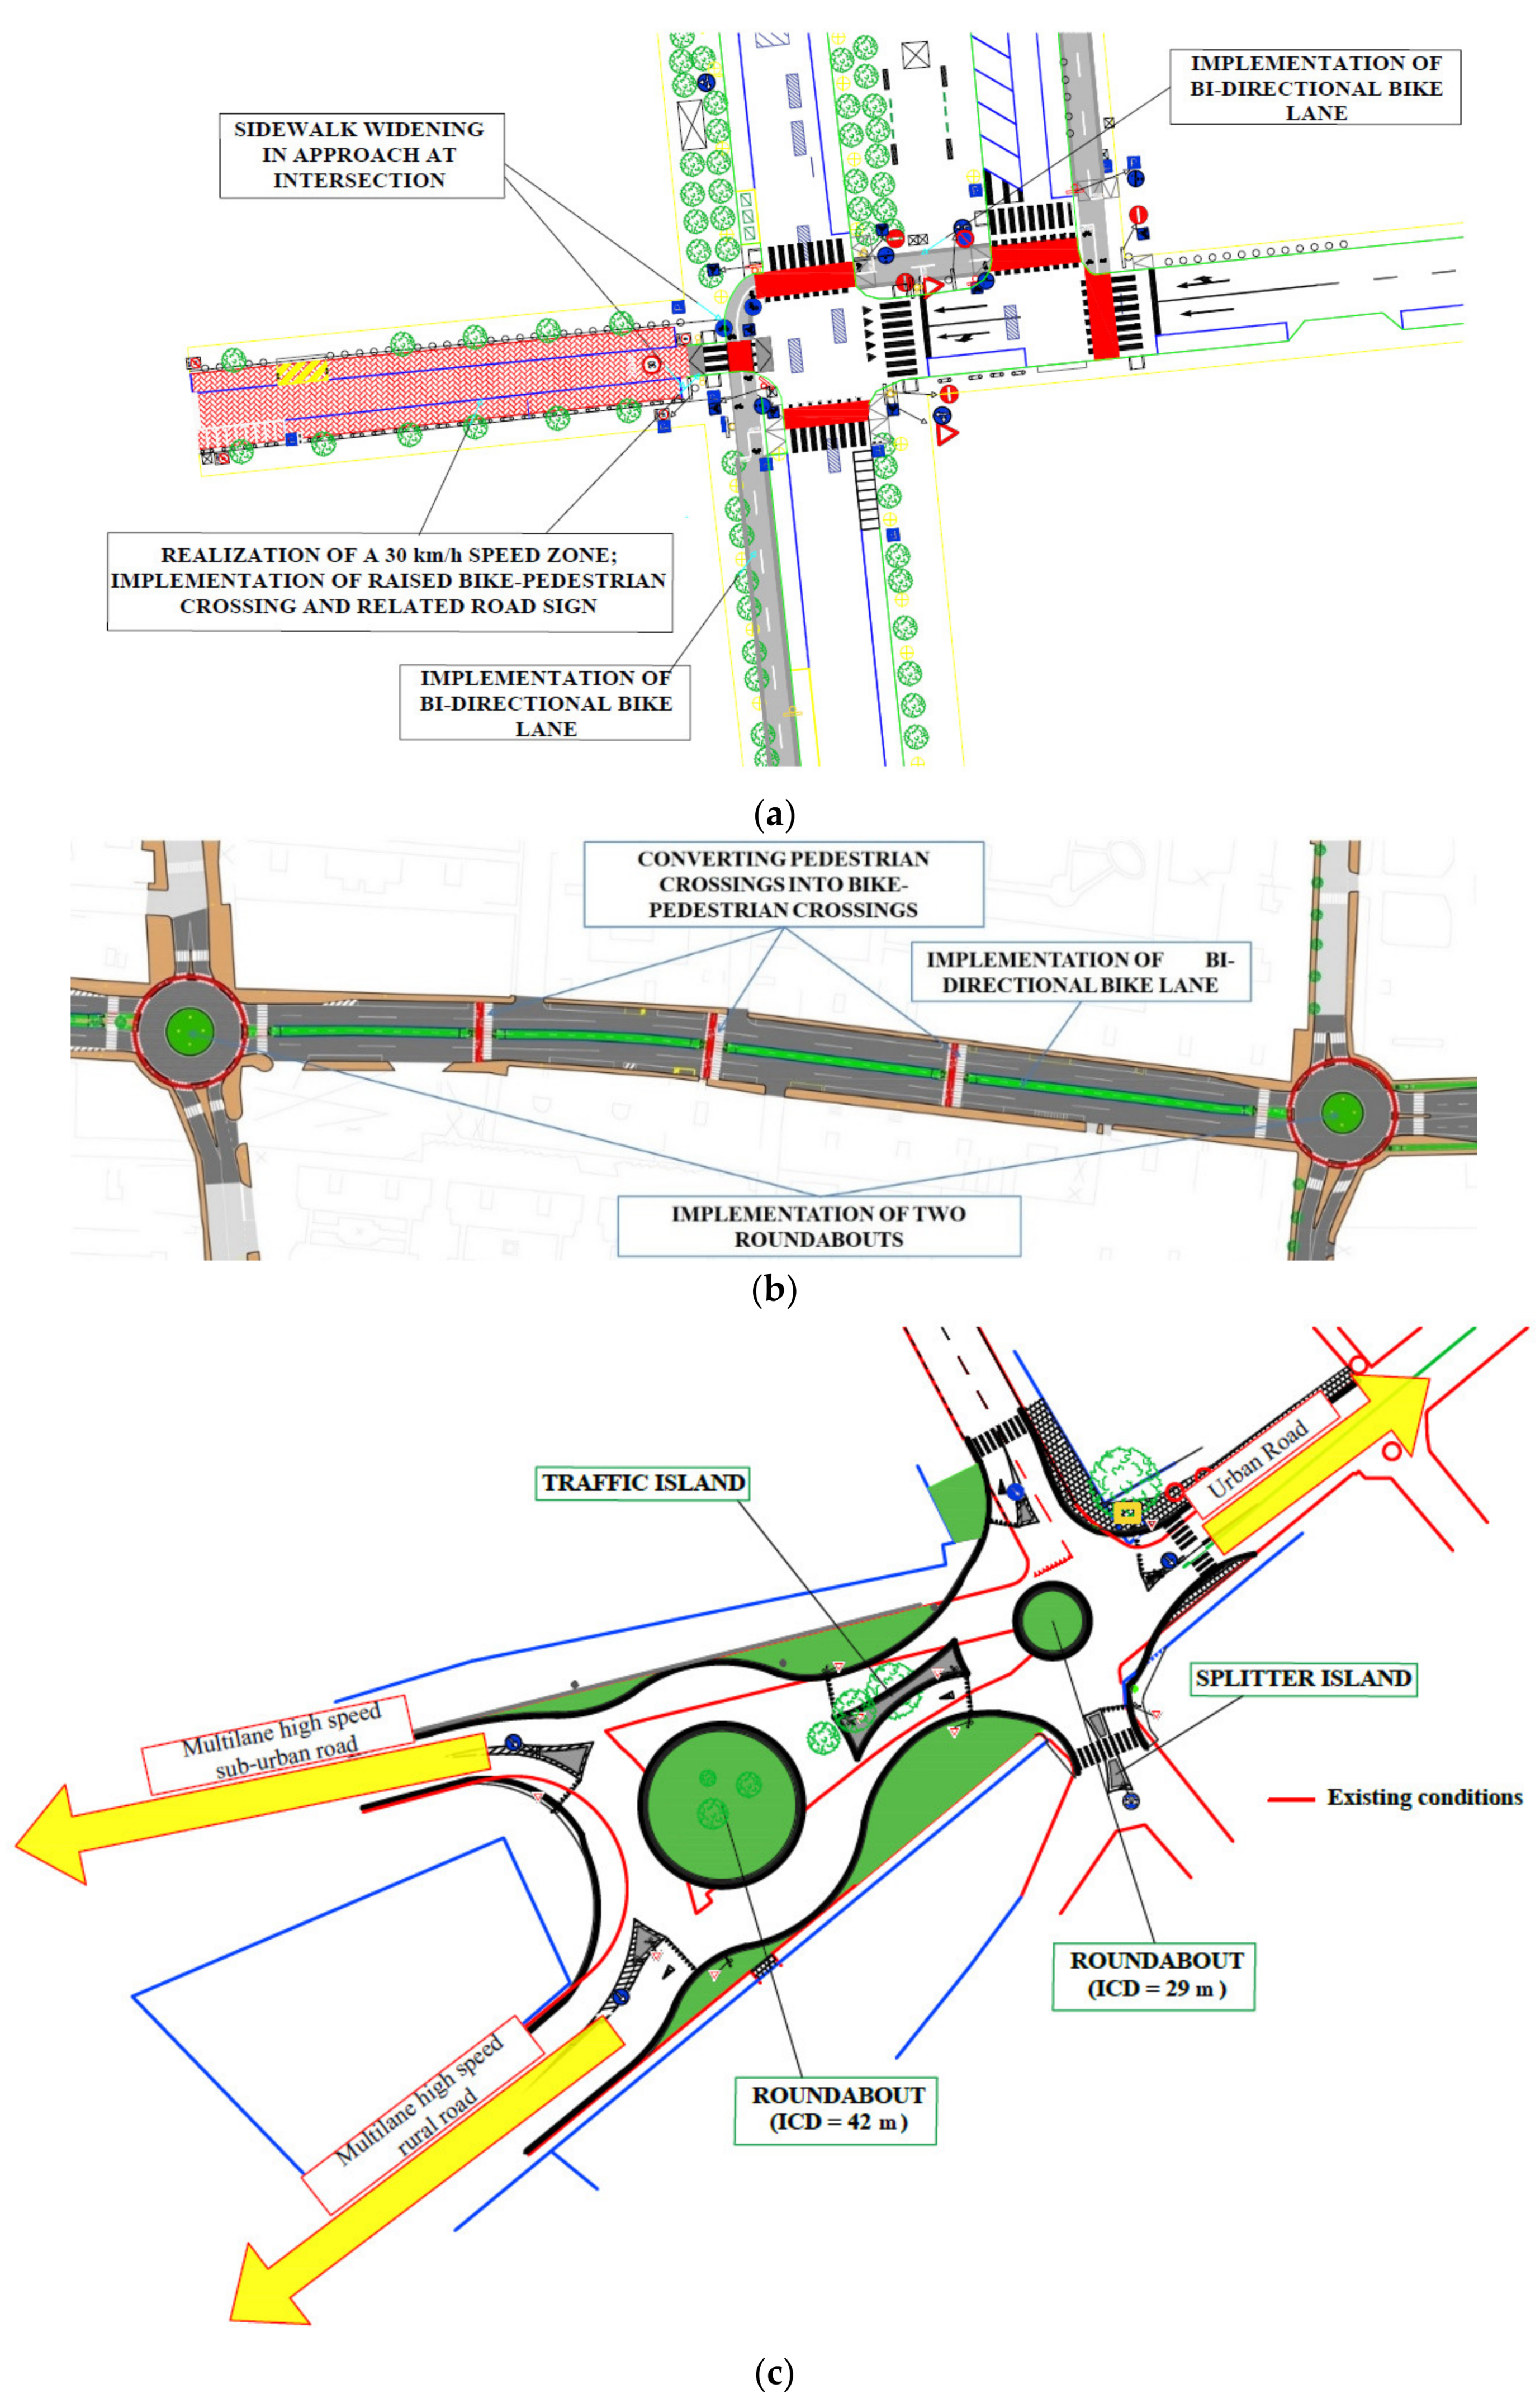
3.3. Results: Selection of Countermeasures

Once results from the diagnosis are obtained, appropriate countermeasures should be designed. Pilot applications of the design framework were conducted on different road sites (divided/undivided segments, signalized/unsignalized intersections). Main problems that have arisen while selecting countermeasures are reported as follows, together with the proposed solutions.

3.3.1. Problem/Solution 3.3.A

Safety issues and then possible countermeasures largely vary according to the specific road site. However, some recurrent problems were noted, which are largely independent of the specific road type (but having a different magnitude depending on it). Based on these problems, a large set of possible measures was developed for each recurrent problem. Clearly, in most cases, the proposed measures cannot be applied altogether to solve each corresponding problem. However, each of them was implemented at least once in one of the several pilot applications. The list of possible implementable countermeasures is reported in Table S1, where they are divided according to the recurrent problem, the specific urban road type (undivided one/two-way or divided segment, signalized/unsignalized intersection or roundabout), and their timeliness application (short-term or long-term countermeasures, including traffic calming). They may be used as a preliminary indication about the possible solutions applicable to recurrent problems on urban networks.

3.3.2. Problem/Solution 3.3.B

Several studies were recently developed for assessing safety aspects of cycling infrastructures. However, reliable CMFs related to the introduction of different types of facilities/infrastructures are not always available. Hence, the general impact of cycling infrastructures on safety is hardly definable [63]. For example, mixed results were found for:
  • Bike lanes (crash reduction [64], or slight increase in crashes/injuries [65]; influence on cyclists’ behavior that may possibly have negative safety effects (colored lanes) [66]);
  • Separated bike tracks (crash rate reduction compared to roads [67]; or increase [65]);
  • Roundabouts (negative effects on bicycle crashes [68]; or positive effects [69]).
These inconsistencies may depend on the several boundary variables, and the local importance of cycling mobility. In fact, the impact of cycling facilities/infrastructures on road safety may depend on geometric features, or variables about cyclists, drivers, or crash types [63]. However, the enhancement of pedestrian/cycling mobility may have positive impacts on the safety of VRUs [70]. A “safety-in-numbers” effect, in which a less than proportional increase in VRUs accidents is related to an increase in the VRU flows, was consistently noted in several studies [71]. Moreover, it was suggested that the fatality likelihood of a VRU involved in a vehicle crash decreases with the pedestrian/cyclist flows increasing [51]. On one hand, further research is needed in this field in order to assess the variability of the effects of cycling infrastructures on safety with boundary conditions. On the other hand, the enhancement of the cycling mobility should be pursued in order to improve urban safety and sustainability. This may be particularly relevant for areas that lack appropriate infrastructures/facilities for cyclists, such as in the case study performed. To note, the bike paths in the city of Bari are about 20 km long in total, while for example in a Swedish city with a similar population (Malmö), they are hundreds of kilometers long. This may be reflected in macro-level statistics: Italy has a motorization rate (vehicles/inhabitants) of 0.98 and a cyclist death rate of four per million inhabitants, while the same statistics for Sweden are namely: 0.62 and two (data from [72]).

3.3.3. Problem/Solution 3.3.C

A strategy for grouping countermeasures into sets according to their timeliness application and effectiveness was proposed (see examples of short-term and long-term measures namely in Figure 8 and Figure 9). The measures in each set should be grouped in order to be internally consistent, that is for solving a specific category of problems, independently from other sets. However, the definition of sets was not standard and straightforward, especially while coupling measures for traffic calming and sustainable mobility with other safety measures. In fact, even if some traffic calming measures may be relatively inexpensive and largely effective on safety, thus representing short-term measures, they may be not compatible with some urban roads. For example, in several cases (Table S1), the necessity for drastically reducing speeds on high-level roads has arisen. Despite this need, some physical traffic calming measures (e.g., speed humps) should be discouraged on roads that are typically traveled by public transport and emergency services, which cannot be severely slowed down. Hence, traffic calming was considered as coupled with:
  • Long-term measures for high-level urban roads, which include the site geometric reconfiguration, and not only inexpensive punctual measures.
  • Short-term measures for secondary roads, having scarce traffic flow and public transports.
However, implementing infrastructures for enhancing sustainable mobility (long-term measures in several cases) may often be coupled with other long-term measures (see Figure 9a,b). In fact, while reconfiguring roads (e.g., when replacing existing intersections with roundabouts), infrastructures and facilities for enhancing the sustainable mobility should be included anyway, if absent in the existing condition. This is valid independently from safety considerations, in case of well-designed new pedestrian and/or bicycle paths/crossings, given the site-specific constraints for the intervention.

3.4. Results: Economic Assessment

The definition of possible alternative sets of measures is followed by their economic assessment. This stage leads to choosing the actual road safety intervention project to be implemented. Problems that may arise at this stage are documented in this section, together with possible solutions.

3.4.1. Problem/Solution 3.4.A

The first important category of problems at this stage concerns the choice of the predictive method for estimating before/after crash frequencies and related safety benefits (Equations (1) to (3)). An SPF should be used that is either transferred and calibrated, or locally derived. Even in a case where calibration is performed, the transferability of SPFs and CMFs developed in different contexts may be arduous. For this reason, in the application of the pilot projects, the choice for a predictive method was crucial. The choice was based on a trade-off between the proximity of contexts in which SPFs were developed (with respect to the Italian case study considered) and the explaining SPF variables. In fact, the reliability of the estimates (see Equation (2)) may be jeopardized if several different sources are used for combining SPFs and different CMFs. An ideal source should be a local SPF structured as a base SPF that considers several additional variables (see e.g., [5]). In this way, additional sources of CMFs (especially if coming from different contexts) could be limited. Hence, a preliminary assessment of the available models was performed by focusing on European right-side driving countries (to exclude differences in the road equipment). A summary of the considered models for urban road segments and intersections is reported in the following Table 2. It includes the variables that were retained in the final statistically acceptable models presented by the authors, and some additional variables that could be of interest for road safety modeling, but which were not found in any considered model. Roundabout models are not reported in Table 2, since a very limited case of existing roundabouts were found in the pilot applications. The analysis of the comparison presented in Table 2 led to using:
  • The model in [42] for segments, since it outperforms the other retrieved model [73] in terms of the number of variables included;
  • The models in [43] for intersections, since: (a) the intersections considered for pilot applications have no intersecting segments with notable grades, and are often not provided with dedicated left/right-turn lanes (variables considered in [74]); (b) a scarce transferability [75] of the models in [74] was determined by applying it in another Italian city; (c) they are more recent; and (d) they include traffic variables for major/minor roads in the three-leg and four-leg cases. Clearly, even detailed models [42,43] lack some safety-related variables (Table 2). Hence, the effect of interventions affecting those variables on safety performances should be estimated through additional CMFs (by carefully checking their applicability).

3.4.2. Problem/Solution 3.4.B

In most of the urban intersections on which the pilot applications were applied, inadequate sight distances were noted. This condition was especially found in densely populated areas at crossings between streets surrounding blocks of houses, with narrow sidewalks (e.g., intersections in Figure 9a). Apart from remarks on how to improve this condition (which often should be indirectly solved e.g., through traffic signals, due to physical hindrances), it is important to highlight that it cannot be modeled in any reference SPF considered (Table 2). Sidewalk widths may be a surrogate measure for sight distance (and they are actually not often considered), but no precise correlation may exist between those variables, since obstacles on sidewalks are not considered. Hence, additional CMFs for taking into account a lack of sight distance may be a valid option. A recent study [47] has quantitatively linked the available sight distance with intersection safety performances for various posted speeds and traffic volumes. The crash modification functions provided in [47] were used in the pilot applications of the proposed framework to account for sight distance.

3.4.3. Problem/Solution 3.4.C

The hierarchical order of different sets of countermeasures (considering the economic assessment, see Table 3) is dependent on the safety benefits. If the implementation of some measures cannot be quantitatively assessed, then their impact on safety cannot be quantified and compared with costs. For several of the possible solutions proposed in Table S1, the quantitative assessment of their benefits is feasible. On the other hand, as previously explained, the quantitative assessment of bike lanes/paths or other infrastructures for enhancing sustainable mobility may be questionable. Hence, to promote urban sustainable mobility, and considering that it can even improve safety performances, these interventions could be excluded from cost–benefit analyses of safety measures. Otherwise, a conservative approach may consist of including the costs of their implementation and considering in parallel no effects on safety (i.e., CMF = one). A more complete overview about the impact of infrastructures for promoting the sustainable mobility may be obtained by conducting in parallel a separate cost–benefit analysis: a scenario with a weak positive impact on safety may be considered to assess the differences with respect to the previous base scenario (CMF = one). This strategy was actually pursued in the pilot applications (Table 4).
Another approach may consist of using dedicated SPFs that are able to take into account the presence of cycling flows, such as those presented in Table 4 (retrieved by using criteria similar to those previously used for the SPFs in Table 2). If those SPFs are selected, they should be used in the before/after scenarios in Equation (3). However, this approach was not used in the pilot applications. In fact, on one hand, the variables included in models in Table 4 are focused on specific cycling facilities (especially for intersections), not representing also traditional geometric features (such as the SPFs in Table 2 instead). The same issue can be found in SPFs that take into account mixed vehicle–pedestrian flows (e.g., [76,77]). On the other hand, cycling flows in the before conditions are often negligible in several application cases considered. Moreover, counting VRU flows may be even more troubling than vehicular flows [76].

4. Discussion

In this section, results from the application of the proposed integrated design framework for safety interventions on existing urban road segments and intersections are discussed in light of the research questions posed. The research questions concerned: (1) the possibility for successfully integrating quantitative and qualitative methods, (2) the analysis of the possible problems during the method application, and (3) the search for solutions in response to the highlighted problems.

4.1. Integration of Quantitative Assessments and Qualitative Methods and Concepts

The analysis of results from the applications clearly show the possible successful integration of quantitative and qualitative methods. It was repeatedly shown how predictive methods and quantitative assessments may be made flexible to account for qualitative methods and high-level strategies (independent of local conditions).
This was particularly highlighted while taking into account the following strategies: (a) reducing fatal and injury crashes [28] in urban areas through speed management and traffic calming measures, (b) self-explaining roads [30], and (c) enhancing sustainable urban mobility [78]. Since these concepts are strategic goals for road designers, merely quantitative estimates should be assessed in parallel with the tendency to the above reported conditions, depending on the local contexts.
For what concerns speed management, it was proposed to overcome several problems that have arisen in the application of the design framework (see Table S1). Speed management is based on both traffic calming measures and speed control. It could be particularly effective in the case of a speeding-related history of crashes or if critical interactions between vehicles and VRUs were consistently noted. It is actually possible to easily include speed management measures in quantitative assessments. In fact, both SPFs may include variables that may affect urban speeds (e.g., lane widths, see [43,74]), and relevant CMFs were developed (e.g., for area-wide traffic calming in residential areas [4]). However, it was also shown how contrasting findings were retrieved for some traffic calming measures (e.g., for raised intersections [4]). This may perplex the integration between strategic choices for traffic calming and the quantitative estimates.
The need for having self-explanatory roads was specifically related to the cases of transition areas [61,79] and road environments that are coherent with the drivers’ expectations [31]. In fact, rural-to-urban transitions deserve particular attention while designing safety interventions, by ensuring that the transition of road standards is coherent with drivers’ expectations (besides those of regulations). An example of such a solution was reported in Figure 9c, where the rural-to-urban transition is emphasized. Related to this, sight distance deficiencies were also noted in several applications, and these deficiencies may not be expected, either. Actually, these issues are hardly considerable in prediction models and economic assessments. Moreover, rural-to-urban transition zones are hardly definable as well [80]. Hence, the expectancy of road standards should be ensured through interventions on road features in both the highlighted cases, independently of the capability of models. However, at least the influence of sight deficiencies on safety performances was well defined [47].
The enhancement of sustainable mobility entails ensuring both safe interactions of VRUs and vehicles and safe dedicated infrastructures (i.e., bike and pedestrian paths). On one hand, the implementation of measures for improving the safety of VRUs’ interactions with vehicles has evident effects (see e.g., [55] for raised bike crossings), and then it can be easily considered in predictive methods. On the other hand, even if vehicle–pedestrian and vehicle–bicycle crashes are considered in some predictive methods (see e.g., [5]), the implementation of infrastructures or specific facilities dedicated to the sustainable mobility has unclear effects on safety in some cases [63]. This emerged as a main issue while trying to integrate high-level strategies and quantitative estimates in urban environments. However, the development of sustainable mobility is paramount in urban environments (see e.g., [78]), and it has also indirect positive effects on safety [51,71].
The use of integrative qualitative methods was also considered. Inspections may be useful to highlight specific local safety problems that can be hardly recognized through safety prediction models only. Moreover, safety audits are part of the safety management process [25]. The proposed design framework for safety interventions is actually by itself a continuous safety auditing process, since it entirely focuses on safety improvements.

4.2. Highlighted Problems and Proposed Solutions within the Design Framework Application

Several possible problems were highlighted in the context of application of the proposed design framework. They were divided according to the four stages: End of Network Screening, Diagnosis, Selection of Countermeasures, and Economic Assessment. Solutions to the considered problems were proposed. In light of these problems/solutions, advantages and disadvantages of the proposed method are discussed, alongside with its possible transferability.
In the End of Network Screening stage, the main problems are related to data. In fact, quality and/or detailed crash data, and area-wide traffic volumes may be hardly achievable. Hence, the safety potential of a given urban site could be hardly assessed for pondering interventions. For this reason, usually, this evaluation is postponed to the economic assessment stage. However, this issue is independent of the proposed framework. For what concerns crash data, in urban environments, the goal is to reduce fatalities and injuries, especially considering VRUs [81]. Hence, the usual lack of Property Damage Only (PDO) data should not be regarded as an obstacle to the framework application.
At the Diagnosis stage, an operational method for defining the function of existing urban roads and further checking their geometric and operational features with the ideal features of a road having that function was proposed. It has the advantage of potentially being applied independently on the context (i.e., geographic area, urban size, and network extension). Analyses based on inspection sheets (see e.g., [26]) may be easily transferred as well, even if they may be locally adapted. Particular attention should be paid to rural-to-urban transition areas, since regulations usually fail in giving precise recommendations on how to consider this issue and precisely categorize those areas [80]. The transition between rural and urban areas should be specifically designed by considering appropriate research and best practices (see e.g., [61,80]), and this is transferable to other contexts.
In the Selection of Countermeasures stage, several recurrent problems from the Diagnosis stage and the corresponding solutions were listed (Table S1). They may be valid for other areas that are different than the considered context of application, especially regarding the problems that are related to pavement maintenance, signs/markings, sight obstacles, driveways, crossings, interactions with VRUs, sensitive attractors, speeding, U-turns, and interactions with VRUs. The possible solutions proposed for these recurrent problems may be transferred to other contexts as well and, for most of them, CMFs are documented. For example, the conversion of existing intersections into modern roundabouts that meet current advanced standards [82] was consistently related to positive safety effects (see e.g., [4,83]). Inconsistencies in the CMFs that were related to the infrastructures and facilities for enhancing the cycling mobility were noted (see [63]). However, this issue is independent on the proposed method, but it could be overcome by producing concurrent estimate scenarios (i.e., worst-case and best-case scenarios), as proposed in the Economic Assessment stage. Anyway, the enhancement of sustainable mobility is generally indirectly associated with safety benefits [51]. Moreover, the strategy of grouping together different safety measures that may have the same rationale, thus defining “sets” of countermeasures, may be easily transferred as well. This choice may lead to rational simplifications in the CBA, being an advantage of the design framework.
In the Economic Assessment stage, the main disadvantage of the proposed method arises. The need for local appropriate SPFs is paramount. If they are absent (such as in this case), other SPFs should be considered. They should be taken at least from similar geographic areas, and they should include significant variables (see Table 2). However, even in this case, residuals between predicted and observed values may be not negligible, such as in the case of the four-leg intersections in the pilot applications. Hence, the quantitative part of the proposed method (based on [5]) is strongly dependent on the availability of reliable local models. However, this is a main issue of each predictive approach that is not specifically related to the considered framework (see e.g., [21]). Moreover, in the pilot applications, sight distance deficiencies at existing urban intersections were particularly highlighted. The considered SPFs (Table 2) do not include explicit sight distance variables, which were revealed as important (see [47]), and potentially transferable to other contexts.

4.3. Concluding Remarks

With reference to the goals set and the results obtained, this study contributes to overcoming gaps in the existing research by documenting the development and application of a locally adjusted integrated design framework for safety interventions on existing urban roads, and by examining the related problems and solutions. It may be important for both researchers and practitioners. In fact, on one hand, it may provide a useful and practice-ready framework for road safety designers by also highlighting some possible recurrent problems and proposed solutions. Hence, by following the steps indicated in this study, practitioners may rely on the proposed integrated design framework for safety-based interventions on existing urban roads. On the other hand, it is useful to individuate research gaps. In this regard, the relationship between sustainable mobility and safety should be better defined, by considering that they are inter-related aspects. The safety of rural-to-urban transition zones, especially if close to high-speed rural roads, should be better analyzed. The need for modern and comprehensive local predictive methods was indicated as well.
The validity of the integrated framework proposed in this study was assessed as based on an Italian urban road network (Municipality of Bari). Hence, the results from the application are intrinsically related to the considered context. Even if most of the discussed results may be transferred to other contexts, some singularities were noted. For example, only a few roundabouts and a limited network of bike lanes/paths are present in the Municipality of Bari. Hence, the considered scenario cannot be deemed as mature from a road safety/sustainability perspective. However, this apparent lack was actually useful for specifically assessing the possible implementation of these types of measures. Future research should be conducted to overcome these limitations, through at least applying the proposed method to other areas. Future research by the authors will be specifically focused on the development of local urban predictive methods, to be included in the context of the proposed design framework.

Supplementary Materials

The following are available online at https://0-www-mdpi-com.brum.beds.ac.uk/2313-576X/5/1/13/s1, Table S1: Summary matrix of groups of possible problems from the applications at the diagnosis stage and the corresponding proposed solutions (ST = Short-Term solutions, LT = Long-Term solutions, TC = Traffic Calming measures), (a) for undivided one-way roads, (b) for undivided two-way roads, (c) for divided roads, (d) for unsignalized intersections, (e) for signalized intersections, (f) for roundabouts.

Author Contributions

The authors confirm contribution to the paper as follows. Conceptualization, P.C. and P.I.; Data curation, P.I. and V.F.; Funding acquisition, P.C.; Investigation, P.I., V.F., and G.M.; Methodology, P.C., P.I., N.B., V.F., and V.R.; Supervision, P.C. and V.R.; Visualization, N.B. and G.M.; Writing—original draft, P.I., N.B., V.F., and G.M.; Writing—review and editing, P.C., P.I., and V.F.

Funding

Research on which this article is based was funded by the Italian Ministry of Infrastructures and Transport, under the Pa.S.S.S. Research Project (Parco Scientifico della Sicurezza Stradale, in English: “Scientific Park for Road Safety”), Main Leader: Comune di Bari (Municipality of Bari), Main Scientific Partner: Department of Civil, Environmental, Land, Building Engineering, and Chemistry (Polytechnic University of Bari, Italy), Scientific Director: P.C.

Acknowledgements

Roberto Ferrante, Damiano de Gennaro, Federica D’Onghia, Vanessa de Marinis, Fabiana Fanelli, Nunzio Pisicchio, and Mirko Valente are acknowledged for their contribution given in developing the pilot applications on which Figure 3, Figure 5, Figure 6, Figure 8 AND Figure 9a,b/Table 3 and Figure 9c are respectively based. More details about the framework and the pilot applications can be found at: http://poliroadtech.wixsite.com/poliroadtech.

Conflicts of Interest

The authors declare no conflict of interest.

References

  1. Eurostat Data. Available online: https://ec.europa.eu/eurostat (accessed on 1 December 2018).
  2. ACI (Italian Automobile Club)—ISTAT (Italian National Institute of Statistics) Data. Available online: http://www.aci.it/laci/studi-e-ricerche/dati-e-statistiche/incidentalita.html (accessed on 1 December 2018).
  3. Colonna, P.; Intini, P.; Berloco, N.; Ranieri, V. Integrated American-European protocol for safety interventions on existing two-lane rural roads. Eur. Transp. Res. Rev. 2018, 10, 5. [Google Scholar] [CrossRef]
  4. Elvik, R.; Vaa, T.; Hoye, A.; Sorensen, M. (Eds.) The Handbook of Road Safety Measures; Emerald Group Publishing: Bingley, UK, 2009. [Google Scholar]
  5. AASHTO (American Association of State Highway and Transportation Officials). Highway Safety Manual; AASHTO: Washington, DC, USA, 2010. [Google Scholar]
  6. Hauer, E. The Art of Regression Modeling in Road Safety; Springer: New York, NY, USA, 2015; Volume 38. [Google Scholar]
  7. Hauer, E.; Bonneson, J.; Council, F.; Srinivasan, R.; Zegeer, C. Crash modification factors: Foundational issues. Transp. Res. Rec. J. Transp. Res. Board 2012, 2279, 67–74. [Google Scholar] [CrossRef]
  8. Lord, D.; Mannering, F. The statistical analysis of crash-frequency data: A review and assessment of methodological alternatives. Transp. Res. Part A Policy Pract. 2010, 44, 291–305. [Google Scholar] [CrossRef]
  9. Hauer, E.; Harwood, D.; Council, F.; Griffith, M. Estimating safety by the empirical Bayes method: A tutorial. Transp. Res. Rec. J. Transp. Res. Board 2002, 1784, 126–131. [Google Scholar] [CrossRef]
  10. Elvik, R. The predictive validity of empirical Bayes estimates of road safety. Crash Anal. Prev. 2008, 40, 1964–1969. [Google Scholar] [CrossRef] [PubMed]
  11. EU Pract (Predicting Road ACidents—A Transferable Methodology across Europe) Project. Available online: www.practproject.eu/ (accessed on 1 December 2018).
  12. Yannis, G.; Dragomanovits, A.; Laiou, A.; Richter, T.; Ruhl, S.; La Torre, F.; Domenichini, L.; Graham, D.; Karathodorou, N.; Li, H. Use of crash prediction models in road safety management—An international inquiry. Transp. Res. Procedia 2016, 14, 4257–4266. [Google Scholar] [CrossRef]
  13. Harwood, D.W.; Bauer, K.M.; Richard, K.R.; Gilmore, D.K.; Graham, J.L.; Potts, I.B.; Torbic, D.J.; Hauer, E. Methodology to Predict the Safety Performance of Urban and Suburban Arterials; No. NCHRP Project 17-26; National Academy of Sciences: Washington, DC, USA, 2007. [Google Scholar]
  14. Lord, D.; Persaud, B. Crash prediction models with and without trend: Application of the generalized estimating equations procedure. Transp. Res. Rec. J. Transp. Res. Board 2000, 1717, 102–108. [Google Scholar] [CrossRef]
  15. Sayed, T.; Rodriguez, F. Crash prediction models for urban unsignalized intersections in British Columbia. Transp. Res. Rec. J. Transp. Res. Board 1999, 1665, 93–99. [Google Scholar] [CrossRef]
  16. Persaud, B.; Lord, D.; Palmisano, J. Calibration and transferability of crash prediction models for urban intersections. Transp. Res. Rec. J. Transp. Res. Board 2002, 1784, 57–64. [Google Scholar] [CrossRef]
  17. CMF Clearinghouse. Available online: www.cmfclearinghouse.org (accessed on 1 December 2018).
  18. International Road Assessment Programme. Road Safety Toolkit. Available online: www.toolkit.irap.org (accessed on 1 December 2018).
  19. Jurewicz, C.; Steinmetz, L.; Turner, B. Australian National Risk Assessment Model (No. AP-R451/14); NSW: Sydney, Australia, 2014; AP-R451-1. [Google Scholar]
  20. Sawalha, Z.; Sayed, T. Transferability of crash prediction models. Saf. Sci. 2006, 44, 209–219. [Google Scholar] [CrossRef]
  21. Farid, A.; Abdel-Aty, M.; Lee, J. Transferring and calibrating safety performance functions among multiple states. Crash Anal. Prev. 2018, 117, 276–287. [Google Scholar] [CrossRef] [PubMed]
  22. Farid, A.; Abdel-Aty, M.; Lee, J.; Eluru, N.; Wang, J.H. Exploring the transferability of safety performance functions. Crash Anal. Prev. 2016, 94, 143–152. [Google Scholar] [CrossRef] [PubMed]
  23. Elvik, R. International transferability of crash modification functions for horizontal curves. Crash Anal. Prev. 2013, 59, 487–496. [Google Scholar] [CrossRef] [PubMed]
  24. Park, J.; Abdel-Aty, M.; Lee, J.; Lee, C. Developing crash modification functions to assess safety effects of adding bike lanes for urban arterials with different roadway and socio-economic characteristics. Crash Anal. Prev. 2015, 74, 179–191. [Google Scholar] [CrossRef] [PubMed]
  25. Council of the European Union; European Parliament. Directive 2008/96/EC of the European Parliament and the Council of 19 November 2008 on Road Infrastructure Safety Management. Off. J. Eur. Union 2008, 319, 59–67. [Google Scholar]
  26. Ministero delle Infrastrutture e dei Trasporti (Italian Ministry of Infrastructures and Transport). Linee Guida per la Gestione e la Sicurezza delle Infrastrutture Stradali (Allegato al D.M. 35/2011). Guidelines for the Management and Safety of Road Infrastructures (Attached to the D.M. 35/2011); Italian Ministry of Infrastructures and Transport: Rome, Italy, 2011.
  27. PIARC (World Road Association) Online. Available online: https://roadsafety.piarc.org/en (accessed on 1 December 2018).
  28. Johansson, R. Vision Zero–Implementing a policy for traffic safety. Saf. Sci. 2009, 47, 826–831. [Google Scholar] [CrossRef]
  29. Lamm, R.; Psarianos, B.; Mailaender, T. Highway Design and Traffic Safety Engineering Handbook; McGraw-Hill: New York, NY, USA, 1999. [Google Scholar]
  30. Theeuwes, J.; Godthelp, H. Self-explaining roads. Saf. Sci. 1995, 19, 217–225. [Google Scholar] [CrossRef]
  31. Charlton, S.G.; Starkey, N.J. Driving on urban roads: How we come to expect the ‘correct’speed. Crash Anal. Prev. 2017, 108, 251–260. [Google Scholar] [CrossRef]
  32. Montella, A.; Imbriani, L.L.; Marzano, V.; Mauriello, F. Effects on speed and safety of point-to-point speed enforcement systems: Evaluation on the urban motorway A56 Tangenziale di Napoli. Accid. Anal. Prev. 2015, 75, 164–178. [Google Scholar] [CrossRef]
  33. Nilsson, G. Traffic Safety Dimensions and the Power Model to Describe the Effect of Speed on Safety. Doctoral Dissertation; Lund Institute of Technology, Traffic Engineering, University College London: London, UK, 2004. [Google Scholar]
  34. Aarts, L.; Van Schagen, I. Driving speed and the risk of road crashes: A review. Crash Anal. Prev. 2006, 38, 215–224. [Google Scholar] [CrossRef]
  35. Elvik, R. A re-parameterisation of the Power Model of the relationship between the speed of traffic and the number of crashes and crash victims. Crash Anal. Prev. 2013, 50, 854–860. [Google Scholar] [CrossRef] [PubMed]
  36. Ivan, J.N.; Jonsson, T.; Borsos, A. Motor vehicle speeds: Recommendations for urban sustainability. Transp. Res. Rec. J. Transp. Res. Board 2012, 2301, 1–8. [Google Scholar] [CrossRef]
  37. Wegman, F. The future of road safety: A worldwide perspective. IATSS Res. 2017, 40, 66–71. [Google Scholar] [CrossRef]
  38. Cafiso, S.; Cava, G.; Montella, A. Safety inspections as supporting tool for safety management of low-volume roads. Transp. Res. Rec. J. Transp. Res. Board 2011, 2203, 116–125. [Google Scholar] [CrossRef]
  39. Tripodi, A.; Persia, L.; Di Mascio, P.; Corazza, M.V.; Musso, A. A decision support system for analysis of vulnerable road users safety issues: Results of the Saferbrain project. Procedia-Soc. Behav. Sci. 2012, 53, 841–850. [Google Scholar] [CrossRef]
  40. Colonna, P.; Berloco, N.; Intini, P.; Ranieri, V. Sicurezza Stradale. Un Approccio Scientifico ad un Problema Tecnico e Comportamentale (Road Safety. A Scientific Approach for a Technical and Behavioural Problem); WIP Edizioni: Bari, Italy, 2016. [Google Scholar]
  41. Kononov, J.; Allery, B. Level of service of safety: Conceptual blueprint and analytical framework. Transp. Res. Rec. J. Transp. Res. Board 2003, 1840, 57–66. [Google Scholar] [CrossRef]
  42. Greibe, P. Crash prediction models for urban roads. Crash Anal. Prev. 2003, 35, 273–285. [Google Scholar] [CrossRef]
  43. Gomes, S.V.; Geedipally, S.R.; Lord, D. Estimating the safety performance of urban intersections in Lisbon, Portugal. Saf. Sci. 2012, 50, 1732–1739. [Google Scholar] [CrossRef]
  44. Intini, P.; Colonna, P.; Berloco, N.; Ranieri, V.; Ryeng, E. The relationships between familiarity and road accidents: Some case studies. In Transport Infrastructure and Systems: Proceedings of the AIIT International Congress on Transport Infrastructure and Systems (Rome, Italy, 10–12 April 2017); CRC Press: Boca Raton, FL, USA, 2017. [Google Scholar]
  45. USDOT FHWA (US Department of Transportation. Federal Highway Administration). Highway Functional Classification Concepts, Criteria and Procedures; USDOT FHWA: Washington, DC, USA, 2013. [Google Scholar]
  46. Dixon, K.; van Schalkwyk, I.; Layton, R. Balancing urban driveway design demands based on stopping sight distance. Transp. Res. Rec. J. Transp. Res. Board 2009, 2120, 18–27. [Google Scholar] [CrossRef]
  47. National Academies of Sciences, Engineering, and Medicine. Guidance for Evaluating the Safety Impacts of Intersection Sight Distance; The National Academies Press: Washington, DC, USA, 2018. [Google Scholar] [CrossRef]
  48. Demasi, F.; Loprencipe, G.; Moretti, L. Road safety analysis of urban roads: Case study of an Italian municipality. Safety 2018, 4, 58. [Google Scholar] [CrossRef]
  49. ROSEBUD (Road Safety and Environmental Benefit-Cost and Cost-Effectiveness Analysis for Use in Decision-Making) EU Project. Examples of Assessed Road Safety Measures—A Short Handbook; European Commission: Brussels, Belgium, 2006. [Google Scholar]
  50. Campbell, J.L.; Lichty, M.G.; Brown, J.L.; Richard, C.M.; Graving, J.S.; Graham, J.; O’Laughlin, M.; Torbic, D.; Harwood, D. Human Factors Guidelines for Road Systems; Transportation Research Board: Washington, DC, USA, 2012. [Google Scholar]
  51. Jacobsen, P.L. Safety in numbers: More walkers and bicyclists, safer walking and bicycling. Inj. Prev. 2003, 9, 205–209. [Google Scholar] [CrossRef] [PubMed]
  52. Cairns, J.; Warren, J.; Garthwaite, K.; Greig, G.; Bambra, C. Go slow: An umbrella review of the effects of 20 mph zones and limits on health and health inequalities. J. Public Health 2014, 37, 515–520. [Google Scholar] [CrossRef] [PubMed]
  53. Wefering, F.; Rupprecht, S.; Bührmann, S.; Böhler-Baedeker, S. Guidelines. Developing and Implementing a Sustainable Urban Mobility Plan; European Commission: Brussels, Belgium, 2013. [Google Scholar]
  54. Colonna, P.; Berloco, N.; Circella, G. The interaction between land use and transport planning: A methodological issue. Procedia-Soc. Behav. Sci. 2012, 53, 84–95. [Google Scholar] [CrossRef]
  55. Schepers, J.P.; Kroeze, P.A.; Sweers, W.; Wüst, J.C. Road factors and bicycle–motor vehicle crashes at unsignalized priority intersections. Crash Anal. Prev. 2011, 43, 853–861. [Google Scholar] [CrossRef] [PubMed]
  56. Ewing, R.; Dumbaugh, E. The built environment and traffic safety: A review of empirical evidence. J. Plan. Lit. 2009, 23, 347–367. [Google Scholar] [CrossRef]
  57. ASSET (Agenzia Regionale Strategica per la Sviluppo Ecosostenibile del Territorio, in English: “Regional Strategic Agency for Ecosustainable Area Development”, Puglia Region, Italy), formerly AREM (Agenzia Regionale per la Mobilità, in English: “Regional Agency for Mobility”). Available online: http://asset.regione.puglia.it/ (accessed on 1 December 2018).
  58. Colonna, P.; Berloco, N.; Fedele, V.; Intini, P.; Masi, G.; Ranieri, V. Report del Progetto PA.S.S.S., I Anno di Attività (Report of the Pa.S.S.S: Project, 1st Year); Politecnico di Bari: Bari, Italy, 2018. [Google Scholar]
  59. Wijinen, W.; Weijermars, W.; Vanden Berghe, W.; Schoeters, A.; Bauer, R.; Carnis, L.; Elvik, R.; Theofilatos, A.; Filtness, A.; Reed, S.; et al. Crash Cost Estimates for European Countries, Deliverable 3.2 of the H2020 Project SafetyCube; Loughborough University, SafetyCube: Loughborough, UK, 2017. [Google Scholar]
  60. Montella, A.; Andreassen, D.; Tarko, A.P.; Turner, S.; Mauriello, F.; Imbriani, L.L.; Romero, M.A. Crash databases in Australasia, the European Union, and the United States: Review and prospects for improvement. Transp. Res. Rec. 2013, 2386, 128–136. [Google Scholar] [CrossRef]
  61. Lantieri, C.; Lamperti, R.; Simone, A.; Costa, M.; Vignali, V.; Sangiorgi, C.; Dondi, G. Gateway design assessment in the transition from high to low speed areas. Transp. Res. Part F Traffic Psychol. Behav. 2015, 34, 41–53. [Google Scholar] [CrossRef]
  62. Charlton, S.G.; Mackie, H.W.; Baas, P.H.; Hay, K.; Menezes, M.; Dixon, C. Using endemic road features to create self-explaining roads and reduce vehicle speeds. Crash Anal. Prev. 2010, 42, 1989–1998. [Google Scholar] [CrossRef]
  63. DiGioia, J.; Watkins, K.E.; Xu, Y.; Rodgers, M.; Guensler, R. Safety impacts of bicycle infrastructure: A critical review. J. Saf. Res. 2017, 61, 105–119. [Google Scholar] [CrossRef]
  64. Rodegerdts, L.A.; Nevers, B.; Robinson, B.; Ringert, J.; Koonce, P.; Bansen, J.; Nguyen, T.; McGill, J.; Stewart, D.; Suggett, J.; et al. Signalized Intersections: Informational Guide; Publication No. FHWA-HRT-04-091; FHWA: Washington, DC, USA, 2004. [Google Scholar]
  65. Jensen, S.U. Bicycle tracks and lanes: A before–after study. In Proceedings of the 87th Annual Meeting of the Transportation Research Board, Washington, DC, USA, 13–17 January 2008. [Google Scholar]
  66. Hunter, W.W.; Harkey, D.L.; Stewart, J.R.; Birk, M.L. Evaluation of blue bike-lane treatment in Portland, Oregon. Transp. Res. Rec. 2000, 1705, 107–115. [Google Scholar] [CrossRef]
  67. Lusk, A.C.; Morency, P.; Miranda-Moreno, L.F.; Willett, W.C.; Dennerlein, J.T. Bicycle guidelines and crash rates on cycle tracks in the United States. Am. J. Public Health 2013, 103, 1240–1248. [Google Scholar] [CrossRef] [PubMed]
  68. Daniels, S.; Nuyts, E.; Wets, G. The effects of roundabouts on traffic safety for bicyclists: An observational study. Crash Anal. Prev. 2008, 40, 518–526. [Google Scholar] [CrossRef] [PubMed]
  69. Anjana, S.; LR Anjaneyulu, M.V. Development of safety performance measures for urban roundabouts in India. J. Transp. Eng. 2014, 141, 401–406. [Google Scholar] [CrossRef]
  70. Elvik, R. The non-linearity of risk and the promotion of environmentally sustainable transport. Accid. Anal. Prev. 2009, 41, 849–855. [Google Scholar] [CrossRef] [PubMed]
  71. Elvik, R.; Bjørnskau, T. Safety-in-numbers: A systematic review and meta-analysis of evidence. Saf. Sci. 2017, 92, 274–282. [Google Scholar] [CrossRef]
  72. WHO (World Health Organization). Available online: https://extranet.who.int/roadsafety/death-on-the-roads/ (accessed on 1 January 2019).
  73. Fancello, G.; Soddu, S.; Fadda, P. A crash prediction model for urban road networks. J. Transp. Saf. Secur. 2018, 10, 387–405. [Google Scholar]
  74. Canale, S.; Leonardi, S.; Pappalardo, G. The reliability of the urban road network: Crash forecast models. In Proceedings of the 3rd International SIIV Conference, Bari, Italy, 22–24 September 2005; pp. 1–22. [Google Scholar]
  75. Marchionna, A.; Perco, P.; Tavernar, M.C. Transferability of crash prediction models for urban intersections. In Proceedings of the 17th National SIIV Congress, Enna, Italy, 10–12 September 2008. [Google Scholar]
  76. Jonsson, T. Predictive Models for Accidents on Urban Links—A Focus on Vulnerable Road Users; Bulletin/Lund Institute of Technology, Department of Technology and Society: Lund, Sweden, 2005; p. 226. [Google Scholar]
  77. Brüde, U.; Larsson, J. Models for predicting accidents at junctions where pedestrians and cyclists are involved. How well do they fit? Accid. Anal. Prev. 1993, 25, 499–509. [Google Scholar] [CrossRef]
  78. Banister, D.; Akerman, J.; Stead, D.; Nijkamp, P.; Dreborg, K.; Steen, P. European Transport Policy and Sustainable Mobility; Taylor & Francis: Abingdon, UK, 2000. [Google Scholar]
  79. Caliendo, C.; De Guglielmo, M.L. Road transition zones between the rural and urban environment: Evaluation of speed and traffic performance using a microsimulation approach. J. Transp. Eng. 2012, 139, 295–305. [Google Scholar] [CrossRef]
  80. Colonna, P.; Berloco, N. Transition zones between urban and inter-urban areas: Identification and definition criteria. In Proceedings of the 24th World Road Congress World Road Association (PIARC), Mexico City, Mexico, 26–30 September 2011. [Google Scholar]
  81. World Health Organization. Global Status Report on Road Safety 2015; World Health Organization: Geneva, Switzerland, 2015. [Google Scholar]
  82. Berloco, N.; Colonna, P.; Intini, P.; Ranieri, V. Investigating the deviation angle method for ensuring deflection at one-lane rural roundabouts. Baltic J. Road Bridge Eng. 2018, 13, 127–138. [Google Scholar] [CrossRef]
  83. Qin, X.; Bill, A.; Chitturi, M.; Noyce, D.A. Evaluation of Roundabout Safety; No. 13-2060. In Proceedings of the 92nd Annual Meeting of the Transportation Research Board, Washington, DC, USA, 13–17 January 2013. [Google Scholar]
Figure 1. Steps of the simulated design process of safety-based interventions on existing urban roads (within the road safety management process [5]), from the End of the Network screening to the prioritization of different alternative projects (Economic Assessment).
Safety 05 00013 g001
Figure 2. Example of a road site on which the design process is applied, including different basic elements (divided/undivided segments, signalized/unsignalized, three/four-legged intersections).
Safety 05 00013 g002
Figure 3. Flow chart of the steps for identifying and checking the function of existing urban roads.
Safety 05 00013 g003
Figure 4. Example of a part of a crash frequency map for an urban city network (based on [58]).
Safety 05 00013 g004
Figure 5. Example of collision diagram.
Safety 05 00013 g005
Figure 6. Example of reconstruction of road features and identification of boundary conditions.
Safety 05 00013 g006
Figure 7. Rural-to-urban “transition” sites in the Municipality of Bari, Italy (red segments represent the continuation of rural high-level roads, orange links enter into the city from urban high-level roads, yellow segments are the continuation of rural/sub-urban roads), map from www.openstreetmap.org.
Safety 05 00013 g007
Figure 8. Example of a short-term set of countermeasures in a pilot application.
Safety 05 00013 g008
Figure 9. Example of long-term sets of countermeasures in pilot applications. (a) (top) including also measures for enhancing the sustainable mobility and protecting Vulnerable Road Users (VRUs), (b) (middle) representing a radical geometric reconfiguration, (c) (bottom) for managing speeds at a rural-to-urban transition site.
Safety 05 00013 g009
Table 1. Example of adapted preliminary inspection sheets for road segments and intersections (taken from [58], integration to the Italian Guidelines [26] are highlighted in bold type).
PART OF THE INSPECTION SHEET FOR ROAD SEGMENTS
MACRO-ITEMITEMPARAMETERINDICATORJUDGMENT (TO BE FILLED BY THE OPERATOR)
ROAD CARRIAGEWAYCARRIAGEWAYSHOULDERABSENCE/INSUFFICIENT WIDTHNo issues detected, light or severe issues detected
NARROWING IN PRESENCE OF HIGH PEDESTRIAN FLOWSNo issues detected, light or severe issues detected
TRAVEL LANESINADEQUATE WIDTHNo issues detected, light or severe issues detected
INADEQUATE COORDINATION WITH OTHER FLOWSNo issues detected, light or severe issues detected
SPECIALIZED LANEINADEQUATE WIDTHNo issues detected, light or severe issues detected
INADEQUATE COORDINATION WITH OTHER FLOWSNo issues detected, light or severe issues detected
RESERVED LANEINADEQUATE WIDTHNo issues detected, light or severe issues detected
INADEQUATE COORDINATION WITH OTHER FLOWSNo issues detected, light or severe issues detected
BUS STOPINADEQUATE DIMENSIONSNo issues detected, light or severe issues detected
LOCALIZATIONNo issues detected, light or severe issues detected
DISCONTINUITY OF PEDESTRIAN PATHSNo issues detected, light or severe issues detected
MEDIANABSENCENo issues detected, light or severe issues detected
EFFECTS ON VISIBILITYNo issues detected, light or severe issues detected
INADEQUATE ORGANIZATION OF AREASNo issues detected, light or severe issues detected
PARKING LOTSINADEQUATE ORGANIZATION OF AREASNo issues detected, light or severe issues detected
INADEQUATE COORDINATION WITH OTHER FLOWSNo issues detected, light or severe issues detected
PEDESTRIAN/BIKE PATHSCROSS SECTION WIDTHNo issues detected, light or severe issues detected
PAVEMENT MAINTENANCENo issues detected, light or severe issues detected
PRESENCE OF OBSTACLESNo issues detected, light or severe issues detected
PRESENCE OF MEDIANSNo issues detected, light or severe issues detected
PART OF THE INSPECTION SHEET FOR ROAD INTERSECTIONS
MACRO-ITEMITEMPARAMETERINDICATORJUDGMENT (TO BE FILLED BY THE OPERATOR)
ROAD CARRIAGEWAYCARRIAGEWAYSHOULDERABSENCE/INSUFFICIENT WIDTHNo issues detected, light or severe issues detected
NARROWING IN PRESENCE OF HIGH PEDESTRIAN FLOWSNo issues detected, light or severe issues detected
SPECIALIZED LANEINADEQUATE WIDTHNo issues detected, light or severe issues detected
INADEQUATE COORDINATION WITH OTHER FLOWSNo issues detected, light or severe issues detected
RESERVED LANEINADEQUATE WIDTHNo issues detected, light or severe issues detected
INADEQUATE COORDINATION WITH OTHER FLOWSNo issues detected, light or severe issues detected
TRAFFIC ISLANDEFFECTS ON VISIBILITYNo issues detected, light or severe issues detected
INADEQUATE ORGANIZATION OF AREASNo issues detected, light or severe issues detected
PEDESTRIAN/BIKE PATHSCROSS SECTION WIDTHNo issues detected, light or severe issues detected
PAVEMENT MAINTENANCENo issues detected, light or severe issues detected
Table 2. Variables included in some European models retrieved in literature for road segments and intersections, with indications of some additional important variables not retrieved in any model.
SegmentsIntersections
VariablesIncluded in Final Models as Retrieved in:VariablesIncluded in Final Models as Retrieved in:
[42][73]No Model[43][74] 1[73] 2 No Model[43][74] 1[73] 2No Model
Three-Legged IntersectionsFour-Legged Intersections
AADT AADT of major road section ✔ (no-control, stop)
Lenght of road section AADT of minor road section✔ (stop)
Speed limit Total entering AADT volume in the intersection
Road width Lane balance
Number of accesses Median presence on one leg of major road
Number of minor exits Median presence on two legs of major road✔ (stop)
Parking Median presence on two legs of minor road
Land use Total number of entering lanes on major road
One-way Number of lanes on minor road ✔(signalized)
Number of lanes Average lane width on minor road ✔ (stop) ✔ (no-control, signalized)
Road signs on minor roads/accesses Number of one-way legs
Pavement conditions One-way on major road ✔ (no-control) ✔ (no-control, signalized)
Road markings One-way on minor road ✔ (stop) ✔ (no-control)
Presence of bikelanes/paths Right turn presence on major road 3 ✔ (stop, signalized)
Sidewalk width Right turn presence on minor road 3 ✔ (stop, signalized)
Median presence Left turn presence on major road 3 ✔(no-control) ✔ (stop)
Bus stops Left turn presence on minor road 3 ✔ (stop, signalized)
Bus–taxi lane Sidewalk width on major road ✔ (stop) ✔ (signalized)
Sidewalk width on minor road ✔ (no-control)
Grade on major road section 4 ✔ (no-control) ✔ (stop, signalized)
Grade on minorroad section 4 ✔ (no-control, stop)
Road markings
Phasing of signals ✔ (signalized)
Sight distance
Pavement conditions
Presence of bike lanes/paths
Bus–taxi lane
1 Different Safety Performance Functions (SPFs) for each intersection category (no-control three-leg and four-leg intersections, stop-controlled three-leg and four-leg intersections, and signalized four-leg intersections), also considering different crash types (here not reported). 2 The SPF for intersections is unique, including different numbers of legs. 3 Differentiated in protected and permitted left/right-turn lane in the data collection by Canale et al. (2005) [74]. 4 Differentiated in steep and level grades in the data collection by Canale et al. (2005) [74].
Table 3. Example of results from an economic assessment conducted in a pilot application of the proposed design framework, with four sets of countermeasures.
Set A (Short-Term Measures)Set B (Short-Term Measures)Set C (Long-Term Measures)Set D (Long-Term Measures + Sustainable Mobility Infrastructures)
1. Installation of transverse rumble strips across lanes in approach at intersections
2. Installation of automatic speed control along segments
1. Replacement of the friction course
2. Improvement of both road markings and signs
3. Implementation of new pedestrian crossings
4. Installation of optical speed bars
5. Installation of pedestrian crosswalk countdowns
6. Installation of intersection flashing warning signs
7. Turning on traffic lights at night
8. Pruning vegetation and trees
1. Reconfiguration of the road section along all segments
2. Realization of a chicane at bus stops
3. Implementation of pedestrian crossings
4. Implementation of islands for pedestrians
5. Implementation of traffic islands
6. Installation of barriers along the sidewalks near the school
1. Implementation of 2 roundabouts in place of existing four-leg intersections
2. Implementation of a bi-directional bike lane
3. Converting pedestrian crossings into bike–pedestrian crossings
4. Replacing lighting systems with light-emitting diode (LED) lights
5. Remove trees from critical places
SetCombinationCosts (€)Benefits (€)NPV (Net Present Value)CBAIncremental CBA
A1ThirdFifthFifthSecondFourth
B2FourthFourthFourthSixthThird
A+B3Fifth (more expensive)First (more benefits)First1FifthFirst1
C4First (less expensive)SixthSixthFirst1Fifth
D5SecondThirdThirdFourthSecond
D 26SecondSecondSecondThirdSecond
1 The most convenient combination is highlighted in bold type. 2 Weak positive effect on safety for considering the implementation of bike paths. CBA: Cost–Benefit Analyses.
Table 4. Variables included in some European models retrieved in the literature for road segments and intersections, which consider both vehicular and cycling flows.
SegmentsIntersections
VariablesIncluded in Final Models as Retrieved in:VariablesIncluded in Final Models as Retrieved in:
[76] 1[77][55] 2
AllUnsignalized
Vehicle flowVehicle flow
Cycling flowCycling flow
Land useTwo-way/one-way cycle track ✔ **
Function of streetDistance between bike lane and carriageway ✔ **
VisibilityRed color and quality of markings for bicycle crossings ✔ **
Bike transit prohibition✔ *Dedicated VRU crossing ✔ **
Raised bicycle crossing or other speed reducing measures ✔ **
1 Jonsson (2005) [76] developed two models that take into account vehicular and cyclist flows: with and without preset parameters. 2 Schepers et al. (2011) [55] developed two models with vehicular and cyclist flows, depending on the priority (or not) for cyclists. * This variable is included only in the model with preset parameters. ** These variables are included only in the model considering the case of priority for cyclists.

