1. Introduction
A workplace’s physical environment is an important variable in determining how to make this workplace safe and protect the employees within that space. This is especially true for environments like railyards. Hazardous incidents, particularly slips, falls, trips, etc., may lead to severe injuries for the Employee on Duty (EoD). A prevalence of potentially hazardous conditions in a workplace thus obviously contributes to elevated risks to human lives. Therefore, identifying and mitigating these risks in workplaces through preventative measures is a key area of interest both in the industry and for academic research.
In this paper, we mainly focus on railroads, especially railyard worker safety and trespasser detection. The rail environment is a highly dynamic place due to constant movement of rolling stock, heavy freights, hi-rail vehicles, etc. In the United States, railroads have been one of the safest workplaces among all dynamic and complex large-scale workplace environments, including highway maintenance, shipyards, construction, subway workers, etc. All the aforementioned workplace environments are considered to be dynamic and complex due to a constantly changing environment, both spatially and temporally. The workplace environment may include vehicles, assets, heavy-object movement and exposure to weather conditions. Despite these challenges, the railroads, including all 7 ‘class I’ railroads, in conjunction with the Federal Railroad Administration (FRA), have implemented guidelines, specifications, employee training and efficient management for railyard worker safety. The comprehensive implementation of safety guidelines has shown reduced casualty rates during the period of 2010–2018. The trend, though it shows a diminishing number of casualties, due to this environment’s inherent dynamicity, complexity and large scale, there is a limit to how effective these guidelines can be in the effort to reduce casualties to zero and make railyards a safe work environment [
1,
2].
1.1. Background
The reported data obtained from FRA’s Office of Safety Analysis website shows that the casualty rates are lower in railyards compared to main or branch lines [
3,
4], but only by a small margin. While yards are geographically restricted, they nonetheless represent an environment with a disproportionately higher density of EoDs per geographical area. These railyard EoDs include engineers, conductors, brakemen, foremen, remote control train operators, etc. It has been shown that, in the period of 2011–2014, the casualty count in yards actually increased from 1099 to 1217.
Although railroads have dramatically improved the safety of their workers over the years, there have nonetheless been 16,047 recorded cases during 2011–2018, in which 26.3% of the incidents occurred in yards. In
Table 1, we show the casualty counts of yard workers associated with different roles over the most recent years.
In 2017, there were alarming numbers of casualties in yards, totalling 1127 cases. Obviously, this indicates that there is significant room for improvement. In addition, technology can play a vital role in that regard. Due to this significant number of casualties in yards, Union Pacific (UP), BNSF, CSX, and the other class I railroads have intensified their efforts in research and implementation of technologies to monitor safe practices for workers and ‘close-call’ incidents. Close-calls, or near-miss events, are ‘could-be’ events that could have led to serious injuries or asset damage but did not, fortunately [
5]. There are several differing opinions on how to classify a close-call event. Therefore, proper detection and reporting of incidents, increasing awareness to avoid incidents, and increasing training to help prevent near-miss events are key factors required to realize a safe work environment. In addition to safety management of EoDs of railroads, trespassing in yards also often results in casualties because they are unexpected and involve people unaware of the risks they are placing themselves in. In 49 CFR, section 225.12, personnel in yards include (i)
class A: EoDs, (ii)
class D: employees not on duty, contractors and volunteers, (iii)
class E: trespassers and non-trespassers [
6]. Therefore, safety of trespassers also is a key interest of railroads, in addition to preventing trespassers in the first place. Consequently, statistics show 2677 trespasser casualties in the period between 2015–2018, where 71.9% of the cases are due to getting struck by on-track equipment.
In
Table 1, we showed the different roles of railyard EoDs, and that some of them are more likely to be injured than others. When including trespassing in the consideration for addressing the challenges in safety-management, the complexity increases significantly. Hence, for ensuring safe yard operations, detection and tracking of every individual-both EoDs and trespassers—and evaluating their proximity to hazards is key to alerting them of the situation and de-escalating the situation at the same time. Hazardous situations in railyards can easily be fatal, and encompasses everything from falls, trips, stumbles and getting struck by large objects, the secondary health issues interfering with situational awareness. Falls, trips and stumbles can be related to the irregular surfaces in yards, such as ballasts, tracks or rail ties, or simply due to weather conditions such as rain, ice or snow. Between 2015 and 2018, almost 10% of reported cases occurred due to walking hazards where the EoD fell, slipped or stumbled. In the same period, an additional 8.3% of incidents happened due to trespassers falling, slipping or tripping. Thus, detecting the event and mitigating the risk for future incidents related to movement hazards play a vital part in making railyards safer.
1.2. Implementation of Technologies
Technology adaptation and implementation in yards falls under railroad safety law, as stated in 49 CFR Appendix D of Part 218,
Requirements and Considerations for Implementing Technology Aided Point Protection [
7]. Every action an employee takes before proceeding should be guaranteed by audio-visual technologies, but also be verified by another qualified employee before the action is taken. This leads to the conclusion that technology is seen as as an aid or last line of defense in this effort. Based on this concept, when considering protective technologies for railyard workers and trespassers, these technologies are integrated as an infrastructure aid to monitor worker safety and prevent trespasser related events.
Technology to aid workers can be wearable or infrastructure-based. Considering infrastructure-based solutions and integrating them in the railroad environment without creating obstructions to a worker’s freedom of movement is a key requirement, and a challenge that needs to be addressed—if a worker’s movement is restricted due to additional technologies that places them at increased risk of accidents, instead of helping to avoid them. This is precisely the focus of our research effort. It covers technology that can (i) prevent fatal events, (ii) monitor large-scale dynamic environments, (iii) record near-miss events, (iv) operate unobtrusively and not cause additional distractions to the workers, (v) is a stand-alone solution that addresses the challenges for both EoD and trespasser protection, and (vi) aids in implementing and adhering to safe practices.
Therefore, we have adopted Software-Defined RADAR as a detection methodology, chosen over other technologies because it provides better resolution and range, even under low-visibility working conditions. RADAR has been used extensively to detect and track objects of interest for decades now [
8,
9,
10]. Depending upon different properties impacting the electromagnetic wave utilized by the RADAR, a maximum range can always be setup. The band and waveforms allocated in radar principally target different detection goals. A narrower band is more targeted towards detecting objects located farther from the radar, but sacrifices detection of multiple targets that are close together as a consequence, due to the reduced resolution. A wideband configuration, on the other hand, can locate multiple objects close to each other but at reduced total range of the RADAR. Due to our objective to be able to detect multiple targets of varying sizes, at different ranges, and correlate that information to an indication of the potential for a collision, software defined radar is an ideal candidate for achieving these goals and detecting different types of hazards in railyards. Ideally, the expected range and size of the object to be detected using RADAR can be predetermined. Over the last few years, RADAR gained prominence in the automobile industry to detect neighboring cars or pedestrians, and is commonly incorporated into driver assist features. In most of these use cases, RADAR has been considered to detect an object of interest in motion at some given range or size. Beyond the predefined range or size, most of the objects remain invisible. Thus, the challenges in RADAR is mainly detecting and tracking differently sized objects at different ranges. Traditional RADAR utilizes a predetermined range and object size limit, and thus may not be able to detect smaller objects or objects farther away than anticipated. Therefore, we have used Software-Defined RADAR, instead, and defined the particular problem we utilize it for as determining the separation distance between large metallic objects such as locomotives and railcars, and the railroad personnel. In this context, we observe the scope of using SDRADAR in railyard environments. The SDRADAR should be configurable to enable the localization and tracking of differently sized objects over variable range limits, effectively enabling a dynamic adjustment driven by the trade-off between object size and detection range. In this paper, we also evaluated important aspects such as effectiveness in tracking temporarily hidden objects, resolving blind spots, etc. This is vital to addressing the need for reliable detection of near-misses, particularly those that other visual systems such as cameras cannot cope with.
2. Problem and Challenges
The generic problem of personnel safety in railyards depends upon determining when a person is close to or approaching a hazard. A technological approach to solving this has to be the last line of defense to protect a worker from a hazardous scenario. Worker protection in a work environment can be much more effectively improved through best practices, rules, regulation, and training. However, if everything else fails, technology should be there to protect the worker from potentially life-threatening accidents. If a worker fails to detect an oncoming threat, most of the time the event may occur due to, (i) blind spot and/or (ii) temporary unintentional distraction. Blind spots are the locations that are hidden from a worker’s line of sight. Due to constant movement of large objects and dynamically placed stacked objects around the yard, there is a high probability of dynamic blind spots around the person. Therefore, an inattentive worker may get hit by a moving object or even face a fall, trip or slip hazard due to not properly identifying the hazard.
Blind spots are defined from the point of view of a worker and describes the area within which they cannot see an object. Any object that is within that area is thus hidden from their view and known as a ‘hidden object’. This also applies to any detection technology involved. Thus, the key to safety of workers is eliminating blind spots, and supporting uninterrupted tracking of objects. Failure to do so can prove to be fatal for the worker or a trespasser, and detrimental for the confidence in the technology itself.
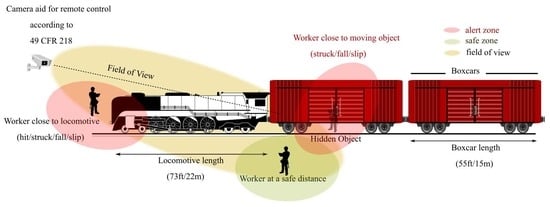
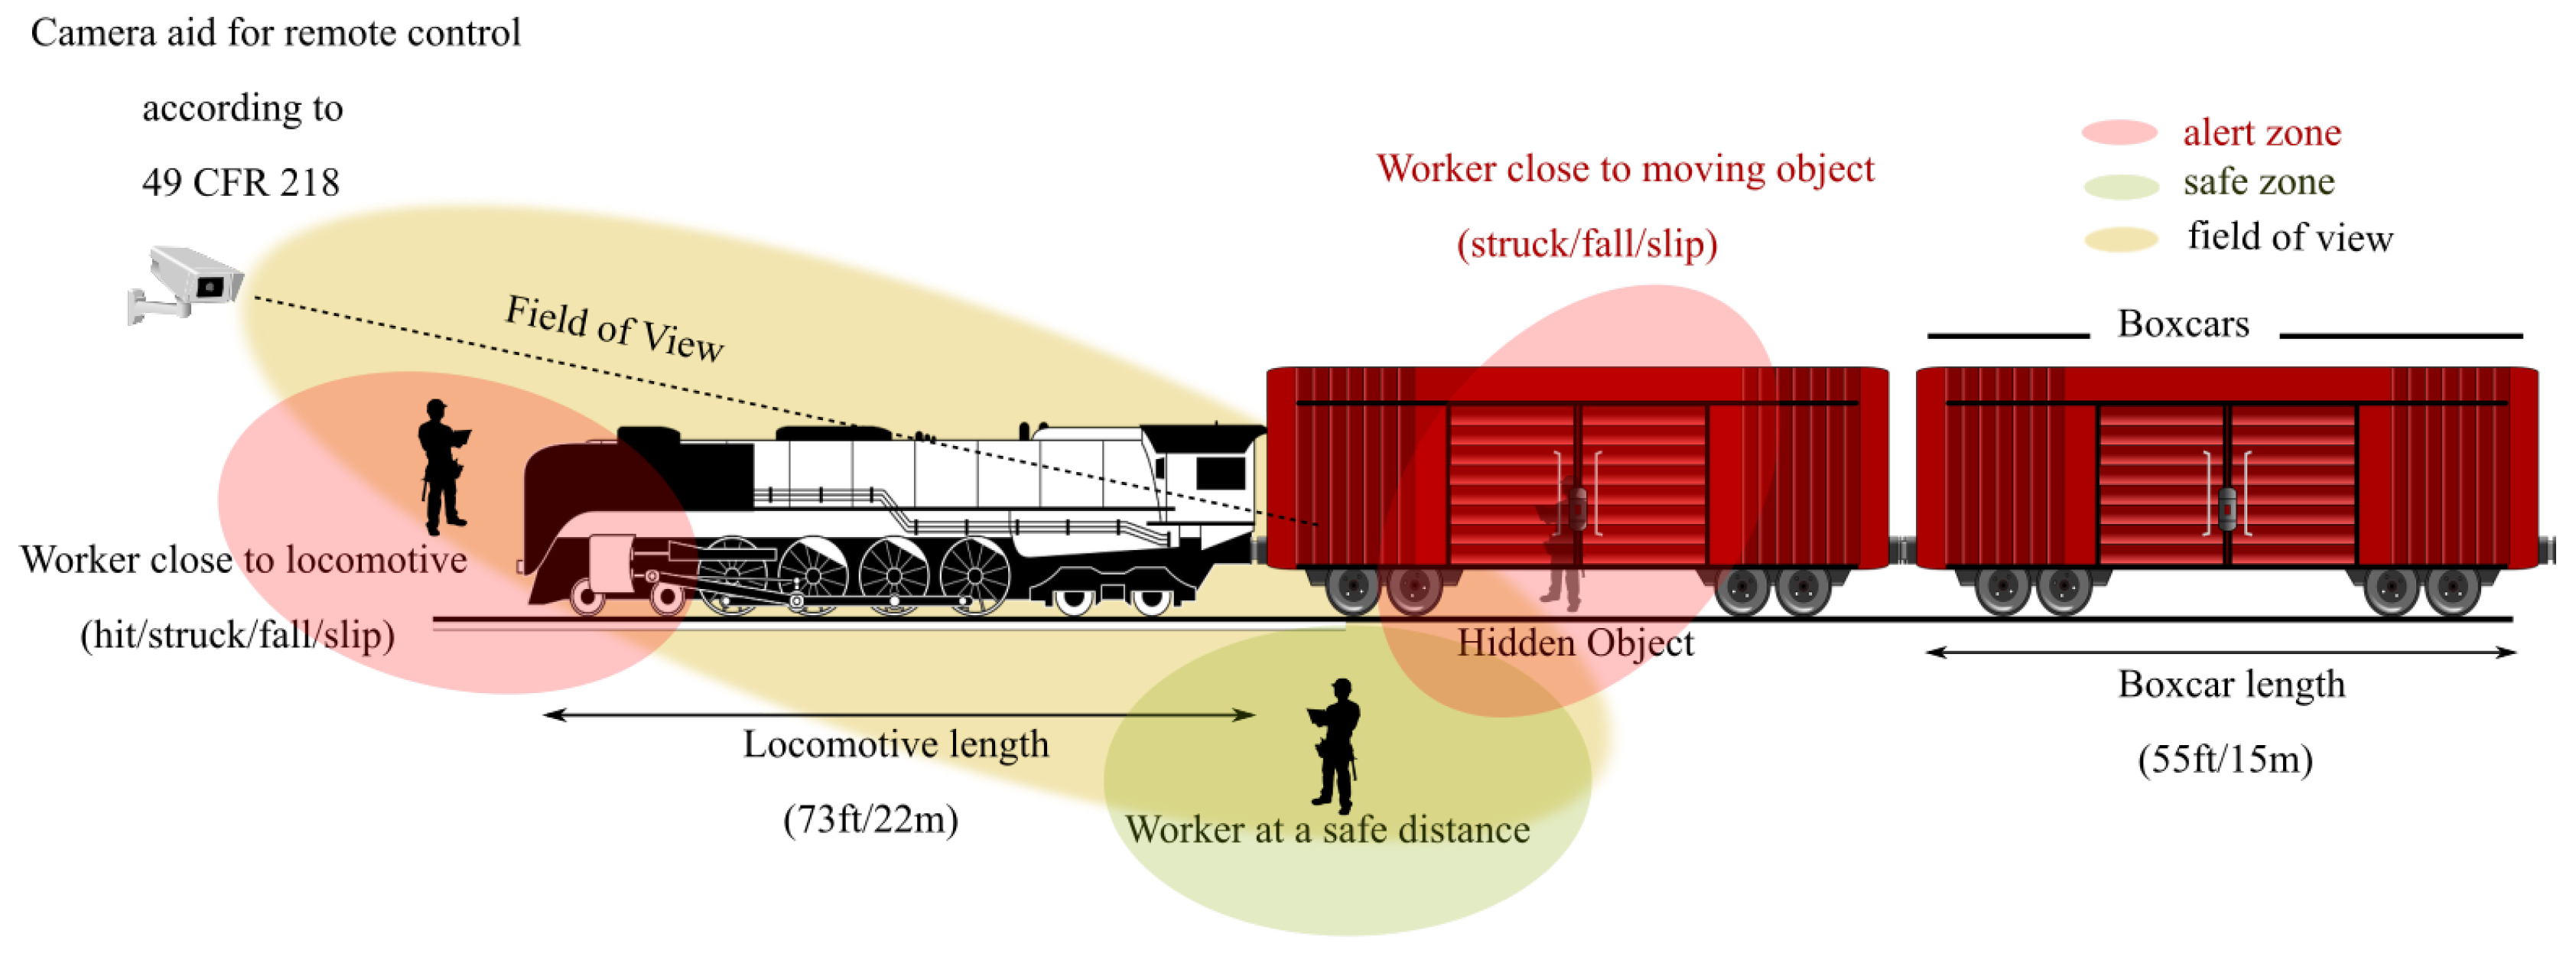
Figure 1 shows how conventional image-based sensors fail to properly identify potentially hazardous scenarios. In the figure, there are two zones primarily illustrated where a red or alert zone depicts that a worker is dangerously close to the hazard, rolling stock or railcar, where a green or safe zone depict that a worker is at a safe distance. A fish-eye camera comfortably can detect alert or safe zone incidents given that there are no blind spots in its FOV (yellow) region or low-visibility issues. Blind spots or hidden objects issue may happen due to a large object obstructing line-of-sight of the camera. In
Figure 1, the worker is hidden from the camera’s LoS and clearly in alert zone leading to a possible accidental situation.
Our extensive study we published in [
1,
11] determined the underlying principal challenges, which are previously discussed to implemented sensor technologies in the railroad environment. In this regard, Addabbo et al. in [
12] have addressed several issues regarding the use of multisensor-based RADAR for a level-crossing detection system. In their work, they proposed the integration of Safety Integrity Level (SIL) inclusion software, false-positives and under-threshold object detection. Our research on software-defined radar integration in yard environments addresses the issues raised by the authors in [
12] along with the previously identified environmental and research challenges in the US railyards. In conclusion, the challenge faced is the reliable and continuous detection and localization of personnel and rail vehicles, and classifying them in real-time.
2.1. Limitation of Vision-Based Sensors
Vision-based sensors, i.e., regular cameras, stereo vision cameras, laser range finders, etc. are widely used nowadays in US railyards for monitoring the yard and alerting authorities about potential intruders or trespassers [
2,
13,
14]. The sensors not only can be installed at some high vantage points but also on Unmanned Aerial Vehicles (UAV) [
15,
16]. The use of UAVs was considered by some railroads for enforcing safe practices in yards [
16]. However, they also exhibit limitations, primarily due to their sensors and the battery. The battery affects the flight time, thus leading to fleets of UAV in the yard workspace. Though UAVs can be deployed for somewhat unobtrusive monitoring of safe-practices in yards, they prove to be an additional distraction for the workers as well [
16]. UAVs tend to carry fish-eye cameras, range sensors, and high resolution cameras for collection of data. Since they would operate outdoors, they would also adversely be affected by wind, rain, fog and snow. Weather conditions can severely degrade vision-based sensor data. However, vision-based sensors can provide abundant information while monitoring a large area. The data from any such camera feed should be transmitted for real-time monitoring and stored for future analysis.
Cameras in yards are crucial to monitor switching and coupling operations. In
Figure 1, the reference of remote control operation for switching and coupling has been shown. A Remote Control Operator (RCO) is responsible for switching and coupling railcars in yards. To do this, the RCOs have to be close to the railcars and control the locomotive in sync with their own actions [
17,
18]. However, this also places them in close proximity to moving trains. Therefore, in order to improve the safety of the RCOs, protective devices should be installed in yards. It has been clearly mentioned how remote control zone or remote control operation should be maintained in 218.99(b)(3)(i). If any action is not safe or not confirmed as safe, there should be an immediate halt on all EoD action. Therefore, vision-based sensors should provide real-time information and visual confirmation to the remote personnel about failure or success of detection, classification, and tracking of the current action of the EoDs on site. The process should not hinder line-of-sight of the remote EoD or encumber them in any way.
2.2. Experimental Study with Vision-Based Sensors
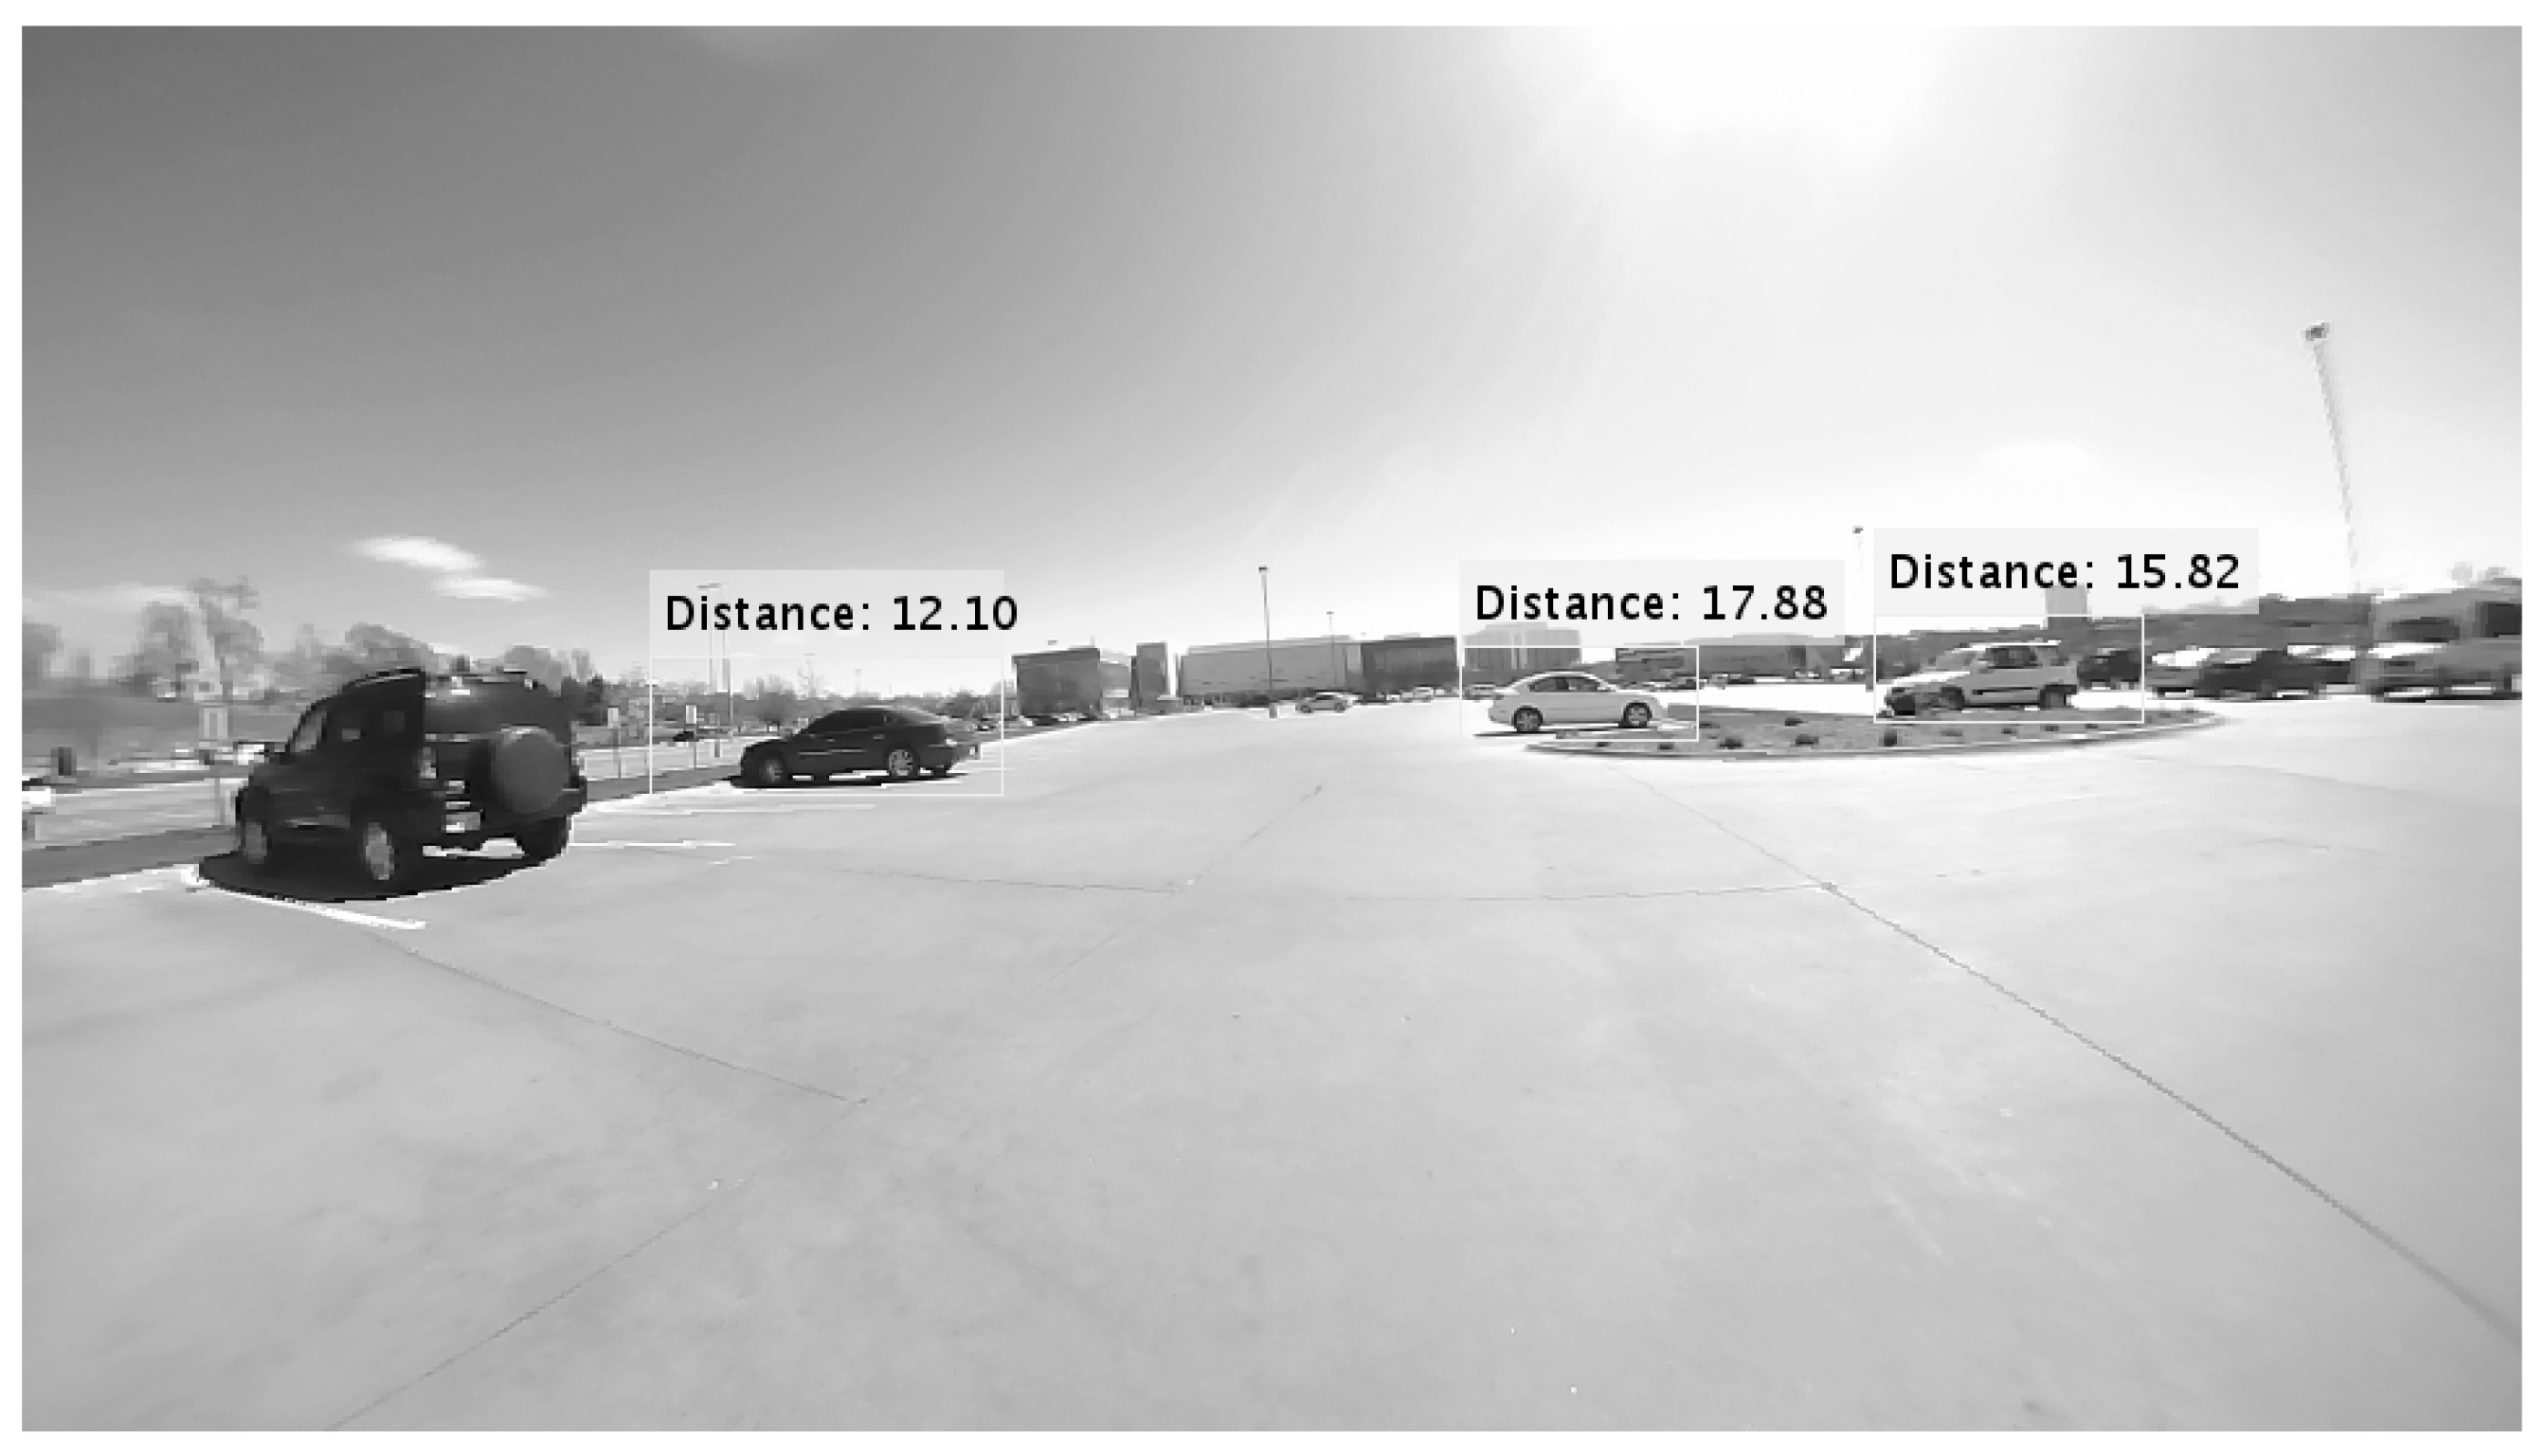
Our experimentation with vision-based sensors was conducted to explore wide-angle observations for monitoring remote control operators. To provide a wide-angle view of the EoD’s sphere of operation—the worker’s immediate surroundings—we have used fish-eye cameras with a 170 horizontal field of view. The raw images collected from the fish-eye camera first have been rectified, and were subsequently used in a detection algorithm to detect moving objects, i.e., cars, pedestrians, rolling stocks, etc. The algorithm also detects the approximate distance of the object from the camera based on apparent size and classified object type. In order to address the shortcoming of this approach under low-visibility conditions, we also explored a multi-sensor approach that utilizes the fish-eye camera in combination with other sensors to alleviate the impact of low-visibility conditions. One such solution involves the use of a microphone array for sound-based localization and classification that augments the visual identification system to detect large moving objects present in the operating zone.
2.2.1. Algorithm Design
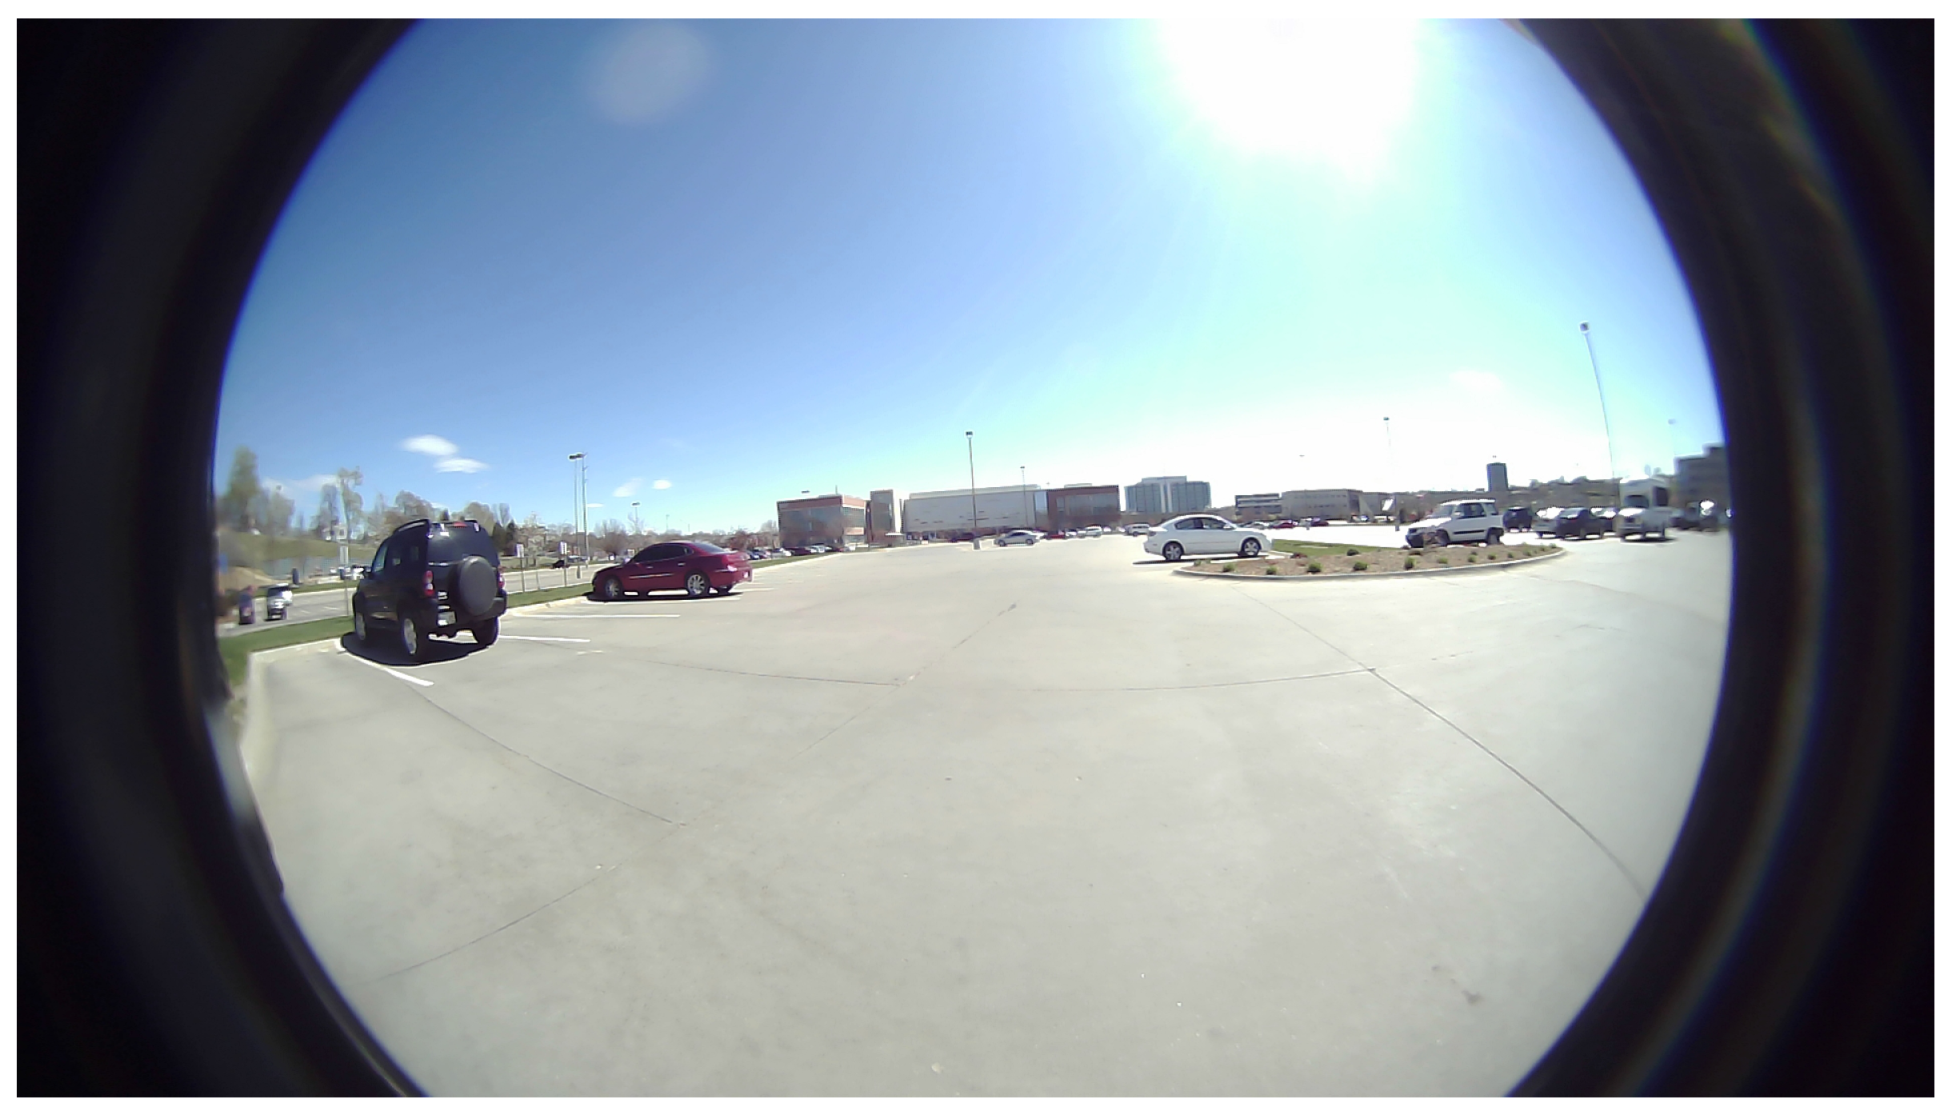
The preprocessing algorithms we employ are designed to provision images that are then processed by the image classification algorithms. In yards, fish-eye cameras are traditionally used for monitoring wider area. Fish-eye cameras provide raw spherical wide-angle images, which most often do not guarantee reliable detection or classification of objects as shown in
Table 2. Therefore, in order to enhance the reliability of detection, we preprocess these images to transform them from fish-eye images to de-warped images through a fast spherical-to-rectilinear transformation. The image processing has to be fast and should not encompass additional processing latency between the raw spherical image stream and processed rectilinear stream. Conventional algorithms are mostly focused on pixel-to-pixel transformation and are targeted towards delay-tolerant services [
19]. However, for the purposes of detecting and preventing near-fatal incidents, the processing required is very time-critical. There should not be a significant amount of delay accumulated by any of the interim processing stages. Our algorithms targets fast spherical to rectilinear transformation. We have used matrix transformation to tune image processing so that, during the transformation, there is significantly less information loss.
The supported video streams are shown in
Table 3, where the sensor can be configured from as low as 240p to up to 1080p video resolution. Our algorithm, as shown in Algorithm 1, shows that vectorization and interpolation of the image matrix can enable faster processing speeds compared to accessing each pixel one at a time. In the algorithm, there are multiple interpolation algorithms chosen for detection of large moving or static objects, i.e., cars. Due to input being a spherical wide-angle image, better interpolation and geometrical conversion from spherical to rectangular coordinates provide more information for the detection algorithms to work with. The conversion follows the spherical to rectangular transformation as shown in Equation (
1).
Algorithm 1 uses and based on different tests that were conducted by our team. The values are used in the algorithms so that the classification method determines the maximum number of target objects from resulting images. Therefore, the goal is to find the trade-off between information loss and correct classification. Another related challenge is the lack of pixels at the edges of the spherical fish-eye image. Therefore, transforming the raw image would discard more pixel information during pixel-to-pixel transformation at the edges. We have therefore used the matrix interpolation method for fast-interpolation at the edges where pixel-density is lacking. The interpolation methods are spline, linear, cubic, nearest and modified akima. The transformation and interpolation can be done on both grayscale and Red, Green and Blue (RGB) images.
| Algorithm 1: Hardware-optimized algorithm for real-time image processing |
input: A fish-eye image of size or if grayscale and initial values of and ;
output: A rectilinear image of size or if grayscale;
;
;
Calculate from Equation (1);
;
;
Calculate from Equation (1);
;
;
J = interpolate(inputimage, , , interpolationmethod);
;
; |
Algorithm 1 starts with defining two matrices of
and
, which are of size
for grayscale images. For image classification, we will primarily use grayscale images of different resolutions, as shown in
Table 3. In a subsequent stage, the algorithm processes
, resulting in transformed matrices
and
. Each coordinate is transformed into a linear coordinate to form coordinate matrices
and
. At the conclusion of this process, we can run the interpolation algorithms to provide appropriate pixel information at each coordinate. We have used interpolation to generate higher-quality images rather than replacing pixel information from fish-eye image within the processed image. This led us to closely monitoring and tuning our images for better classification. The values of
and
are chosen to be 3 and
, respectively. The values are found through rigorous autonomous calibration. For fish-eye image calibration, we provide three test cases to the algorithm. In each of these test cases, the number of objects to be detected are known. The calibration algorithm simply starts from a given value of
and
. After that, it constantly increases or decreases the values of
and
by
until it finds the maximum number of objects present in the environment. During the process, it also determines the best interpolation method for a given value of
and
. The best values are stored and experimented with. We also dynamically change camera resolution to better optimize power consumption. For a test case where only cars are present, the resolution can be dropped to as low as 320p–480p. Our algorithm only processes high resolution video streams when an EoD is present with some degree of motion detected for the other objects. This significantly reduces the processing burdens as well as power consumption:
2.2.2. Performance of the Proposed Algorithm
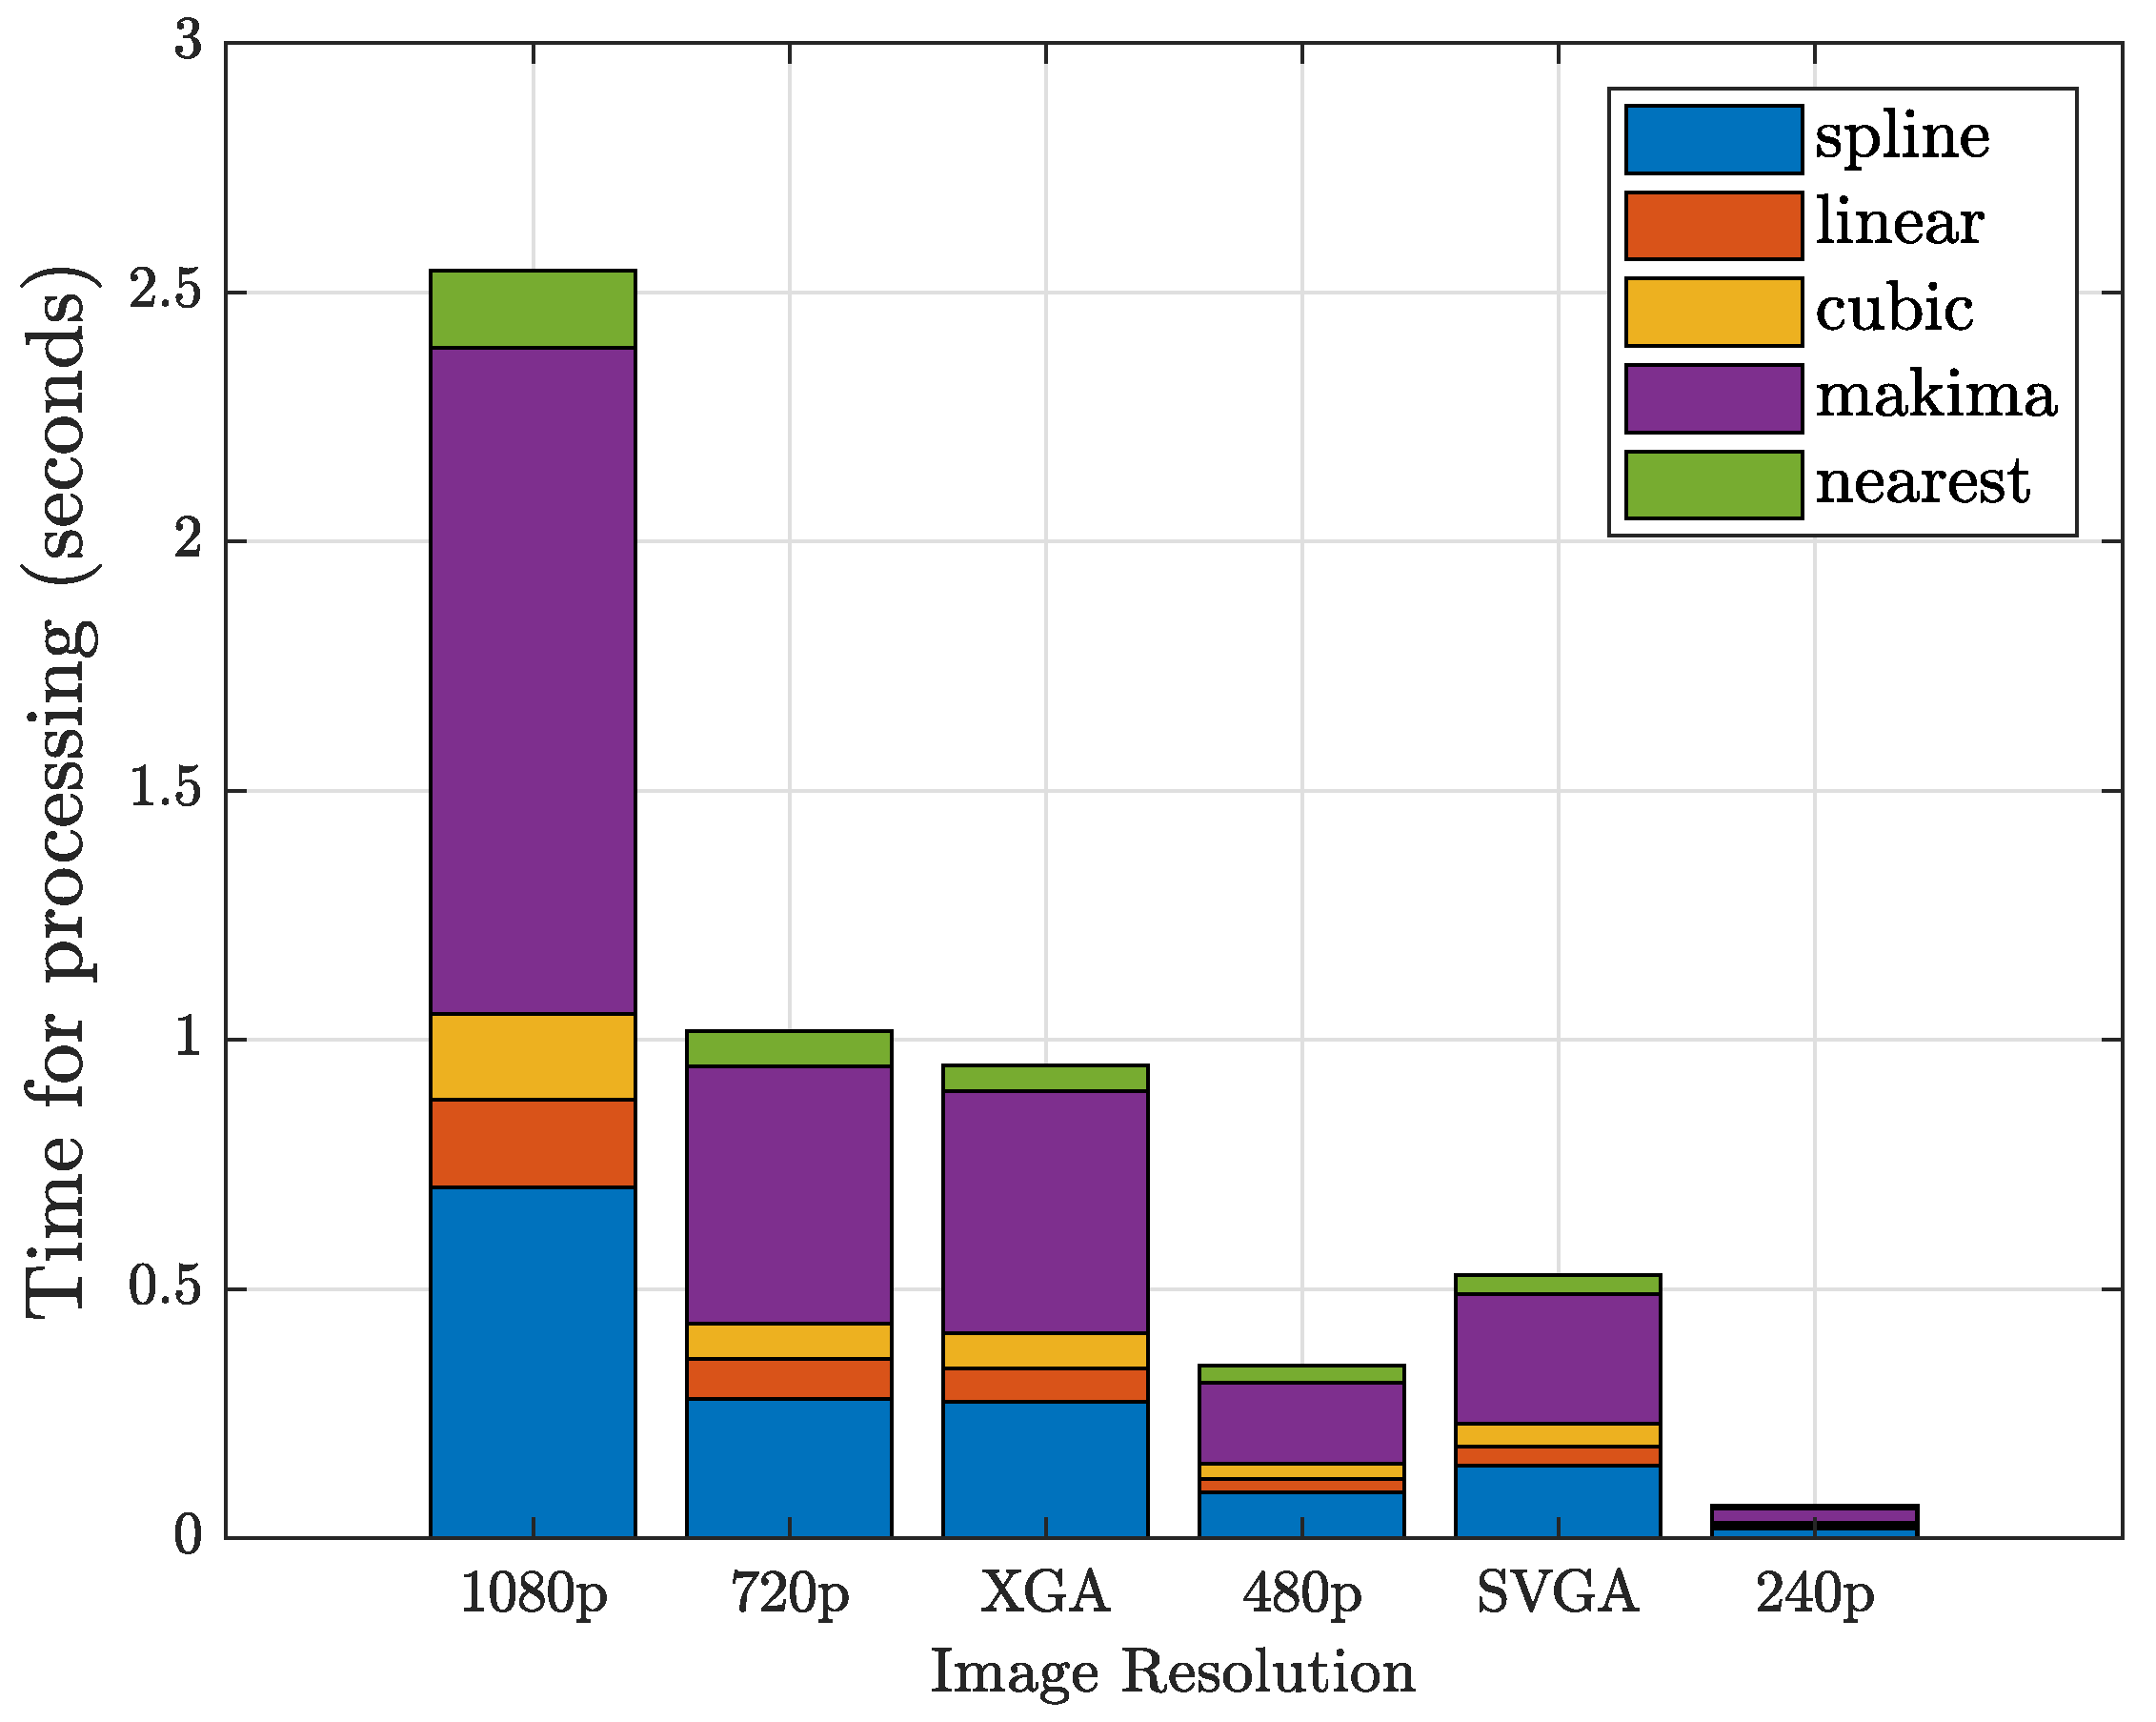
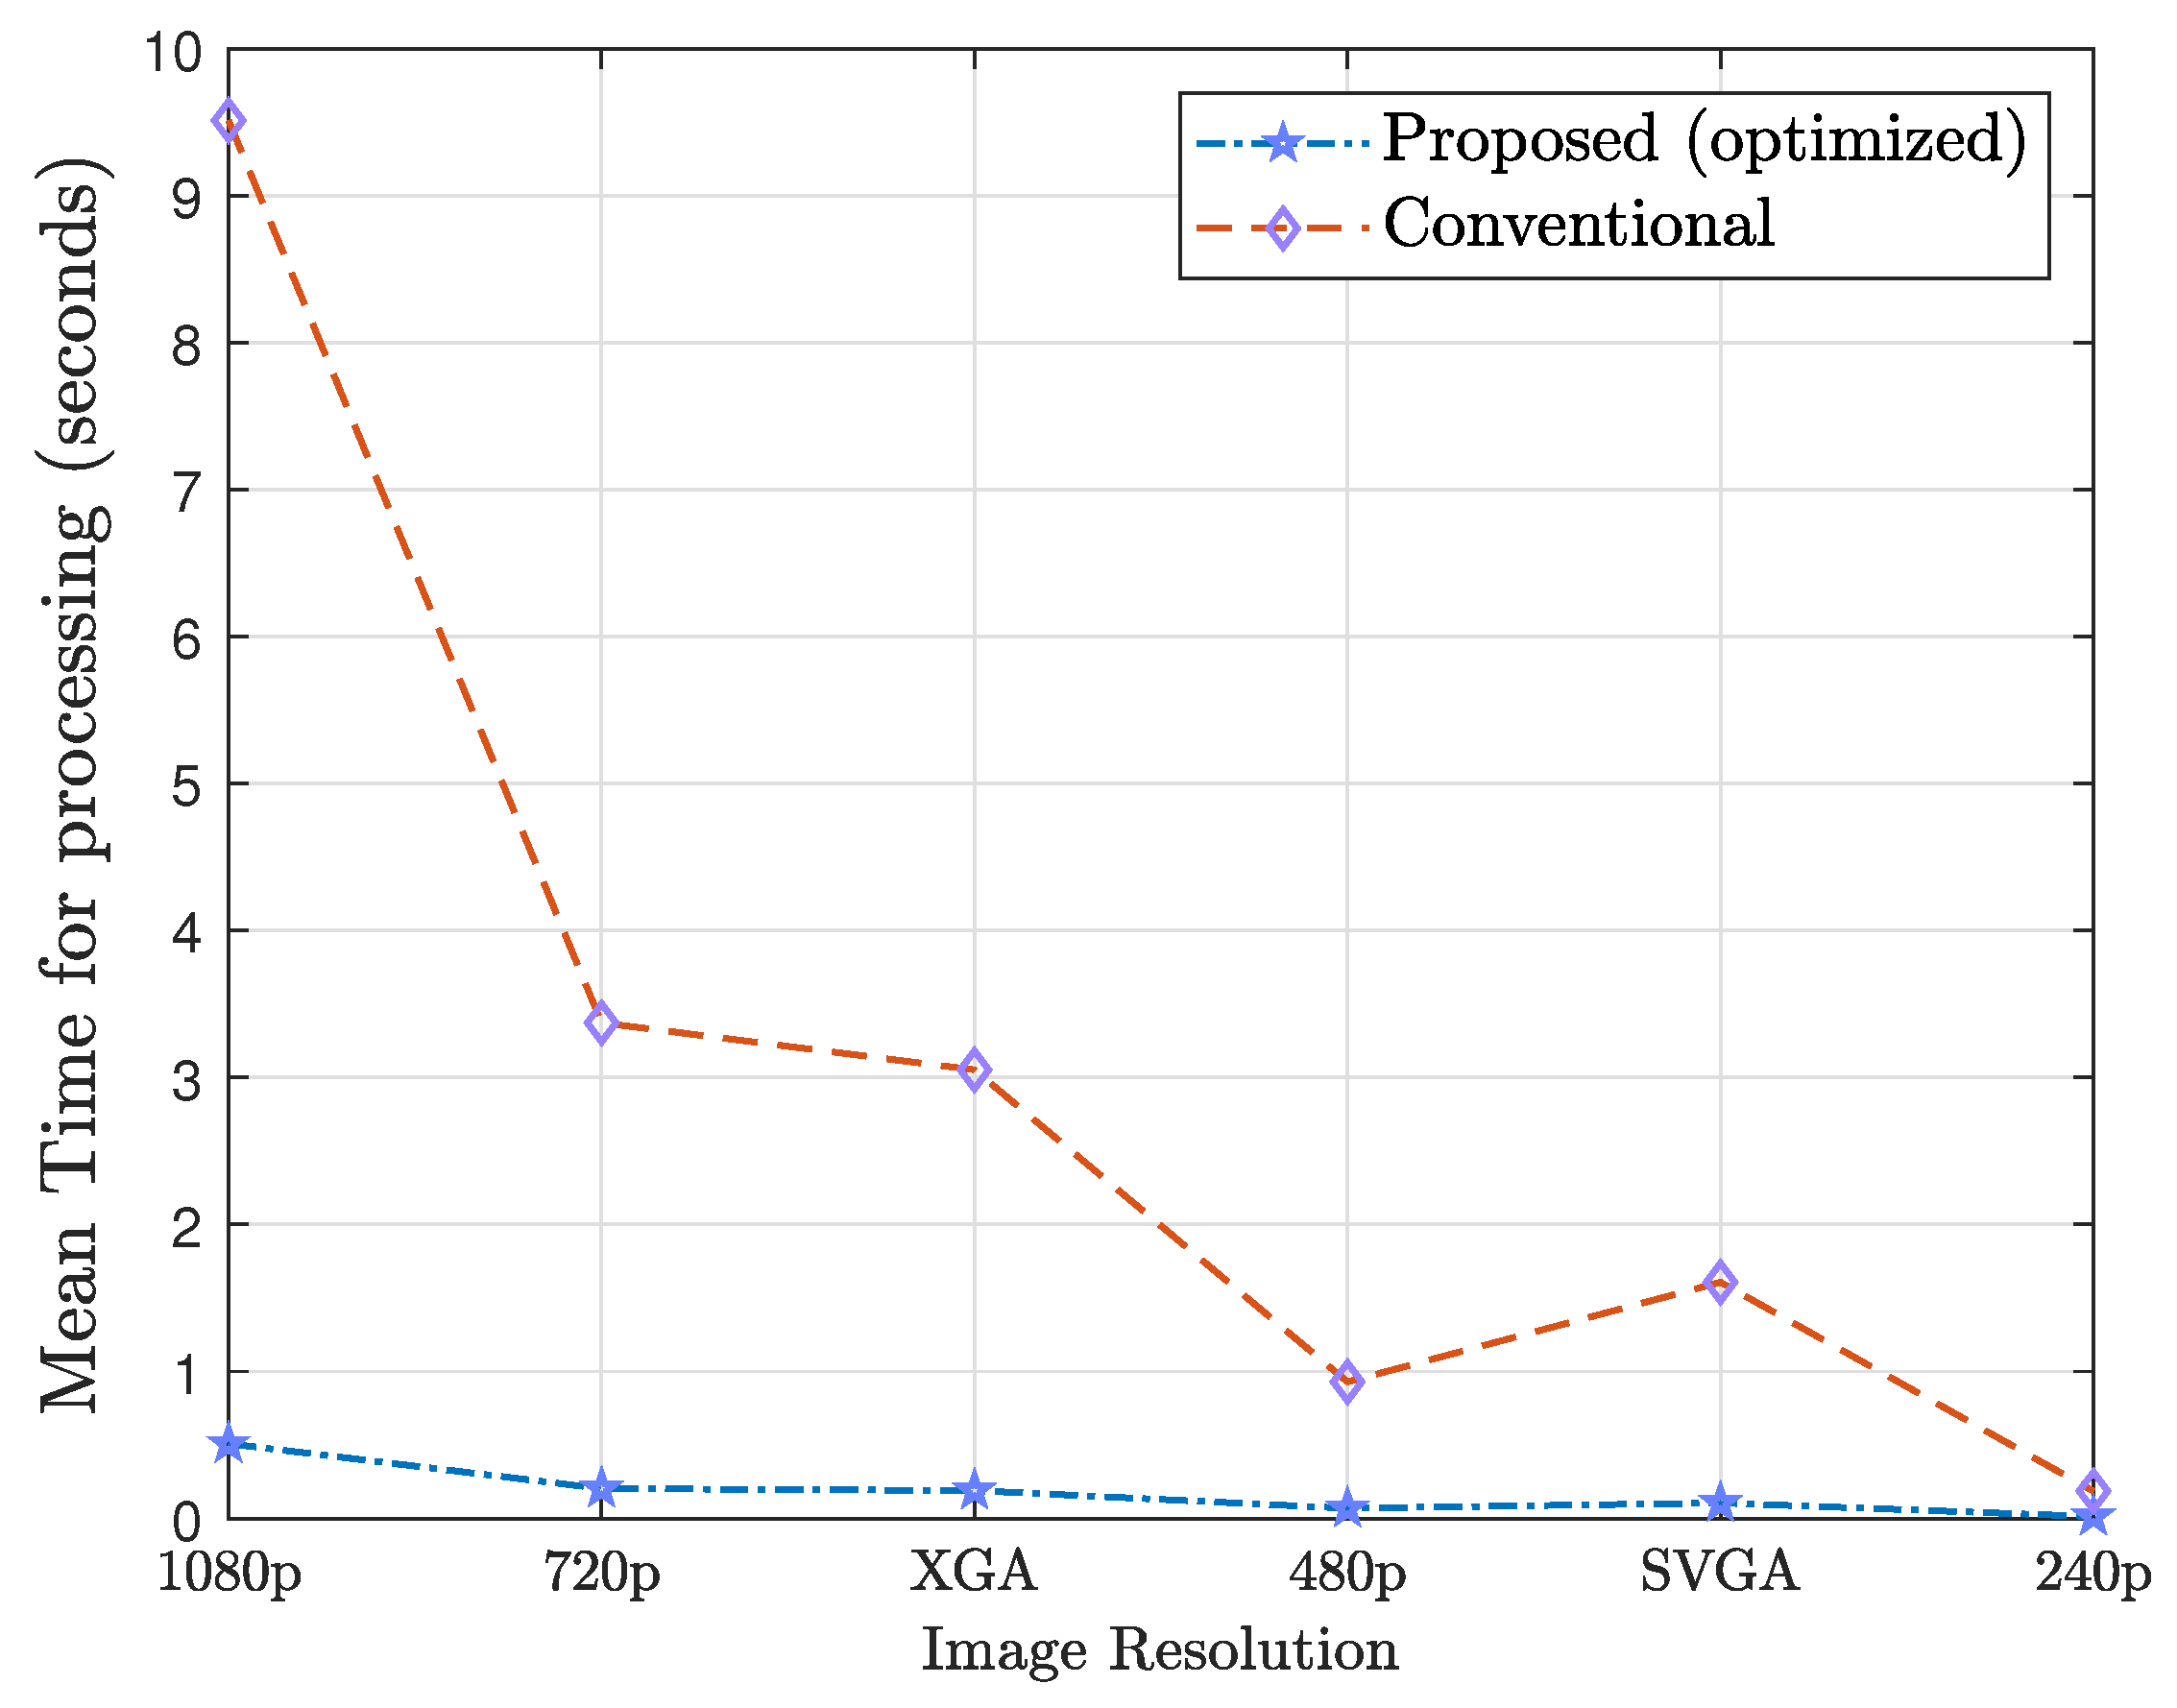
In Algorithm 1, we have shown calibration based on classification, fast spherical to rectilinear transformation and finally interpolation. The methodology described in this context is unique in its application for railroad environments. As we observe, our algorithm with cubic, linear or nearest interpolation methods performs comparatively faster in different resolution image stream. The algorithm is run on an i5-2400 with processing speed of 3.1 GHz. The highest processing delay we observe in our algorithm is with 1080p images, which is 0.5 s. Without vectorization, the delay for the same process is almost 10 s. However, conventional methods do not consider interpolation during the pixel-to-pixel mapping. In traditional or conventional processes, the calibration process also takes longer and does not perform at the same level even for similar values of and .
Therefore, through this algorithm, we suggest adopting a flexible mode of image processing by selecting resolution and calibration. Based on our test cases, we have found that 60–70% of the time we don’t require our camera to output at HD resolution in order to reliable detect objects. Even if the camera may be set to capture 720p or 1080p images, our multi-sensor approach can direct processing to focus on a specific subsection of the image for classification. For example, if we use sound localization or ultrasonic detectors to detect an EoD in the environment at 60
angle, we can extract only 0–60
or 60–90
portion of the image and process with our algorithms. If we use ensemble processing time to calculate the frame rate of the images with our algorithm, we can easily find that, from one 1080p image, we can have six partitions of 240p images. Therefore, we can significantly improve real-time performance of image classification. The average latency thus is reduced to multiples of 0.0132 s in our test setup, as shown in
Table 3 and
Figure 2 and
Figure 3. For multiple objects, we can remove the partitions where no object is present to remove additional burden on processing. For example, in
Figure 4,
Figure 5 and
Figure 6, there are no cars or objects in the middle. Each of these sequential steps provide us the opportunity to optimize delay, processing time without compromising classification.
Figure 2 shows different processing time for different interpolation methods. For each partitioned or full image, the calibrated values of
and
with interpolation method are found. These values are used for real-time processing of the images that can vary in size from 240p to 480p.
Although we could further optimize image processing to achieve higher frame rates or enable higher resolutions, this does not give these algorithms the ability to address line-of-sight obstructions and blind spots, nor does it enable enhanced visibility under adverse weather conditions. However, a more suitable approach, as used in our own work and shown in
Figure 1, is to utilize a multi-sensory detection methodology that uses different sensor technologies to mutually augment each other [
20,
21,
22]. With this approach, we can develop solutions that allow pin-point source localization of any hazards to EoDs, falls or trips, overcome limits from low-visibility or noisy environments, and much more. From
Table 2, and our own work published in [
11], we can observe that cameras augmented with RADARs are a better overall solution than working with other sensors. The idea of full integration of camera and RADAR systems originates from the automotive industry for adaptive driver assistance system (ADAS), and is also leveraged in autonomous driving systems. However, fixed radar solutions have limited adaptability to varying requirements, and so we instead opted to utilize a new technology: Software-Defined RADAR. Built upon the same principles as Software-defined RADARs, these systems shun fixed-function implementations in favor of full software-controlled functionality for the radio wave subsystem built upon capable processing platforms, which allows the system to change its functionality on the fly, and also can adapt entirely new functionality through software upgrades. According to the best of our knowledge, this work is the first time that Software Defined-RADAR is used in conjunction with fish-eye cameras in complex environments like railyards to detect rolling stock and personnel.
3. Reinforcement Learning Methodology for Utilizing Multi-Sensors
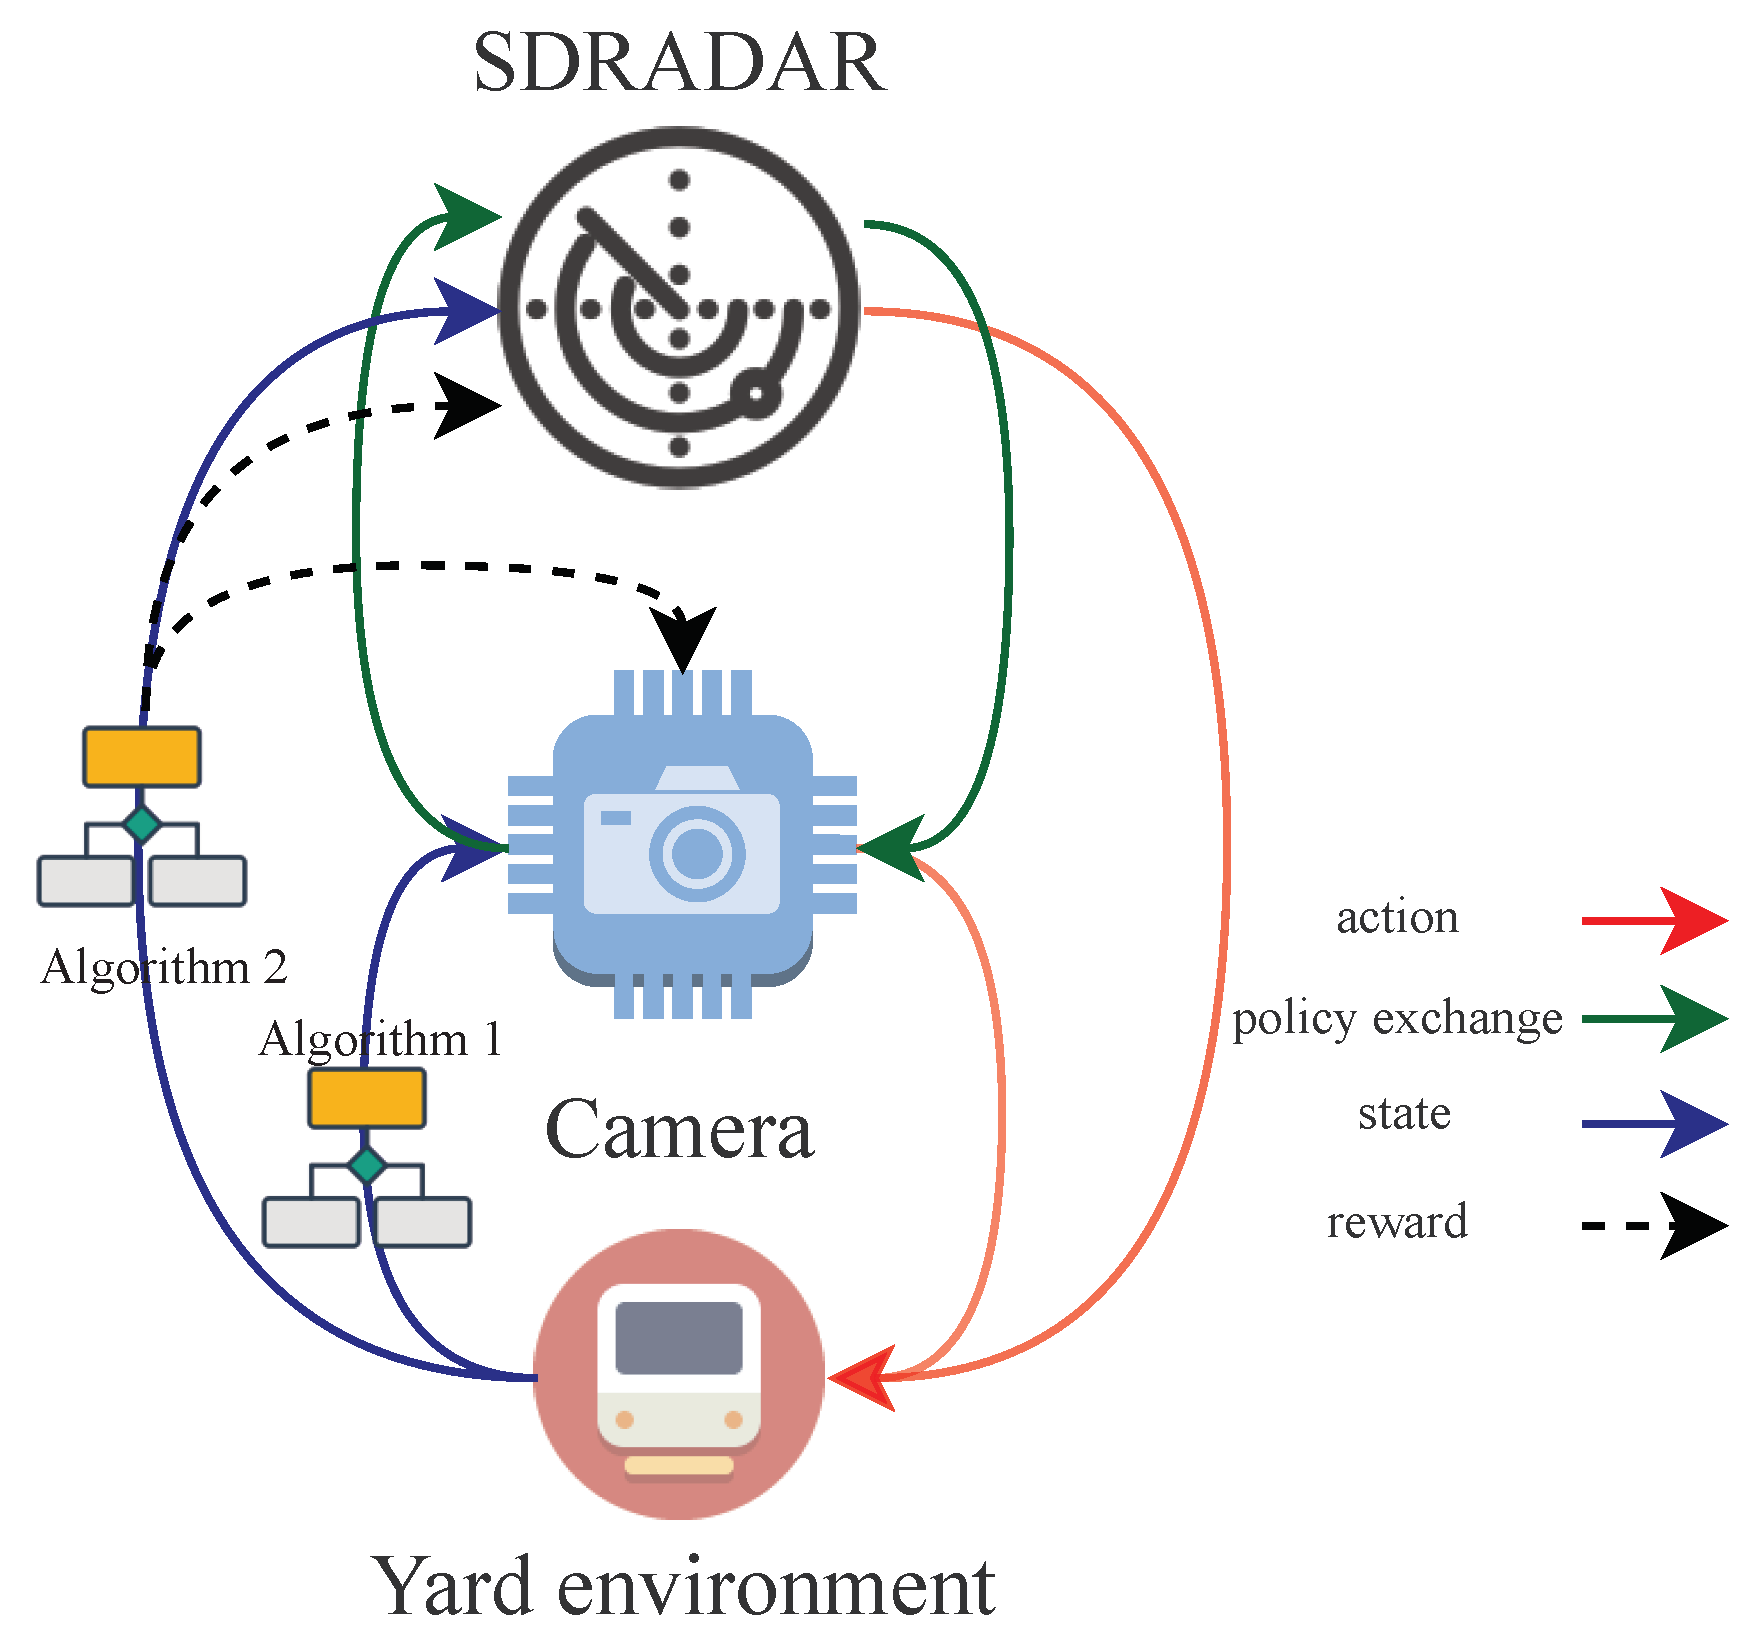
As we discuss later the process of using software-defined RADAR system, we illustrate the binding methodology for different sensors. In our multi-sensor model, software defined radar acts as a primary sensor, where it learns from the yard environment to detect and track EoD quickly and accurately. In our previous section, we have shown how vision-based sensors can be used as a standalone or secondary sensor to alleviate the risk of false-positive while detecting railyard personnel. Therefore, calibrating the secondary sensor based on the information collected by the primary sensor is shown here as reinforcement learning. In
Figure 7, it is illustrated that information collected from primary sensors can be used to better the result of secondary sensor, which in turn provide advantages such as exact intervals when the clutter information to be collected. The clutter information is a knowledge unwanted returns collected from the environment while collecting target returns. Clutter information can be collected during regular time intervals or when there is significant environmental changes. A secondary sensor can easily provide sudden temporal or spatial change in the environment. During the fusion of primary and secondary sensors, we have used policies and different states to accomplish accurate detection and tracking while optimizing primary and secondary sensor performance in terms of power consumption and real-time latency in EoD detection. In this section, we first discuss how the information flow is handled between algorithms and how there are are actions associated with primary and secondary sensors during different states.
The primary sensor being SDRADAR, the states it can attain is always power on mode, whereas the camera can operate both power on and low power modes. During low power modes or states, the actions of the camera are (1) observe the environment for movement, (2) detect EoD and heavy rolling object/locomotive, (3) change resolution based on the number of activity, (4) receive feedback from RADAR to decide on re-calibration, and (5) trigger RADAR for clutter information collection.
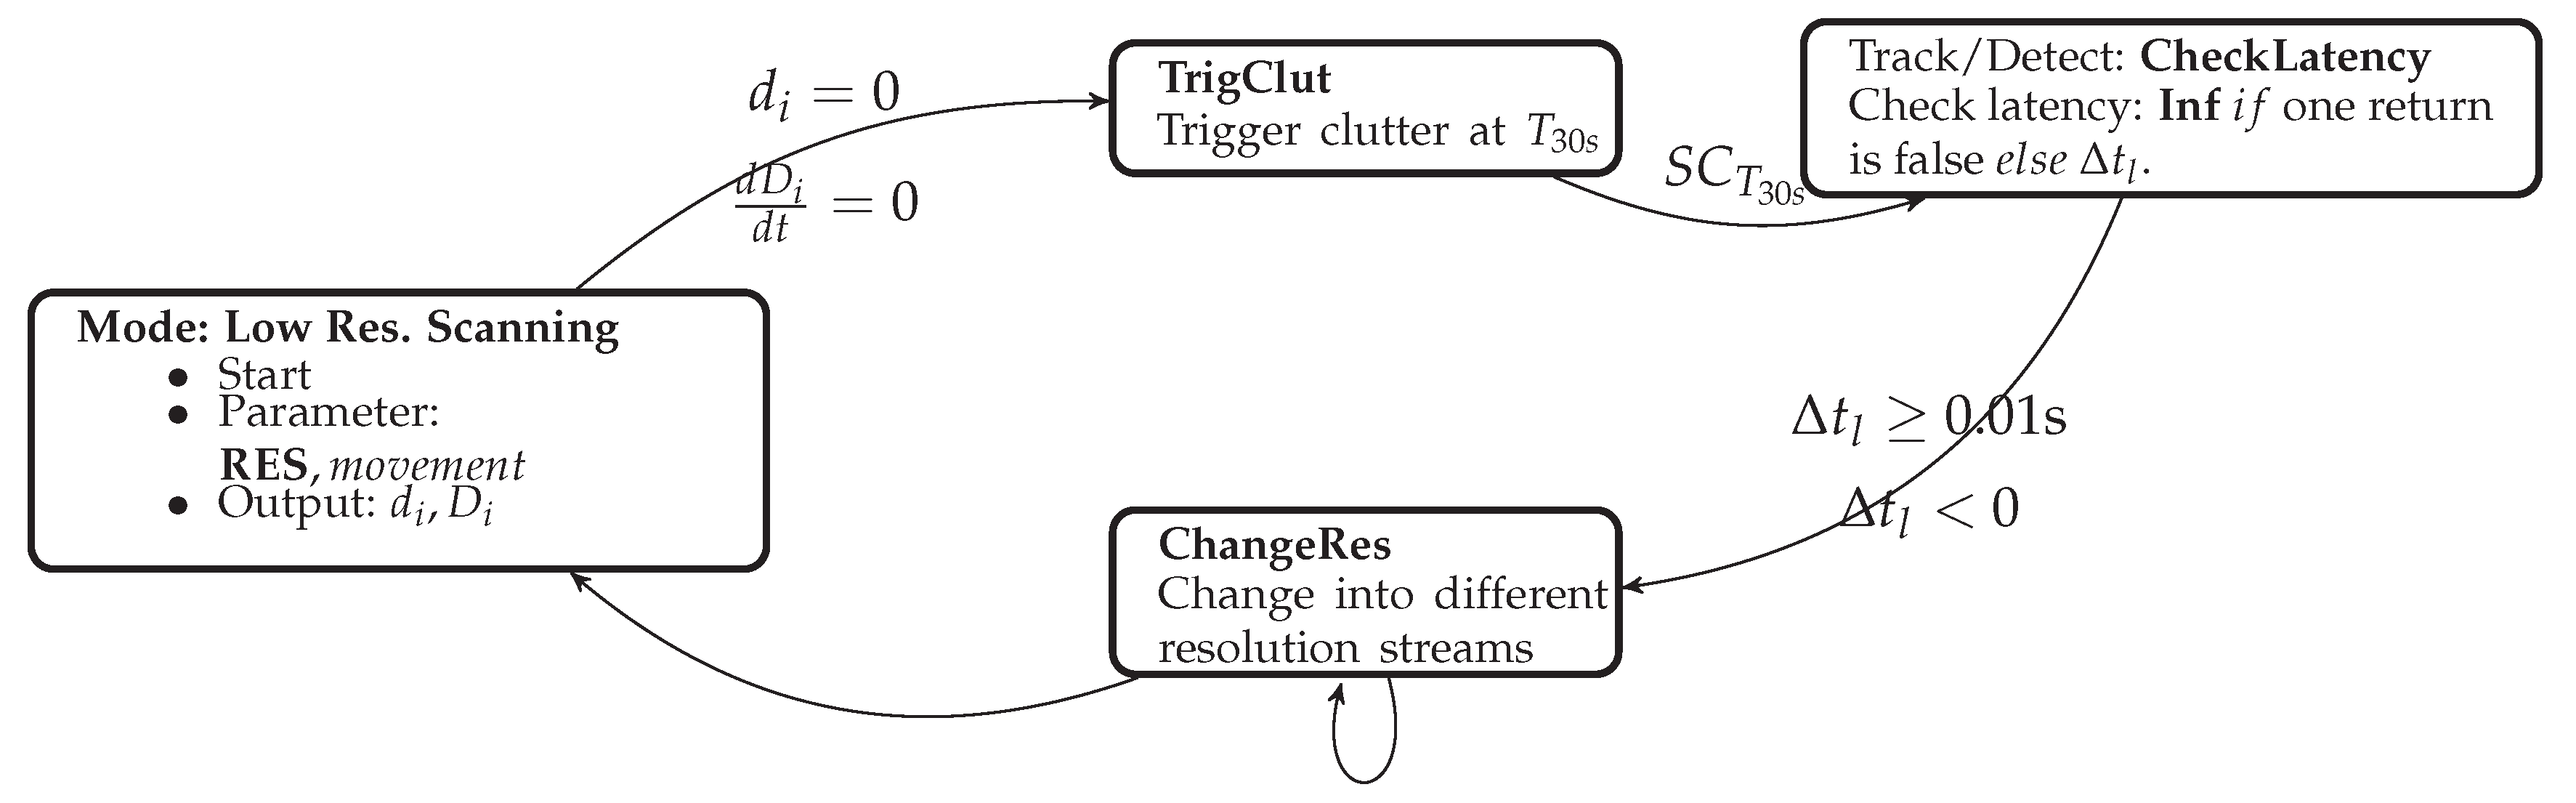
Figure 7 suggests the reward from the yard environment to be collected by the sensors. Most of the time, in our algorithm, the reward is zero. However, the positive reward is fed to the sensors when the latency deviation between RADAR and camera detection of EoD in a scene is less than
ms during each action defined before. Therefore, we define the camera resolution and trigger clutter data collection in 30 s intervals as shown in
Figure 8. In
Figure 8,
is the distance of EoD from the camera and
is the locomotive, rolling stocks, etc. In the state flow diagram,
is scene or clutter information to be collected at
or 30 s intervals. The check latency state would compare between time to detect EoDs in different sensors. If the value is negative, there is no EoD found. If one camera provides a negative and another positive value, the camera will change resolution until it finds the EoD in its point of view (POV). If the camera fails to detect the EoD in POV, the detection and tracking will still work with primary sensor or SDRADAR data. However, if the latency is greater than 0.01 s, the camera will also change to lower resolution to find EoD in POV. Based on the latency values, the resolution can be changed as shown in the state flow diagram and this camera algorithm acquires the required flexibility. It also articulates the reinforcement learning through reward and maintaining states of operation.
4. Software-Defined Radar (SDRADAR)
SDRADAR is a software-driven RADAR system that combines the advantages of a RADAR system with the flexibility and programmability afforded by software-defined radio platforms.
Table 2 shows that a radar system can be advantageous in work-environments where visibility suffers from environmental or low-light conditions. RADAR is also useful in multi-object tracking and in blindly identifying different-sized objects. For example, in yards where trespassers, EoD, or small vehicles should be identified and tracked real-time with high fidelity. A radar can easily identify a railyard employee against a large rolling stock without intensive signal processing. However, image processing and classification impose additional latency and computational burden on the system leading to additional power consumption. Traditional RADAR is designed to serve a particular purpose but is limited to specific scenarios and environments. In particular, RADAR systems have predefined radio parameters (bandwidth, modulation, waveform) that are practically immutable post-deployment. A radar designed to detect cars may completely miss small objects such as pedestrians in front of the car.
Though RADARs have been used widely in detecting targets, there is a shift towards SDRADARs occurring because of the dramatically increased flexibility in dynamically and intelligently adapting the radar to the application requirements and changes in the observation area. Software-Defined RADAR, unlike conventional radar, provides the opportunity of using different modulation schemes, coding, bandwidth, or sampling rate and adjust these in real-time, driven entirely by software [
23]. One of the main reasons behind using SDRADAR is its similarity with Software Defined Radios (SDR). A radio being controlled by software provides an opportunity to apply autonomy to automatically control radio parameters based on requirements. However, flexible control of SDRADAR can detect and classify the level of a threat/near-miss event or localize the threat/near-miss event based on range resolution. Range resolution is the capability of RADAR to distinguish between two adjacent objects within a given range. SDRADAR can not only search for objects, but it can detect two objects closely co-located.
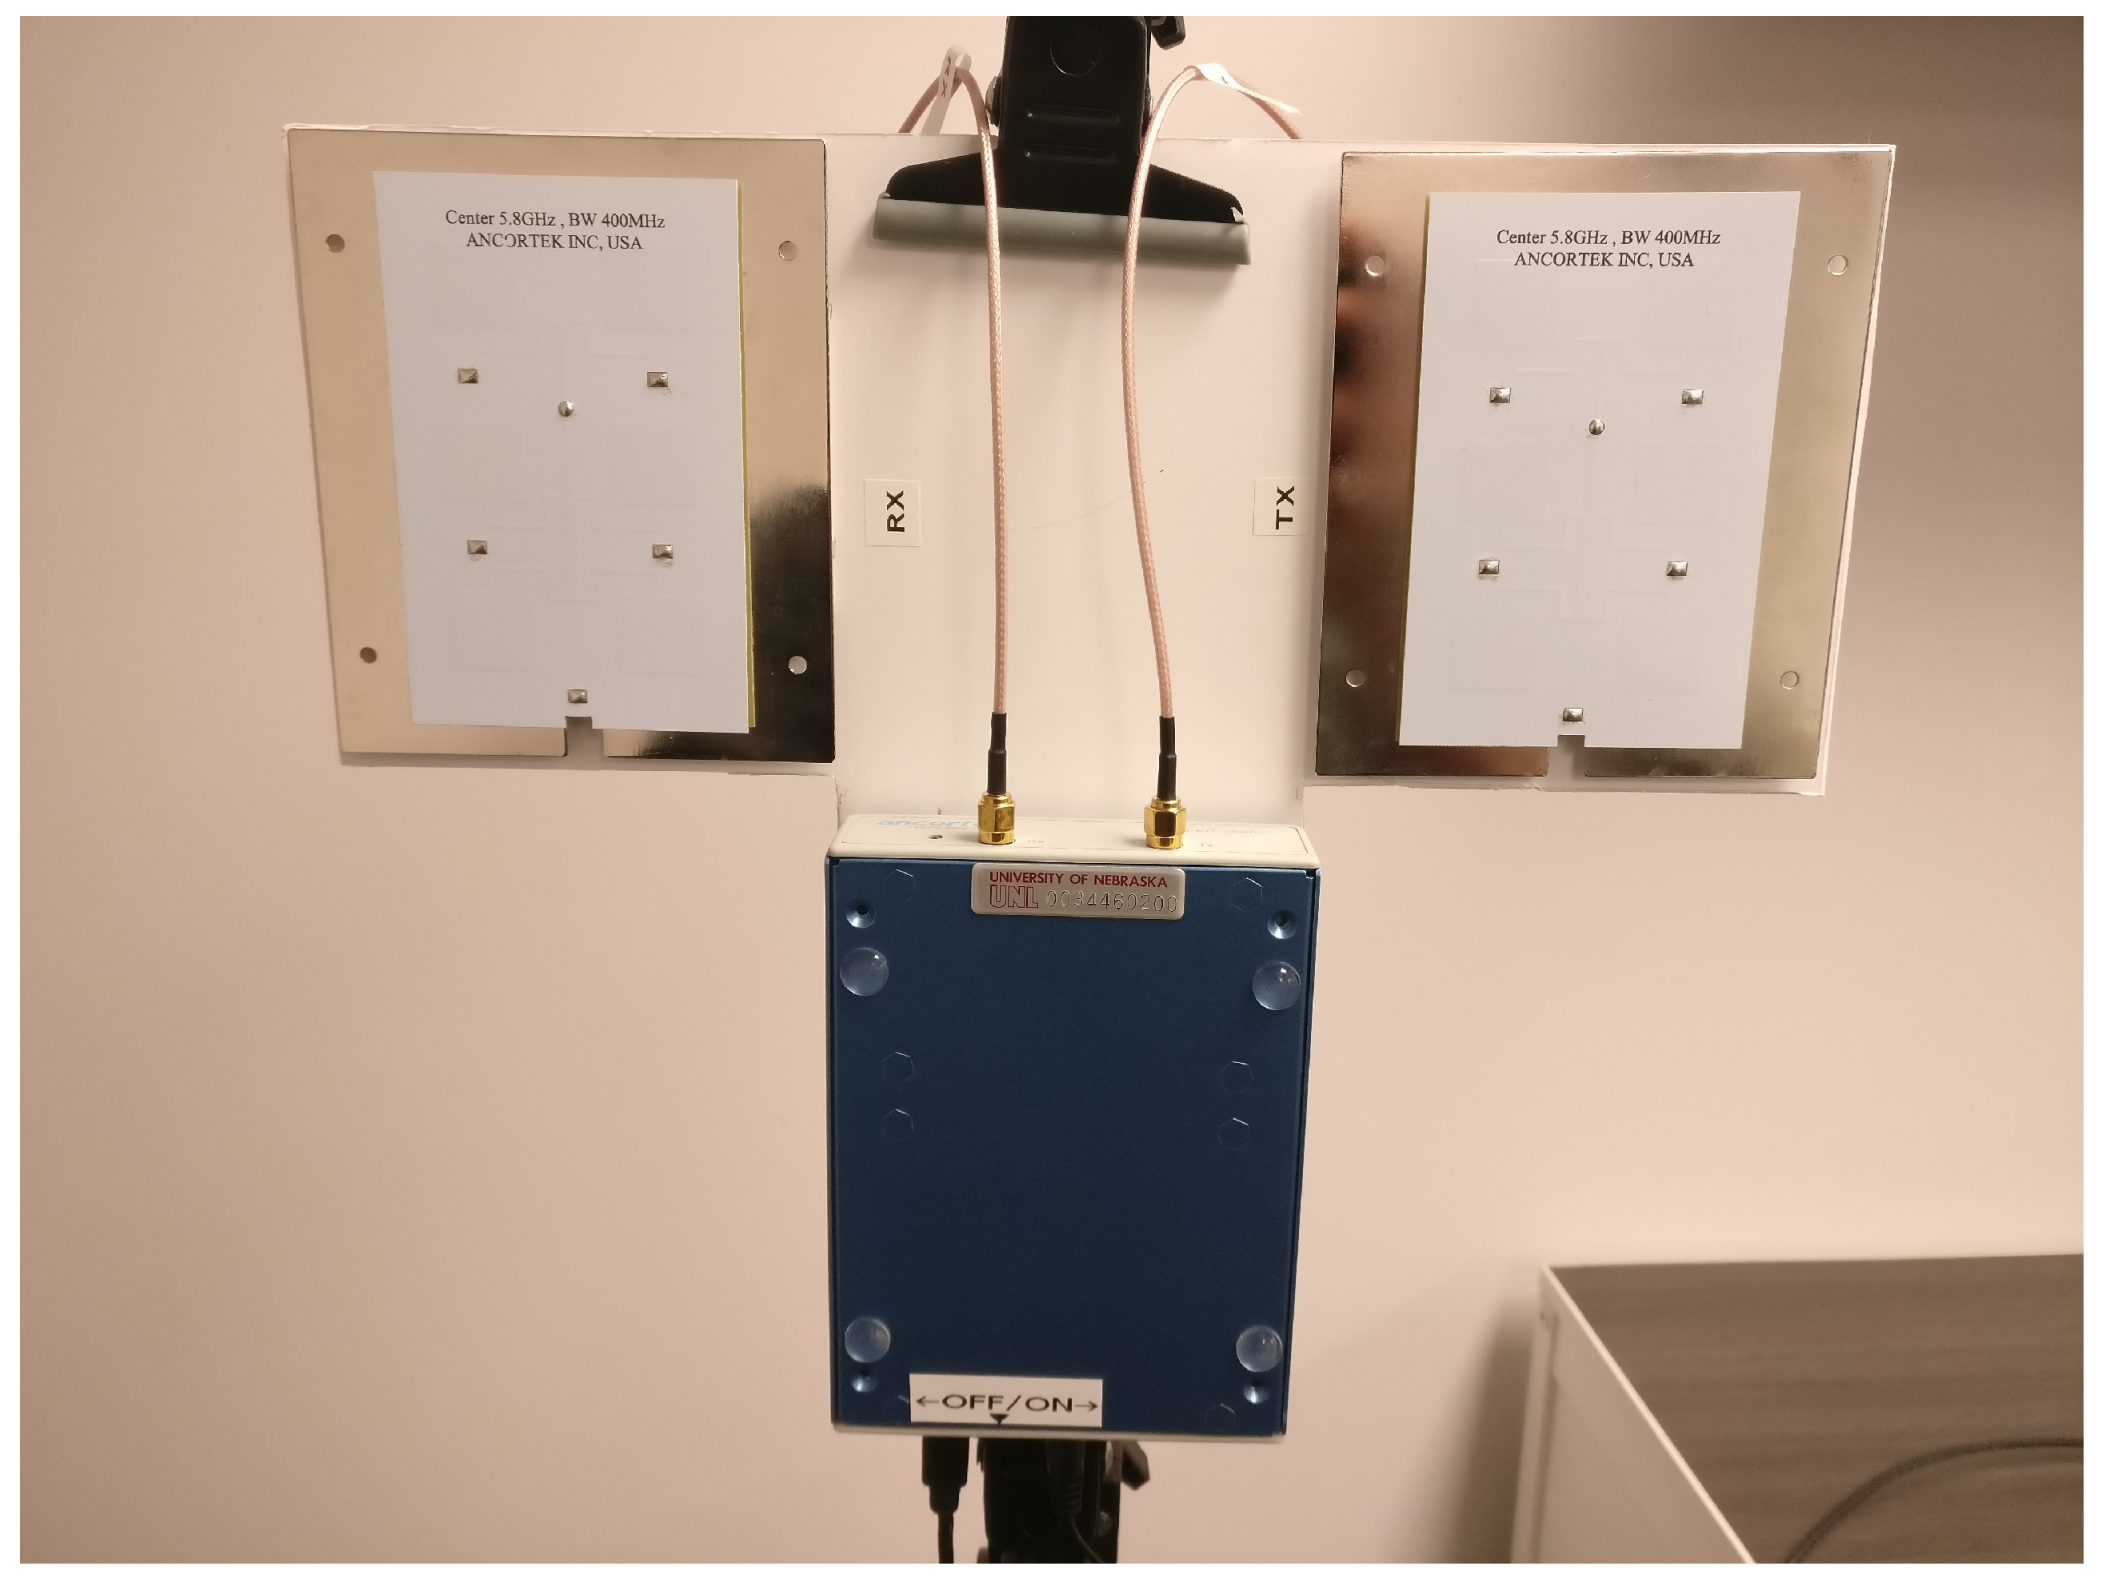
Some of the more fundamental parameters that are automatically configurable in SDRADAR systems are the utilized waveform type, filter configuration, sampling points, sweep time, and bandwidth. The hardware we have used in this study is Ancortek’s SDR-Kit-580AD (VA, USA) [
24]. The kit operates on a 5V power supply and provides separate transmit and receive antennas, as shown in
Figure 9, which also shows the housing and mainboard equipped with a SDR-PM 402 processor to be used in C-band frequencies (4–8 GHz), including the ISM band at 5.725–5.875 GHz. More details about the features of SDR580AD can be found in
Table 4.
5. Analysis of Sdradar Metrics
The manifold advantages of SDRADAR can be listed mentioning its
- (i)
flexibility,
- (ii)
larger range or coverage area,
- (iii)
operation in low visibility,
- (iv)
low power consumption,
- (v)
blind spot detection,
- (vi)
low visibility operation,
- (vii)
multiple object detection and tracking.
Our goal though is to automatically configure SDRADAR for optimum detection of moving objects or preventing unintended collisions in work environments. However, tuning multiple optimal parameters simultaneously can be hard. Therefore, we focus on three general objectives for real-time configuration, which are (i) range or typical distance of the object, (ii) clutter detection and removal for better object detection, (iii) Doppler and range resolution tuning for distances ≥100 m for considering size, velocity and direction of movement of the object. These objectives in terms provide us opportunity to tune more rigorous parameters. For ease of understanding of different parameters, we analyze SDRADAR performance with Frequency Modulated Continuous Waveform (FMCW) waveform controlling bandwidth, sample number
, where
is the sampling frequency and
is the sweep time. Therefore, changing the sample number and sweep time would also change the sampling frequency. Furthermore, changing these parameters will also change the range and Doppler resolution as Range resolution can be calculated by
In Equation (
2),
is the bandwidth allocated. The range of the bandwidth that can be allocated with software is up to 800 MHz, while the Doppler resolution is calculated as
, where
is center frequency of the RADAR. Doppler resolution is important to track and detect moving objects at different speeds, especially small vehicles, rolling stock and personnel. Therefore, we propose an Algorithm 2 to exploit these three objectives,
| Algorithm 2: Algorithm for semi-cognition and abstraction |
![Safety 05 00055 i001]() |
The simplicity of Algorithm 2 is changing the range resolution based on the target object detected or to be detected. First, the algorithm scans for personnel in the vicinity given the range resolution and increase or decrease it within a given interval until it finds the personnel. After finding a personnel or multiple personnel in different ranges, it can adjust its range resolution to simultaneously find threats such as oncoming traffic, rolling stock, railcar, etc.
In our proposed scanning and control algorithm, one of the underlying challenges we face is ‘clutter cancellation’. Clutter cancellation in SDRADAR can be done by collecting the clutter information for some interval and removing the average of the temporal clutter information for consecutive scanning. In our algorithm, due to the dynamicity and interference from the environment, clutter cancelling is conducted periodically for different ranges. For example, as the SDRADAR scans regions for an on-site EoD, it also periodically stores clutter information for the region. For successive detection and tracking, our algorithm removes the clutter template from the newly captured radar data. The clutter information is collected and stored in parallel with the detection and tracking tasks so that there is no processing delay or halt.
6. Testing of the Multi-Sensor Approach in the Real World
Comparing simulation results and real world test outcomes is always challenging, as we face numerous uncertain elements in real world environments that directly impact the test measurements and need to be accounted for when comparing the obtained results to the simulation. For example, a train may randomly move or stop, vehicles may come in front during data collection, power failures may occur for the sensor, the environment may suddenly change affecting data collection and further processing, etc. In our real world tests, we have tried to maintain test cases and replicability to address the capability of our algorithms and the potential of SDRADAR itself. For this, we have strictly defined test cases which we have adhered to. If we have logged each scenario with timestamped image streams, thus deviations and failures are logged or removed from radar data for that interval. These test cases are rerun multiple times to obtain a cleaner dataset for testing purposes. The tests have been run with our software GUI with manual and automatic configuration. All the tests are run with the following parameters;
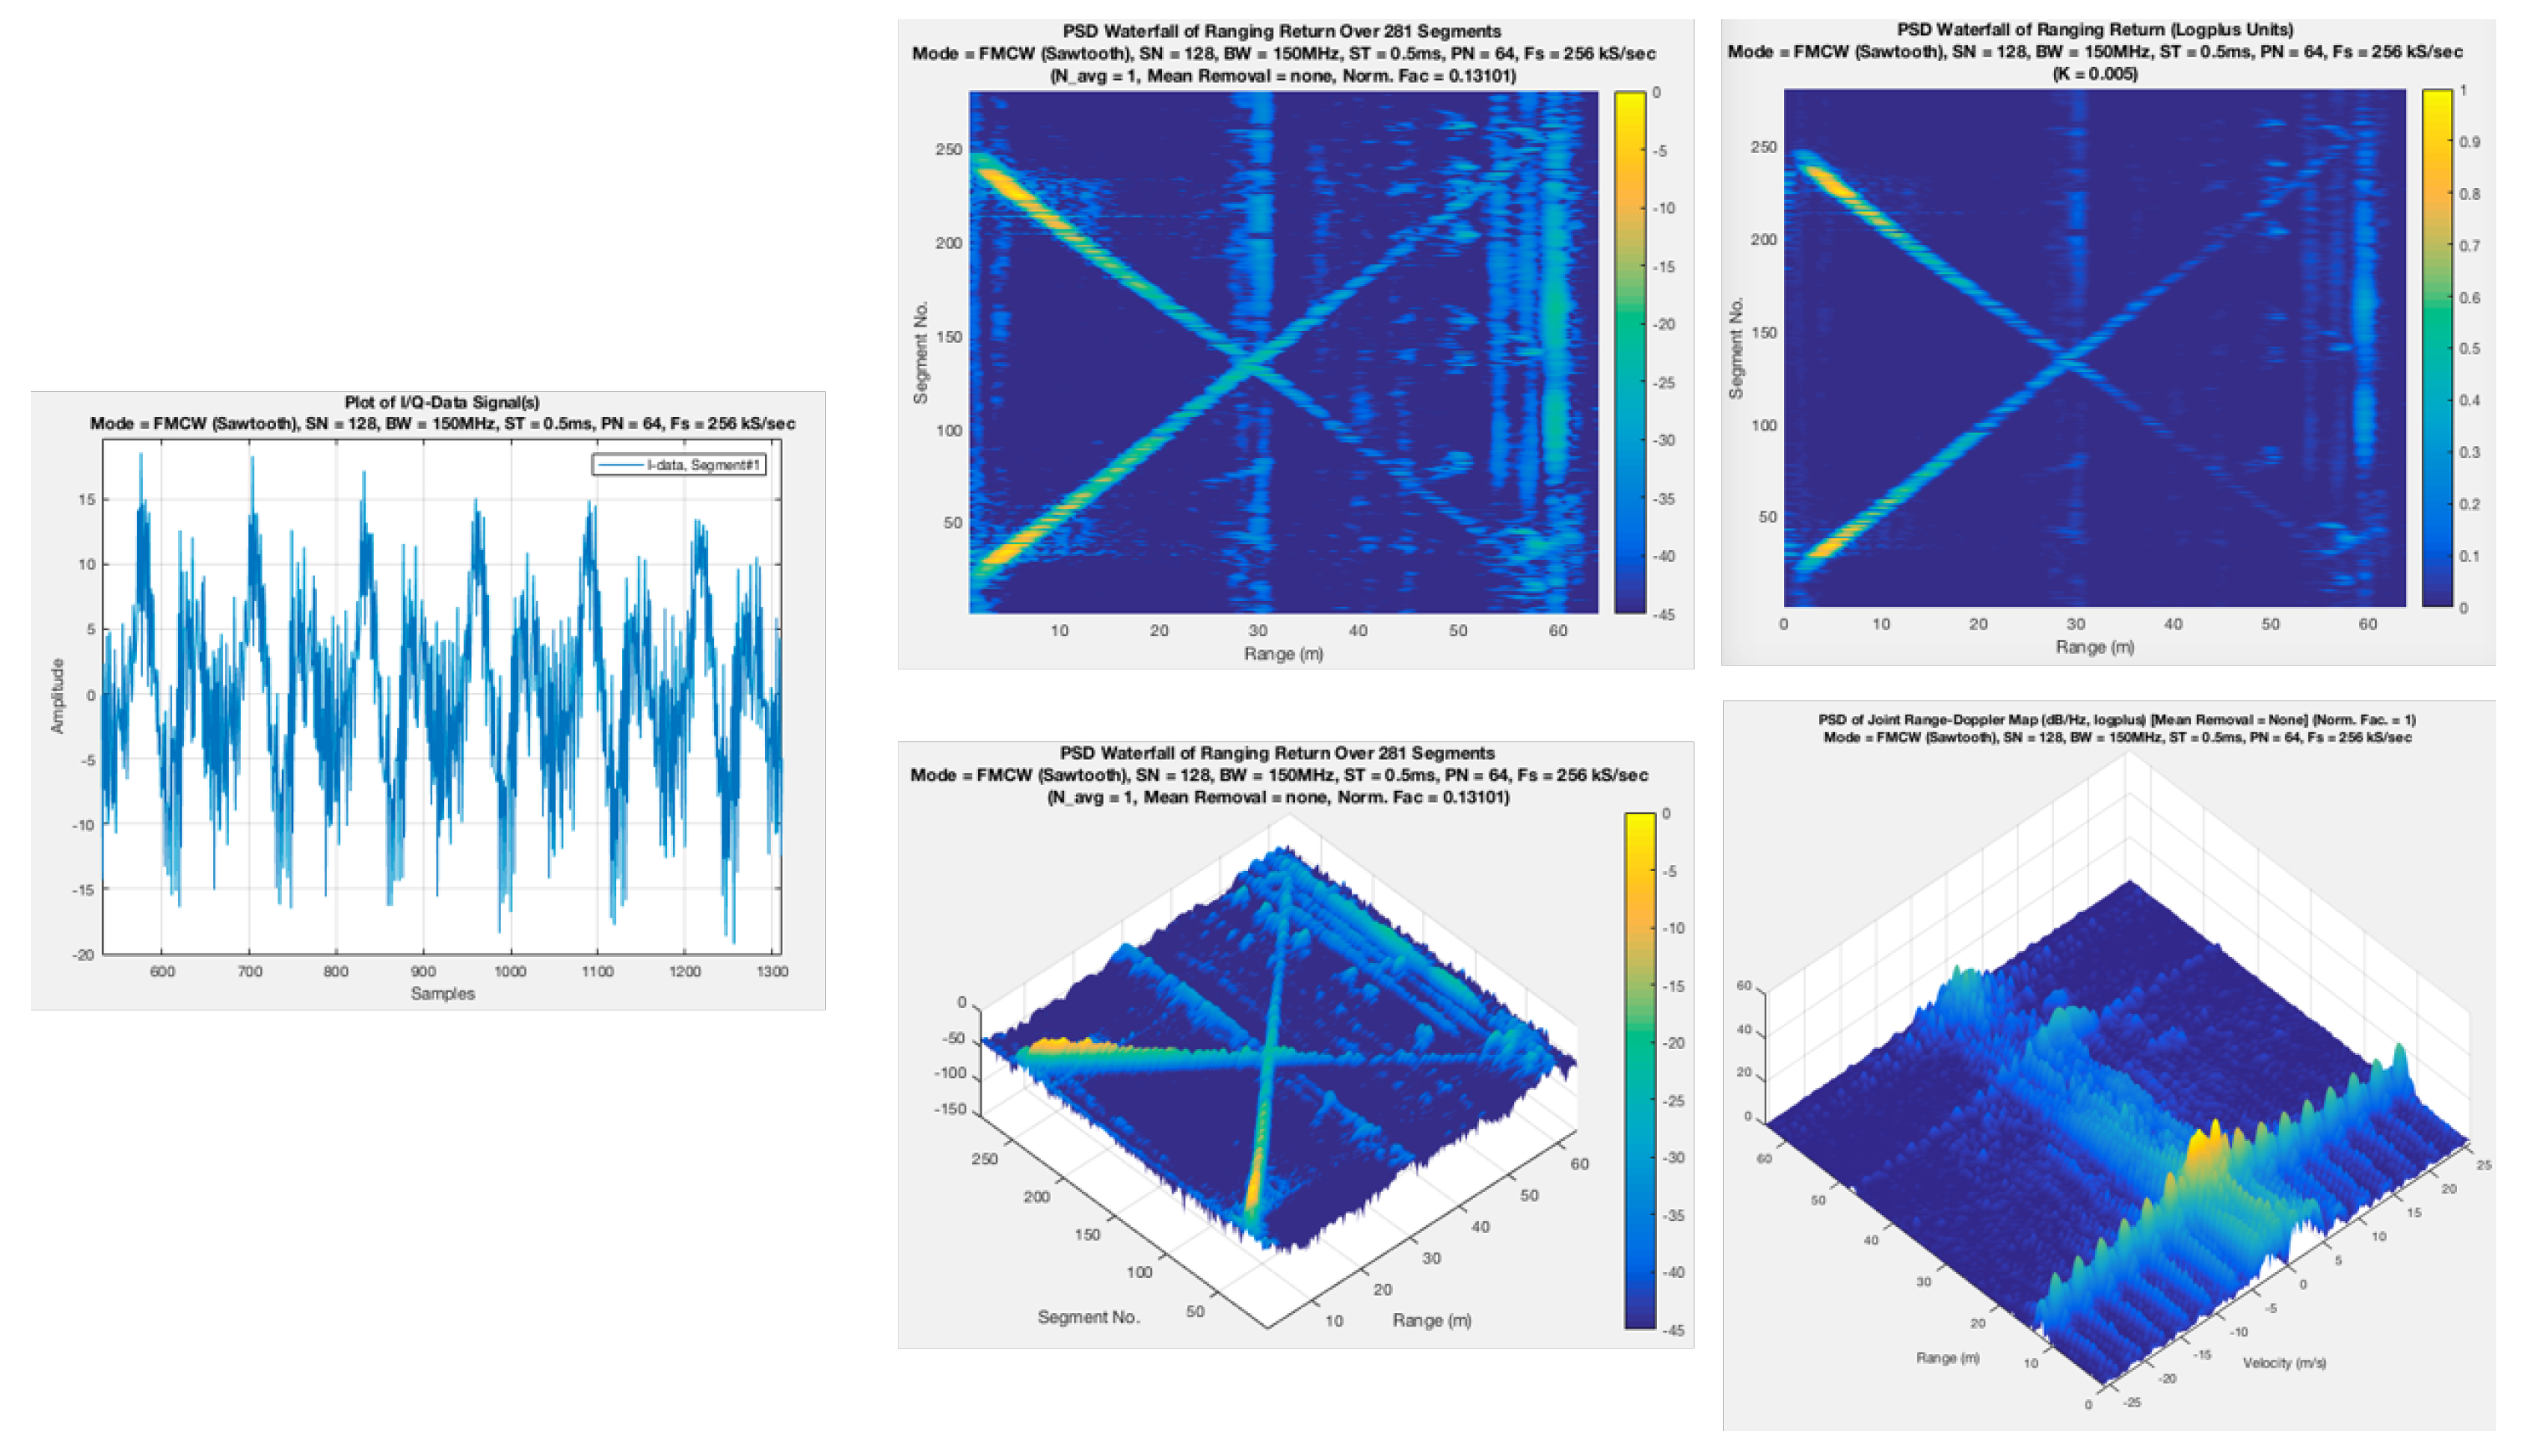
Table 5 shows that we utilize 64 cycles/period and buffer the complex I/Q data for each data collection period, also referred to as a frame. Even with a frame rate of 10 Hz, we are able to store recordings of significant length from each environment. For example, 30 s of sampled data will provide a cell matrix of size
. Now, given that each sweep consists of 128 sample points, a segment of 64 cycles would contain
complex samples of I/Q data. The split factor determines how these 64 cycles are split into burst groups before the RADAR decides that the buffer is full. The signal processing steps are shown in
Figure 10. Thus, for 64 cycles, there will be burst-groups of 16. Timer Granularity decides how fast the burst reads are completed. All of these parameters contribute to the accuracy and sensitivity of initial configuration of the radar. For the given setup, the maximum range in the radar equates to 60 m with a range resolution of 5 mm.
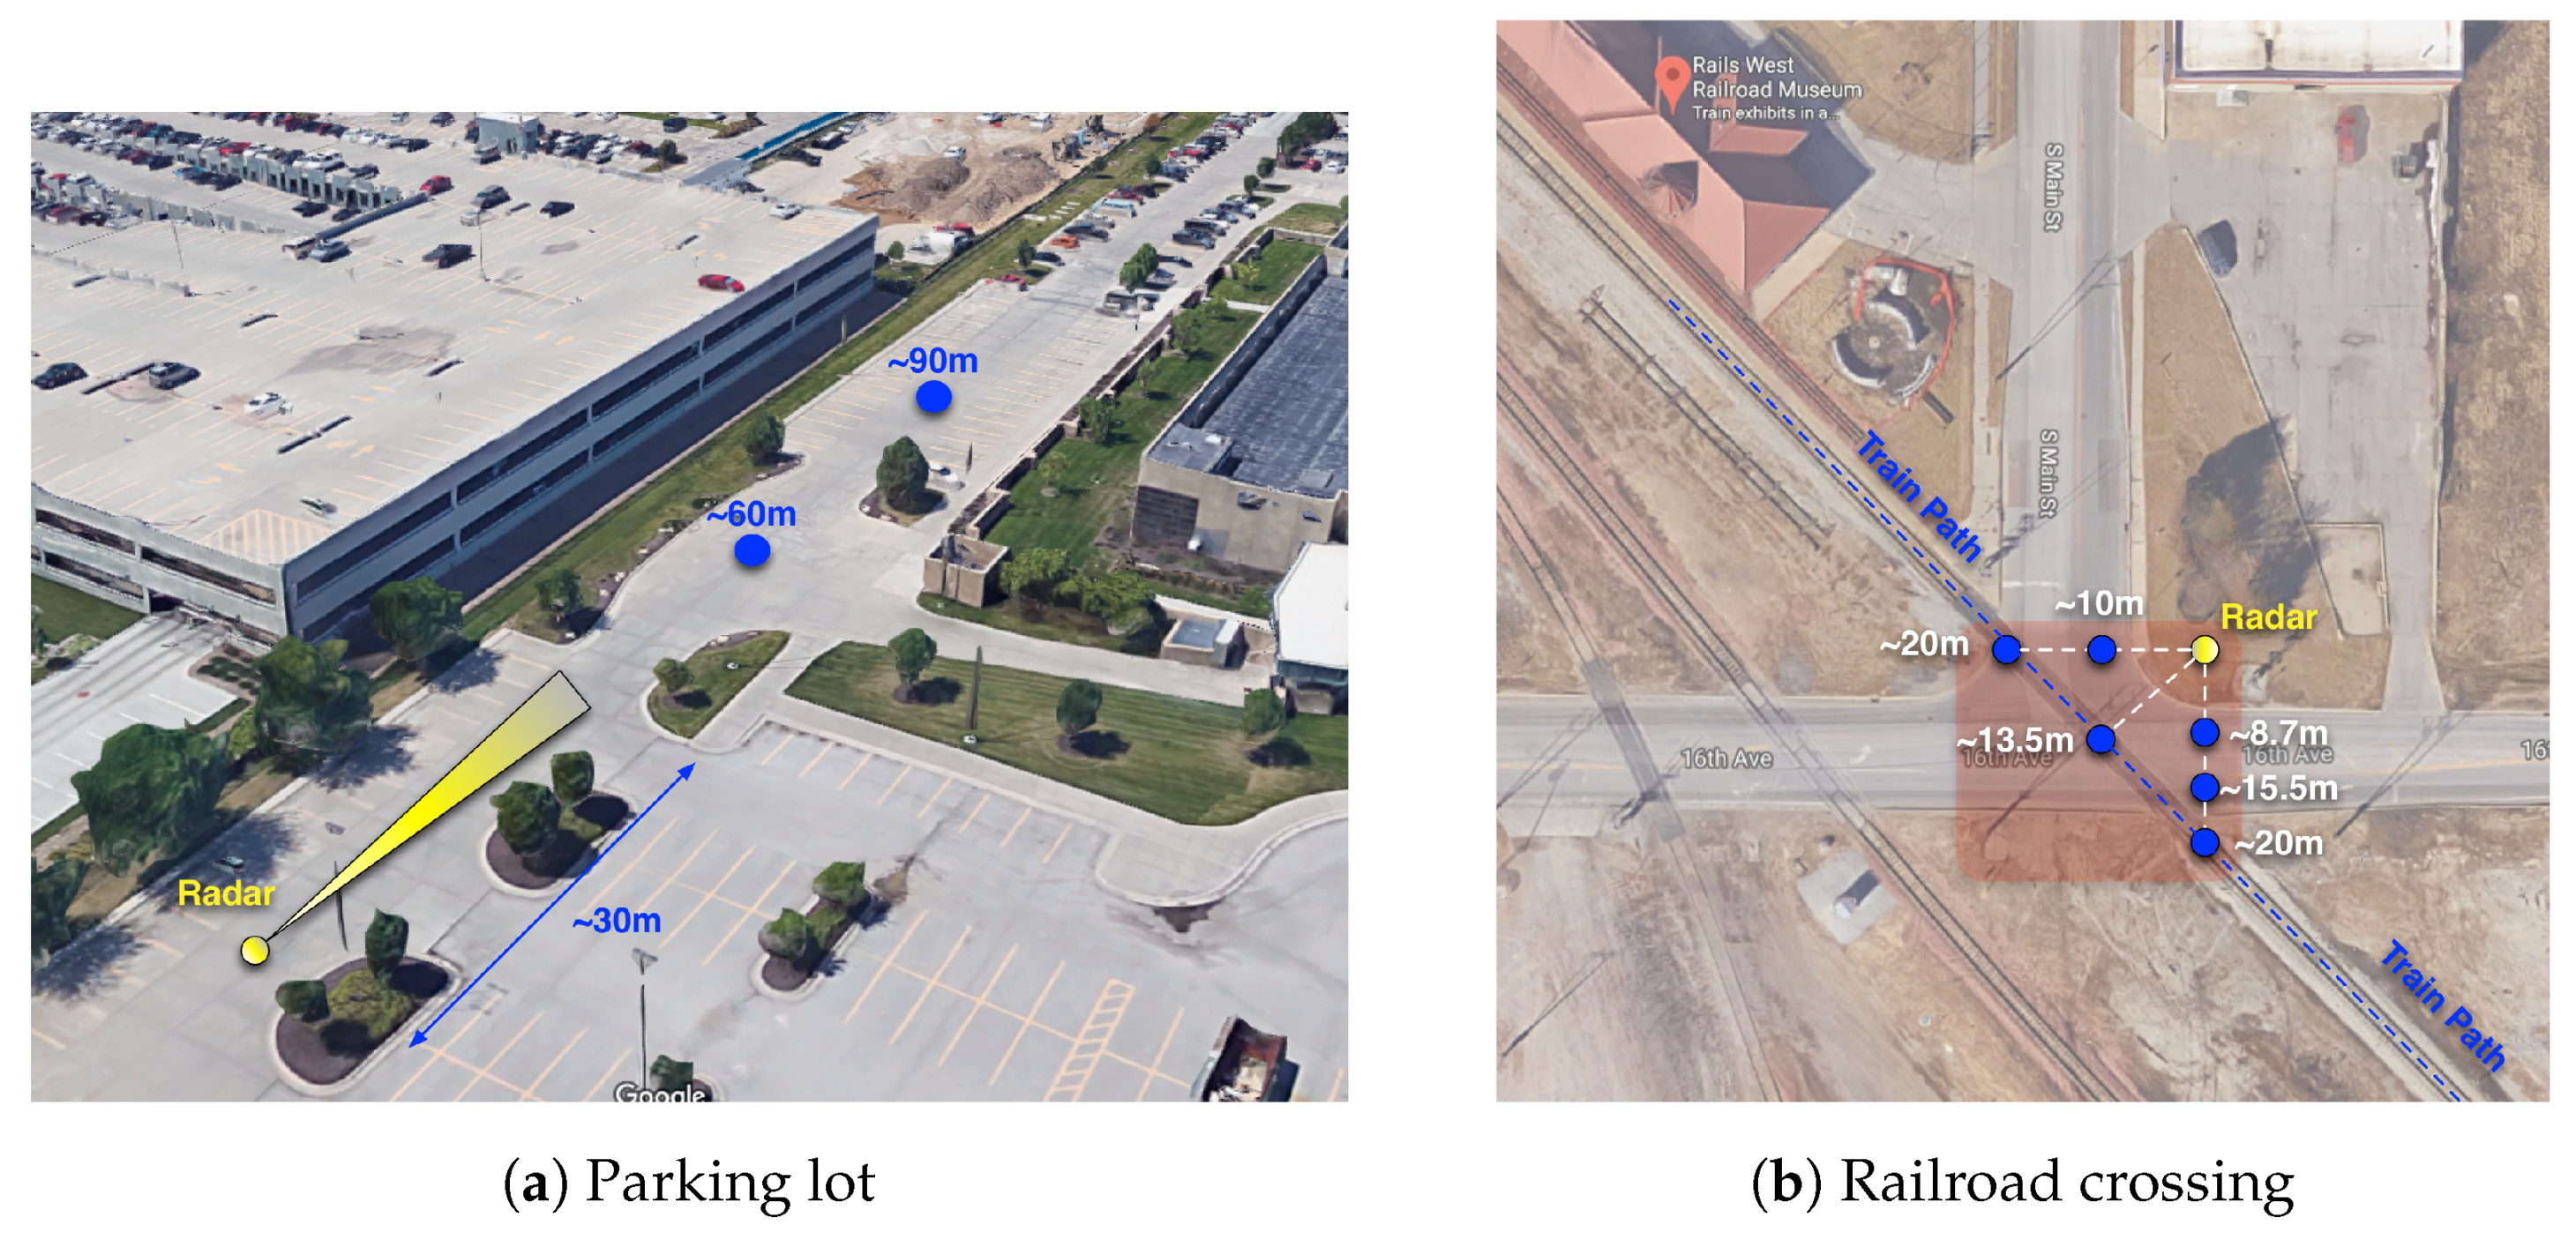
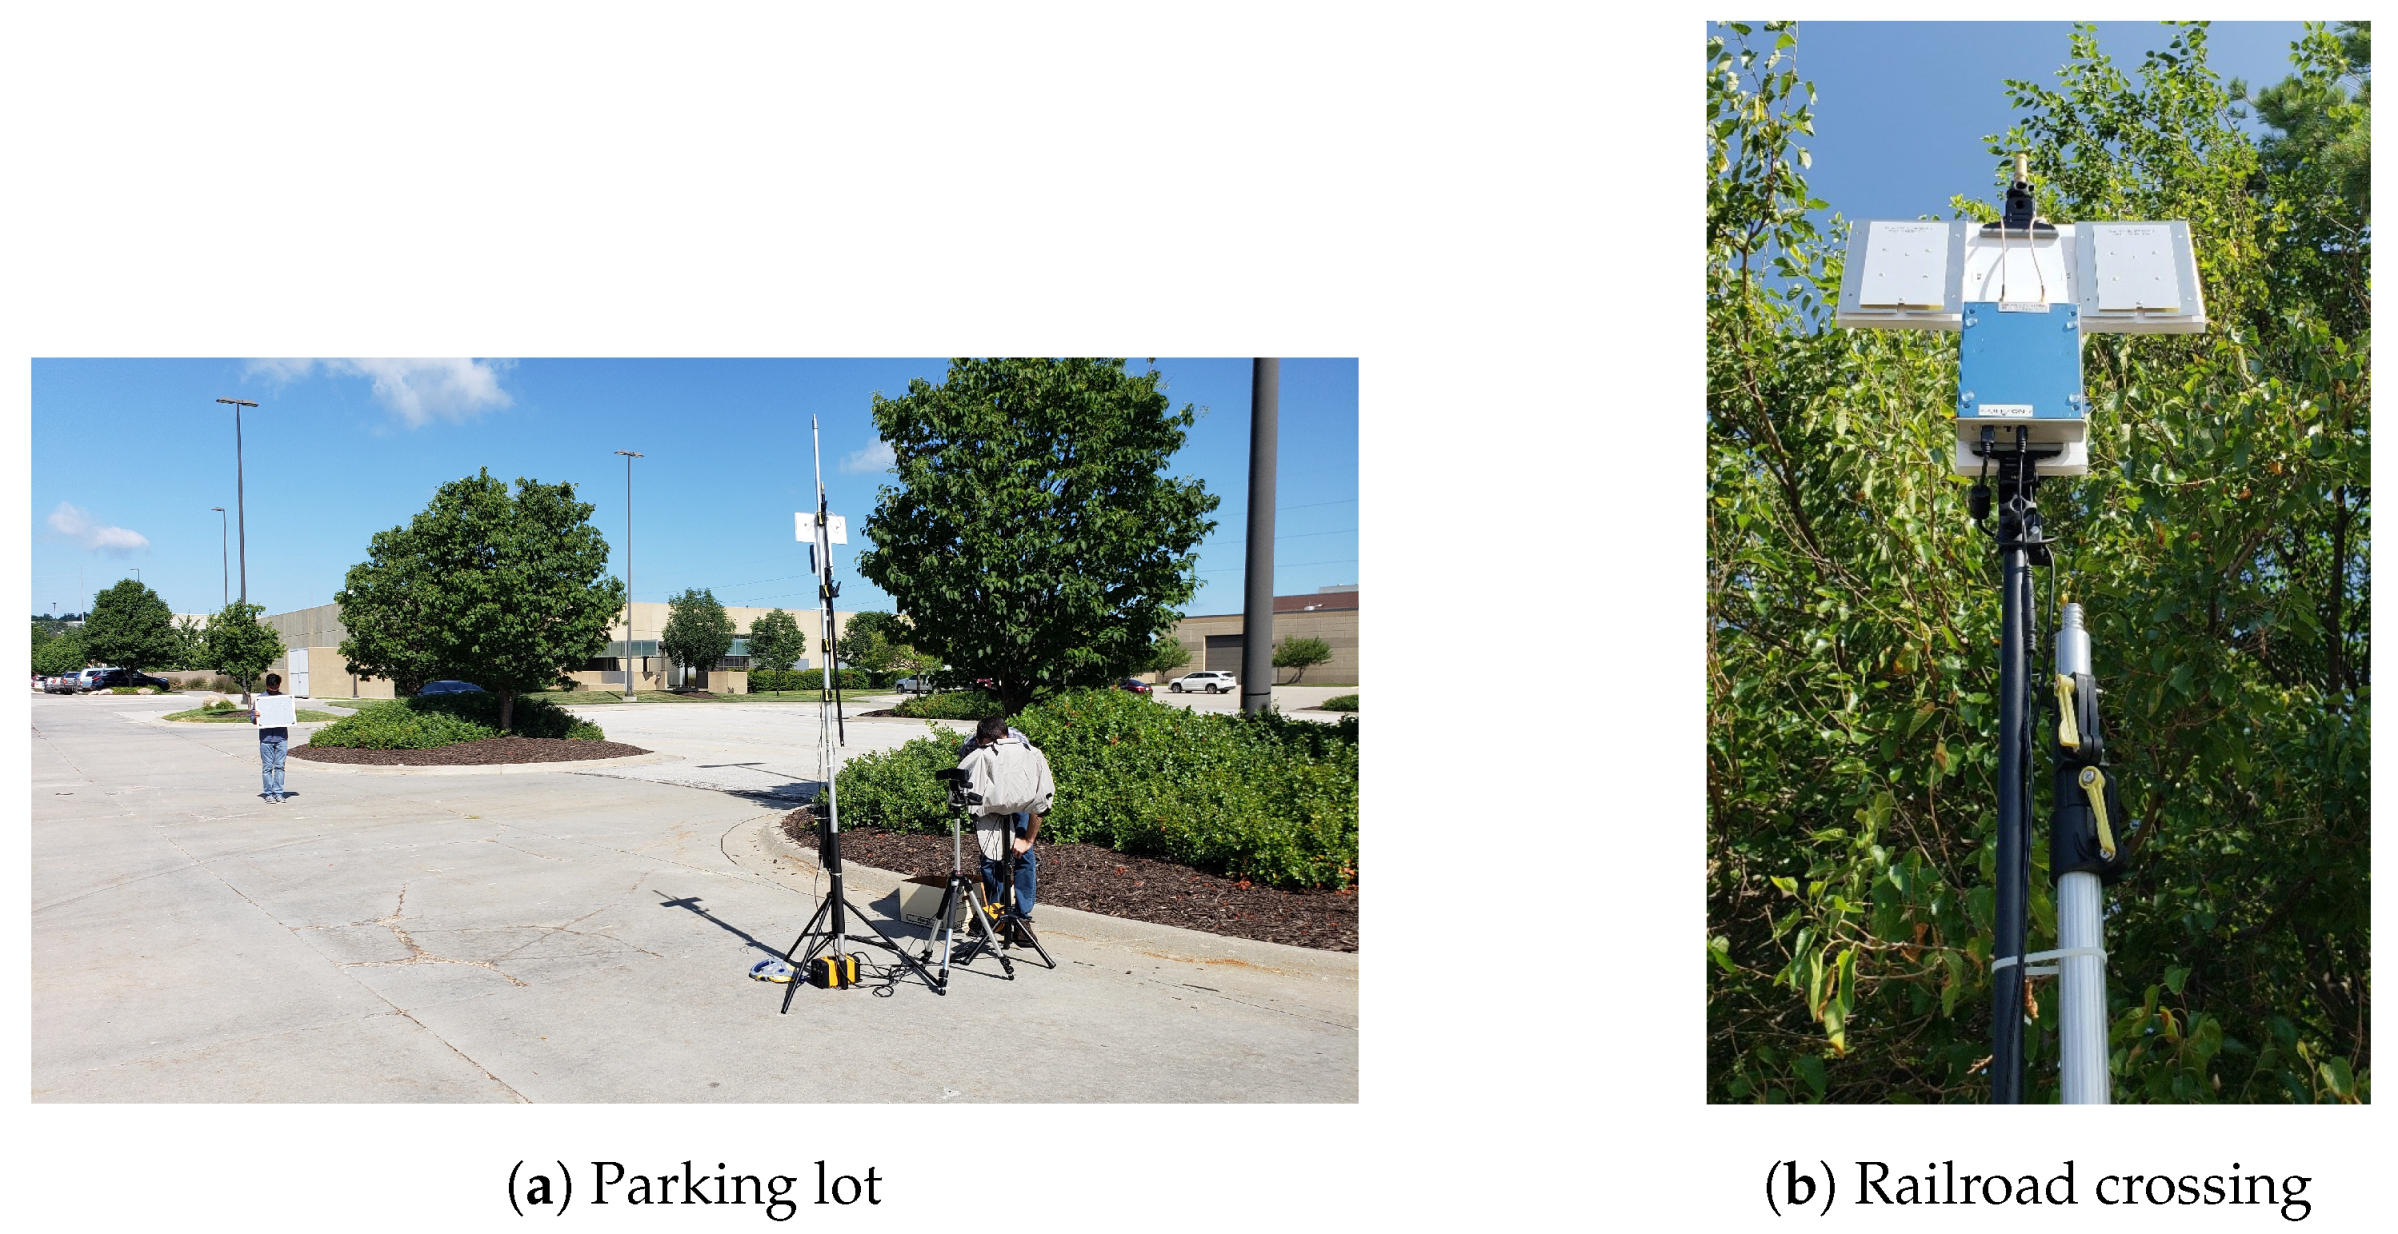
The first set of tests have been run in the parking lot of our University’s Scott Technology Center and at a railroad crossing near the RailsWest Museum in Council Bluffs, IA. The maps in
Figure 11a,b shown is used for detection of
Figure 12a,b with setups depicted in
Figure 13a,b.
6.1. Mathematical Analysis of Radar Range and Detection
Before discussing Phase 1 findings, we first validate the maximum range configuration for SDRADAR. Theoretical calculation of maximum range of RADAR can be done with the equation,
where
power output of the SDRADAR,
is the target’s radar cross section,
c is the speed of light,
is the RADAR antenna gain,
= 5.8 GHz, NF = 1.8 dB and finally
, in which
dB,
k is the Boltzmann’s constant,
the absolute temperature,
= 5.9 GHz is the receiver bandwidth and
G = 15 dBi is the antenna gain. Based on the values found from
Table 4, the maximum range can be found as ∼58 m for the initial configuration.
6.2. Phase 1: Parking Lot Tests-Multi-Object Detection and Tracking
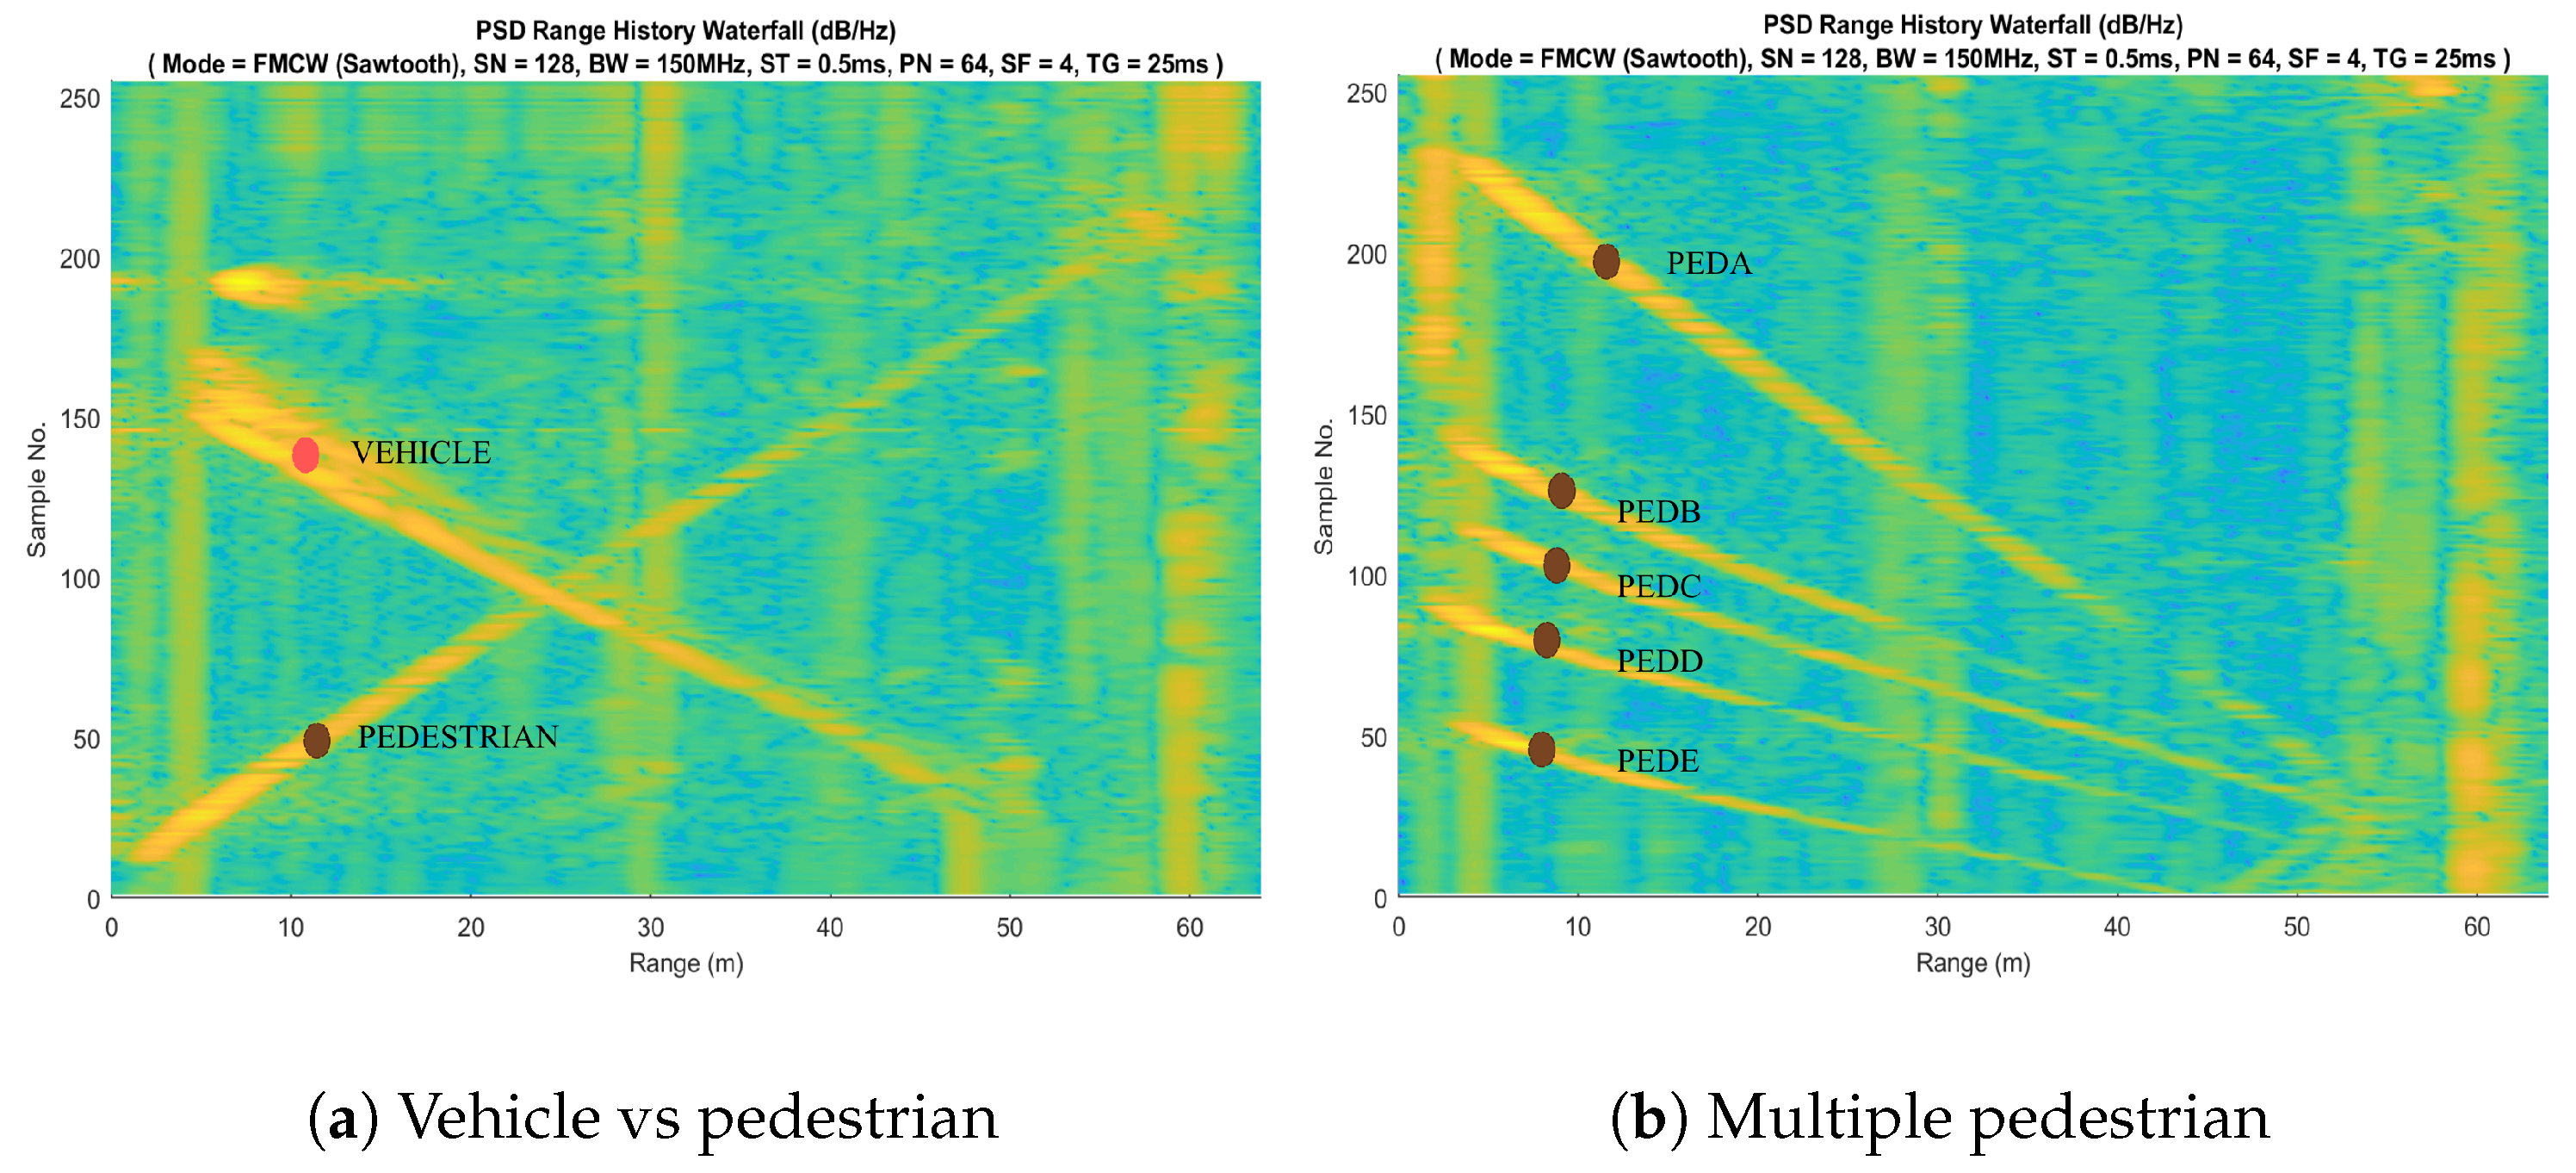
Utilizing the above configuration, we created several test scenarios for multiple pedestrians and pedestrian vs. vehicle detection and tracking in the parking lot test environment, as shown in
Figure 12a,b. The clutter environment, as shown by the satellite image, is mostly controlled and static in this environment, with just a few parked vehicles in the vicinity of the test setup. However, the SDRADAR also is able to detect ground reflections and trees in the vicinity, along with the parked cars. Our test scenario shows that, with the proposed variable scanning algorithm, the cars and pedestrian are separable by their returns. As observable in
Figure 12a, it is obvious that a car exhibits a larger return compared to the pedestrian. In this example, we can clearly observe a car and a pedestrian approaching each other, passing one another, and then moving away from each other, with a maximum separation of ∼60 m at the end of the test. This illustrates that the simultaneous tracking and classification of these objects using our approach and the SDRADAR works well. A special point of interest is the point where they pass each other, with the pedestrian’s return being overshadowed temporarily by the car’s radar return. In a railyard situation, this is similar to a ‘near-miss’ event and should trigger an alarm with accompanying full recording for documentation including timestamps and visual data, radar information, etc. In
Figure 12b, all pedestrians start walking from different starting positions and at different speeds and approach the SDRADAR. Upon closer inspection, we can observe that there is a varying radar return captured in this information shown in
Figure 12b, with the stronger return or reflection stemming from the slower pedestrians, whereas the faster pedestrians have a weaker return. This observation provides us the opportunity to work with the return pattern of the objects moving at different speed to further classify and label observed objects.
From the map in
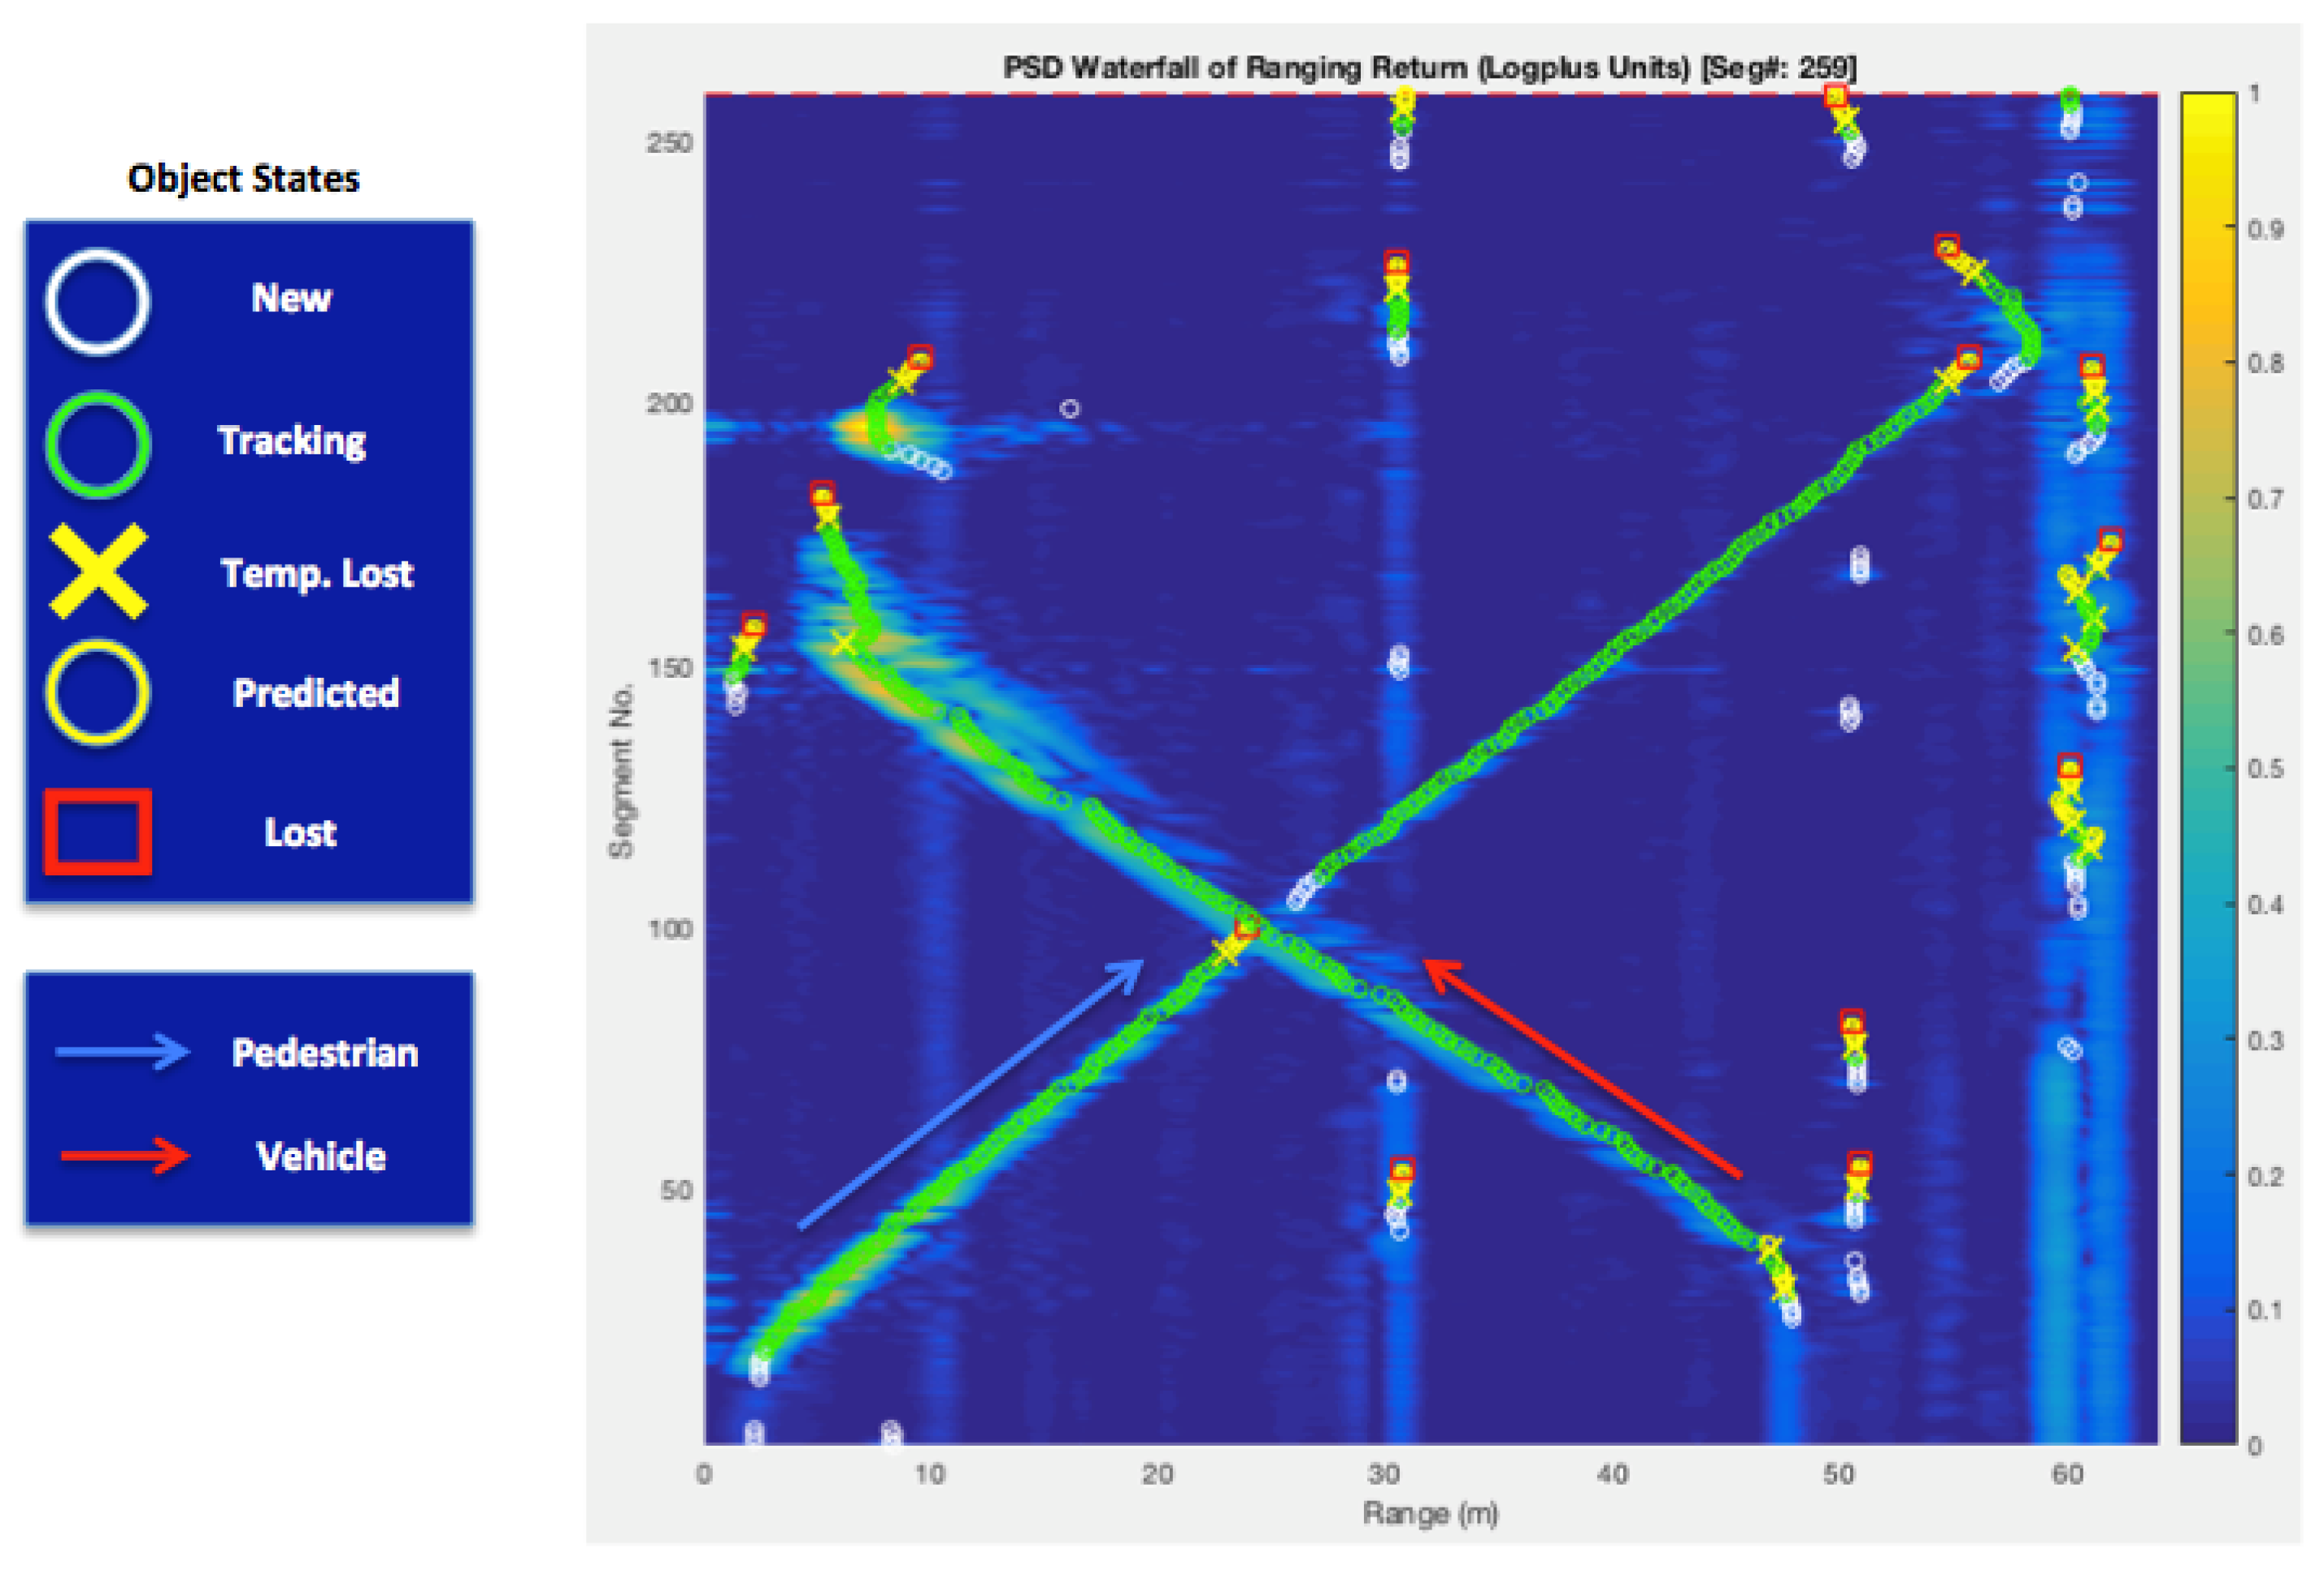
Figure 11a, we can observe three blue markers at 30 m, 60 m and 90 m within the test setup. These markers represent three different maximum ranges derived from different SDRADAR configurations and they trigger scanning in different regions based on successful or unsuccessful target detection. With variable range resolution and bandwidth configurability, along with adjustable sweep times, it is possible to flexibly and intelligently scan different areas for maximizing the change to detect object at different distances. Utilizing the SDRADAR data, we implemented an object following solution, to label and track objects over time, including when they enter and exit shadowed areas behind larger objects, for example, or cross paths, as shown in
Figure 14. The visualization in this image is directly produced from the raw data from the “Car and Pedestrian” test scenario shown in
Figure 12a. It can be seen that the car and pedestrian can be tracked over the test period. The labels in
Figure 14 are (i) new, (ii) tracking, (iii) temporarily lost, (iv) predicted and (v) lost. When our proposed algorithm finds the first instance of an objects, it identifies it as a new object and starts tracking. Most of the “temporarily lost” labels occur within the ‘point of contact’ region due to object shadowing.
In our tracking and detection method, it successfully follows pedestrian and vehicle movement, with the achieved accuracy analyzed in
Table 6. It can be seen that almost 90% of the time an object having a perceptible return can be detected and traced by our algorithm and its scanning method.
Based on the extensive testing we conducted, we can say that our tracking and scanning algorithm can successfully follow multiple objects within the SDRADAR’s range in about 94–95% of the time. This holds for single and multiple object tracking in our captured data. Based on successful testing in Phase 1, we moved towards Phase 2, which focuses on real yard tests with real yard equipment, such as locomotives, railcars, hi-rail vehicles, and more. The goal of phase 2 was to capture real-world train radar return data and store it for future study, such as for training a neural network for an artificial intelligence approach to our object tracking.
6.3. Phase 2: Railroad Crossing Test
Similar to our parking lot tests, we defined three test cases for railroad crossing tests. The setup can be observed in
Figure 13b. The location map with setup placement is shown in
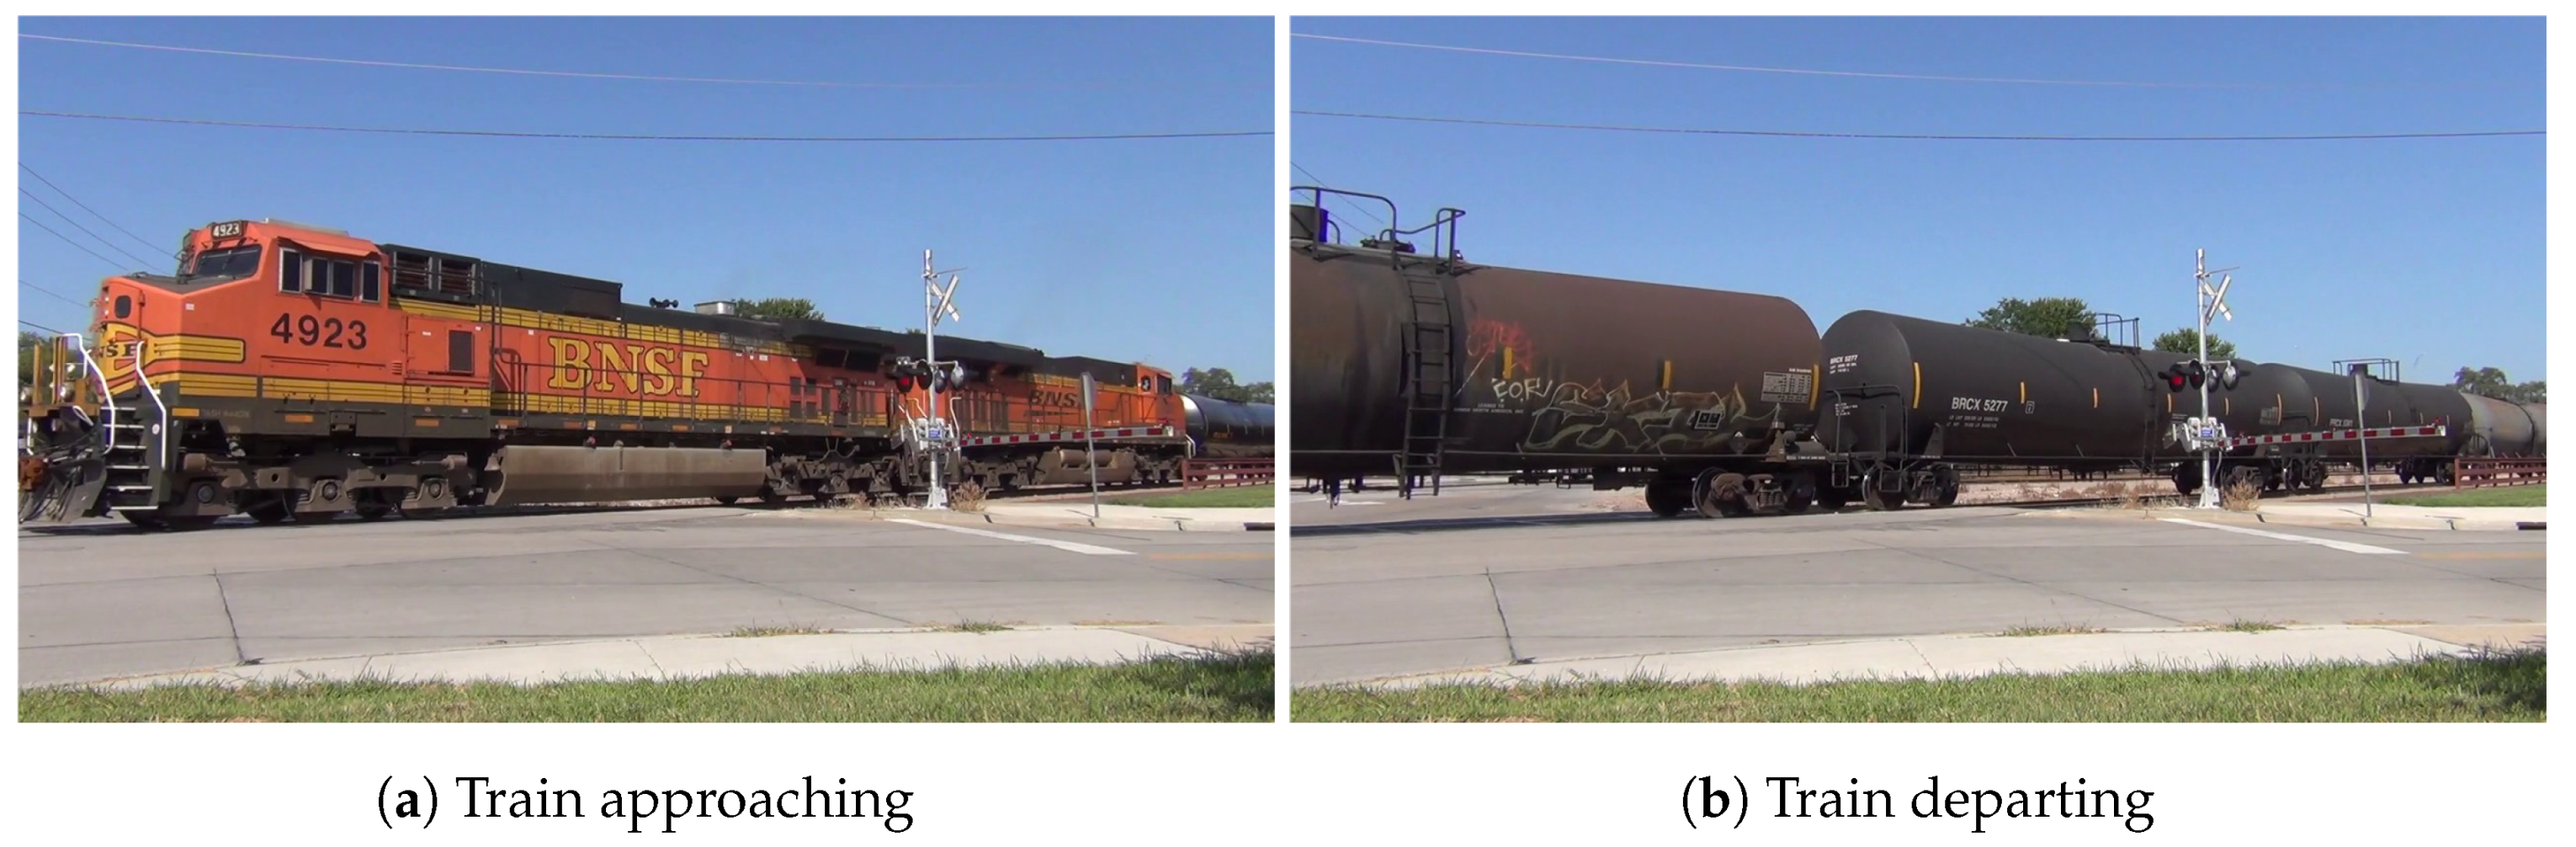
Figure 11b. The train we observed in this captured dataset (locomotive and railcars) is at the Iowa Interstate Railroad Council Bluffs Yard, near the Railswest Museum in Council Bluffs, IA. The train moves at very slow speed ≤10 mph heading southeast. The SDRADAR was a setup facing WEST to pick a signal up at an angle towards the moving train. This allows us to also track the change in distance when the train moves along the track. If the RADAR would be pointed straight across the track, no distance changes would be observed.
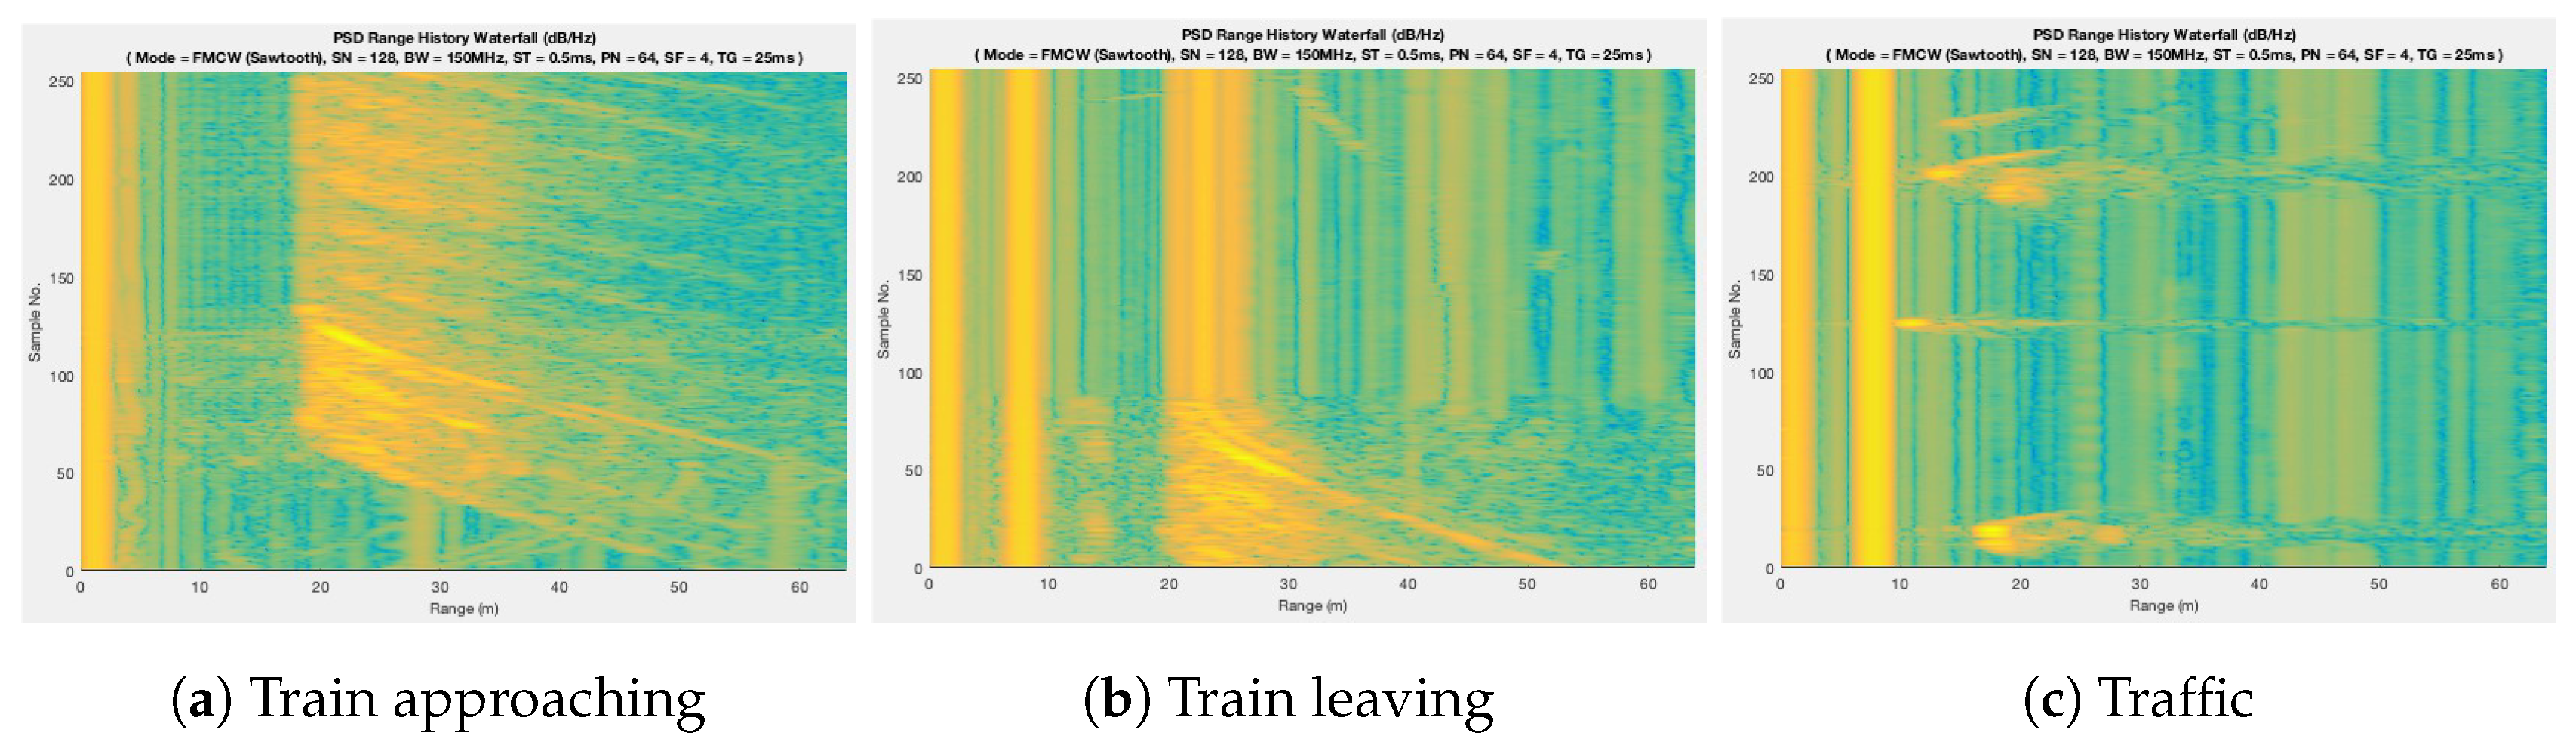
Figure 15 is radar returns for train approaching and departing scenarios shown in
Figure 16 show the train approaching and departing scenarios. During our study of the train departure, the train stopped for 30 s providing us ample opportunity to record signal return from the railcars. For the train approach scenario, the locomotive provided a stronger signal spread for SDRADAR to register due to train approaching from 60 m to 20 m. At a measured distance of 15–20 m, thus being relatively close to the SDRADAR, we can see that the very strong radar cross section results in a very broad return signal visualization, as seen in
Figure 15a. If, during that time, an object would be at close to the same distance, it would be effectively hidden from view because it would be indistinguishable from the radar cross section of the locomotive. Hence, for our object tracking algorithm, it is vital to be able to continuously update its hypothesis about where tracked objects are, even if they temporarily are overshadowed by larger objects, and to support this hypothesis from other sensors through our multi-sensor approach. If in this example scenario an EoD would be close to a train and in the range of a camera, we would be able to reliably track and distinguish both train and EoD even if the EoD stays within that shadow for long periods of time.
Any strong ground reflection should be ignored and removed through the clutter cancellation stage for
Figure 15. For example, from the recorded data of the train test scenario, we can observe the ground reflection with a spread of about ∼6 m, which in some cases could be misclassified due to the apparent similarity to the return of the locomotive.
Compared to train moving test cases, the traffic test case is easy to understand. There are three vehicles in motion at different time segments. Obviously, for neither of the test vehicles does it require a significant amount of time to cover the assigned test paths of between 30 and 50 m. The return also provides us the information about the car sizes. Two of the cars were larger in size compared to the the car identified in the middle. For example, if the pedestrian were present in this test case, they can be easily detected looking at their location and change of frames. A pedestrian would require a longer time and thus allow us to collect a higher number of samples, to span the same 30 m region.
7. Conclusions
In this paper, we have studied a multi-sensor object classification and tracking approach that can play a crucial role in protecting workers in complex and dynamic environments such as railyards. Due to the myriad dynamic parameters of such an environment, from objects to weather to worker conditions, it is virtually infeasible to utilize a single sensing technology that is capable of working reliably under all possible scenarios. Hence, along with a wide angle camera-based solution, we also incorporated SDRADAR into our multi-sensor system, to enable location detection and tracking while compensating for blind spots, hidden objects, low visibility, near-miss, etc. In our real-time image processing work, we have shown that our algorithm can provide 10–20% better processing time without consuming a lot of power. We have also shown that utilizing SDRADAR in the workplace guarantees detection of large and small objects alike through dynamic adjustments to its operating parameters. We have discussed automatic configuration of software to control the RADAR on the fly to ensure detection of EoD in critical situations. The blind detection of moving objects also provides an opportunity to detect any personnel present in the operating zone optimizing the number of future accidents. We have validated and verified each algorithm in real-world tests to check both sensors and record the challenges if any. To the best our knowledge, this is one of the first research works in railyard and railroad to employ software defined radar along with sensors such as camera, etc.
Author Contributions
Conceptualization, S.B. and J.S.; Data curation, J.S.; Formal analysis, S.B., J.S. and P.G.; Funding acquisition, H.S.; Investigation, S.B., J.S., M.H. and H.S.; Methodology, S.B., J.S. and H.S.; Project administration, M.H. and H.S.; Resources, M.H. and H.S.; Software, J.S.; Supervision, M.H. and H.S.; Validation, S.B., M.H. and H.S.; Visualization, S.B. and J.S.; Writing—original draft, S.B.; Writing—review and editing, M.H., P.G. and H.S.
Funding
This research was funded by the University Transportation Center for Railway Safety (UTCRS).
Acknowledgments
This study was conducted at the University of Nebraska-Lincoln by the research faculty and students at the Advanced Telecommunications Engineering Laboratory (
www.TEL.unl.edu). This project was supported by the University Transportation Center for Railway Safety (UTCRS).
Conflicts of Interest
The authors declare no conflict of interest.
Abbreviations
The following abbreviations are used in this manuscript:
| FOV | Field of View |
| LoS | Line of Sight |
| SDRADAR | Software Defined RADAR |
| SDR | Software Defined Radio |
| FMCW | Frequency Modulated Continuous Wave |
| EoD | Employee on Duty |
| CFR | Code of Federal Regulation |
References
- Banerjee, S.; Santos, J.; Hempel, M.; Sharif, H. A New Railyard Safety Approach for Detection and Tracking of Personnel and Dynamic Objects Using Software-Defined Radar. In Proceedings of the 2018 Joint Rail Conference, Pittsburgh, PA, USA, 18–20 April 2018; American Society of Mechanical Engineers: New York, NY, USA, 2018; p. V001T06A014. [Google Scholar]
- Banerjee, S.; Hempel, M.; Sharif, H. A survey of railyard worker protection approaches and system design considerations. In Proceedings of the 2017 Joint Rail Conference, Pittsburgh, PA, USA, 4–7 April 2017; American Society of Mechanical Engineers: New York, NY, USA, 2017; p. V001T06A007. [Google Scholar]
- 2.03—Train Accidents by Railroad Groups. Available online: https://safetydata.fra.dot.gov/OfficeofSafety/publicsite/Query/inctally3.aspx (accessed on 22 January 2019).
- 2.04—Employee on Duty Casualties. Available online: https://safetydata.fra.dot.gov/OfficeofSafety/publicsite/Query/castally1.aspx (accessed on 23 January 2019).
- Home|Federal Railroad Administration. Available online: https://www.fra.dot.gov/c3rs (accessed on 17 May 2019).
- 49 CFR Part 225—RAILROAD ACCIDENTS/INCIDENTS: REPORTS CLASSIFICATION, AND INVESTIGATIONS. Available online: https://www.law.cornell.edu/cfr/text/49/part-225 (accessed on 17 May 2019).
- 49 CFR Appendix D to Part 218, Requirements and Considerations for Implementing Technology Aided Point Protection. Available online: https://www.law.cornell.edu/cfr/text/49/appendix-D_to_part_218 (accessed on 23 January 2019).
- Alessandretti, G.; Broggi, A.; Cerri, P. Vehicle and guard rail detection using radar and vision data fusion. IEEE Trans. Intell. Transp. Syst. 2007, 8, 95–105. [Google Scholar] [CrossRef]
- Zhang, Y.; Venkatachalam, A.S.; Xia, T. Ground-penetrating radar railroad ballast inspection with an unsupervised algorithm to boost the region of interest detection efficiency. J. Appl. Remote Sens. 2015, 9, 095058. [Google Scholar] [CrossRef]
- Al-Qadi, I.L.; Xie, W.; Roberts, R. Scattering analysis of ground-penetrating radar data to quantify railroad ballast contamination. NDT E Int. 2008, 41, 441–447. [Google Scholar] [CrossRef]
- Banerjee, S.; Hempel, M.; Sharif, H. A review of workspace challenges and wearable solutions in railroads and construction. In Proceedings of the 2017 13th International Wireless Communications and Mobile Computing Conference (IWCMC), Valencia, Spain, 26–30 June 2017; pp. 91–96. [Google Scholar]
- Addabbo, T.; Della Giovampaola, C.; Fort, A.; Mugnaini, M.; Pozzebon, A.; Toccafondi, A.; Vignoli, V. Target measurements influence on level crossing detection system safety determination. Measurement 2019, 135, 547–554. [Google Scholar] [CrossRef]
- Savage, I. Trespassing on the railroad. Res. Transp. Econ. 2007, 20, 199–224. [Google Scholar] [CrossRef]
- Zhang, M.; Khattak, A.J.; Liu, J.; Clarke, D. A comparative study of rail-pedestrian trespassing crash injury severity between highway-rail grade crossings and non-crossings. Accid. Anal. Prev. 2018, 117, 427–438. [Google Scholar] [CrossRef] [PubMed]
- Defect Detection Software Integrated with Drone Railyard Inspection Service. Available online: https://www.unmannedsystemstechnology.com/2019/05/defect-detection-software-integrated-with-drone-railyard-inspection-service/ (accessed on 17 May 2019).
- Ziobro, P. Drones Are Watching: Railroad Irks Workers With Unmanned Aircraft. Available online: https://www.wsj.com/articles/drones-are-watching-railroad-irks-workers-with-unmanned-aircraft-1521028800/ (accessed on 13 August 2019).
- Administration, F.R. Remote Control Locomotive Operations: Results of Focus Groups with Remote Control Operators in the United States and Canada. Available online: https://www.fra.dot.gov/Elib/Document/1204/ (accessed on 13 August 2019).
- Reinach, S.; Fadden, S.; Gamst, F.; Acton, S.; Bartlett, S. A Comparative Risk Assessment of Remote Control Locomotive Operations Versus Conventional Yard Switching Operations; Technical Report; 2006. Available online: https://www.fra.dot.gov/Elib/Document/1203/ (accessed on 13 August 2019).
- Bangadkar, S.; Dhane, P.; Nair, S.; Kutty, K. Mapping matrix for perspective correction from fish eye distorted images. In Proceedings of the 2011 International Conference on Recent Trends in Information Technology (ICRTIT), Chennai, India, 3–5 June 2011; pp. 1288–1292. [Google Scholar]
- Shrestha, P.L.; Hempel, M.; Santos, J.; Sharif, H. A Multi-Sensor Approach for Early Detection and Notification of Approaching Trains. In Proceedings of the 2014 Joint Rail Conference, Colorado Springs, CO, USA, 2–4 April 2014; American Society of Mechanical Engineers: New York, NY, USA, 2014; p. V001T06A003. [Google Scholar]
- Santos, J.; Hempel, M.; Sharif, H. Sensing techniques and detection methods for train approach detection. In Proceedings of the 2013 IEEE 78th Vehicular Technology Conference (VTC Fall), Las Vegas, NV, USA, 2–5 September 2013; pp. 1–5. [Google Scholar]
- Shrestha, P.L.; Hempel, M.; Rezaei, F.; Rakshit, S.M.; Sharif, H. A classification tree-based system for multi-sensor train approach detection. In Proceedings of the 2015 IEEE Wireless Communications and Networking Conference (WCNC), New Orleans, LA, USA, 9–12 March 2015; pp. 2161–2166. [Google Scholar]
- Garmatyuk, D.; Schuerger, J.; Kauffman, K. Multifunctional software-defined radar sensor and data communication system. IEEE Sens. J. 2010, 11, 99–106. [Google Scholar] [CrossRef]
- SDR-KIT 580AD|Ancortek Inc. Available online: http://ancortek.com/sdr-kit-580ad (accessed on 17 May 2019).
Figure 1.
Scenario illustrating some of the challenges.
Figure 1.
Scenario illustrating some of the challenges.
Figure 2.
Image processing time for proposed algorithm on different resolution and interpolation.
Figure 2.
Image processing time for proposed algorithm on different resolution and interpolation.
Figure 3.
Mean time to process for conventional vs. proposed algorithm for image processing.
Figure 3.
Mean time to process for conventional vs. proposed algorithm for image processing.
Figure 4.
Raw fish-eye image.
Figure 4.
Raw fish-eye image.
Figure 5.
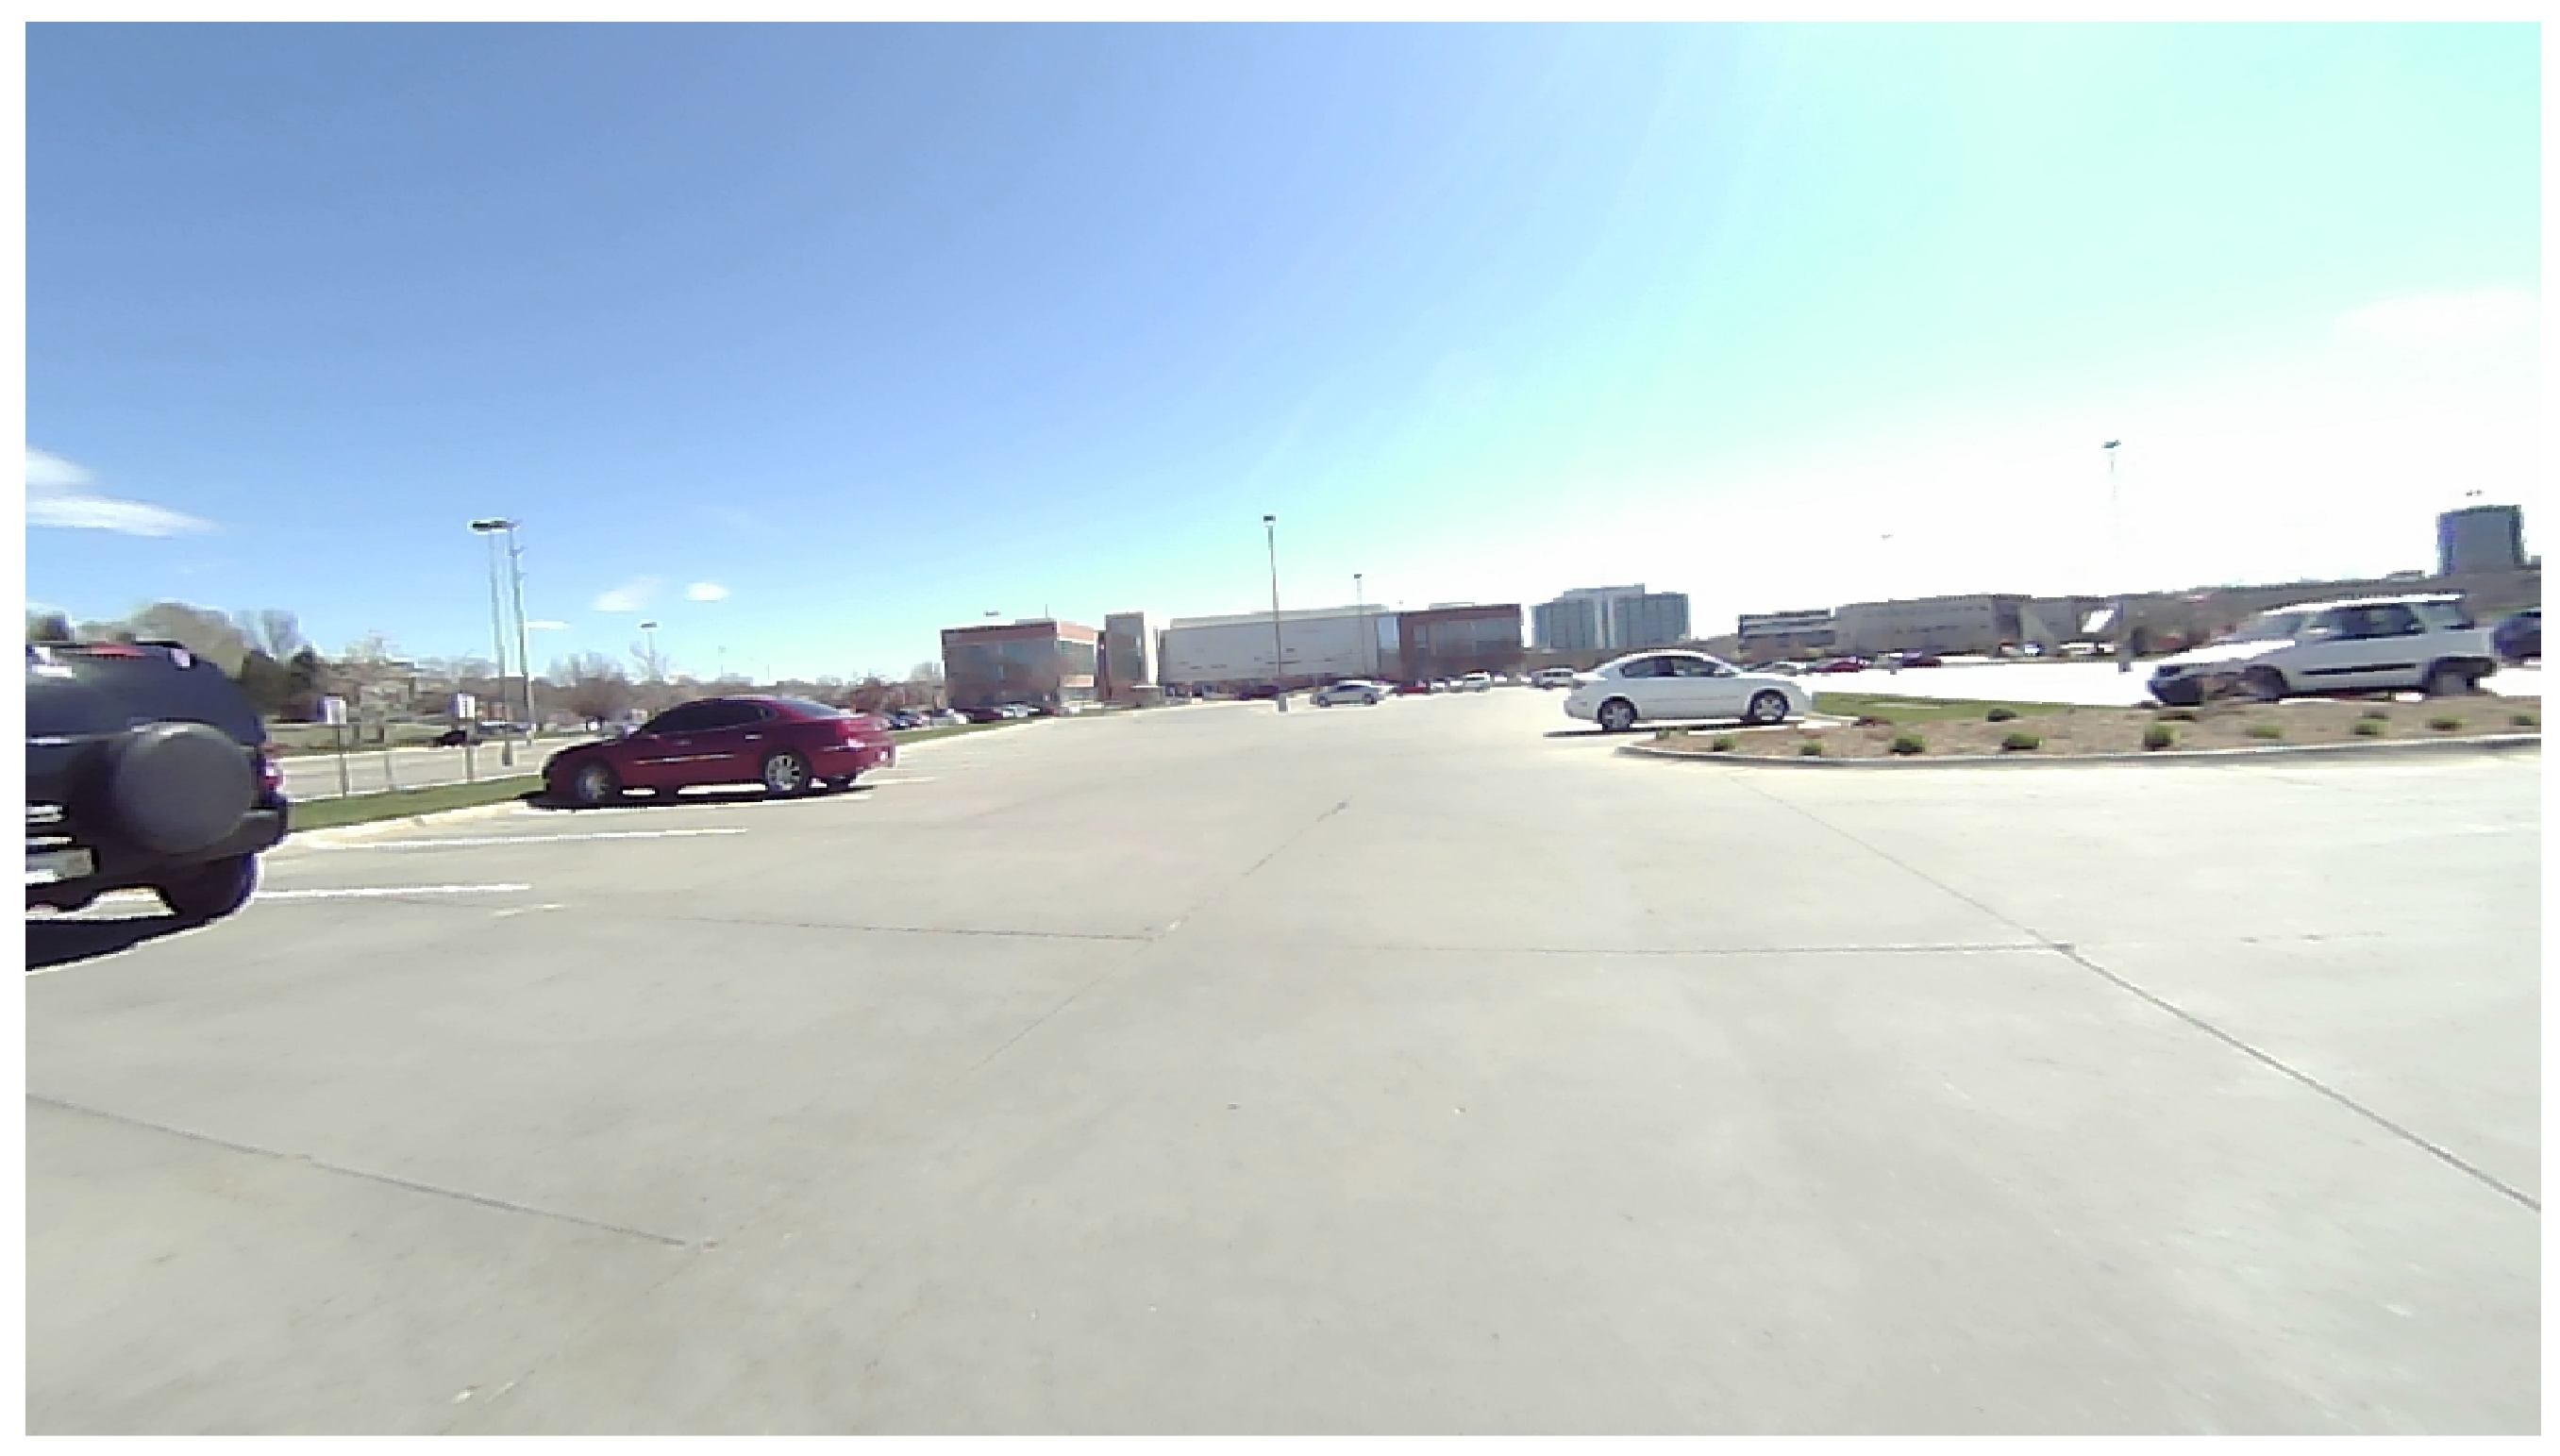
Rectilinear image.
Figure 5.
Rectilinear image.
Figure 6.
Image classification.
Figure 6.
Image classification.
Figure 7.
Calibration and multi-sensor reinforcement method.
Figure 7.
Calibration and multi-sensor reinforcement method.
Figure 8.
Stateflow for primary and secondary sensors.
Figure 8.
Stateflow for primary and secondary sensors.
Figure 9.
SDR-kit 580AD experimental setup.
Figure 9.
SDR-kit 580AD experimental setup.
Figure 10.
Signal processing steps.
Figure 10.
Signal processing steps.
Figure 11.
Phase 1 and Phase 2 field test area satellite view.
Figure 11.
Phase 1 and Phase 2 field test area satellite view.
Figure 12.
Phase 1 field test test case returns.
Figure 12.
Phase 1 field test test case returns.
Figure 13.
Phase 1 and Phase 2 SDRADAR test setup.
Figure 13.
Phase 1 and Phase 2 SDRADAR test setup.
Figure 14.
Tracking multiple objects over time.
Figure 14.
Tracking multiple objects over time.
Figure 15.
Phase 2 field test test case returns.
Figure 15.
Phase 2 field test test case returns.
Figure 16.
Train studied in the dataset.
Figure 16.
Train studied in the dataset.
Table 1.
Yard worker casualties from 2015–2018.
Table 1.
Yard worker casualties from 2015–2018.
| Role | 2011 | 2012 | 2013 | 2014 | 2015 | 2016 | 2017 | 2018 |
|---|
| Yard engineers | 55 | 53 | 44 | 53 | 57 | 39 | 42 | 48 |
| Yard conductors/foremen | 183 | 159 | 171 | 223 | 190 | 178 | 157 | 114 |
| Yard brakemen/helpers | 131 | 88 | 101 | 90 | 78 | 76 | 88 | 79 |
| Remote control operators (non-operating) | 46 | 30 | 26 | 44 | 32 | 38 | 22 | 5 |
| Remote control operators (operating) | 39 | 22 | 26 | 22 | 28 | 23 | 22 | 17 |
Table 2.
Comparison between RADAR vs. fish-eye camera.
Table 2.
Comparison between RADAR vs. fish-eye camera.
| Sensors | Range Resolution | Accuracy | Rebound | Signal Robustness | Low Visibility Operation | Update Rate | Size & Weight | Power Consumption | Disadvantage | Wearable | Ideal Operational Area | Field-of -View (FOV) |
|---|
| Fish-eye Camera | 0.5 m | Medium | High | No | Poor | 10–30 Hz | Low | Medium | Low visibility | Yes | Yards, Maintainance | Wide |
| Radar | 1 m | High | High | Yes | High | ≥10 Hz | High | High | Hidden object/Line-of-Sight (LoS) | No | Yards | Narrow |
| SDRADAR | 0.12 m | Very high | Very high | Yes | High | ≥10 Hz | Medium | Medium | Industrial, Scientific, Medical (ISM) interference | No | Yards | Narrow |
Table 3.
Comparison of processing time for fish-eye images.
Table 3.
Comparison of processing time for fish-eye images.
| Res. | | |
|---|
| 1920 × 1080 (1080p) | | |
| 1280 × 720 (720p) | | |
| 1024 × 768 (XGA) | | |
| 640 × 480 (480p) | | |
| 800 × 600 (SVGA) | | |
| 320 × 240 (240p) | | |
Table 4.
Comparison of Processing time for fish-eye images.
Table 4.
Comparison of Processing time for fish-eye images.
| Feature | Min. | Typ. | Max. | Units |
|---|
| Frequency range | 5.6 | | 6.0 | GHz |
| Expandable frequency range | 5.2 | | 6.0 | GHz |
| Bandwidth | 50 | | 400 | MHz |
| Extended bandwidth | 50 | | 800 | MHz |
| Tune voltage | 0 | | 5 | V |
| Power output | 18 | 19 | 20 | dBm |
| Conversion gain over Rx channel | 26 | 28 | 30 | dB |
| Maximum input power | | 10 | | dBm |
| Supply voltage | 4.75 | 5 | 5.25 | V |
| Supply current | 650 | 670 | 700 | mA |
| Operating temperature | −40 | | 85 | |
| Image rejection rate | 20 | | 30 | dB |
Table 5.
Initial SDRADAR parameters for field tests.
Table 5.
Initial SDRADAR parameters for field tests.
| Mode | Sweep Time | Bandwidth | Sample Number | Cycles/Period | Split Factor | Timer Granularity | Frame Rate |
|---|
| Frequency Modulated Continuous Wave (FMCW) Sawtooth | 0.5 ms | 150 MHz | 128 | 64 | 4 | 25 ms/50 ms | 10 Hz |
Table 6.
Results of tracking.
Table 6.
Results of tracking.
| Objects | No. of Segments | Tracked Instances | Lost | % Tracked |
|---|
| Vehicle | 283 | 267 | 16 | 94 |
| Pedestrian | 278 | 265 | 12 | 95 |
© 2019 by the authors. Licensee MDPI, Basel, Switzerland. This article is an open access article distributed under the terms and conditions of the Creative Commons Attribution (CC BY) license (http://creativecommons.org/licenses/by/4.0/).


