
Impact of Construction Safety Culture and Construction Safety Climate on Safety Behavior and Safety Motivation


Department of Civil and Architectural Engineering, Lawrence Technological University, 21000 West Ten Mile Rd., Southfield, MI 48075, USA
Safety 2021, 7(2), 41; https://0-doi-org.brum.beds.ac.uk/10.3390/safety7020041
Submission received: 26 March 2021
/
Revised: 12 April 2021
/
Accepted: 14 May 2021
/
Published: 18 May 2021
(This article belongs to the Special Issue Resilient Safety Culture)
Abstract
:The construction industry is known for its disappointing safety performance. Therefore, rethinking current safety management frameworks is crucial. This study assesses a newly proposed construction safety culture and climate framework that aims to overcome the present ambiguity in the definitions and measurement of construction safety culture and construction safety climate. The goal is to provide a practical construction safety culture and safety climate framework that fits the construction industry’s needs. A survey was designed to validate the proposed framework and assess its influence on safety behavior and safety motivation. The survey was completed by 275 construction practitioners. The findings suggest that the construction safety culture initiates and maintains the construction safety climate. Similarly, the construction safety culture, which is represented by the actions of upper management and safety personnel, significantly contributes to higher levels of safety behavior and safety motivation, whereas the construction safety climate does not. Accordingly, this study highlights the importance of the construction safety culture’s influence on overall workplace culture. This study’s contribution to the body of knowledge is critical to improving construction workplaces’ overall safety performance. The findings can be strategically used by construction firms to address the construction industry’s higher rates of fatal and nonfatal injuries. Finally, the results obtained support the newly proposed framework of construction safety culture and climate, which, in turn, helps the industry better manage overall site safety.
1. Introduction
There is a significant opportunity to improve safety and health management in the construction industry. The construction industry has been recognized as the most hazardous industry [1]. The United States construction industry accounts for one in five fatalities, whereas the industry only accounts for roughly 4% of the United States workforce [2,3]. Figure 1 illustrates the construction share of fatalities and workforce presence between 2010 and 2018 and displays the disproportion between them [4,5]. The rate of nonfatal injuries in the construction industry was 71% higher than that for all industries as a whole [1]. Overall, the construction industry continues to experience a disproportionate share of work-related injuries and illnesses despite efforts to reduce fatal and nonfatal occupational injuries [6]. As a result, the construction industry significantly contributes to work-related injuries and fatalities [7]. Construction safety is a challenge due to the industry’s complex nature [8]. Thus, safety is a significant concern since it is a source of considerable direct and consequential costs and reputation damage.
Safety researchers have suggested using safety culture and safety climate to improve overall occupational safety and health. The construction industry has realized the importance of safety culture and climate in reducing fatalities and injuries [9,10]. Safety culture and climate have been categorized as leading indicators that help identify opportunities to improve safety management practices [2,7]. Unfortunately, construction safety culture and climate have not been fully utilized due to a lack of clarity as well as significant confusion over definitions and measurements [11]. Specifically, the following challenges hinder the construction industry from fully utilizing safety culture and climate:
- The construction industry has adopted safety culture and climate metrics that have not been validated within the construction context [13];
- The supporting evidence for the relationship between safety culture and climate and safety performance in the construction industry suggests inconsistency [14];
- Most of the current models and measurements do not capture the uniqueness of the construction industry [7]. For example, one of the industry’s unique characteristics is that the upper management and safety personnel often oversee multiple projects that are geographically dispersed [2]. Similarly, subcontractors with different safety policies and standards are often engaged in one project [15].
It is crucial to rethink the traditional practices of safety management [16]. The construction industry is still exploring and developing better strategies to fully utilize safety culture and safety climate. Recently, a new framework that aims to provide a clear, user-friendly safety culture and climate has been suggested by Al-Bayati et al. [2]. The framework has been proposed to overcome the current challenges of safety culture and climate frameworks, and it has been tailored to the construction industry. The following steps have been followed to create the construction safety culture and climate framework by Al-Bayati et al. [2]:
- Propose practical, distinguishable definitions for construction safety culture and construction safety climate based on previously published articles (e.g., Petitta et al. [12], Casey et al. [17], and Mohamed [18]) to overcome the interchangeable use of the terms “safety culture” and “safety climate” within the construction context. Accordingly, Al-Bayati et al. [2] suggest that:
- The construction safety culture represents the policies and principles that guide safety decision making;
- The construction safety climate represents the manifestation of these principles and policies within construction workplaces.
- Identify the individuals responsible for creating and sustaining the proposed measurements. As a result, upper management and safety personnel have been recognized as responsible for the construction safety culture through the actions presented in Appendix A. On the other hand, frontline supervisors and workers have been recognized as responsible for the construction safety climate through the actions shown in Appendix A. This step aims to create distinguishable measurements for the construction safety culture and construction safety climate framework. This is vital to address and capture the uniqueness of the construction industry, in which construction firms often have centralized policies and principles (i.e., safety cultures) and decentralized workplaces (i.e., safety climates), as suggested by Sørensen et al. [19].
Overall, the new framework, unlike earlier ones, focuses on the measurable, observable actions of construction firms’ stakeholders (i.e., upper management, frontline supervisors, workers, and safety personnel). Therefore, this framework is a more practical, user-friendly framework than other construction safety culture or construction safety climate frameworks, which mainly focus on safety performance values reflected in general statements. In addition, this framework provides different definitions and measurements that address the unique nature of construction firms, in which upper management and safety personnel often oversee multiple construction sites, each with their own unique climate based on the safety actions of frontline supervisors and workers. However, more robust quantitative evidence of the new framework’s benefits is needed, and this study aims to provide it.
2. Study Objectives, Hypotheses, and Measures
This study adopts the construction safety culture and climate framework proposed by Al-Bayati et al. [2]. One of this study’s objectives is to further validate the framework. Al-Bayati et al. [2] used EMR to validate the proposed framework. However, a recent study suggested that the experience modification rate (EMR) is not a reliable safety performance measurement [20]. EMR is a lagging indicator, which means an establishment’s current policies and actions cannot be captured by reviewing its EMR. Thus, this study aims to validate the framework with better safety performance measurements. Specifically, it investigates the impact of the framework on safety behavior and safety motivation. As a result, Neal and Griffin’s measurements [21] to assess safety behavior and safety motivation were adopted. Over the years, many researchers have adopted Neal and Griffin’s measurements [21], such as He et al. [22], Yu et al. [23], and Seo et al. [24]. Appendix B shows the items that will be used to measure safety behavior and safety motivation.
According to Neal and Griffin [21], safety behavior consists of (1) safety compliance, which refers to the activities that firms’ members carry out to maintain workplace safety, and (2) safety participation, which refers to the actions that firms’ members often perform to develop a safe environment. Superior safety behavior is a direct result of effective safety education and enforcement efforts. Education and enforcement are often initiated by safety personnel and funded by upper management. In addition, superior field safety behavior will not be achieved without cooperation from workers and frontline supervisors. Thus, safety behavior is a sufficient metric to validate and further understand the impact of the proposed construction safety culture and climate framework.
On the other hand, safety motivation refers to firm members’ willingness to provide higher safety performance [25]. Safety motivation includes penalties, peer pressure, and incentive programs [26,27]. Workers and supervisors who are not motivated tend to disobey safety regulations and neglect hazards [28].
Study Hypotheses and Measures
A significant proportion of the construction safety climate is explained by the construction safety culture [2]. This study aims to understand how construction safety culture directly and indirectly (i.e., through the construction safety climate) influences safety behavior and safety motivation. Accordingly, the current study focused on testing the following hypotheses:
Hypothesis 1 (H1).
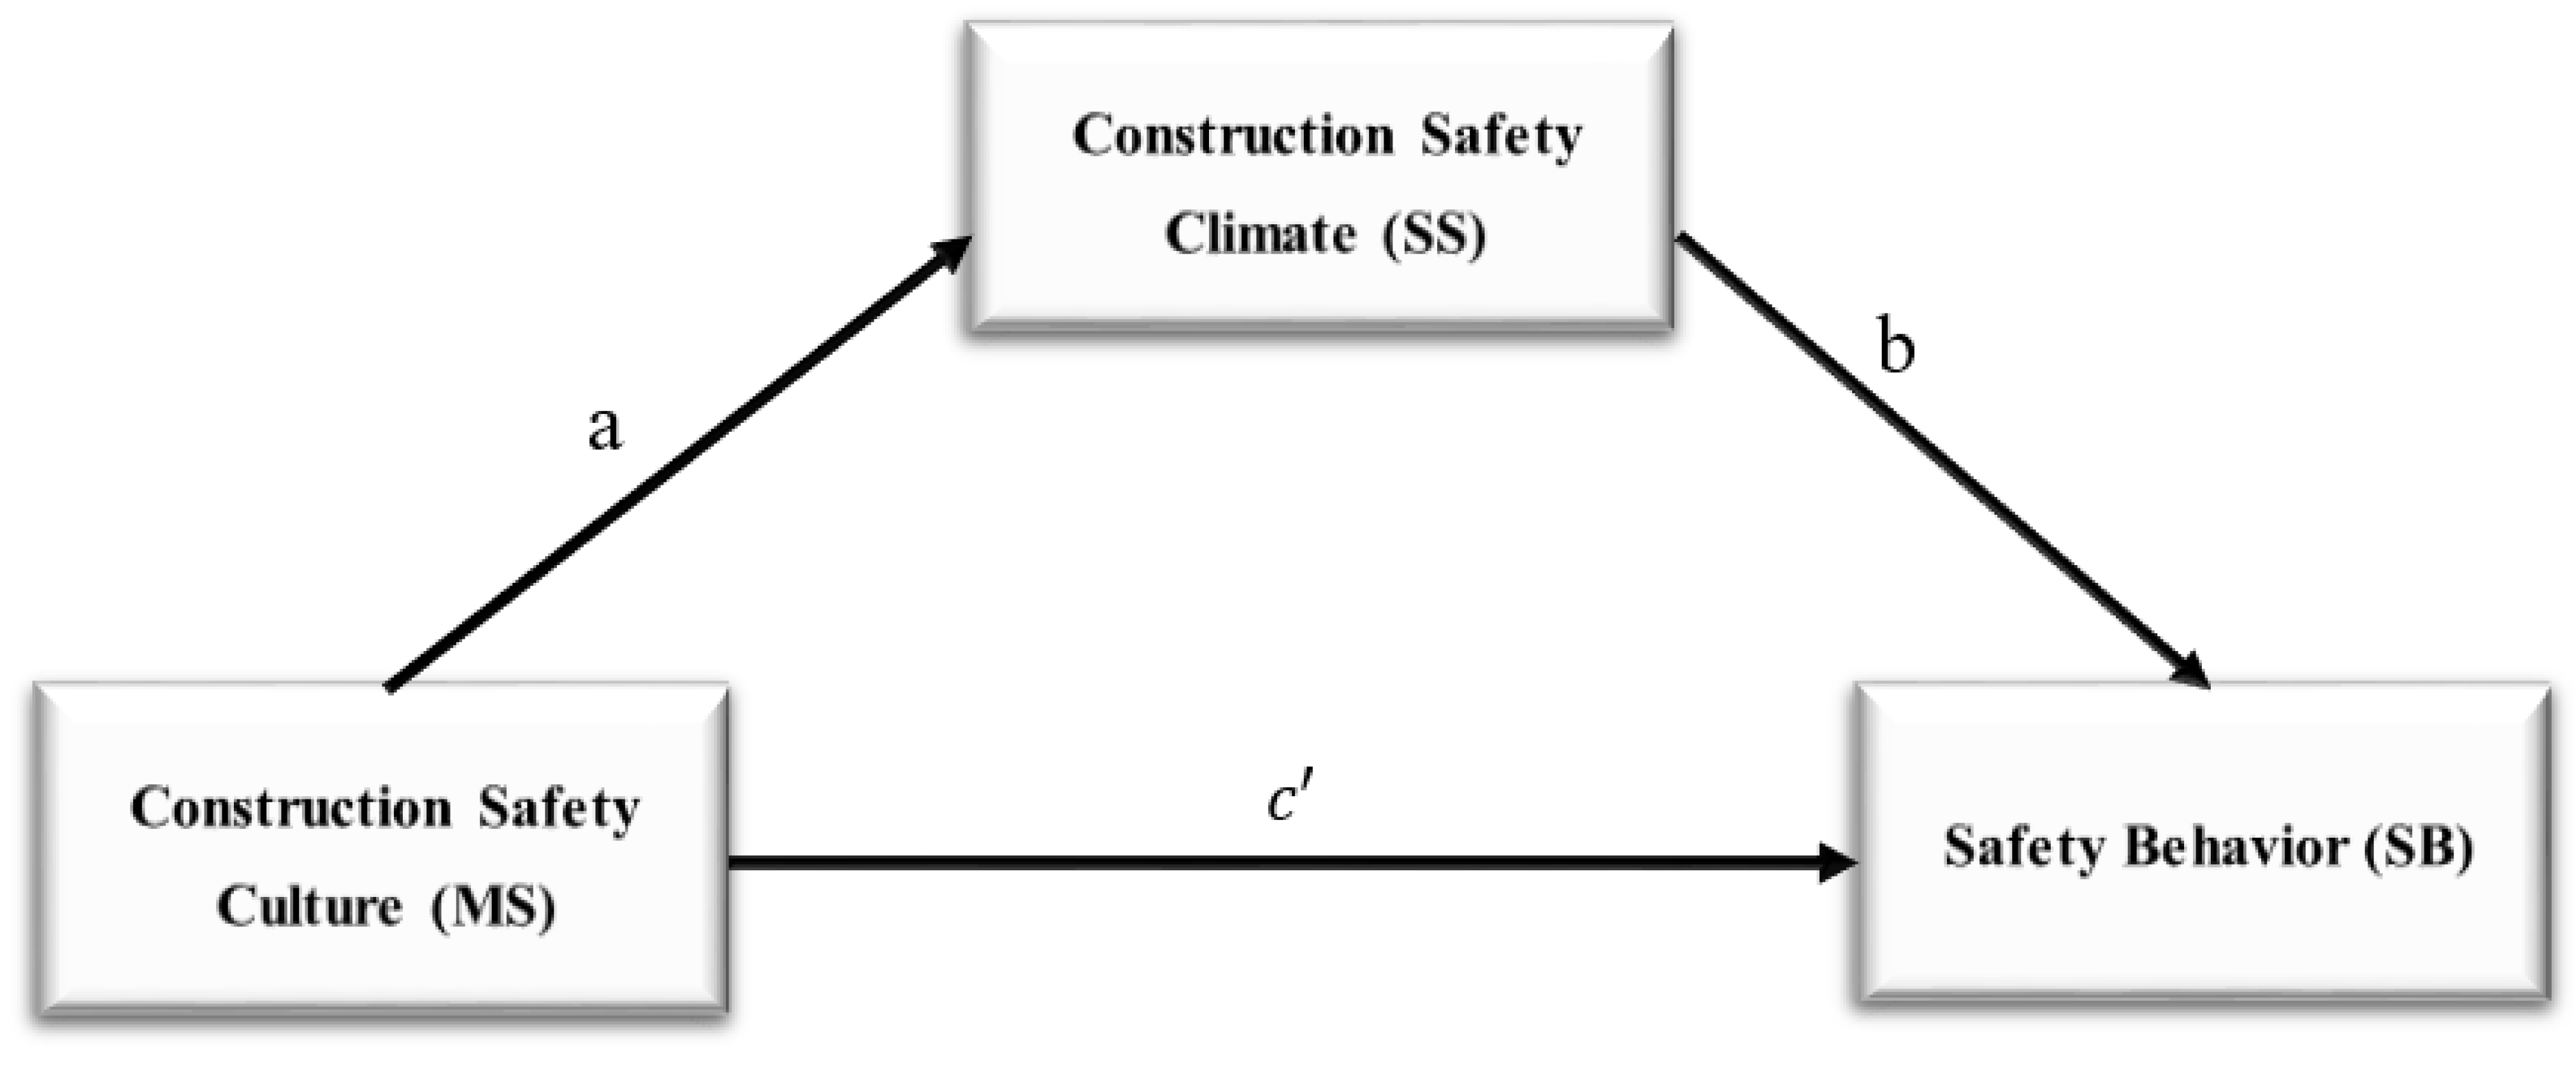
Construction safety culture (MS) is directly linked to safety behavior (SB), such that a positive safety culture will be associated with superior safety behavior levels. In addition, construction safety culture is indirectly linked to safety behavior through construction safety climate (SS), such that a positive safety culture will result in a positive construction safety climate, which, in turn, improves overall safety behavior (see Figure 2).
Hypothesis 2 (H2).
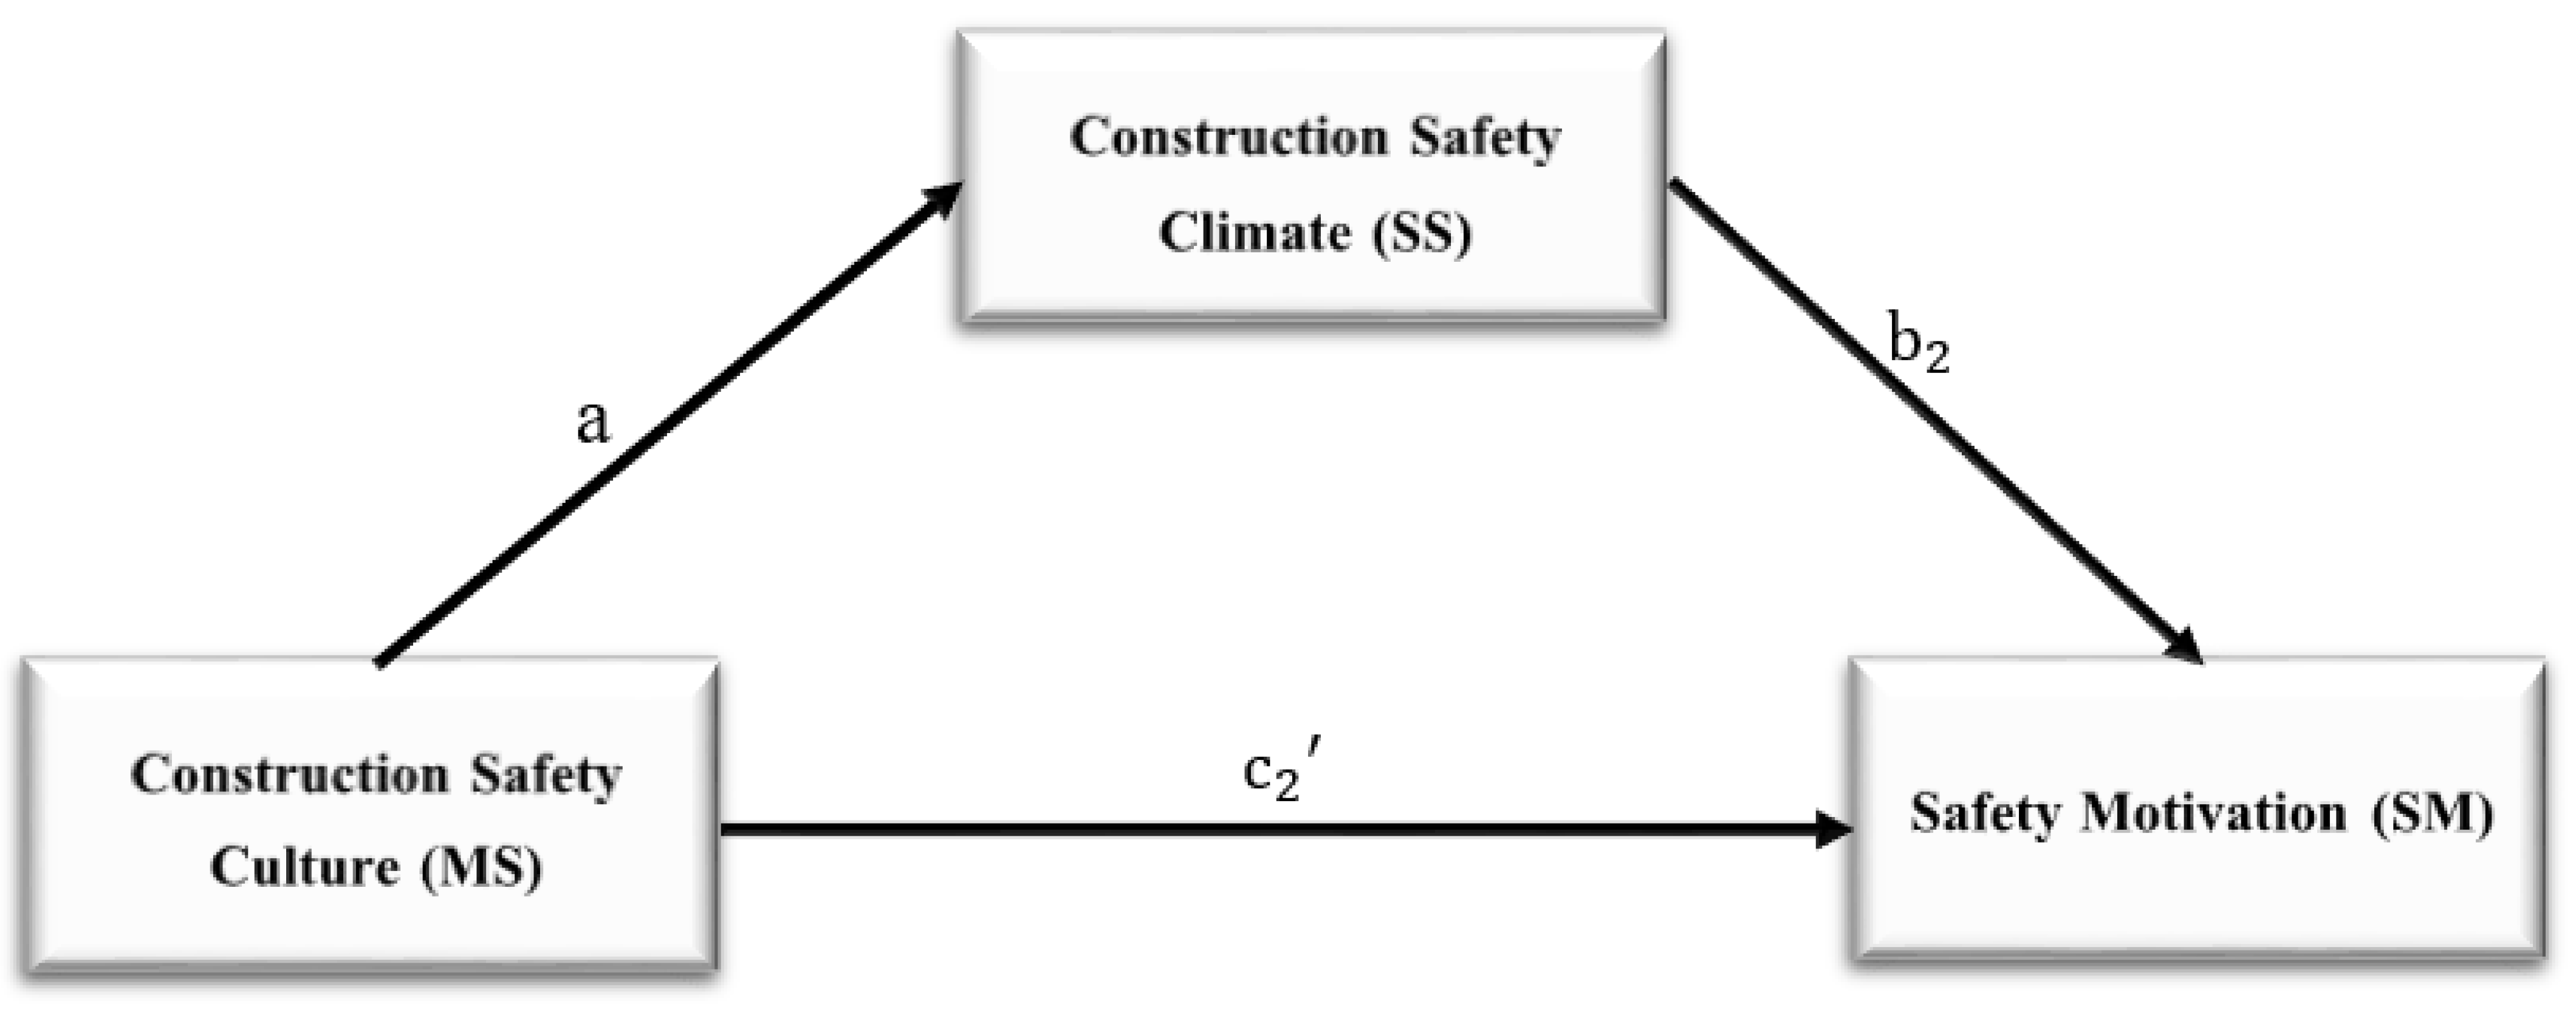
Construction safety culture (MS) is directly linked to safety motivation, such that a positive safety culture will be associated with a superior safety motivation (SM) level. In addition, construction safety culture is indirectly linked to safety motivation through construction safety climate (SS), such that a positive safety culture will result in a positive construction safety climate, which, in turn, improves overall safety motivation (see Figure 3).
In these two models, SS will mediate the effect of MS on SB and SM. The mediation is ultimately a causal explanation that assumes SS is causally located between MS, on the one side, and SB and SM, on the other side. The actual commitment of upper management and the safety personnel’s competency (i.e., MS) is the only way to achieve higher safety performance levels in the field (i.e., safety climate). Based on Figure 2 and Figure 3, c’ and c2′ estimate the direct effect of MS on SB and SM, respectively. The value of a quantifies how much two cases that differ by one unit on MS are estimated to differ on SS, while b and b2 quantify how much two cases that differ by one unit on SS but that are equal on MS are estimated to differ by b unit on SB and b2 unit on SM. The indirect effect of MS on SB through SS is the product of a and b. Similarly, the indirect effect of MS on SM through SS is the product of a and b2. Finally, the total effect partitions how differences in MS will affect SB and SM. The two hypotheses will be mathematically tested using the regression models presented in Equations (1)–(3).
where MS is a measure of construction safety culture; SS is a measure of construction safety climate; SB is a measure of safety behavior; SM is a measure of safety motivation; , , and are regression intercepts; are the regression coefficient that captures the effect on the respective outcomes; and , , and are the errors in the estimation of SS, SB, and SM, respectively.
The MS value represents the average value of the scores of upper management and safety personnel actions shown in Appendix A. Similarly, the SS value represents the average value of the scores of frontline supervisors and workers’ involvement actions outlined in Appendix A. Finally, SB and SM values represent the averages of the scores of the variables presented in Appendix B. To obtain the average scores of MS, SS, SB, and SM, the average score across the items related to each factor will first be computed. Next, the average of the computed averages across the responses will be calculated to obtain a unique score. Equations (4) and (5) show an example of how MS (i.e., the influence of upper management and safety personnel) will be calculated. The same steps will be followed to calculate SS, SB, and SM.
3. Research Methodology
An online questionnaire was created to achieve the study objectives. The questionnaire was pretested by several construction practitioners to ensure its clarity, which resulted in a revised questionnaire. This study uses a numerical rating scale (1 to 10 scale) to assess the existence of the variables of MS and SS, where 1 indicates the nonexistence of the variable, and 10 indicates the absolute existence of it. A similar scale is used to score the variables of SB and SM, where 1 means totally disagree, and 10 means totally agree. The author believes this scale is compatible with the statistical methods that will be used in the study. This scale provides Gaussian distributed data, whereas the Likert rating scale provides ordinal data. The Likert technique is often used in similar studies and produces an ordinal scale that generally is not compatible with parametric statistical tests [29,30]. Lawrence Technological University’s Human Subject Institutional Review Board (HSIRB) reviewed and approved the research protocol in October 2019.
A convenient sample questionnaire was administered over a period of 1.5 months, and 275 valid responses were collected. The online survey was distributed through a network of construction practitioners who asked their colleagues to participate. The study sample is a convenience sample, which is a widespread research methodology in construction research due to the infeasibility of other sampling plans, such as probability-based sampling. Respondents were presented with a participant information and consent form, which led to the questionnaire only after the respondent voluntarily agreed to participate. Furthermore, participants who voluntarily consented to complete the questionnaire were free to withdraw from the study at any time.
4. Survey Findings
The participants came from construction firms in various geographical areas, including North Carolina (33.1%), Virginia (7.3%), Illinois (5.5%), New Mexico (5.1%), South Carolina (3.6%), Florida (3.6%), New York (2.2%), Michigan (1.5%), multiple states (9.5%) and others (28.5%), including Ohio, Colorado, and Qatar. The participating firms included residential (22.2%), commercial (48.7%), special trades contract (13.8%), and civil and heavy construction (15.3%). The number of employees within participating firms was as follows: Overall, 10.2% had fewer than 10 employees, 18.5% had between 10 and 50 employees, 19.6% had between 50 and 100 employees, 24.7% had between 100 and 250 employees, and 26.9% had more than 250 employees. The revenue of respondents’ firms was as follows: In total, 21.1% had less than USD 500,000 per year, 8.4% had between USD 500,000 and USD 1 million per year, 24.7% had between USD 1 million and USD 10 million per year, and 45.8% had more than USD 10 million per year. The participants’ job descriptions were as follows: In total, 19.6% were workers, 23.6% were supervisors, 35.6% were management, and 21.1% were safety personnel. Finally, the answers to the question about the participants’ experiences indicate that 23.7% had fewer than five years of experience, 22.9% had between four and 10 years of experience, and 53.5% had more than 10 years of experience. Overall, the study sample seems to be representative of the construction industry’s firms and workforce, which strengthens the overall study findings and contribution.
Table 1 illustrates the descriptive data and correlations between the study factors. Construction safety culture is positively correlated with both SB (r = 0.7) and SM (r = 0.53). These values are higher than the correlation values with construction safety climate. On the other hand, the scales that have been used to measure the study factors have a high level of internal consistency, as determined by a Cronbach’s alpha (α) (see Table 1). Cronbach’s alpha (α) is used to determine if the scale is reliable. The values of α presented in Table 1 suggest that the scales that have been used in this study are reliable. The results of the hypotheses tests, as well as the variable rankings, are discussed below.
4.1. Effect of Construction Safety Culture and Safety Climate on Safety Behavior
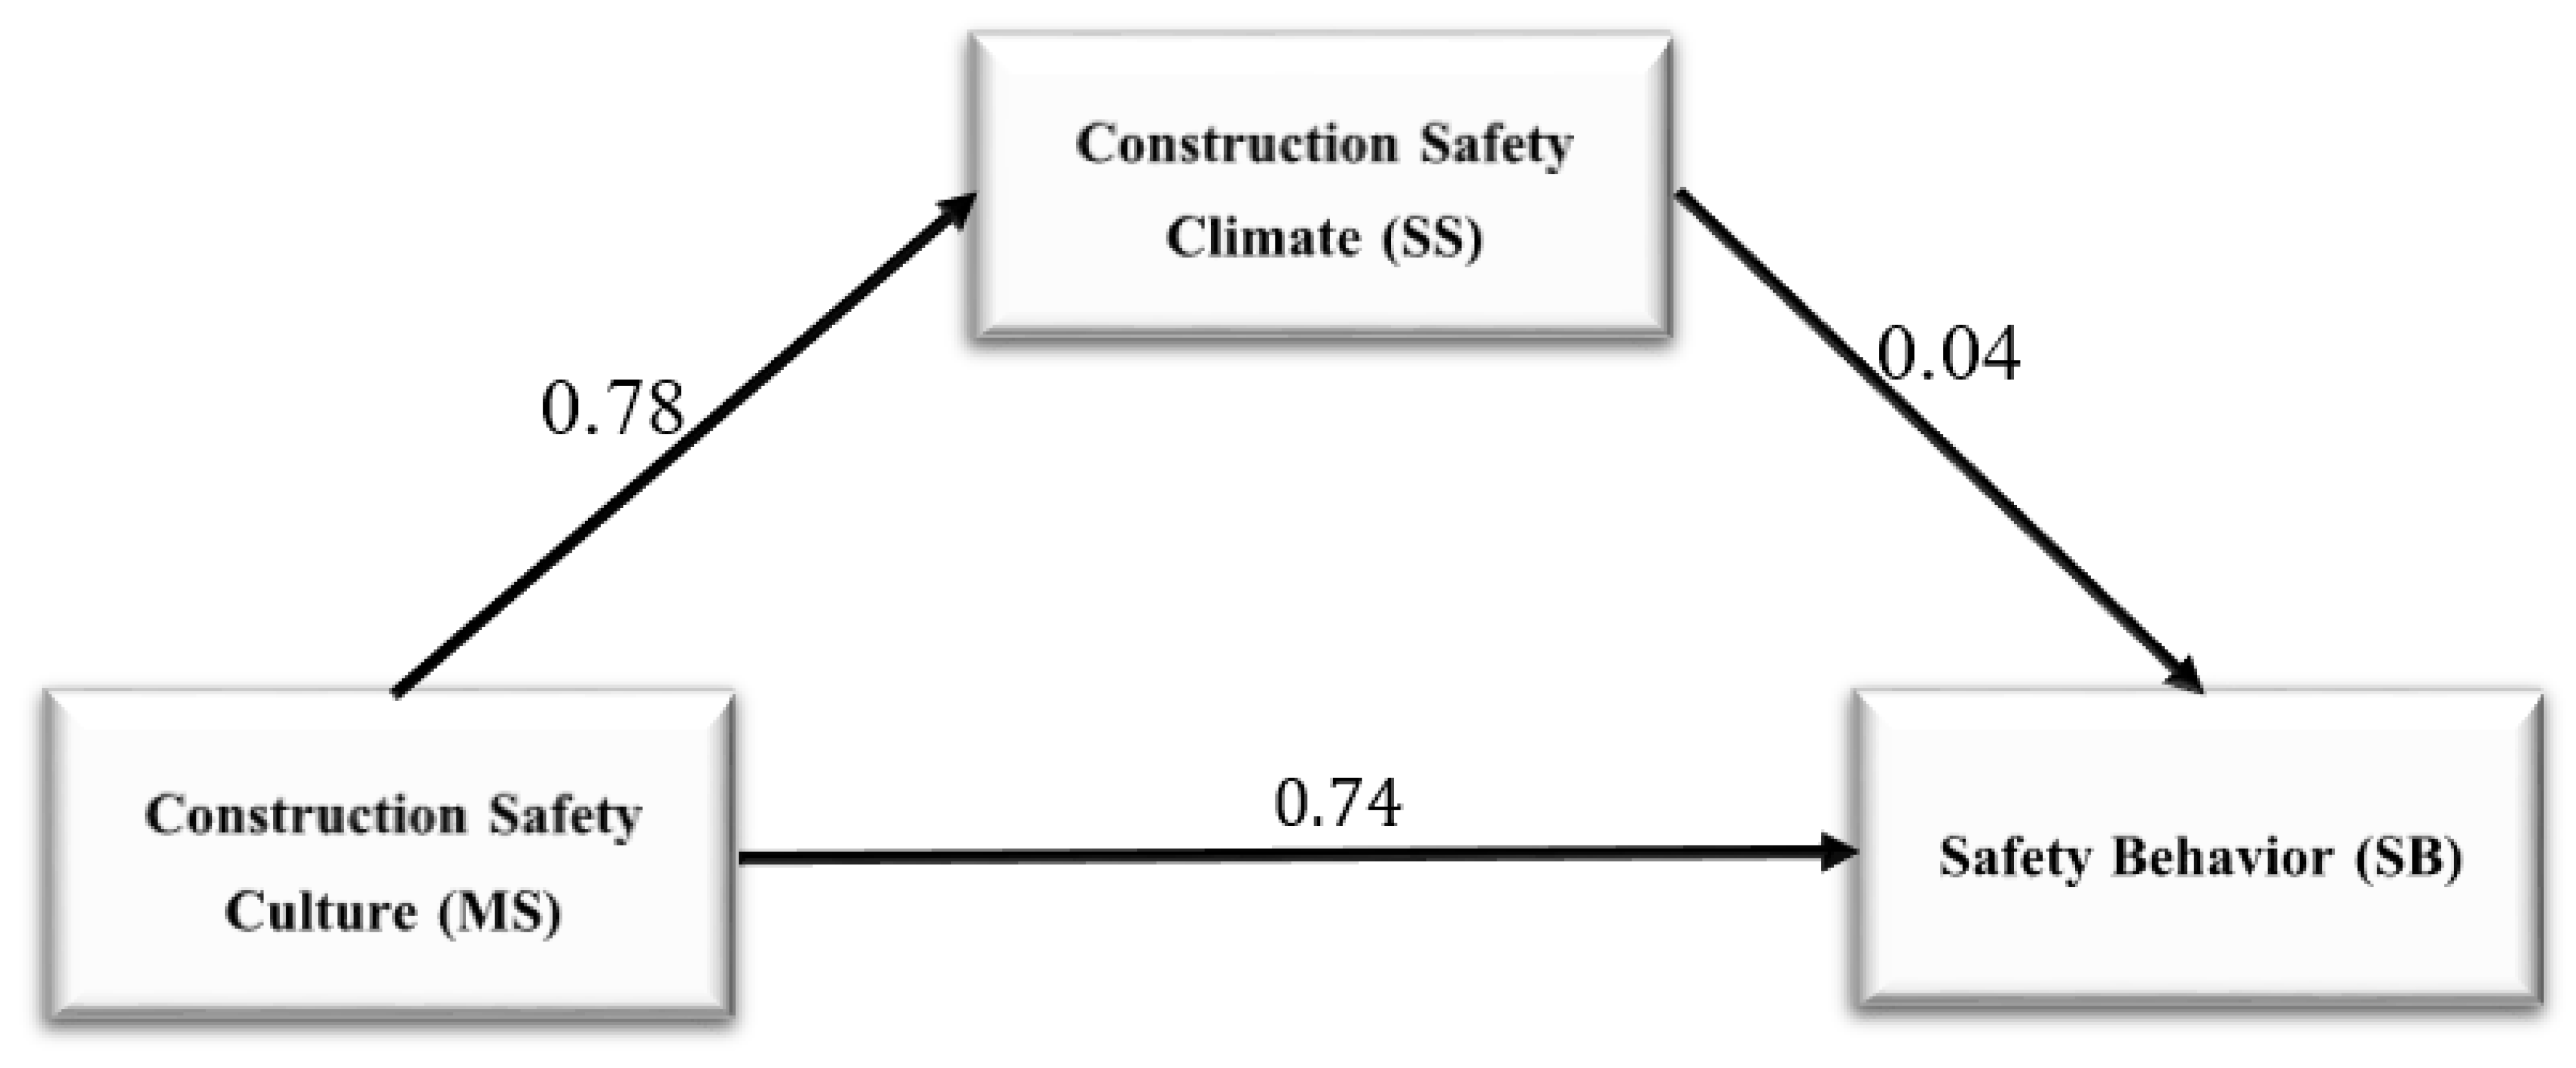
The first hypothesis predicted that MS positively, directly, and indirectly through SS, influences SB. The regression analysis results are presented in Figure 4 [a = 0.78, b = 0.04, and c’ = 0.47]. The value of the coefficient a (0.78) is significantly different from zero [t = 20.39, p < 0.0001] and suggests that two firms that differ by one unit in their MS are estimated to differ by 0.78 in their SS (see Table 2). In other words, a firm’s construction safety culture positively influences its safety climate [F (1; 273) = 416.123, p < 0.001]. In addition, the R2 (i.e., 0.60) suggests that roughly 60% of the variation in SS could be explained by MS (see Table 2). Accordingly, Equation (1) can be presented as follows: SS = 1.24 + 0.78 MS.
Table 3 shows the regression results of predicting SB from both MS and SB. The results suggest that a significant proportion of the total variation in SB can be explained by MS and SS [F (2, 272) = 130.58, p < 0.001]. For MS, the unstandardized slope, which represents the direct effect (i.e., ), was found to be 0.47, which is significantly different from zero [t = 9.45, p < 0.001]. This suggests that for every one-point increase in the MS scores, when SS is held constant, the SB score increases by roughly 0.47 of a point. For SS, the unstandardized slope (i.e., b) was found to be 0.04, which is not statistically significant [t = 0.9, p = 0.36]. The R2 value (i.e., 0.49) of the framework indicates that approximately 49% of the variation in SB could be explained by MS and SS (see Table 3).
The indirect effect of MS on SB via SS was found to be 0.031. The bootstrapping process was adopted to estimate the 95% confidence interval. The confidence interval includes zero as a potential value for the indirect effect, suggesting that the indirect effect is not statistically significant. The 95% confidence interval was found to be from −0.0627 to 0.1263. This means the hypothesis that SS mediates the effect of MS on SB should be rejected.
Finally, the total effect of MS on SB is presented in Table 4. The total effect is the effect of MS on BS when the mediator is not present in the model. The result indicates that when SS is not in the model, MS predicts SB to a statistically significant degree. The total effect value of 0.5 is significantly different from zero [t = 16.14, p < 0.0001] and suggests that two firms that differ by one unit in their MS are estimated to differ by 0.5 in their SS (see Table 4). In other words, a firm’s construction safety culture positively influences its SB [F (1; 273) = 260.51, p < 0.001]. In addition, the R2 value of 0.49 suggests that roughly 49% of the variation in SB could be explained by MS. Accordingly, the following equation could be used to determine the SB based on MS score alone: SB = 4.71 + 0.5 MS. Clearly, the significance of the model presented in Figure 3 is a result of the impact of MS, not SS (see R2 in Table 3 and Table 4).
4.2. Effect of Construction Safety Culture and Safety Climate on Safety Motivation
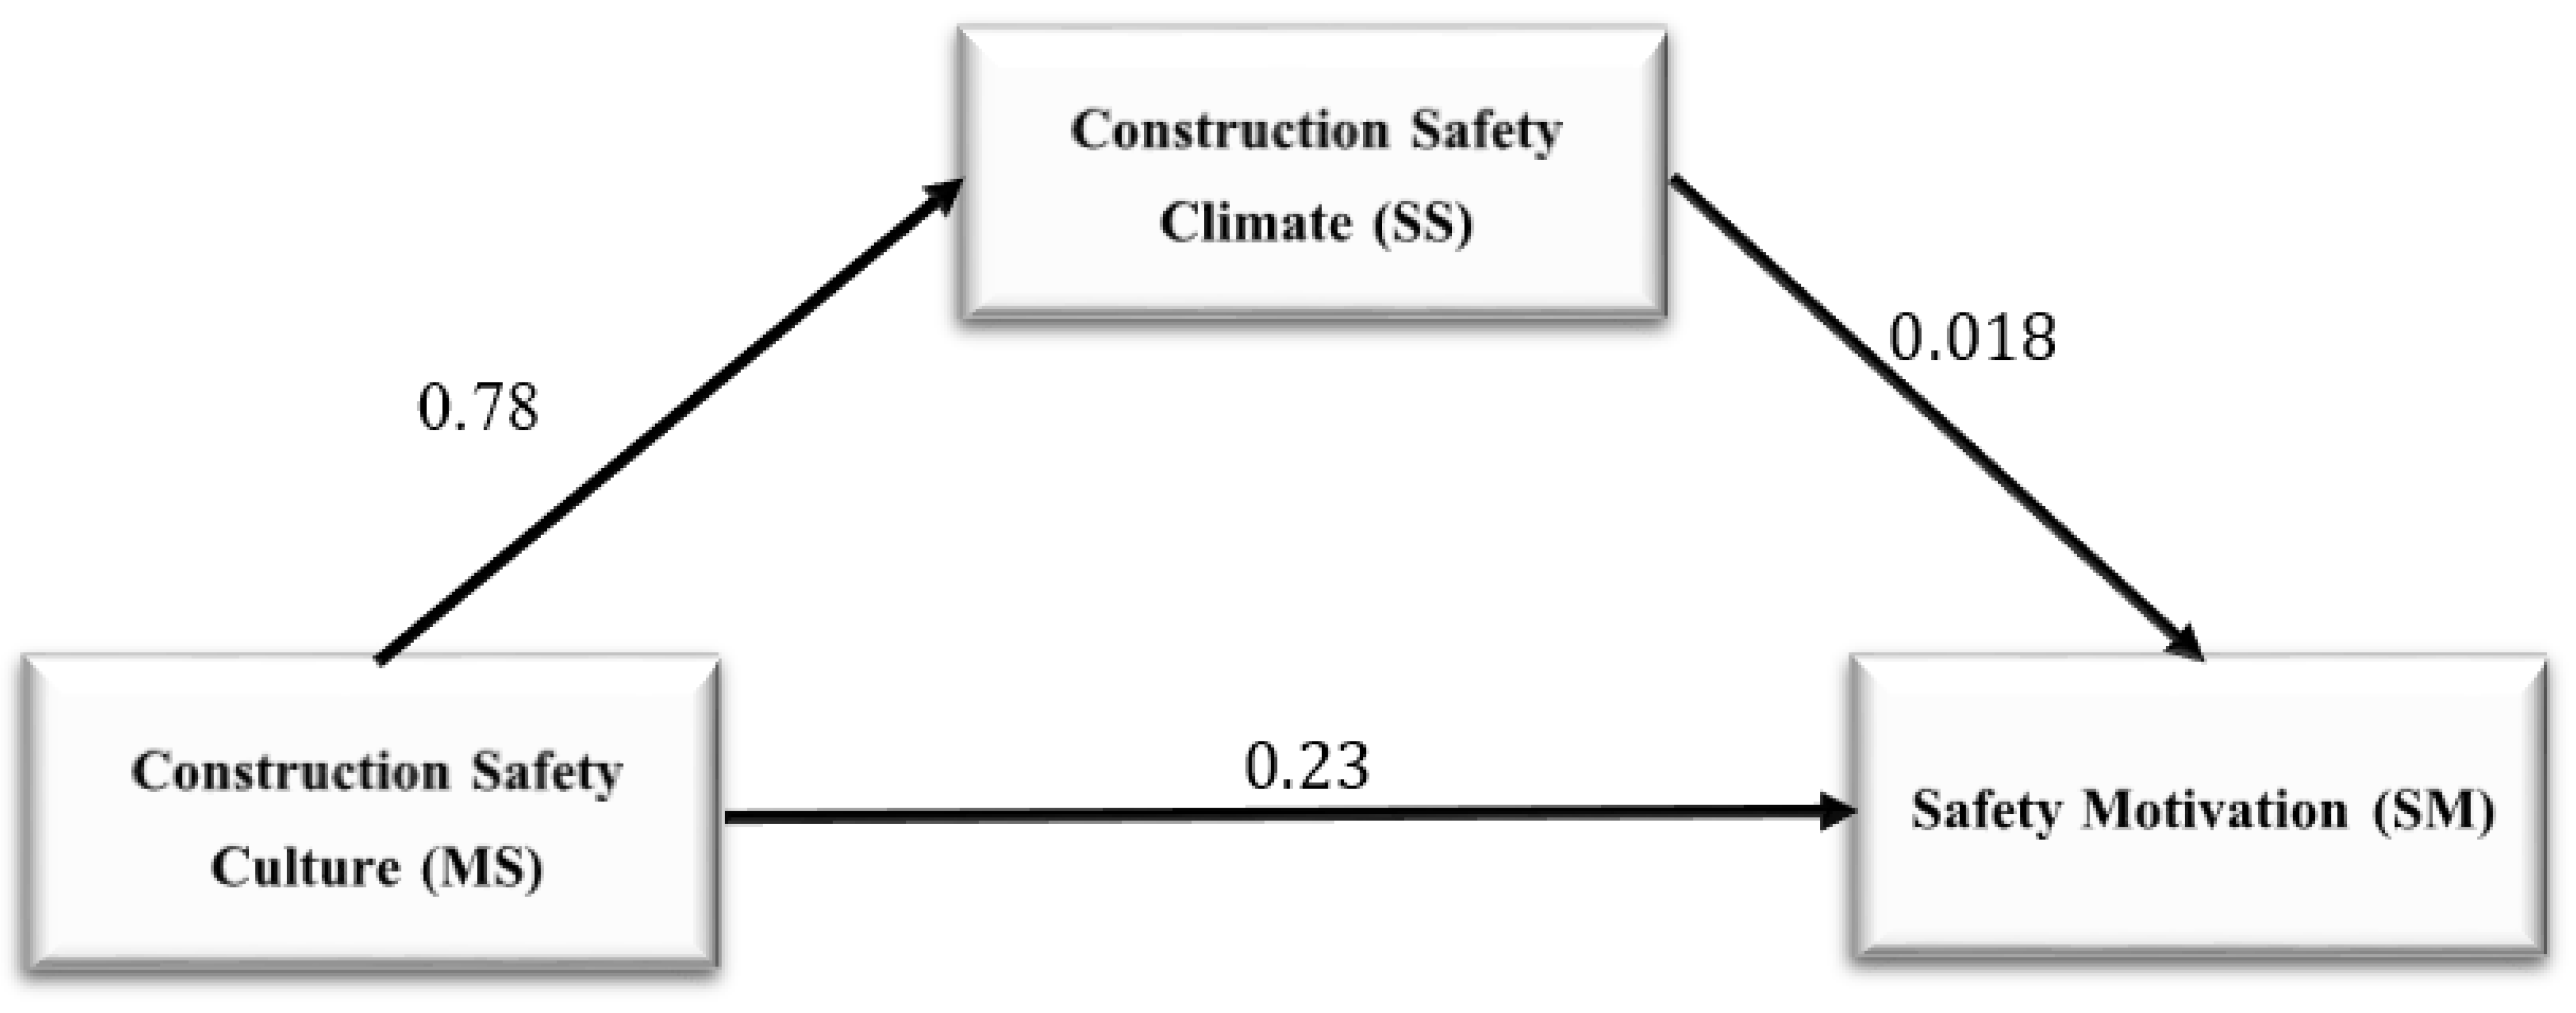
The second hypothesis predicted that MS is linked to SM directly and indirectly through SS. The regression analysis results are presented in Figure 5 [a = 0.78, b2 = 0.018, and = 0.23]. The correlation between MS and SS is similar to the information presented in the previous subsection. Table 5 shows the regression results of predicting SM from both MS and SB. The results suggest that a significant proportion of the total variation of SB can be explained by MS and SS [F (2, 272) = 53.24, p < 0.001]. For MS, the unstandardized slope, which represents the direct effect (i.e., ), was found to be 0.23, which is significantly different from zero [t = 6.12, p < 0.001]. This suggests that for every one-point increase in the MS scores, when SS is held constant, the SM score increases by roughly 0.23. For SS, the unstandardized slope (i.e., b) was found to be 0.018, which is again not statistically significant [t = 0.47, p = 0.634]. Overall, the R2 of 0.28 indicates that approximately 28% of the variation in SM could be explained by MS and SS.
The indirect effect of MS on SM (i.e., the effect via SS) was found to be 0.014. The bootstrapping process was adopted to estimate the 95% confidence interval. The 95% confidence interval was found to be from −0.0415 to 0.0962. Thus, the indirect effect is not statistically different from zero with a 95% confidence interval. This means the hypothesis that SS mediates the impact of MS on SM should be rejected.
Finally, the total effect of MS on SM is presented in Table 6. The total effect is the effect of MS on BS when the mediator is not present in the model. The result indicates that when SS is not in the model, MS predicts SM to a statistically significant degree. The total effect value of 0.25 is significantly different from zero [t = 10.32, p < 0.0001] and suggests that two firms that differ by one unit in their MS are estimated to differ by 0.25 in their SM (see Table 6). In other words, a firm’s construction safety culture positively influences its SM [F (1; 273) = 106.55, p < 0.001]. In addition, the R2 value of 0.28 suggests that roughly 28% of the variation in SM could be explained by MS. Accordingly, the following equation could be used: SM = 7.64 + 0.25 MS. Similar to what was reported in the previous subsection, the significance of the model presented in Figure 4 is a result of the impact of MS, not SS (see R2 in Table 5 and Table 6).
5. Contribution and Practical Recommendations
This study represents the first attempt to examine the impact of the construction safety culture and climate framework on safety behavior and safety motivation. Thus, this study makes critical contributions to construction safety management. Furthermore, the study reveals the statistically significant impact of construction safety culture on safety behavior and safety motivation. Therefore, firms striving to promote superior safety performance can benefit from the construction safety culture framework presented in this study. The study demonstrates a precise mechanism through which construction safety culture affects safety climate, safety behavior, and safety motivation. However, the results indicate that the impact of safety climate is not as statistically significant as the impact of safety culture, emphasizing the role and vital contribution of upper management and safety personnel (i.e., construction safety culture) in terms of overall safety performance. This could also be explained by the fact that the variables of construction safety climate are implied within safety behavior variables. This is true because both factors are related to the safety actions of field personnel.
The overall findings suggest that construction firms can improve safety behavior by adopting the presented framework. Thus, it can be concluded that unsafe behavior results from the absence or lack of an influential construction safety culture. Due to its vital contribution to overall site safety, including safety behavior, the focus of future research studies and practical remedies should be the overall safety culture. For years, construction workers’ unsafe behaviors have been considered a leading cause of accidents [31]. In general, researchers have suggested that unsafe behaviors contribute to roughly 80% of construction incidents [32]. However, this study reveals the significant influence of construction safety culture on safety behavior. Accordingly, unsafe behavior should be considered the direct cause of incidents. On the other hand, construction safety culture should be viewed as the root cause of incidents due to its significant influence on safety behavior. Management shortcomings lead to unsafe behavior, which increases the likelihood of fatal and nonfatal occupational injuries. As a result, it is the lack of an influential construction safety culture, rather than unsafe behaviors, that ultimately results in frequent construction incidents.
Firms with higher levels of safety culture also have higher safety climate scores. This is particularly important in construction workplaces, where more than one safety climate may exist due to the presence of several subcontractors working in one workplace. It is expected that larger construction firms (e.g., general contractors) positively impact the safety climates of the smaller construction firms (e.g., subcontractors) that work for them. However, unsafe subcontractors may not only affect their employees but also create circumstances that increase the likelihood of another worker being injured later [21]. Therefore, a superior safety culture could overcome the poor safety climate that sometimes results from subcontractors’ differing safety cultures. Thus, utilizing the new construction safety culture framework as a safety prequalifier could ensure higher safety performance levels. This understanding could be a game changer in prequalifying contractors and subcontractors in the construction industry. As has been highlighted by Al-Bayati et al. [20] and Wilbanks [33], the current prequalifying practices seem to be insufficient and rely on questionable lagging indicators, such as EMR.
Finally, the validation this study delivers for the recently published research is vital. Replication studies contribute significantly to the validity and reliability assessments of already published works [34]. The high rate of nonreplication of research discoveries increases concerns that most current published research findings are false [35]. Validity and reliability assessments of published research studies should be considered a high priority to reduce false findings and increase public trust in safety research.
6. Study Limitations
There are a few limitations that must be acknowledged despite this study’s contributions. First, this study is based on a cross-sectional survey. While the study findings are sufficient to draw inferences with respect to associations, there is a need for a longitudinal research study to reliably demonstrate causal relationships between the examined aspects. Second, the current study used a nonprobability instrument (i.e., a convenience survey) to gather data. It is questionable to generalize nonprobability survey findings [34,36]. Therefore, there is a need to duplicate the study utilizing a combination of quantitative and qualitative research (i.e., a mixed method such as follow-up interviews or focus groups) to verify the framework’s reliability and validity. Specifically, qualitative data can provide vital information on the obstacles that may hinder the utilization of the proposed construction safety culture and safety climate framework.
Finally, the current structure of the safety behavior and motivation measurements presented in Appendix B could contribute to measurement bias. Participants who are asked to report their safety behavior (e.g., I feel that it is important to maintain safety at all times) may tend to overscore their responses. The overscoring could be explained by a phenomenon termed “social desirability,” which is the tendency to respond to questions in the manner that is likely to be most socially sanctioned [37]. Thus, it is recommended to consider this limitation while reviewing the study findings.
7. Concluding Remarks
This research is the first quantitative assessment of the newly proposed construction safety culture and safety climate framework. The assessment evaluates the impact of the framework on safety behavior and safety motivation. The focus on measurable, observable metrics is the core of the investigated construction safety culture and climate framework. This study’s findings deliver a critical understanding of the construction safety culture metrics and their influence on safety climate, safety behavior, and safety motivation. The results strongly suggest that construction safety culture is fundamental to ensuring an ideal safety climate, excellent safety behavior, and acceptable safety motivation. This study’s overall findings provide a thoughtful, crucial understanding of the contributions of construction firm members (i.e., workers, upper management, frontline supervisors, and safety personnel) to overall safety performance. This understanding will undoubtedly improve construction safety management and reduce fatal and nonfatal injuries in the industry.
Funding
This research received no external funding.
Institutional Review Board Statement
The study was conducted according to the guidelines of the Declaration of Helsinki, and approved by the Institutional Review Board of Lawrence Technical University on 3 October 2019.
Informed Consent Statement
Informed consent was obtained from all subjects involved in the study.
Data Availability Statement
Some or all data, models, or codes that support the findings of this study are available from the corresponding author upon reasonable request.
Conflicts of Interest
The authors declare no conflict of interest.
Appendix A

Table A1.
Construction Safety Culture and Safety Climate Measurement.
| Factor | Variables | ||
|---|---|---|---|
| Construction Safety Culture | Upper Management (UM) | UM1 | Upper management has a strong core of safety values that guide decision making. |
| UM2 | Upper management responds to all incidents in a positive manner and uses them as a learning opportunity. | ||
| UM3 | Upper management allocates time and funds when corrective safety actions are required. | ||
| UM4 | Upper management adheres to all safety requirements and procedures. | ||
| UM5 | Upper management considers safety an integral part of the job, which receives the same amount of attention as other aspects of the job. | ||
| Safety Coordinator (SC) | SC1 | Safety personnel tries to implement accident prevention techniques. | |
| SC2 | Safety personnel clearly communicates safety regulations and expectations. | ||
| SC3 | Safety personnel is approachable and receptive. | ||
| SC4 | Safety personnel strives to improve overall site safety. | ||
| SC5 | Safety personnel communicates accident reports to workers in order to prevent future accidents of similar nature. | ||
| Construction Safety Climate | Frontline Supervisors (FS) | FS1 | Frontline supervisors encourage recording and reporting all near misses. |
| FS2 | Frontline supervisors actively participate in reviewing safety procedures. | ||
| FS3 | Frontline supervisors correct unsafe conditions quickly. | ||
| FS4 | Frontline supervisors lead by example when it comes to safety. | ||
| FS5 | Frontline supervisors always ensure that workers are following proper safety regulations. | ||
| Workers Involvement (WI) | WI1 | Workers feel okay to report unsafe conditions. | |
| WI2 | Workers know how/where to file an incident report. | ||
| WI3 | Workers follow all safety policies and procedures. | ||
| WI4 | Workers’ actions suggest that they learn and apply concepts from safety training efforts. | ||
| WI5 | Workers actively participate in reviewing safety procedures. | ||
| WI6 | Workers feel confident that safety issues will be corrected if they report them. | ||
Appendix B
Table A2.
Safety Behavior and Safety Motivation measurement.
| Factor | Variables | |
|---|---|---|
| Safety motivation | I feel that it is worthwhile to put in effort to maintain or improve my personal safety | |
| I feel that it is important to maintain safety at all times | ||
| I believe that it is important to reduce the risk of accidents and incidents in the workplace | ||
| Safety Behavior | Safety compliance | I use all the necessary safety equipment to do my job |
| I use the correct safety procedures for carrying out my | ||
| I ensure the highest levels of safety when I carry out my job | ||
| Safety participation | I promote the safety program within the organization | |
| I put in extra effort to improve the safety of the workplace | ||
| I voluntarily carry out tasks or activities that help to improve workplace safety | ||
References
- Waehrer, G.M.; Dong, X.S.; Miller, T.; Haile, E.; Men, Y. Costs of Occupational Injuries in Construction in the United States. Accid. Anal. Prev. 2007, 39, 1258–1266. [Google Scholar] [CrossRef] [PubMed] [Green Version]
- Al-Bayati, A.J.; Albert, A.; Ford, G. Construction Safety Culture and Climate: Satisfying Necessity for an Industry Framework. Pract. Period. Struct. Des. Constr. 2019, 24. [Google Scholar] [CrossRef]
- Liu, D.; Jin, Z.; Gambatese, J. Scenarios for Integrating IPS–IMU System with BIM Technology in Construction Safety Control. Pract. Period. Struct. Des. Constr. 2020, 25. [Google Scholar] [CrossRef]
- U.S. Bureau of Labor Statistics. Occupational Employment Statistics. 2020. Available online: https://www.bls.gov/oes/tables.htm (accessed on 15 February 2021).
- U.S. Bureau of Labor Statistics. Census of Fatal Occupational Injuries (CFOI). 2019. Available online: https://www.bls.gov/iif/oshcfoi1.htm (accessed on 15 February 2021).
- Pandit, B.; Albert, A.; Patil, Y.; Al-Bayati, A.J. Impact of Safety Climate on Hazard Recognition and Safety Risk Perception. Saf. Sci. 2019, 113, 44–53. [Google Scholar] [CrossRef]
- Niu, M.; Leicht, R.M.; Rowlinson, S. Developing Safety Climate Indicators in a Construction Working Environment. Pract. Period. Struct. Des. Constr. 2017, 22. [Google Scholar] [CrossRef]
- Winge, S.; Albrechtsen, E.; Arnesen, J. A Comparative Analysis of Safety Management and Safety Performance in Twelve Construction Projects. J. Saf. Res. 2019, 71, 139–152. [Google Scholar] [CrossRef] [PubMed]
- Goldenhar, L.M.; Amadee, P.; Barsotti, T.; Brown, R.; O′Brien, M. Safety Culture and Safety Climate in Construction: Bridging Research and Practice. In Proceedings of the American Society of Safety Engineers (ASSE) Professional Development Conference and Exposition, Dallas, TX, USA, 7–10 June 2015. [Google Scholar]
- Hofmann, D.A.; Burke, M.J.; Zohar, D. 100 Years of Occupational Safety Research: From Basic Protections and Work Analysis to a Multilevel View of Workplace Safety and Risk. J. Appl. Psychol. 2017, 102, 375–388. [Google Scholar] [CrossRef]
- Zohar, D.; Hofmann, D.A. Organizational Culture and Climate. In The Oxford Handbook of Organizational Climate and Culture; Schneider, B., Barbera, K.M., Eds.; Oxford University Press: New York, NY, USA, 2014. [Google Scholar]
- Petitta, L.; Probst, T.M.; Barbaranelli, C.; Ghezzi, V. Disentangling the Roles of Safety Climate and Safety Culture: Multi-Level Effects on the Relationship between Supervisor Enforcement and Safety Compliance. Accid. Anal. Prev. 2017, 99, 77–89. [Google Scholar] [CrossRef]
- Schwatka, N.V.; Hecker, S.; Goldenhar, L.M. Defining and Measuring Safety Climate: A Review of the Construction Industry Literature. Ann. Occup. Hyg. 2016, 60, 537–550. [Google Scholar] [CrossRef] [PubMed] [Green Version]
- Niu, M.; Leicht, R.; Rowlinson, S. Overview and Analysis of Safety Climate Studies in the Construction Industry. In Old and New Construction Technologies Converge in Historic San Juan, Proceedings of the Construction Research Congress, San Juan, Puerto Rico, 31 May–2 June 2016; American Society of Civil Engineers (ASCE): Reston, VA, USA, 2016; pp. 2926–2935. [Google Scholar]
- Zahoor, H.; Chan, A.P.; Utama, W.P.; Gao, R.; Memon, S.A. Determinants of Safety Climate for Building Projects: SEM-Based Cross-Validation Study. J. Constr. Eng. Manag. 2017, 143. [Google Scholar] [CrossRef]
- Zhang, J.P.; Hu, Z.Z. BIM-and 4D-Based Integrated Solution of Analysis and Management for Conflicts and Structural Safety Problems during Construction: 1. Principles and Methodologies. Autom. Constr. 2011, 20, 155–166. [Google Scholar] [CrossRef]
- Casey, T.; Griffin, M.A.; Flatau Harrison, H.; Neal, A. Safety Climate and Culture: Integrating Psychological and Systems Perspectives. J. Occup. Health Psychol. 2017, 22, 341–353. [Google Scholar] [CrossRef] [PubMed]
- Mohamed, S. Safety Climate in Construction Site Environments. J. Constr. Eng. Manag. 2002, 128, 375–384. [Google Scholar] [CrossRef]
- Sørensen, O.H.; Hasle, P.; Bach, E. Working in Small Enterprises—Is There a Special Risk? Saf. Sci. 2007, 45, 1044–1059. [Google Scholar] [CrossRef]
- Al-Bayati, A.J.; O′Barr, K.; Suk, S.; Albert, A.; Chappell, J. Experience Modification Rate as a Pre-Qualification Criterion for Safety Performance. Prof. Saf. 2020, 65, 31–38. [Google Scholar]
- Neal, A.; Griffin, M.A. A Study of the Lagged Relationships among Safety Climate, Safety Motivation, Safety Behavior, and Accidents at the Individual and Group Levels. J. Appl. Psychol. 2006, 91, 946–953. [Google Scholar] [CrossRef] [Green Version]
- He, C.; McCabe, B.; Jia, G.; Sun, J. Effects of Safety Climate and Safety Behavior on Safety Outcomes between Supervisors and Construction Workers. J. Constr. Eng. Manag. 2020, 146. [Google Scholar] [CrossRef]
- Yu, X.; Mehmood, K.; Paulsen, N.; Ma, Z.; Kwan, H.K. Why Safety Knowledge Cannot Be Transferred Directly to Expected Safety Outcomes in Construction Workers: The Moderating Effect of Physiological Perceived Control and Mediating Effect of Safety Behavior. J. Constr. Eng. Manag. 2020, 147. [Google Scholar] [CrossRef]
- Seo, H.C.; Lee, Y.S.; Kim, J.J.; Jee, N.Y. Analyzing Safety Behaviors of Temporary Construction Workers Using Structural Equation Modeling. Saf. Sci. 2015, 77, 160–168. [Google Scholar] [CrossRef]
- Probst, T.M.; Brubaker, T.L. The Effects of Job Insecurity on Employee Safety Outcomes: Cross-Sectional and Longitudinal Explorations. J. Occup. Health Psychol. 2001, 6, 139–159. [Google Scholar] [CrossRef]
- Mohammadi, A.; Tavakolan, M.; Khosravi, Y. Factors Influencing Safety Performance on Construction Projects: A Review. Saf. Sci. 2018, 109, 382–397. [Google Scholar] [CrossRef]
- Azeez, M.; Gambatese, J.; Hernandez, S. What Do Construction Workers Really Want? A Study about Representation, Importance, and Perception of US Construction Occupational Rewards. J. Constr. Eng. Manag. 2019, 145. [Google Scholar] [CrossRef]
- Pereira, E.; Ahn, S.; Abourizk, S. Identification and Association of High-Priority Safety Management System Factors and Accident Precursors for Proactive Safety Assessment and Control. J. Manag. Eng. 2018, 34. [Google Scholar] [CrossRef]
- Miller, D.C.; Salkind, N.J. Handbook of Research Design and Social Measurement, 6th ed.; SAGE Publication: Thousand Oaks, CA, USA, 2002; p. 330. [Google Scholar]
- Harpe, S.E. How to Analyze Likert and Other Rating Scale Data. Curr. Pharm. Teach. Learn. 2015, 7, 836–850. [Google Scholar] [CrossRef]
- Meng, Q.; Liu, W.; Li, Z.; Hu, X. Influencing Factors, Mechanism and Prevention of Construction Workers’ Unsafe Behaviors: A Systematic Literature Review. Int. J. Environ. Res. Public Health 2021, 18, 2644. [Google Scholar] [CrossRef] [PubMed]
- Li, S.Q.; Wu, X.Y.; Wang, X.Z.; Hu, S.H. Relationship between Social Capital, Safety Competency, and Safety Behaviors of Construction Workers. J. Constr. Eng. Manag. 2020, 146. [Google Scholar] [CrossRef]
- Wilbanks, D.W. Contractor Safety Prequalification: The Reality of Demanded Written Programs. Prof. Saf. 2019, 63, 36–40. [Google Scholar]
- Abowitz, D.A.; Toole, T.M. Mixed Method Research: Fundamental Issues of Design, Validity, and Reliability in Construction Research. J. Constr. Eng. Manag. 2010, 136, 108–116. [Google Scholar] [CrossRef]
- Ioannidis, J.P. Why Most Published Research Findings Are False. PLoS Med. 2005, 2. [Google Scholar] [CrossRef] [Green Version]
- Al-Bayati, A.J.; Abudayyeh, O.; Albert, A. Managing Active Cultural Differences in U.S. Construction Workplaces: Perspectives from Non-Hispanic Workers. J. Saf. Res. 2018, 66, 1–8. [Google Scholar] [CrossRef] [PubMed]
- Davis, C.G.; Thake, J.; Vilhena, N. Social Desirability Biases in Self-Reported Alcohol Consumption and Harms. Addict. Behav. 2010, 35, 302–311. [Google Scholar] [CrossRef] [PubMed]
Figure 1.
The share of construction fatalities and employment.

Figure 2.
Hypothesis 1.

Figure 3.
Hypothesis 2.

Figure 4.
Hypothesis 1 regression results.

Figure 5.
Hypothesis 2 regression results.

Table 1.
Descriptive analysis results.
| The Study Factors | Cronbach’s Alpha (α) | Mean | Std. Dev. | Correlations | |||
|---|---|---|---|---|---|---|---|
| MS | SS | SB | SM | ||||
| Construction Safety Culture (MS) | 0.96 | 8.45 | 1.82 | — | 0.78 | 0.70 | 0.53 |
| Construction Safety Climate (SS) | 0.95 | 7.86 | 1.83 | 0.78 | — | 0.57 | 0.43 |
| Safety Behavior (SB) | 0.93 | 8.97 | 1.31 | 0.70 | 0.57 | — | 0.69 |
| Safety Motivation (SM) | 0.85 | 9.53 | 0.84 | 0.53 | 0.43 | 0.69 | — |
Table 2.
Linear regression result using Equation (1); outcome: SS.
| Predictors | Coefficient | t-Value | p-Value | R2 |
|---|---|---|---|---|
| Constant (i1) | 1.24 | 3.73 | 0.0002 | 0.60 |
| MS (a) | 0.78 | 20.39 | <0.001 |
Table 3.
Linear regression result using Equation (2); outcome: SB.
| Predictors | Coefficient | t-Value | p-Value | R2 |
|---|---|---|---|---|
| Constant (i1) | 4.65 | 16.81 | <0.001 | 0.49 |
| SS (b) | 0.04 | 0.9 | 0.36 | |
| MS () | 0.47 | 9.45 | <0.001 |
Table 4.
The total effect of MS on the SB model.
| Predictors | Coefficient | t-Value | p-Value | R2 |
|---|---|---|---|---|
| Constant (i1) | 4.71 | 17.45 | <0.001 | 0.49 |
| MS () | 0.50 | 16.14 | <0.001 |
Table 5.
Linear regression result using Equation (2); outcome: SM.
| Predictors | Coefficient | t-Value | p-Value | R2 |
|---|---|---|---|---|
| Constant (i1) | 7.44 | 35.3 | <0.001 | 0.28 |
| SS (b2) | 0.018 | 0.47 | 0.634 | |
| MS () | 0.23 | 6.12 | <0.001 |
Table 6.
The total effect of MS on the SM model.
| Predictors | Coefficient | t-Value | p-Value | R2 |
|---|---|---|---|---|
| Constant (i1) | 7.46 | 36.35 | <0.001 | 0.28 |
| MS () | 0.25 | 10.32 | <0.001 |
Publisher’s Note: MDPI stays neutral with regard to jurisdictional claims in published maps and institutional affiliations. |
© 2021 by the author. Licensee MDPI, Basel, Switzerland. This article is an open access article distributed under the terms and conditions of the Creative Commons Attribution (CC BY) license (https://creativecommons.org/licenses/by/4.0/).
Share and Cite
MDPI and ACS Style
Al-Bayati, A.J. Impact of Construction Safety Culture and Construction Safety Climate on Safety Behavior and Safety Motivation. Safety 2021, 7, 41. https://0-doi-org.brum.beds.ac.uk/10.3390/safety7020041
AMA Style
Al-Bayati AJ. Impact of Construction Safety Culture and Construction Safety Climate on Safety Behavior and Safety Motivation. Safety. 2021; 7(2):41. https://0-doi-org.brum.beds.ac.uk/10.3390/safety7020041
Chicago/Turabian StyleAl-Bayati, Ahmed Jalil. 2021. "Impact of Construction Safety Culture and Construction Safety Climate on Safety Behavior and Safety Motivation" Safety 7, no. 2: 41. https://0-doi-org.brum.beds.ac.uk/10.3390/safety7020041
Note that from the first issue of 2016, this journal uses article numbers instead of page numbers. See further details here.