Article

Intensified Selection, Elevated Mutations, and Reduced Adaptation Potential in Wild Barley in Response to 28 Years of Global Warming

1
Plant Gene Resources of Canada, Saskatoon Research and Development Centre, Agriculture and Agri-Food Canada, Saskatoon, SK S7N 0X2, Canada
2
Institute of Evolution, University of Haifa, Mount Carmel, Haifa 31905, Israel
3
Brandon Research and Development Centre, Agriculture and Agri-Food Canada, 2701 Grand Valley Road, P.O. Box 1000A, Brandon, MB R7A 5Y3, Canada
*
Author to whom correspondence should be addressed.
Submission received: 17 February 2024 / Revised: 7 March 2024 / Accepted: 12 March 2024 / Published: 14 March 2024
(This article belongs to the Section Biology Research and Life Sciences)

Abstract

:
Many studies have investigated the threat of climate change on wild plants, but few have investigated the genetic responses of crop wild relative populations under threat. We characterized the genetic responses of 10 wild barley (Hordeum spontaneum K. Koch) populations in Israel, sampling them in 1980 and again in 2008, through exome capture and RNA-Seq analyses. Sequencing 48 wild barley samples of these populations representing two collection years generated six million SNPs, and SNP annotations identified 12,926 and 13,361 deleterious SNPs for 1980 and 2008 samples, respectively. The assayed wild barley samples displayed intensified selective sweeps and elevated deleterious mutations across seven chromosomes in response to 28 years of global warming. On average, the 2008 samples had lower individual and population mutational burdens, but the population adaptation potential was estimated to be lower in samples from 2008 than in 1980. These findings highlight the genetic risks of losing wild barley under global warming and support the need to conserve crop wild relatives.

1. Introduction

The wild relative species of domesticated crops harbor abundant and useful genetic diversity [1,2] and are the best genetic hope for improving genetically impoverished cultivars for human food production [3,4,5,6,7]. However, these valuable genetic resources are found to be highly under-conserved [8], and concerns about losing these genetic resources are mounting [9]. Also, many studies have revealed increasing threats for crop wild relatives in natural populations, particularly from global warming [10,11,12], but few studies have quantified the genetic risk of losing these wild relative populations under threat [13,14,15,16].
Wild barley (Hordeum spontaneum K. Koch) [3] is the wild progenitor of cultivated barley and is a useful genetic resource with adaptation to abiotic (e.g., solar radiation, temperature, drought, and mineral poverty) and biotic (e.g., pathogens and parasites) stresses. However, it has become eroded by urbanization and agriculture [5] and influenced by climate changes such as rising temperatures and less rainfall [17]. For example, our previous study showed the shortening of flowering time from 17.3 to 8.2 days in 10 wild barley populations after 28 years of global warming [14]. Thus, it is important to assess the adaptability of the wild barley populations under threat [13]. Also, barley is a model crop for genetic studies [18]. The advances in next-generation sequencing and barley genome sequencing [19,20] open new opportunities to characterize genetic variations and assess genetic risks of barley wild relative populations.
To understand the genetic risk of wild crop relatives under threat, we conducted a genomic characterization of genetic variation using advanced sequencing technologies to assess the evolutionary adaptation in natural populations of the progenitors under climate change. Specifically, we performed exome capture analysis [20] of 48 samples and RNA-Seq analysis [19] of 42 samples of 10 wild barley populations across Israel, collected in 1980 and again in 2008, and analyzed the changes in mutation, selection, and adaptation potential. These genomic analyses were aimed to address two major questions: (1) how do the wild barley populations respond genetically to global warming and (2) do the assayed wild barley populations under global warming show any genetic vulnerability with a reduced adaptation potential?

2. Materials and Methods

Materials used for this study and methods used for collecting samples, DNA and RNA extractions, sequencing, SNP calling and annotation, deleterious SNP identification, mutation burden estimation, population genetic analysis, gene ontology analysis, and expression are available in the Supporting Information section (https://0-doi-org.brum.beds.ac.uk/10.6084/m9.figshare.25238245; accessed on 7 March 2024), which also included Tables S1–S4 and Figures S1–S23. To make this section self-explanatory, brief descriptions of them are given below.

2.1. Materials and DNA Sequencing

The study materials consisted of 48 wild barley samples of 10 populations across Israel collected in 1980 and again in 2008 (see [14]; Figure S1). The assayed 10 populations remained largely intact without any habitat disturbances over the 28 years. Also, the climate data showed the trends for rising temperature and declining rainfall in Israel from 1980 to 2008 (Figure S1C,D). For this study, the assayed seeds were the original samples of the seeds that were produced from a greenhouse increase at the University of Haifa and acquired in September 2009 from Professor Eviatar Nevo. The seeds representing a collected plant were randomly selected and planted on 7 July 2017 in a greenhouse in Saskatoon. The fourth leaf was collected from each growing plant, snap-frozen in liquid nitrogen, and stored at −80 °C for RNA-Seq analysis. Young leaves at later stages were further collected from each plant and freeze-dried for DNA isolation for exome capture analysis. RNA and DNA were extracted from the collected leaf tissues (Table S1). Exome capture libraries were prepared using the Kapa HyperPlus DNA library preparation kit (Roche Sequencing Solutions Inc., Pleasanton, CA, USA) to fragment and size-select the genomic DNA samples. RNA-Seq libraries were prepared following the Sense mRNA-Seq Library Prep Kit, version 2 (Lexogen Inc., Greenland, NH, USA). Sequencing of all the multiplexed libraries was carried out from October to December 2017 on the Illumina HiSeq, SBS Version 4 (Illumina Inc., San Diego, CA, USA), at the National Research Council of Canada, Saskatoon, SK, Canada, with one lane for exome capture libraries and another lane for RNA-Seq libraries, each with 125 bp paired-end reads. The acquired exome capture and RNA-Seq sequence data (Table S2) were deposited to NCBI’s SRA database under BioProject IDs of PRJNA507441 and PRJNA507455, respectively.

2.2. SNP Calling and Annotation

Both the raw exome capture and RNA-Seq sequence data were processed in the same manner to remove the residual Illumina adapter sequence, trim the low-quality sequence below an average Phred score of 24 over a 10-base window and any sequence shorter than 80 bases. Domestic barley (Hordeum vulgare L.) reference genome [21] was used for SNP calling. The genome assembly of Hordeum pubiflorum Hook. f. [20] was used to predict an ancestral genome for wild barley. SNPs were called using ANGSD version 0.921 [22] with the ancestral genome and BCFtools and Samtools (version 1.8) [23] for the samples of each collection year. SNP annotations were conducted using the stand-alone Ensembl Variant Effect Predictor (VEP) tool [24,25] based on the ANGSD vcf output. VEP analysis also generated an SIFT (“sorting intolerant from tolerant” substitutions) [26] score for each SNP. The SIFT algorithm predicted amino acid substitutions and their effects on protein function. Nonsynonymous mutations with SIFT scores <0.05 were defined as putative deleterious mutations. A custom Perl script was used to filter SNPs for different classes of sequence such as 3′UTR, 5′UTR, downstream, upstream, nonsynonymous, and synonymous. Genes for different classes of SNPs were also generated for further analyses.

2.3. Analyses of Nucleotide Diversity and Selective Sweep

To estimate nucleotide diversity in barley samples, Watterson’s θ statistics were generated using ANGSD with an empirical Bayes approach [22]. Watterson’s θ statistics were summarized for each chromosome and whole genome using 50 kb non-overlapping sliding windows with steps of 10 kb, and were compared between barley samples of two collection years.
Two approaches were applied to identify selective sweeps across the barley genome. RAiSD version 1.9 (Raised Accuracy in Sweep Detection) was a fast, parameter-free detection system using multiple signatures of a selective sweep via the enumeration of SNP vectors [27]. MuStat was generated for each sliding window of various sizes across each chromosome and outliers with 9 or 12 standard deviations were used to define selective sweep regions. The neutrality test statistic Tajima’s D was calculated using ANGSD with an empirical Bayes approach [28]. A global site frequency spectrum (SFS) was estimated, and the posterior sample allele frequencies were calculated using the global SFS as a prior. The Tajima’s D statistics were summarized across the genome using 50 kb non-overlapping sliding windows with steps of 10 kb. The outlier sliding window with a negative Tajima’s D estimate smaller than their 3 or 6 standard deviations was considered to be a selective sweep region.

2.4. Analyses of Deleterious Mutations and Mutation Burden

To enhance the detection of deleterious SNPs, GERP Rejected Substitution (RS) scores [29] were also generated, besides SIFT scores. GERP++ [30] was used to quantify position-specific constraints from the substitution of a locus by generating an RS score. Gerpcol, specifically, estimates constraints for each column of an alignment of several genomes of increasing taxonomic distance. Multiple whole-genome sequence alignment was carried out for 16 species (Table S3) with the Large-Scale Genome Alignment Tool (LASTZ) [31] and converted to multiple alignment files. Phylogenetic tree and neutral branch length (estimated from fourfold degenerate sites) analyses were made using PhastCons version 1.4 [32] and used to quantify the constraint intensity at every position in the barley genome. Deleterious SNPs in constrained portions of the genome were identified with a combination of SIFT (<0.05) and GERP (>0) annotations. These predicted deleterious SNPs were used to calculate the barley mutation burden and other population genetic analyses. To assess the impact of GERP++ RS scores on the identification of deleterious SNPs and the estimation of the site frequency spectrum (SFS), we also generated GERP++ RS scores from 8 and 12 species (Table S3) and compared the detected deleterious SNPs across the barley genome.
The mutation burden for individual samples was calculated based on the numbers of derived deleterious alleles present in barley samples in three models: homozygous mutation burden, heterozygous mutation burden, and total mutation burden. The homozygous mutation burden is the number of derived deleterious alleles in the homozygous state. The heterozygous mutation burden is the number of derived deleterious alleles existing in the heterozygous state. The total mutation burden is the number of derived deleterious alleles existing in an accession (2× homozygous mutation burden + heterozygous mutation burden). A population mutation burden was calculated based on the mean of the individual total mutation burden. We also generated a population-weighted RS burden by weighting the RS score of each deleterious SNP with its population allelic frequency and averaging the weighted RS scores across all the deleterious SNPs. A higher-weighted RS score means more mutation burden for the population.

2.5. Analysis of Adaptation Potential

Adaptive mutations were inferred following polyDFE v2.0 [33] with the proportion of adaptive substitutions, alpha-dfe, which was defined as the ratio of the estimated adaptive substitutions over the observed selected divergence counts [34]. For samples of each collection year, SFS data were generated using ANGSD for each chromosome and whole genome from exome capture data and for the whole genome from RNA-Seq data.

2.6. Gene Ontology and Expression Analyses

Gene ontology (GO) analysis of predicted deleterious SNPs was made first with the identification of genes associated with deleterious SNPs from annotation files. Their enrichment analysis was conducted using the agriGO v2.0 platform [35]. Non-redundant GO term sets were visualized using REVIGO web v1.8.1 [36] with treemaps and tag clouds to assist the interpretation. Gene family-based classification and functional enrichment analysis of deleterious genes were also made using GenFam web portal [37]. These GO analyses were also carried out for fixed deleterious genes for samples of each collection year.
Expression analysis of predicted deleterious genes was conducted with the extraction of the abundance of sequence reads for deleterious genes using a custom shell script based on the StringTie program v1.3.4 [38] from RNA-Seq data for the samples of each collection year. This was also carried out for fixed deleterious genes and gene regions identified based on SNP annotations as 3′UTR, 5′UTR, downstream, upstream, synonymous, and nonsynonymous.

3. Results

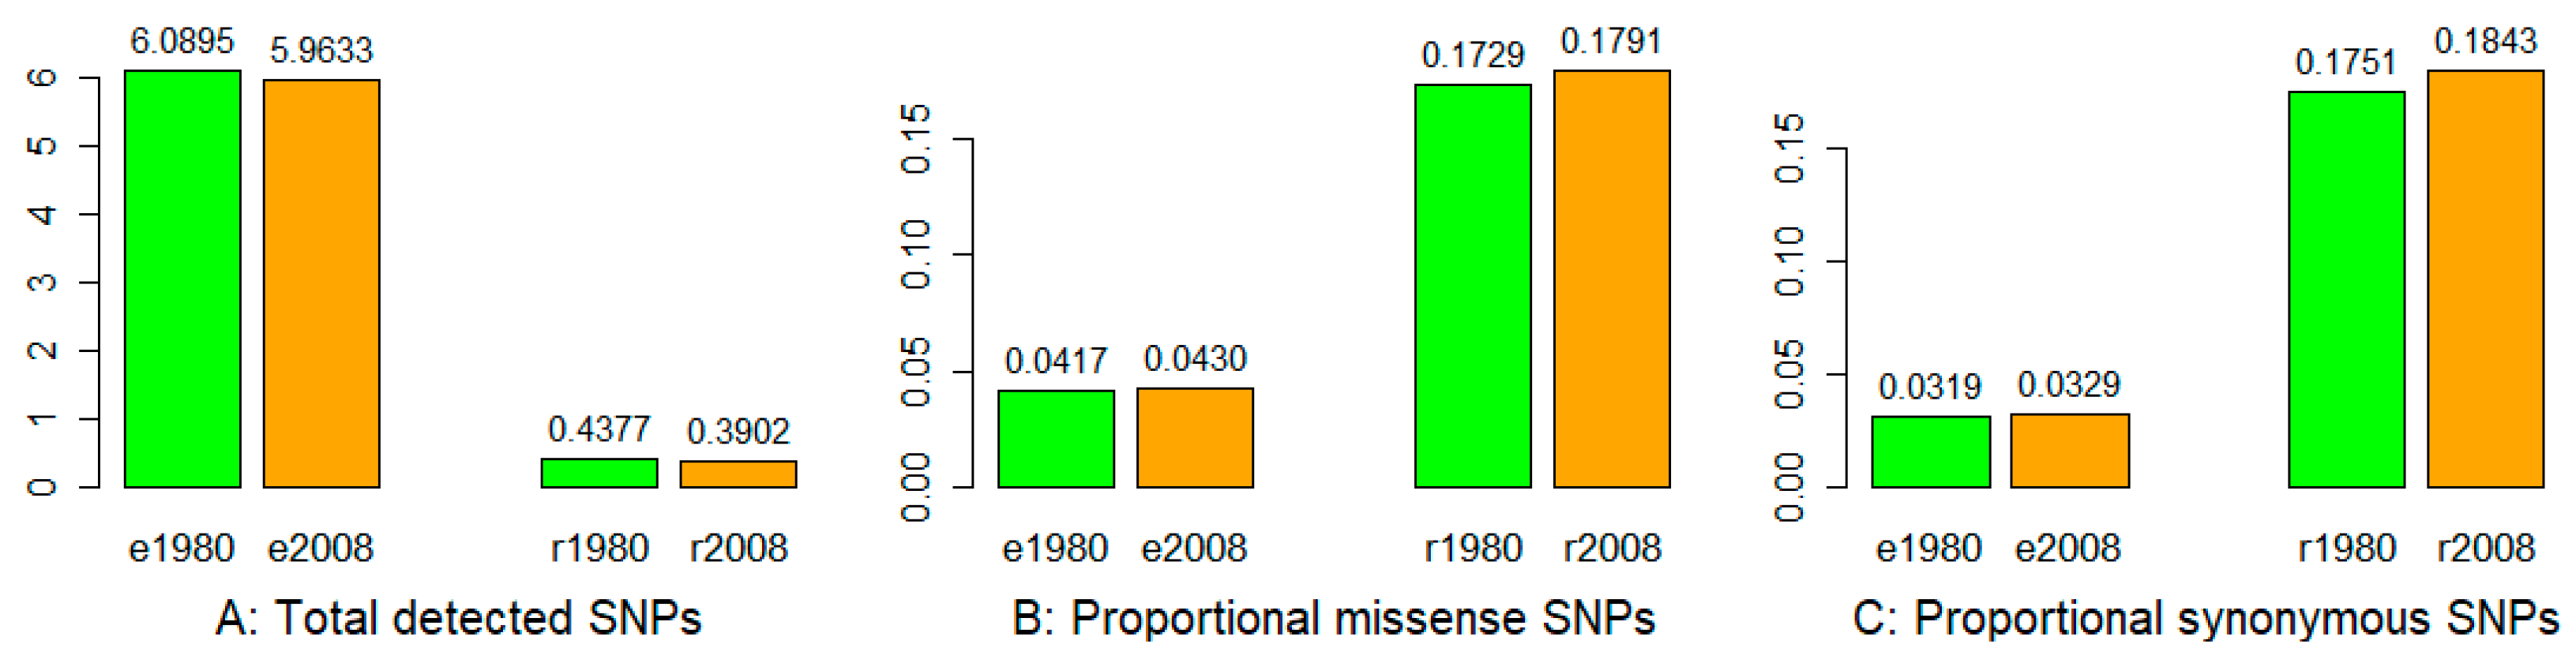
3.1. Sequencing, SNP Identification, and Annotation

Exome capture sequencing of 48 barley samples generated a total of 479 million sequence reads and an average of 9,235,182 mapped sequence reads per sample (Table S2). Similarly, RNA-Seq sequencing of 42 samples produced a total of 466 million sequence reads and an average of 4,535,328 mapped sequence reads per sample (Table S2). SNPcalling from exome capture sequences revealed about six million SNPs (eSNPs for short) across the wild barley genome for both the 1980 and 2008 samples, and from RNA-Seq sequences, 437,742 and 390,245 SNPs (rSNPs for short) were identified from the 1980 and 2008 samples, respectively (Figure 1A).
VEP-based annotation analyses of eSNPs and rSNPs allowed for the classification of SNPs into 17 different classes (Table S4). Most of the eSNPs were located in intergenic, intron, upstream, and downstream genic regions, while most of the rSNPs were from intergenic, 3′UTR genic, and intron regions. There were 253,822 and 256,546 eSNPs classified as missense variants for the 1980 and 2008 samples, respectively. Similarly, 75,695 and 69,897 rSNPs were identified as missense variants for the 1980 and 2008 samples, respectively. However, the proportion of the total SNPs being missense variants was found to be higher in samples from 2008 than in 1980 (Figure 1B). This pattern also holds for SNPs being synonymous (Figure 1C).

3.2. Nucleotide Diversity

We inferred nucleotide diversity based on the estimates of Watterson’s θ from exome capture and RNA-Seq data (see Figure S2). Exome capture data revealed slightly less nucleotide diversity, but RNA-Seq data showed a little more nucleotide diversity in samples from 2008 than in 1980. For genic regions of the genome identified by different SNP classes of sequences, more nucleotide diversity in upstream, downstream, synonymous, intron and 3-primer UTR genic regions was found in samples from 2008 than in 1980, but less nucleotide diversity in nonsynonymous genic regions for the 2008 samples.

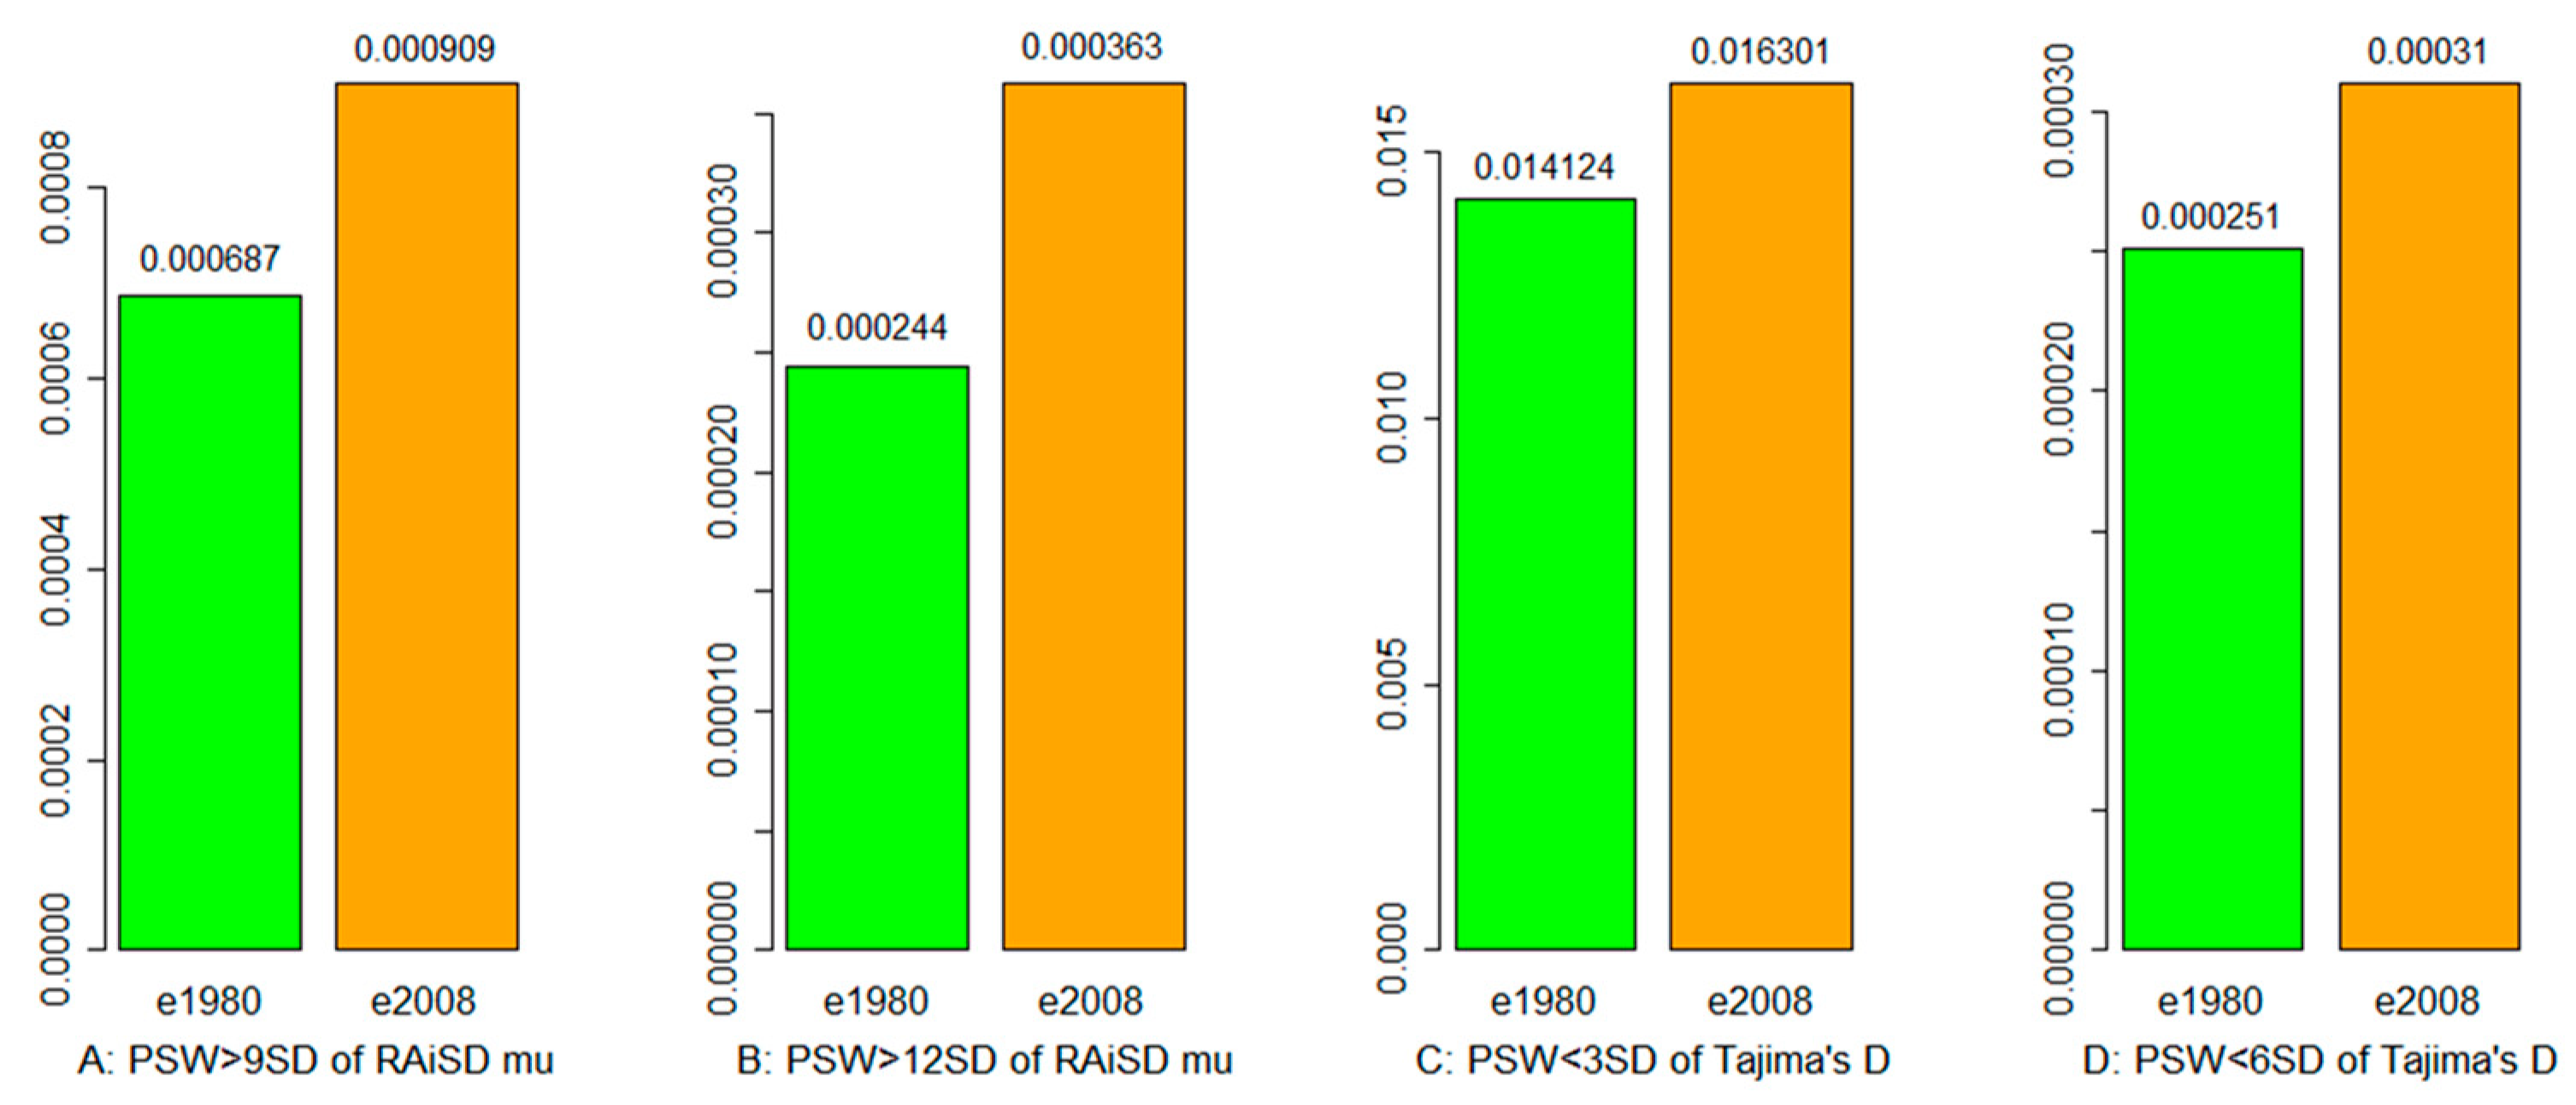
3.3. Selective Sweep

Two methods were applied to identify selective sweeps from exome capture data with better SNP coverage across the barley genome. RAiSD [27] detected more sliding windows with selective sweeps across seven chromosomes in samples from 2008 than in 1980, based on the outliers of MuStat estimates being 9 or 12 standard deviations (Figure 2A,B). The detected selective sweeps on each chromosome are illustrated in Figure S3 for the 1980 and 2008 samples. Similarly, Tajima’s D analysis also revealed the same patterns of results with more sliding windows with selective sweeps in the 2008 samples, when the outliers were based on 3 or 6 standard deviations of negative Tajima’s D estimates (Figure 2C,D). Tajima’s D statistics on each chromosome estimated from exome capture and RNA-Seq data are summarized in Figures S4 and S5, respectively. All the chromosomes displayed negative Tajima’s D estimates in the samples of two collection years. More sliding windows with smaller than 6 standard deviations of negative Tajima’s D estimates were found in the 2008 than in the 1980 samples for all the individual chromosomes, except Chr1 and Chr4 for exome capture data. However, the mean estimates of Tajima’s D for all the sliding windows for seven SNP classes of sequences representing downstream, upstream, 3′UTR, 5′UTR, intron, synonymous, and non-synonymous regions were positive in either exome capture or RNA-Seq data for the 1980 and 2008 samples (Figures S6 and S7). Despite this, more sliding windows with negative estimates of Tajima’s D were still found in samples from 2008 than in 1980 for these seven classes of sequence, with one exception for 3′UTR from RNA-Seq data.

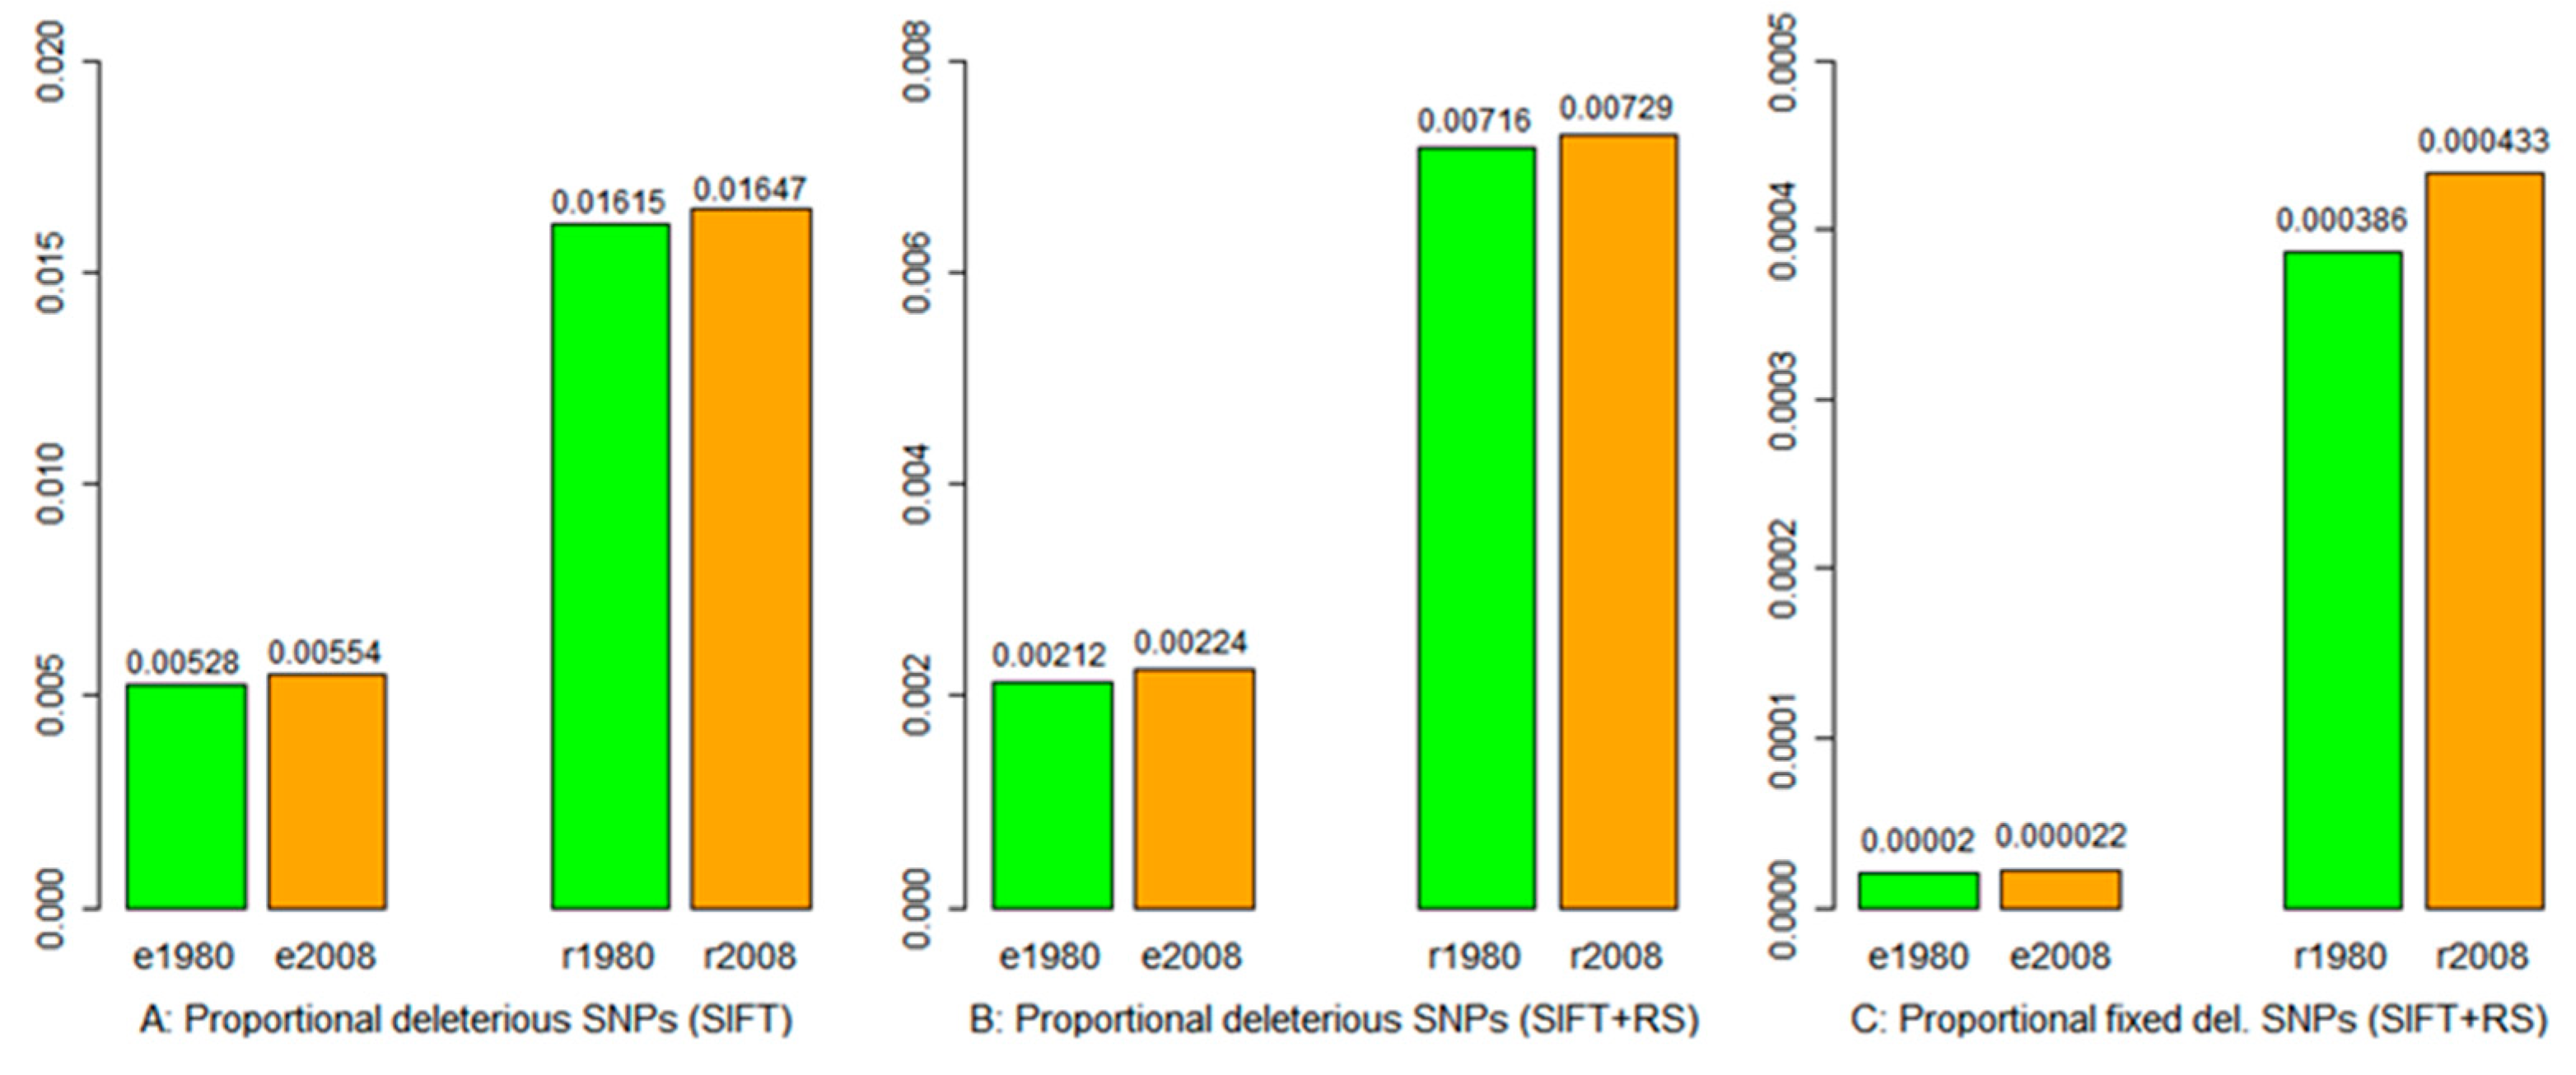
3.4. Deleterious Mutation

Deleterious SNPs were detected based on the SIFT score alone and in combination with SIFT and GERP++ RS scores. Screening SIFT scores across all the non-synonymous SNPs revealed 236,863 and 242,541 eSNPs being deleterious and 58,411 and 53,028 rSNPs being deleterious in the 1980 and 2008 samples, respectively (Table S4). After filtering with canonical transcripts, the deleterious eSNPs were reduced to 32,177 and 33,013; similarly, the deleterious rSNPs were reduced to 7070 and 6426 in the 1980 and 2008 samples, respectively (Table S4). However, the proportion of the total SNPs being deleterious was found to be higher in samples from 2008 than in the 1980 samples (Figure 3A).
A positive GERP++ RS score at a substitution site means fewer substitutions than expected. Thus, a substitution occurring in a site with RS > 0 is predicted to be deleterious; the larger the RS score, the more deleterious the substitution. The RS scores were generated through multiple genome alignments for 16 plant species of increased evolutionary distances to wild barley (Table S3). Combining SIFT and RS scores revealed 12,926 and 13,361 eSNPs that could be classified as deleterious and 3136 and 2844 rSNPs classified as deleterious in the 1980 and 2008 samples, respectively (Table S4). Overall, the 2008 samples still had a higher proportion of the detected SNPs being deleterious than the 1980 samples (Figure 3B). We also estimated the frequencies of deleterious SNPs and found 122 and 131 mutations being fixed and 169 and 169 rSNPs being fixed in the 1980 and 2008 samples, respectively (Table S4). Weighting over all the detected SNPs, the 2008 samples showed a higher proportion of SNPs being fixed than the 1980 samples (Figure 3C). Based on exome capture data, the 2008 samples had more deleterious SNPs with low allelic frequencies from 0.01 to 0.1 than the 1980 samples (Figure S8).
As RS scores are dependent on the number of aligned species, we also generated RS scores from 8 and 12 species (Table S3) to assess the impacts of GERP++ RS scores on the detection of deleterious SNPs and site frequency spectrum estimation. The RS score distribution for SNPs identified from exome capture data in the combined samples of wild barley was essentially similar (Figure S9). More than 90% of the same deleterious SNPs were identified by three GERP++ RS scores (Figure S10). The same patterns were also observed in minor allele frequency distributions for deleterious SNPs, identified by three GERP++ RS scores for the 1980 and 2008 samples and sequence data sets (Figures S11 and S12).

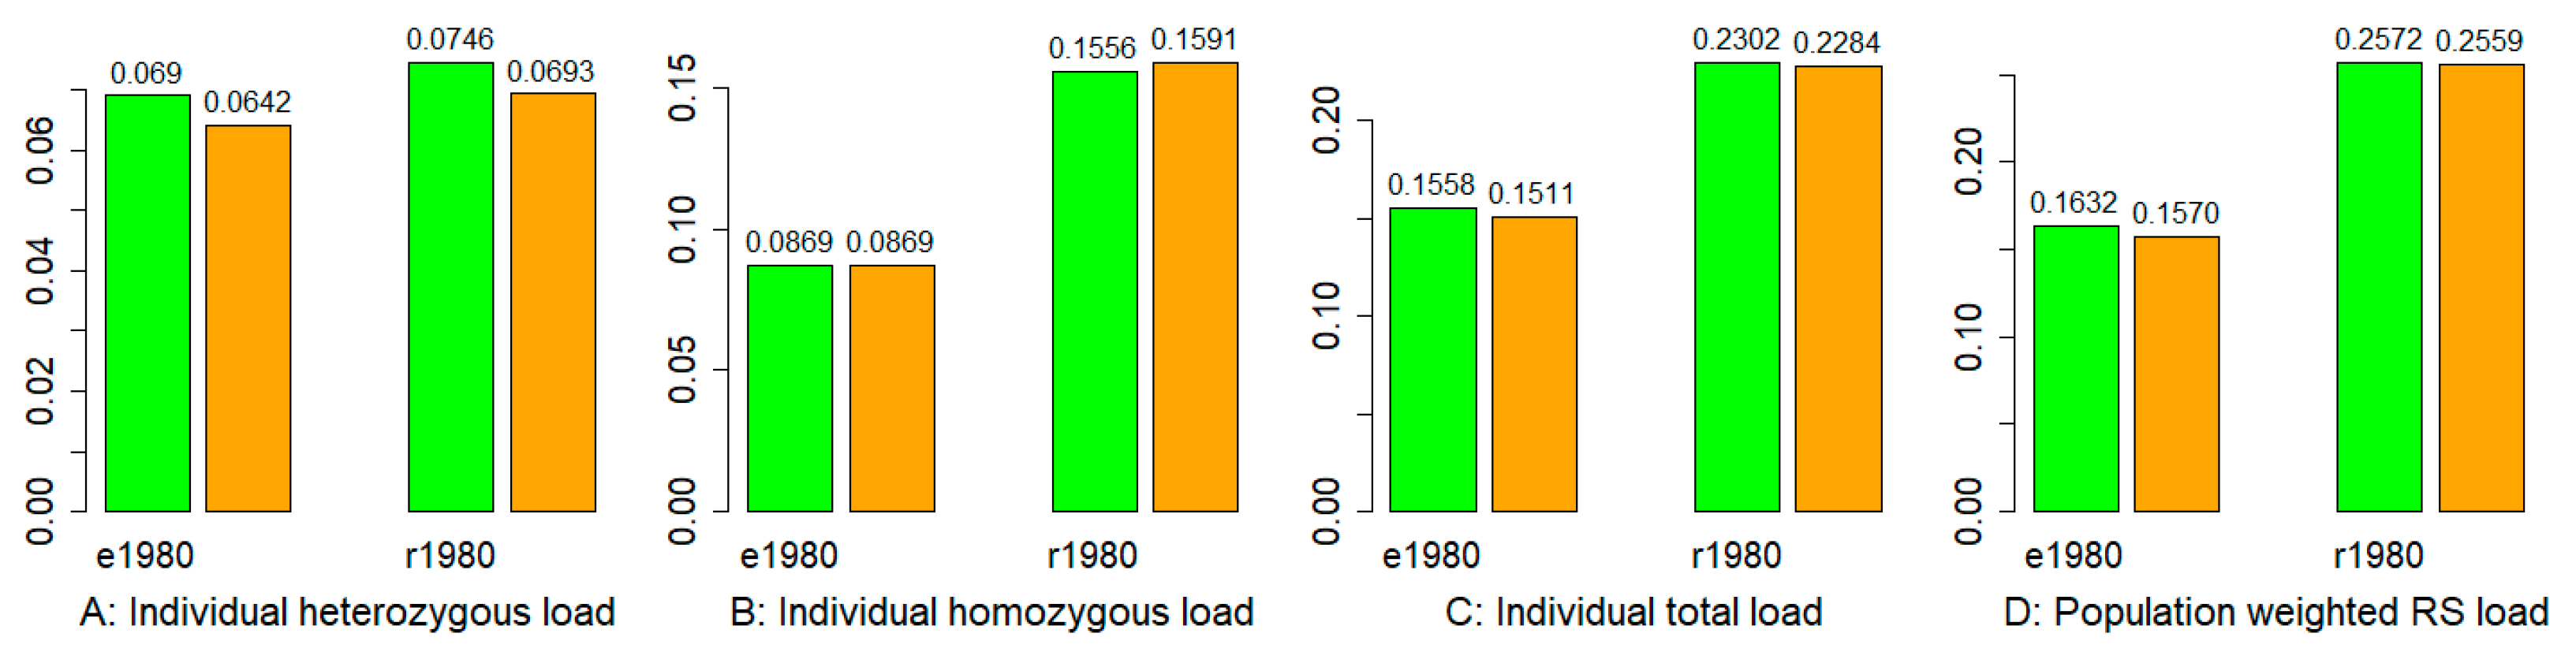
3.5. Mutation Burden

The counts per sample of deleterious heterozygotes and homozygotes for each deleterious eSNP and rSNP are shown in Figures S13 and S14. On average, the 2008 samples had lower heterozygous and higher homozygous mutation burdens than the 1980 samples (Figure 4A,B). Combining both deleterious heterozygous and homozygous mutation burdens revealed that the 2008-collected individual samples had lower total mutation burdens than those collected in 1980 (Figure 4C). Specifically, the estimates of sample-wise total mutation burden from exome capture data ranged from 0.133 to 0.178 with a mean of 0.156 for the 1980 samples and from 0.123 to 0.170 with a mean of 0.151 for the 2008 samples, while the estimates from RNA-Seq data ranged from 0.183 to 0.273 with a mean of 0.23 for the 1980 samples and from 0.178 to 0.269 with a mean of 0.228 for the 2008 samples. Interestingly, the variations in individual mutation burdens from both exome capture and RNA-Seq data sets were not associated with the population latitudes (Figures S13 and S14). We also inferred mutation burden at the population level by weighting the GERP++ RS score with the deleterious allelic frequencies for all deleterious eSNPs and rSNPs. A lower weighted RS score was found in samples from 2008 than in 1980 (Figure 4D).

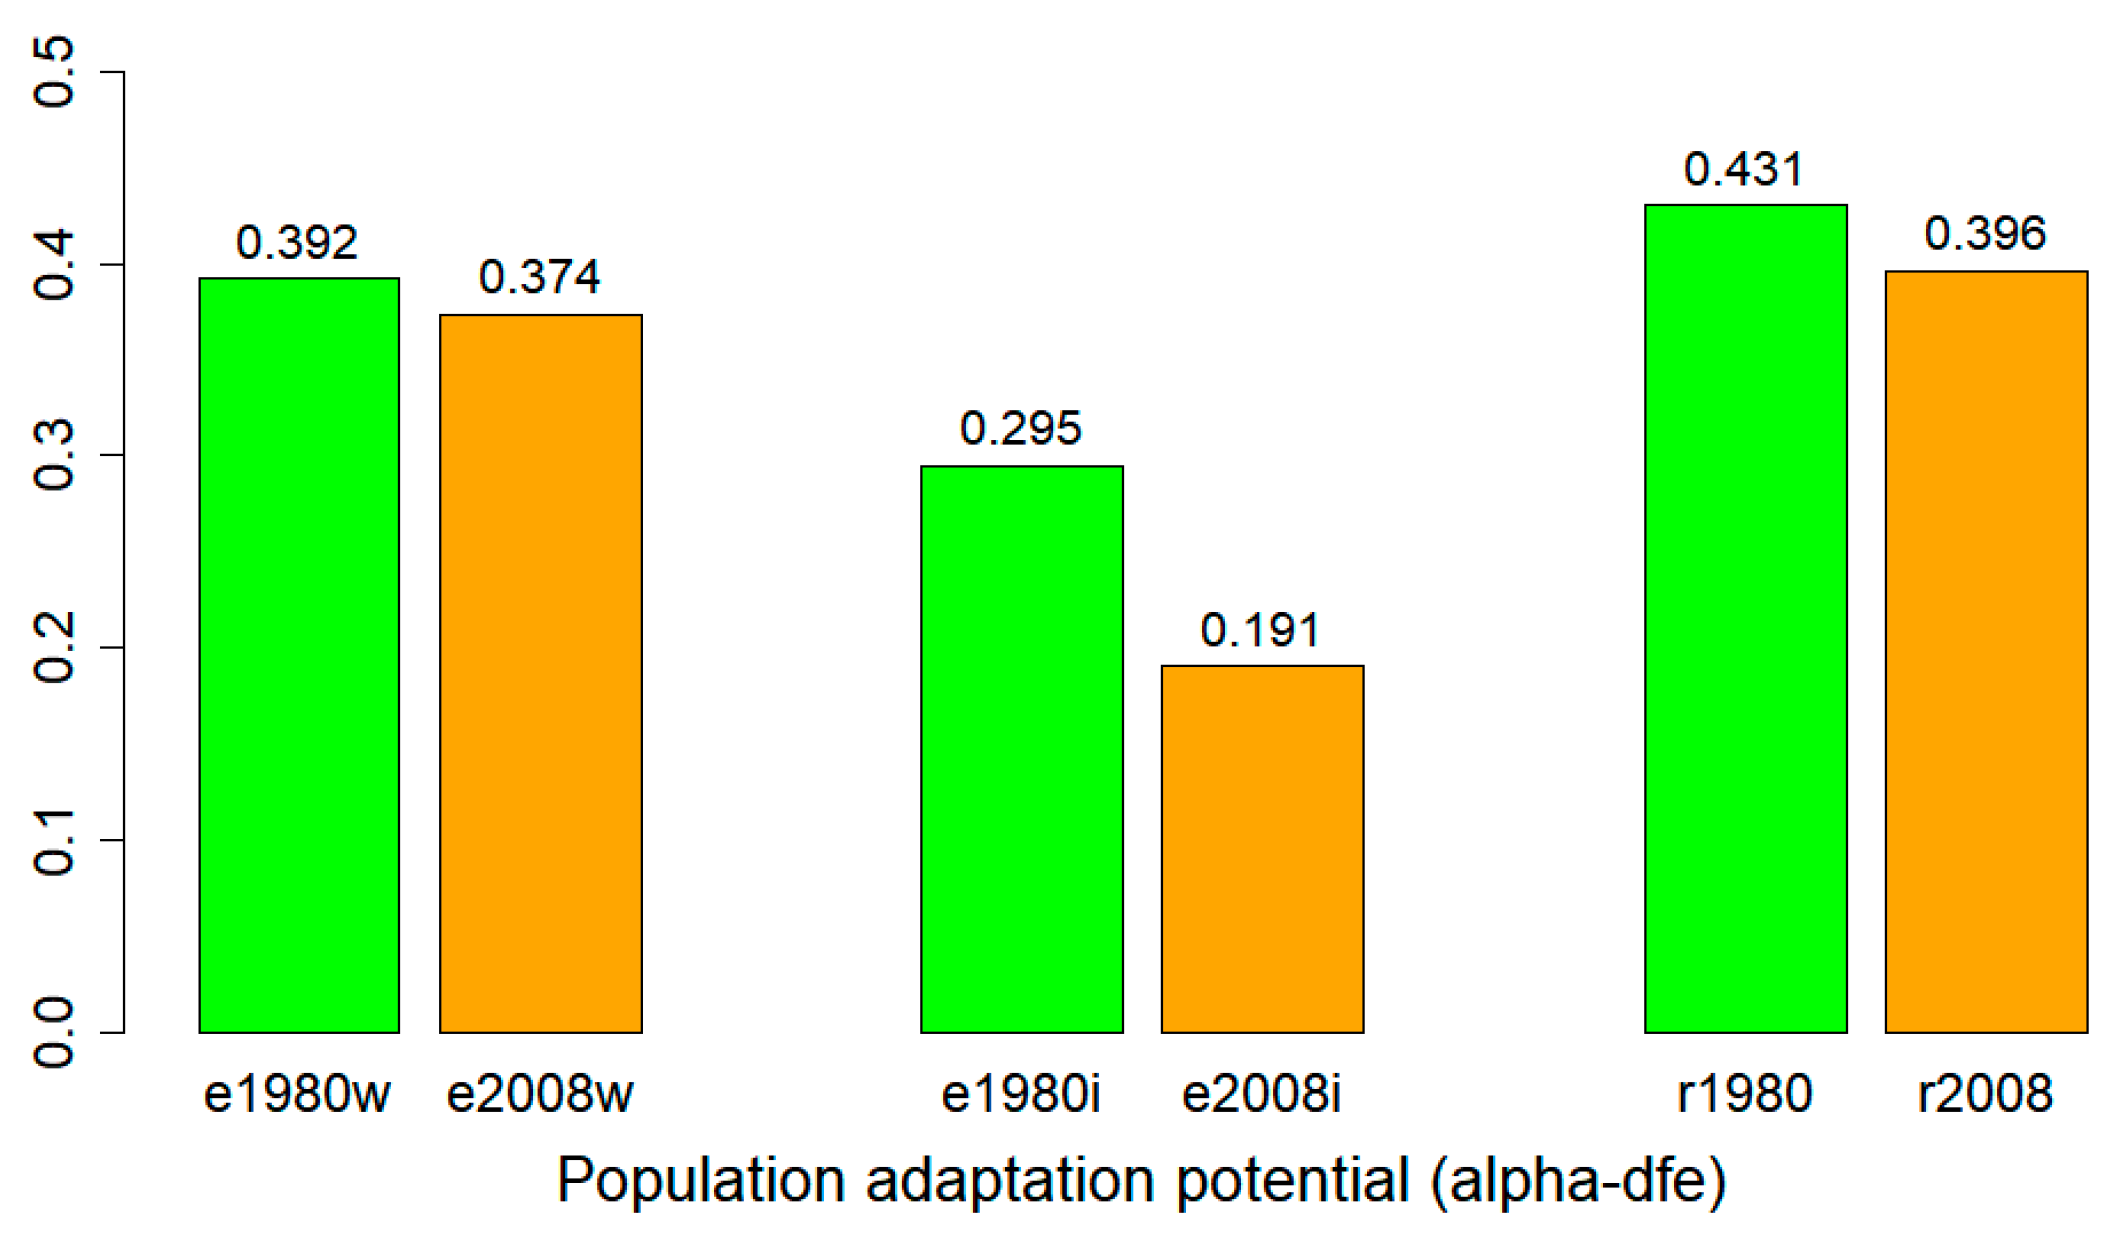
3.6. Adaptation Potential

The population adaptation potentials for the 1980 and 2008 samples were inferred with the alpha-dfe statistics as the proportion of adaptive substitutions from site frequency spectrum data. Higher alpha-dfe estimates predict higher population adaptation potential with more advantageous mutations. The estimation of alpha-dfe following model A showed a reduction in alpha-dfe from the 1980 to 2008 samples when it was based on either the whole genome or individual chromosome site frequency spectrum (SFS) obtained from exome capture data (Figure 5). A similar reduction was also found for the 2008 samples based on the whole-genome SFS estimated from RNA-Seq data (Figure 5).

3.7. Gene Ontology Analysis

After polarising with ancestral genotypes, 12,596 and 13,008 deleterious genes were identified across seven chromosomes (excluding ChrUn) based on SIFT and 16 species’ GERP++ RS scores from exome capture data in the 1980 and 2008 samples, respectively (Table S4). The genes inferred from exome capture data were mainly associated with the biological processes of protein phosphorylation, organic substance metabolism, lipid metabolism, and organic substance catabolism (Figure S15). We also detected 3069 and 2759 deleterious genes from RNA-Seq data in the 1980 and 2008 samples, respectively (Table S4). The genes detected in the 1980 samples were mainly associated with the biological processes of protein phosphorylation, dicarboxylic acid metabolism, organic substance metabolism, metabolism, and organic substance transport, while the genes in the 2008 samples were mainly associated with protein phosphorylation and single-organism carbohydrate metabolism (Figure S16). Interestingly, REVIGO also generated tag clouds with the keywords that correlated with the values based on GO terms for subsets of the deleterious genes; these tag clouds consistently displayed the word “temperature” in each collection year and data set (Figure S17). We also explored the biological processes of fixed deleterious genes only. The genes inferred from exome capture data in the 2008 samples seemed to become more involved with organic substance metabolism and less with metabolism and single-organism metabolism than those genes in the 1980 samples (Figure S18). Assessing all 169 fixed deleterious genes inferred from RNA-Seq data revealed the shift from the oxidation–reduction process in the 1980 samples to the single-organism reproductive process in the 2008 samples (Figure S19).
The gene family-based classification of deleterious genes revealed 18 gene families based on exome capture data for each year sample. However, 17 of them were shared between the samples of both collection years. The NLP transcription factor family was uniquely detected in the 1980 samples, while the lipid metabolism gene family was uniquely detected in the 2008 samples (Figure S20). For RNA-Seq data, there were 15 and 11 gene families detected for the 1980 and 2008 samples, respectively, and 10 of them were shared between the 1980 and 2008 samples. The families uniquely detected in the 1980 samples were the antiporter superfamily, ARIADNE gene family, NLP transcription factor family, subtilisin-like serine gene family, and lipid metabolism gene family, while the acyl lipid metabolism gene family was uniquely detected in the 2008 samples (Figure S20). Classifying fixed deleterious genes revealed more gene families in samples from 2008 than in 1980. For exome capture data, there were two and six gene families in the 1980 and 2008 samples, respectively, and one of them (the BZR transcription factor family) was shared (Figure S21). Similarly, for RNA-Seq data, there were five and seven gene families in the 1980 and 2008 samples, respectively, and four of them were shared (Figure S21). Assessing the identified gene families between exome capture and RNA-Seq data sets revealed one shared gene family in the 1980 samples and three shared gene families in the 2008 samples.

3.8. Gene Expression Analysis

Quantifying the extent of sequence reads for various deleterious genes in each sample from RNA-Seq data revealed fewer genes but more expressions in samples from 2008 than the 1980 samples for genes associated with 3′UTR, 5′UTR, downstream, upstream, synonymous, and nonsynonymous rSNPs (Figure S22). Evaluating the expressions of genes associated with deleterious rSNPs (Figure S23) showed that more expressions of deleterious genes that were shared between samples of two collection years and that were unique to each collection year were detected in more samples from 2008 than in 1980. If only fixed deleterious genes were considered, their expressions were less in the 2008 samples.

4. Discussion

Our study represents an interesting genomic assessment of genetic risks in crop wild relative populations through a comparative 28-year-based analysis of genetic changes in wild barley in mutation, selection, and adaptation potential. The results not only confirmed the genetic impacts of global warming previously reported on these wild barley populations [14], but also revealed the reduced adaptation potential for these populations. These findings, along with those of similar but independent research by Zhou et al. [16], highlight the genetic risks of wild barley under global warming and support the need to conserve crop wild relatives.
These wild barley populations displayed more selective sweep regions, identified by two approaches, in samples from 2008 than those from 1980 (Figure 2), while some selective sweep regions were shared. The mean Tajima’s D estimates were all negative at either individual chromosomes or the whole genome (Figures S4 and S5), suggesting purging selection occurred in these populations. However, the mean Tajima’s D estimates are all positive for different genic regions, indicating that balanced selection was dominant for various types of genes. More genes in the 2008 samples were under purging selection than in the 1980 samples, as the proportions of sliding windows with negative Tajima’s D estimates for different genic regions were higher in the former samples. These patterns of selection were consistent with those reported for wild emmer wheat populations [15].
In response to 28 years of global warming, the assayed wild barley population also showed the presence of elevated mutations (Figure 3). More deleterious mutations were accumulated and fixed in samples collected in 2008 than in 1980, as evident in both exome capture and RNA-Seq data sets (Table S4). Also, the 2008 samples harbored more deleterious SNPs with low allelic frequencies (<0.1) than the 1980 samples (Figure S8). On average, the mean mutation burden of surviving individuals was reduced, and so was the population mutation burden, over 28 years of global warming. This may reflect the impact of the intensified directional selection on these deleterious mutations over 28 generations. However, the overall population adaptation potential was predicted to be lowered in the 2008 samples (Figure 5), as there were fewer advantageous mutations predicted in samples from 2008 than in 1980. Together, these findings indicated a lowered evolutionary adaptation for these assayed barley populations and consequently a higher genetic risk for losing barley wild relatives.
Our gene ontology and expression analyses helped to identify the shift in biological processes over 28 generations for those predicted deleterious genes. First, many deleterious genes displayed GO terms associated with “temperature” (Figure S17), showing the directional impact of global warming on temperature-sensitive genes. Second, gene family analysis revealed that the NLP transcription factor family was uniquely detected in the 1980 samples, while the lipid metabolism gene family was uniquely detected in the 2008 samples (Figure S20), suggesting an enhancement of drought tolerance. Third, a shift was identified in RNA-Seq data from the oxidation–reduction process in the 1980 samples to the single-organism reproductive process in the 2008 samples (Figure S18), allowing for better adaptation to global warming. More interestingly, the 2008 samples displayed fewer genes but more expressions than the 1980 samples (Figure S23). This meant that the 2008-collected plants had turned off many genes at the growth stage of Z14 (or the fifth leaf) and turned on gene conditioning reproductive processes, such as early flowering genes. However, when only fixed deleterious genes were considered, their expressions were less in the 2008 samples. These findings together helped to explain, at least partly, the early finding of reduced flowering time in these barley populations [14]. Despite this, our study was unable to establish the immediate links of global warming to all of these genetic responses through association analyses, as other climate changes such as CO2 increase, and their interactions may have also contributed to these genetic changes [15]. Also, it was reported that nonselective forces may contribute to genetic differentiations observed among wild barley populations of the Southern Levant [39].
It is worth noting that our research differed from that conducted by Zhou et al. [16] in some aspects. First, we assessed the genomic variants based on exome capture and RNA-Seq methods, while they employed whole-genome sequencing with 6.8× genome coverage. Second, we assayed 24 samples per collection year, while they analyzed 76 to 87 samples per collection year. Third, our focus was on the inferences of selection and mutation, while they extended the analyses to effective population size, genome–environment association, and genetic vulnerability. Thus, our analyses are limited in resolution, particularly at the population level, when compared to those from Zhou et al. [16]. However, two independent studies yielded essentially similar related findings. For example, intensified selection and elevated mutation were observed in both studies, and the reduced adaptation potential that was inferred from alpha-dfe estimates from the 1980 to 2008 samples was consistent with their higher predicted genetic vulnerability in some wild barley populations.
Our research, along with the study of Zhou et al. [16], not only demonstrated a feasible approach to assess the population adaptation potential or predict the genetic vulnerability of crop wild relatives in the wild, but also generated findings useful for understanding the evolutionary dynamics of natural plant populations involving mutation and selection, as few studies have been carried out using sequencing technologies to quantify adaptive genetic variation in the wild [15,40]. With the prediction of continuous global warming, some natural plant populations will be under continuous threat and would be expected to lower the adaptation potential further with elevated mutations. The reduced adaptation potential increases the genetic risk of losing crop wild relative populations [41,42]. Thus, conserving valuable crop wild relatives has become more critical than before to secure valuable genetic resources for improving food production, as many crop wild relatives are not properly protected and are under conservation [8]. The genetic erosion in wild barley may not be unique, as other crop wild relatives are also threatened by climate change and other factors such as habitat destruction and degradation, invasive species, pollution, and over-harvesting [13,43,44,45]. Continuous assessments on the population adaptation potential of crop wild relatives may yield useful information to guide conservation efforts, particularly in protected natural areas.

5. Conclusions

Sequencing 48 wild barley samples of 10 populations collected in 1980 and 2008 identified 12,926 and 13,361 deleterious SNPs for the 1980 and 2008 samples, respectively. Wild barley samples displayed intensified selective sweeps and elevated deleterious mutations across seven chromosomes in response to 28 years of global warming. On average, the 2008 samples had lower individual and population mutational burdens, but the population adaptation potential was estimated to be lower in the 2008 samples. These findings are significant for understanding the genetic risks of losing wild barley under global warming and support the need to conserve crop wild relatives.

Supplementary Materials

The following supporting information can be downloaded from Figshare DOI (https://0-doi-org.brum.beds.ac.uk/10.6084/m9.figshare.25238245; accessed on 7 March 2024). It consists of four sections: A. Supplemental Materials and Methods; B. References for Supplemental Materials and Methods; C. Tables S1–S4; and D. Figures S1–S23. References [46,47,48,49,50,51] are the additional references cited in the Supplementary Materials.

Author Contributions

Y.-B.F. conceived the research, acquired the funding, designed the experiment, analyzed the data, and wrote the paper; G.W.P. conducted the experiment, performed the bioinformatics analysis, and edited the paper; E.N. provided the wild barley germplasm; and A.B. acquired the funding, designed the experiment, and edited the paper. All authors have read and agreed to the published version of the manuscript.

Funding

This research was funded by AAFC GDRI grants J-001584 and J-002373 to Yong-Bi Fu and Ana Badea.

Institutional Review Board Statement

Not applicable.

Informed Consent Statement

Not applicable.

Data Availability Statement

The original exome capture and RNA-Seq sequence data were deposited in NCBI’s SRA database under BioProject IDs, PRJNA507441 and PRJNA507455, respectively. Some supplemental output or metadata can be found in the Supplementary Materials.

Acknowledgments

We acknowledge helpful assistance in exome capture design from Martin Mascher; in sequencing from David Konkin, Inge Roewer, Christine Sidebottom, and Brian Boyle; in bioinformatics analysis from Punna Ramu, Nikolaos Alachiotis, Paula Tataru, Thomas Bataillon, Thorfinn Sand Korneliussen, Jeffrey Ross-Ibarra, Logan Kistler, Jennifer Hillman-Jackson, Pankaj Jaiswal, Thomas Kono, Peter Morrell, and Tal Pupko; in research support and comments on the early version of the manuscript from Nick Tinker; and in technical support, manuscript editing and formatting from Carolee Horbach. We are also grateful for the constructive comments on the early version of the manuscript received from three journal anonymous reviewers.

Conflicts of Interest

The authors declare no conflicts of interest.

References

  1. Tanksley, S.D.; McCouch, S.R. Seed banks and molecular maps: Unlocking genetic potential from the wild. Science 1997, 277, 1063–1066. [Google Scholar] [CrossRef]
  2. Krugman, T.; Nevo, E.; Beharav, A.; Sela, H.; Fahima, T. The Institute of Evolution Wild Cereal Gene Bank at the University of Haifa. Isr. J. Plant Sci. 2018, 65, 129–146. [Google Scholar] [CrossRef]
  3. Nevo, E. Origin, evolution, population genetics and resources for breeding of wild barley, Hordeum spontaneum, in the Fertile Crescent. In Barley: Genetics, Molecular Biology and Biotechnology; Shewry, P., Ed.; C.A.B. International: Wallingford, UK, 1992; pp. 19–43. ISBN 978-0-85198-725-5. [Google Scholar]
  4. Hajjar, R.; Hodgkin, T. The use of wild relatives in crop improvement: A survey of developments over the last 20 years. Euphytica 2007, 156, 1–13. [Google Scholar] [CrossRef]
  5. Saranga, Y. A century of wheat research—From wild emmer discovery to genome analysis. Isr. J. Plant Sci. 2007, 55, 3–4. [Google Scholar]
  6. Fu, Y.B.; Somers, D.J. Genome-wide reduction of genetic diversity in wheat breeding. Crop Sci. 2009, 49, 161–168. [Google Scholar] [CrossRef]
  7. Lobell, D.B.; Schlenker, W.; Costa-Roberts, J. Climate trends and global crop production since 1980. Science 2011, 333, 616–620. [Google Scholar] [CrossRef] [PubMed]
  8. Khoury, C.K.; Amariles, D.; Soto, J.S.; Diaz, M.V.; Sotelo, S.; Sosa, C.C.; Ramírez-Villegas, J.; Achicanoy, H.A.; Velásquez-Tibatá, J.; Guarino, L.; et al. Comprehensiveness of conservation of useful wild plants: An operational indicator for biodiversity and sustainable development targets. Ecol. Indic. 2019, 98, 420–429. [Google Scholar] [CrossRef]
  9. Castañeda-Álvarez, N.P.; Khoury, C.K.; Achicanoy, H.A.; Bernau, V.; Dempewolf, H.; Eastwood, R.J.; Guarino, L.; Harker, R.H.; Jarvis, A.; Maxted, N.; et al. Global conservation priorities for crop wild relatives. Nat. Plants 2016, 2, 16022. [Google Scholar] [CrossRef]
  10. Root, T.L.; Price, J.T.; Hall, K.R.; Schneider, S.H.; Rosenzweig, C.; Pounds, J.A. Fingerprints of global warming on wild animals and plants. Nature 2003, 421, 57–60. [Google Scholar] [CrossRef]
  11. Thuiller, T.; Lavorel, S.; Araújo, M.B.; Sykes, M.T.; Prentice, I.C. Climate change threats to plant diversity in Europe. Proc. Natl. Acad. Sci. USA 2005, 102, 8245–8250. [Google Scholar] [CrossRef]
  12. Chen, I.-C.; Hill, J.K.; Ohlemuller, R.; Roy, D.B.; Thomas, C.D. Rapid range shifts of species associated with high levels of climate warming. Science 2011, 333, 1024–1026. [Google Scholar] [CrossRef] [PubMed]
  13. Jarvis, A.; Lane, A.; Hijmans, R.J. The effect of climate change on crop wild relatives. Agric. Ecosyst. Environ. 2008, 126, 13–23. [Google Scholar] [CrossRef]
  14. Nevo, E.; Fu, Y.B.; Pavlicek, T.; Khalifa, S.; Tavasi, M.; Beiles, A. Evolution of wild cereals during 28 years of global warming in Israel. Proc. Natl. Acad. Sci. USA 2012, 109, 3412–3415. [Google Scholar] [CrossRef] [PubMed]
  15. Fu, Y.B.; Peterson, G.W.; Horbach, C.; Konkin, D.J.; Beiles, A.; Nevo, E. Elevated mutation and selection in wild emmer wheat in response to 28 years of global warming. Proc. Natl. Acad. Sci. USA 2019, 116, 20002–20008. [Google Scholar] [CrossRef] [PubMed]
  16. Zhou, Y.; Song, R.; Nevo, E.; Fu, X.; Wang, X.; Wang, Y.; Wang, C.; Chen, J.; Sun, G.; Sun, D.; et al. Genomic evidence for climate-linked diversity loss and increased vulnerability of wild barley spanning 28 years of climate warming. Sci. Total Environ. 2024, 913, 169679. [Google Scholar] [CrossRef] [PubMed]
  17. Parmesan, C. Ecological and evolutionary responses to recent climate change. Annu. Rev. Ecol. Evol. Syst. 2006, 37, 637–669. [Google Scholar] [CrossRef]
  18. Saisho, D.; Takeda, K. Barley: Emergence as a new research material of crop science. Plant Cell Physiol. 2011, 52, 724–727. [Google Scholar] [CrossRef]
  19. Morin, R.; Bainbridge, M.; Fejes, A.; Hirst, M.; Krzywinski, M.; Pugh, T.; McDonald, H.; Varhol, R.; Jones, S.; Marra, M. Profiling the HeLa S3 transcriptome using randomly primed cDNA and massively parallel short-read sequencing. BioTechniques 2008, 45, 81–94. [Google Scholar] [CrossRef]
  20. Mascher, M.; Richmond, T.A.; Gerhardt, D.J.; Himmelbach, A.; Clissold, L.; Sampath, D.; Ayling, S.; Steuernagel, B.; Pfeifer, M.; D’Ascenzo, M.; et al. Barley whole exome capture: A tool for genomic research in the genus Hordeum and beyond. Plant J. 2013, 76, 494–505. [Google Scholar] [CrossRef]
  21. Mascher, M.; Gundlach, H.; Himmelbach, A.; Beier, S.; Twardziok, S.O.; Wicker, T.; Radchuk, V.; Dockter, C.; Hedley, P.E.; Russell, J.; et al. A chromosome conformation capture ordered sequence of the barley genome. Nature 2017, 544, 427–433. [Google Scholar] [CrossRef]
  22. Korneliussen, T.S.; Albrechtsen, A.; Nielsen, R. ANGSD: Analysis of next generation sequencing data. BMC Bioinform. 2014, 15, 356. [Google Scholar] [CrossRef]
  23. Li, H.; Handsaker, B.; Wysoker, A.; Fennell, T.; Ruan, J.; Homer, N.; Marth, G.; Abecasis, G.; Durbin, R.; 1000 Genome Project Data Processing Subgroup. The Sequence Alignment/Map format and SAMtools. Bioinformatics 2009, 25, 2078–2079. [Google Scholar] [CrossRef]
  24. McLaren, W.; Gil, L.; Hunt, S.E.; Riat, H.S.; Ritchie, G.R.; Thormann, A.; Flicek, P.; Cunningham, F. The Ensembl Variant Effect Predictor. Genome Biol. 2016, 17, 122. [Google Scholar] [CrossRef]
  25. Naithani, S.; Geniza, M.; Jaiswal, P. Variant Effect Prediction Analysis Using Resources Available at Gramene Database. In Plant Genomics Databases. Methods in Molecular Biology; van Dijk, A., Ed.; Humana Press: New York, NY, USA, 2017; Volume 1533, pp. 279–297. [Google Scholar] [CrossRef]
  26. Vaser, R.; Adusumalli, S.; Leng, S.N.; Sikic, M.; Ng, P.C. SIFT missense predictions for genomes. Nat. Protoc. 2015, 11, 1–9. [Google Scholar] [CrossRef]
  27. Alachiotis, N.; Pavlidis, P. RAiSD detects positive selection based on multiple signatures of a selective sweep and SNP vectors. Commun. Biol. 2018, 1, 79. [Google Scholar] [CrossRef]
  28. Korneliussen, T.S.; Moltke, I.; Albrechtsen, A.; Nielsen, R. Calculation of Tajima’s D and other neutrality test statistics from low depth next-generation sequencing data. BMC Bioinform. 2013, 14, 289. [Google Scholar] [CrossRef] [PubMed]
  29. Cooper, G.M.; Stone, E.A.; Asimenos, G.; NISC Comparative Sequencing Program; Green, E.D.; Batzoglou, S.; Sidow, A. Distribution and intensity of constraint in mammalian genomic sequence. Genome Res. 2005, 15, 901–913. [Google Scholar] [CrossRef] [PubMed]
  30. Davydov, E.V.; Goode, D.L.; Sirota, M.; Cooper, G.M.; Sidow, A.; Batzoglou, S. Identifying a high fraction of the human genome to be under selective constraint using GERP++. PLoS Comput. Biol. 2010, 6, e1001025. [Google Scholar] [CrossRef] [PubMed]
  31. Harris, R.S. Improved Pairwise Alignment of Genomic DNA. Ph.D. Thesis, Pennsylvania State University, State College, PA, USA, 2007. [Google Scholar]
  32. Siepel, A.; Bejerano, G.; Pedersen, J.S.; Hinrichs, A.; Hou, M.; Rosenbloom, K.; Clawson, H.; Spieth, J.; Hillier, L.W.; Richards, S.; et al. Evolutionarily conserved elements in vertebrate, insect, worm, and yeast genomes. Genome Res. 2005, 15, 1034–1050. [Google Scholar] [CrossRef] [PubMed]
  33. Tataru, P.; Mollion, M.; Glémin, S.; Bataillon, T. Inference of distribution of fitness effects and proportion of adaptive substitutions from polymorphism data. Genetics 2017, 207, 1103–1119. [Google Scholar] [CrossRef] [PubMed]
  34. Loewe, L.; Charlesworth, B.; Bartolomé, C.; Nöel, V. Estimating selection on nonsynonymous mutations. Genetics 2006, 172, 1079–1092. [Google Scholar] [CrossRef]
  35. Tian, T.; Liu, Y.; Yan, H.; You, Q.; Yi, X.; Du, Z.; Xu, W.; Su, Z. agriGO v2.0: A GO analysis toolkit for the agricultural community, 2017 update. Nucleic Acids Res. 2017, 45, W122–W129. [Google Scholar] [CrossRef]
  36. Supek, F.; Bošnjak, M.; Škunca, N.; Šmuc, T. REVIGO summarizes and visualizes long lists of gene ontology terms. PLoS ONE 2011, 6, e21800. [Google Scholar] [CrossRef]
  37. Bedre, R.; Mandadi, K. GenFam: A new web application for gene family-based classification and functional enrichment analysis of plant genomes. Plant Direct. 2019, 3, e00191. [Google Scholar] [CrossRef]
  38. Pertea, M.; Pertea, G.M.; Antonescu, C.M.; Chang, T.C.; Mendell, J.T.; Salzberg, S.L. StringTie enables improved reconstruction of a transcriptome from RNA-seq reads. Nat. Biotechnol. 2015, 33, 290–295. [Google Scholar] [CrossRef] [PubMed]
  39. Chang, C.W.; Fridman, E.; Mascher, M.; Himmelbach, A.; Schmid, K. Physical geography, isolation by distance and environmental variables shape genomic variation of wild barley (Hordeum vulgare L. ssp. spontaneum) in the Southern Levant. Heredity 2022, 128, 107–119. [Google Scholar] [CrossRef] [PubMed]
  40. Mousseau, T.A.; Sinervo, B.; Endler, J. Adaptive Genetic Variation in the Wild; Oxford University Press: New York, NY, USA, 2000; p. 265. [Google Scholar]
  41. Razgour, O.; Forester, B.; Taggart, J.B.; Bekaert, M.; Juste, J.; Ibáñez, C.; Puechmaille, S.J.; Novella-Fernandez, R.; Alberdi, A.; Manel, S. Considering adaptive genetic variation in climate change vulnerability assessment reduces species range loss projections. Proc. Natl. Acad. Sci. USA 2019, 116, 10418–10423. [Google Scholar] [CrossRef]
  42. Cortés, A.J.; López-Hernández, F.; Blair, M.W. Genome–environment associations, an innovative tool for studying heritable evolutionary adaptation in orphan crops and wild relatives. Front. Genet. 2022, 13, 910386. [Google Scholar] [CrossRef] [PubMed]
  43. Ramirez-Villegas, J.; Jarvis, A.; Touval, J. Analysis of threats to South American flora and its implications for conservation. J. Nat. Conserv. 2012, 20, 337–348. [Google Scholar] [CrossRef]
  44. Brummitt, N.A.; Bachman, S.P.; Griffiths-Lee, J.; Lutz, M.; Moat, J.F.; Farjon, A.; Donaldson, J.S.; Hilton-Taylor, C.; Meagher, T.R.; Albuquerque, S.; et al. Green plants in the red: A baseline global assessment for the IUCN Sampled Red List Index for Plants. PLoS ONE 2015, 10, e0135152. [Google Scholar] [CrossRef] [PubMed]
  45. Newbold, T.; Hudson, L.N.; Hill, S.L.; Contu, S.; Lysenko, I.; Senior, R.A.; Börger, L.; Bennett, D.J.; Choimes, A.; Collen, B.; et al. Global effects of land use on local terrestrial biodiversity. Nature 2015, 520, 45–50. [Google Scholar] [CrossRef]
  46. Blanchette, M.; Kent, W.J.; Riemer, C.; Elnitski, L.; Smit, A.F.; Roskin, K.M.; Baertsch, R.; Rosenbloom, K.; Clawson, H.; Green, E.D.; et al. Aligning multiple genomic sequences with the threaded blockset aligner. Genome Res. 2004, 14, 708–715. [Google Scholar] [CrossRef]
  47. Bolger, A.M.; Lohse, M.; Usadel, B. Trimmomatic: A flexible trimmer for Illumina Sequence Data. Bioinformatics 2014, 30, 2114–2120. [Google Scholar] [CrossRef]
  48. Hou, M.; Riemer, C. TOAST and ROAST. 2008. Available online: http://www.bx.psu.edu/~cathy/toast-roast.tmp/README.toast-roast.html (accessed on 7 March 2024).
  49. Li, H.; Durbin, R. Fast and accurate long-read alignment with Burrows-Wheeler Transform. Bioinformatics 2010, 26, 589–595. [Google Scholar] [CrossRef] [PubMed]
  50. van der Auwera, G.A.; Carneiro, M.O.; Hartl, C.; Poplin, R.; del Angel, G.; Levy-Moonshine, A.; Jordan, T.; Shakir, K.; Roazen, D.; Thibault, J.; et al. From FastQ data to high-confidence variant calls: The genome analysis toolkit best practices pipeline. Curr. Protoc. Bioinform. 2013, 43, 11.10.1–11.10.33. [Google Scholar] [CrossRef] [PubMed]
  51. Zadoks, J.C.; Chang, T.T.; Konzak, C.F. A decimal code for the growth stages of cereals. Weed Res. 1974, 14, 415–421. [Google Scholar] [CrossRef]
Figure 1. SNP detection and characterization via exome capture (e) and RNA-Seq (r) analyses of the wild barley samples collected in 1980 and 2008. The 1980 and 2008 samples are labeled in green and orange, respectively, for two data types (e and r). Panel (A) shows the total SNPs detected for each collection year, (B) the proportion of the missense SNPs detected over the total SNPs, and (C) the proportion of the synonymous SNPs. Note y-axis of Panel A shows SNP counts in a 1:1,000,000 scale.
Sci 06 00016 g001
Figure 2. Selective sweeps detected by RAiSD and Tajima’s D estimation for exome capture (e) data of the wild barley samples collected in 1980 and in 2008. The 1980 and 2008 samples are labeled in green and orange, respectively. Panel (A) shows the proportion of sliding windows with RAiSD mu estimates greater than nine standard deviations; (B) the proportion of sliding windows with RAiSD mu estimates greater than twelve standard deviations; (C) the proportion of sliding windows with negative Tajima’s D estimates smaller than three standard deviations; and (D) the proportion of sliding windows with negative Tajima’s D estimates smaller than six standard deviations.
Sci 06 00016 g002
Figure 3. The proportions of the total SNPs that were identified as deleterious via SIFT and GERP++ RS scores from exome capture (e) and RNA-Seq (r) data of the wild barley samples collected in 1980 and 2008. The 1980 and 2008 samples are labeled in green and orange, respectively, for two data types (e and r). Panel (A) shows the proportion of the deleterious SNPs based on SIFT score, (B) the proportion of the deleterious SNPs based on SIFT and GERP++ RS scores, and (C) the proportion of the fixed deleterious SNPs based on SIFT and GERP++ RS scores.
Sci 06 00016 g003
Figure 4. Mutation burdens estimated from exome capture (e) and RNA-Seq (r) data of the wild barley samples collected in 1980 and 2008. The 1980 and 2008 samples are labelled in green and orange, respectively, for two data types (e and r). Panel (A) shows the mean individual heterozygous mutation burden in each collection year, (B) the mean individual homozygous mutation burden, (C) the mean individual total load, and (D) the population-weighted GERP++ RS mutation burden.
Sci 06 00016 g004
Figure 5. Population adaptation potential estimated by PolyDFE from exome capture (e) and RNA-Seq (r) data of the wild barley samples collected in 1980 and in 2008. The 1980 and 2008 samples are labelled in green and orange, respectively, for two data types (e and r). Alpha-dfe estimates based on the whole genome (w) and individual chromosomes (i) from exome capture data were presented for each collection year. The value above each bar was the mean alpha-dfe estimate.
Sci 06 00016 g005
Disclaimer/Publisher’s Note: The statements, opinions and data contained in all publications are solely those of the individual author(s) and contributor(s) and not of MDPI and/or the editor(s). MDPI and/or the editor(s) disclaim responsibility for any injury to people or property resulting from any ideas, methods, instructions or products referred to in the content.

