Design, Synthesis, and Docking Study of Acyl Thiourea Derivatives as Possible Histone Deacetylase Inhibitors with a Novel Zinc Binding Group


Abstract
:
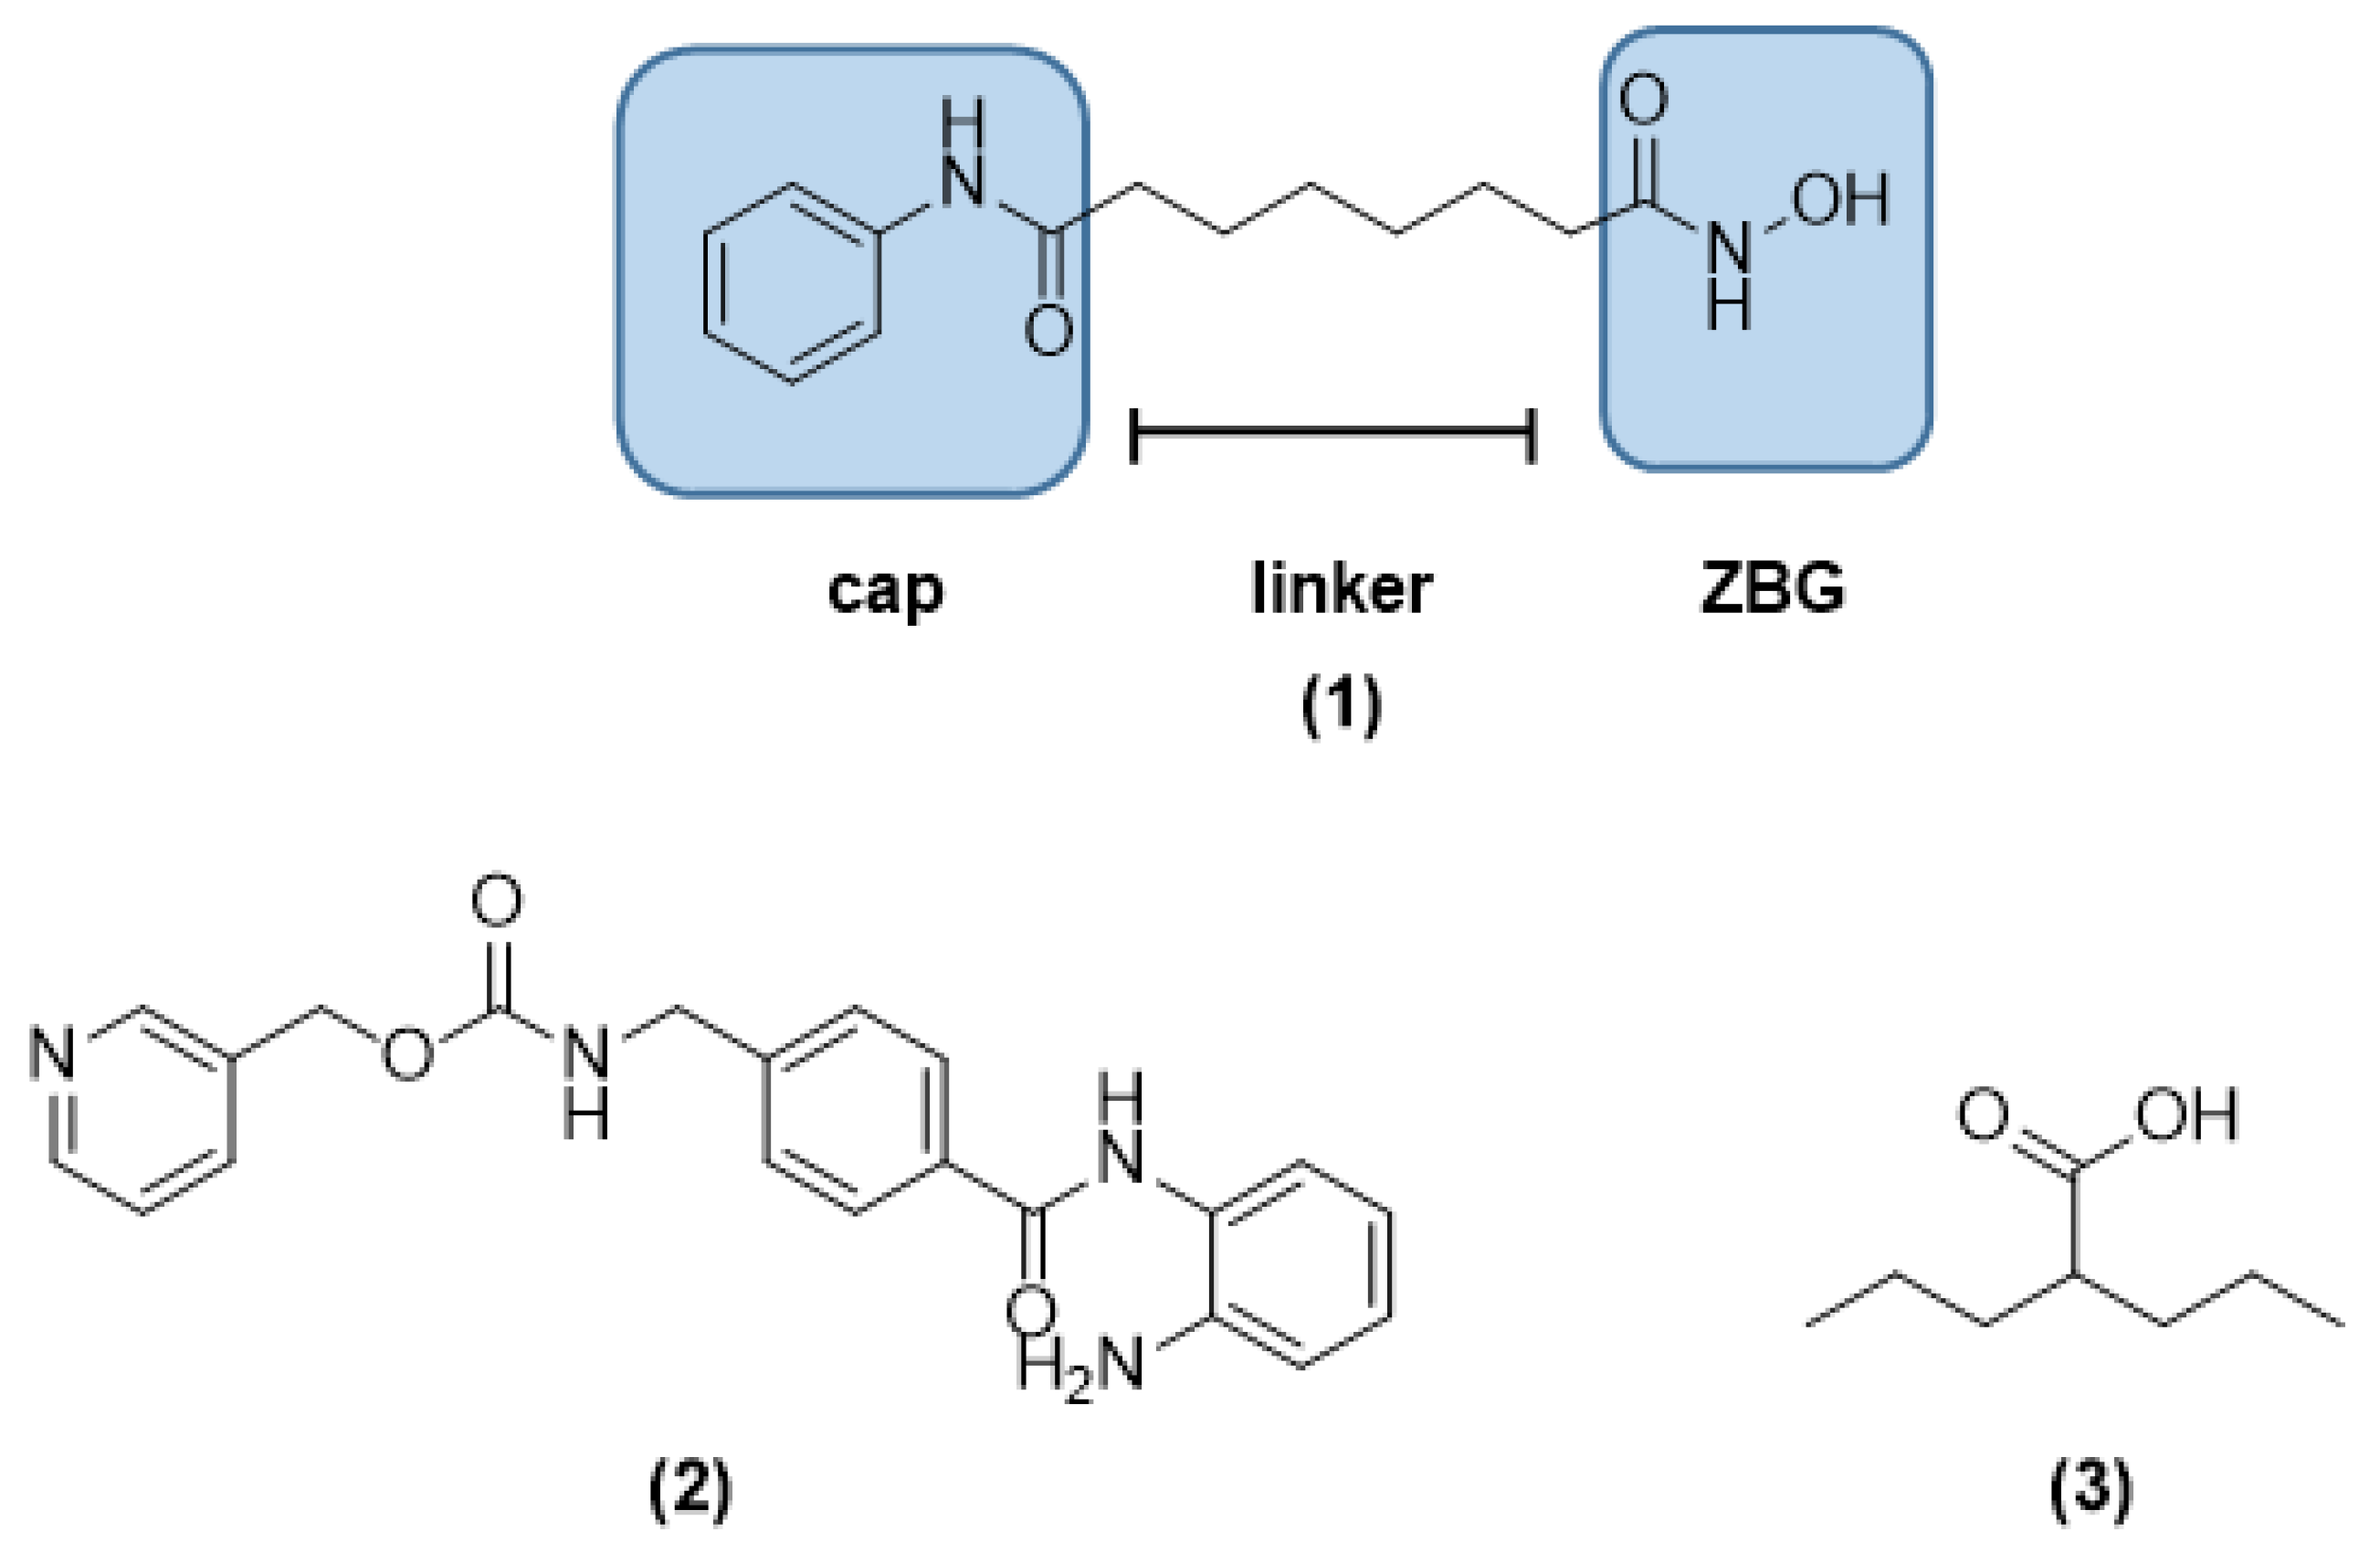
1. Introduction
2. Materials and Methods
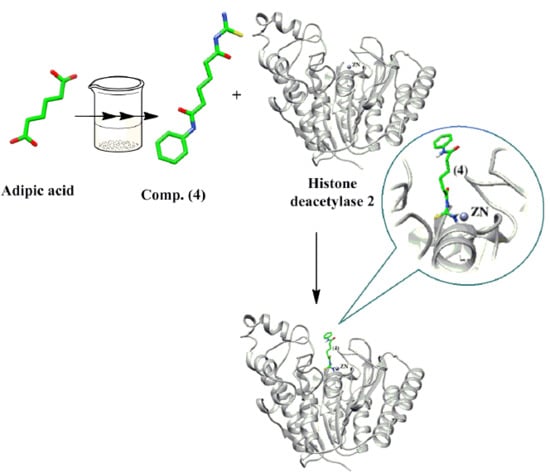
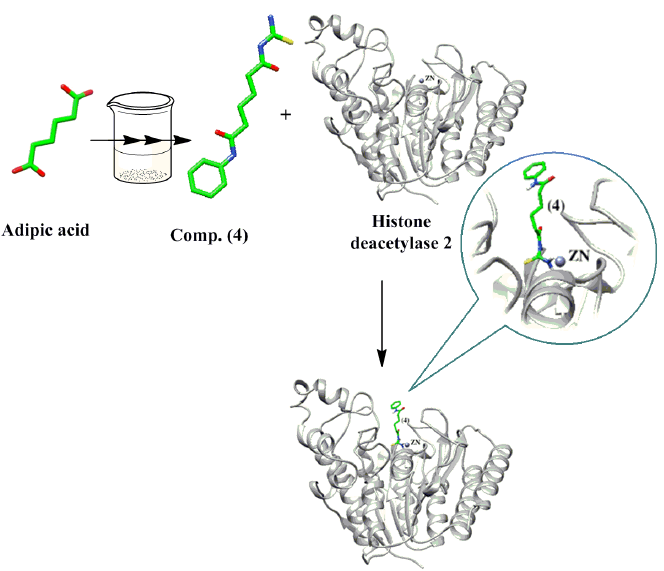
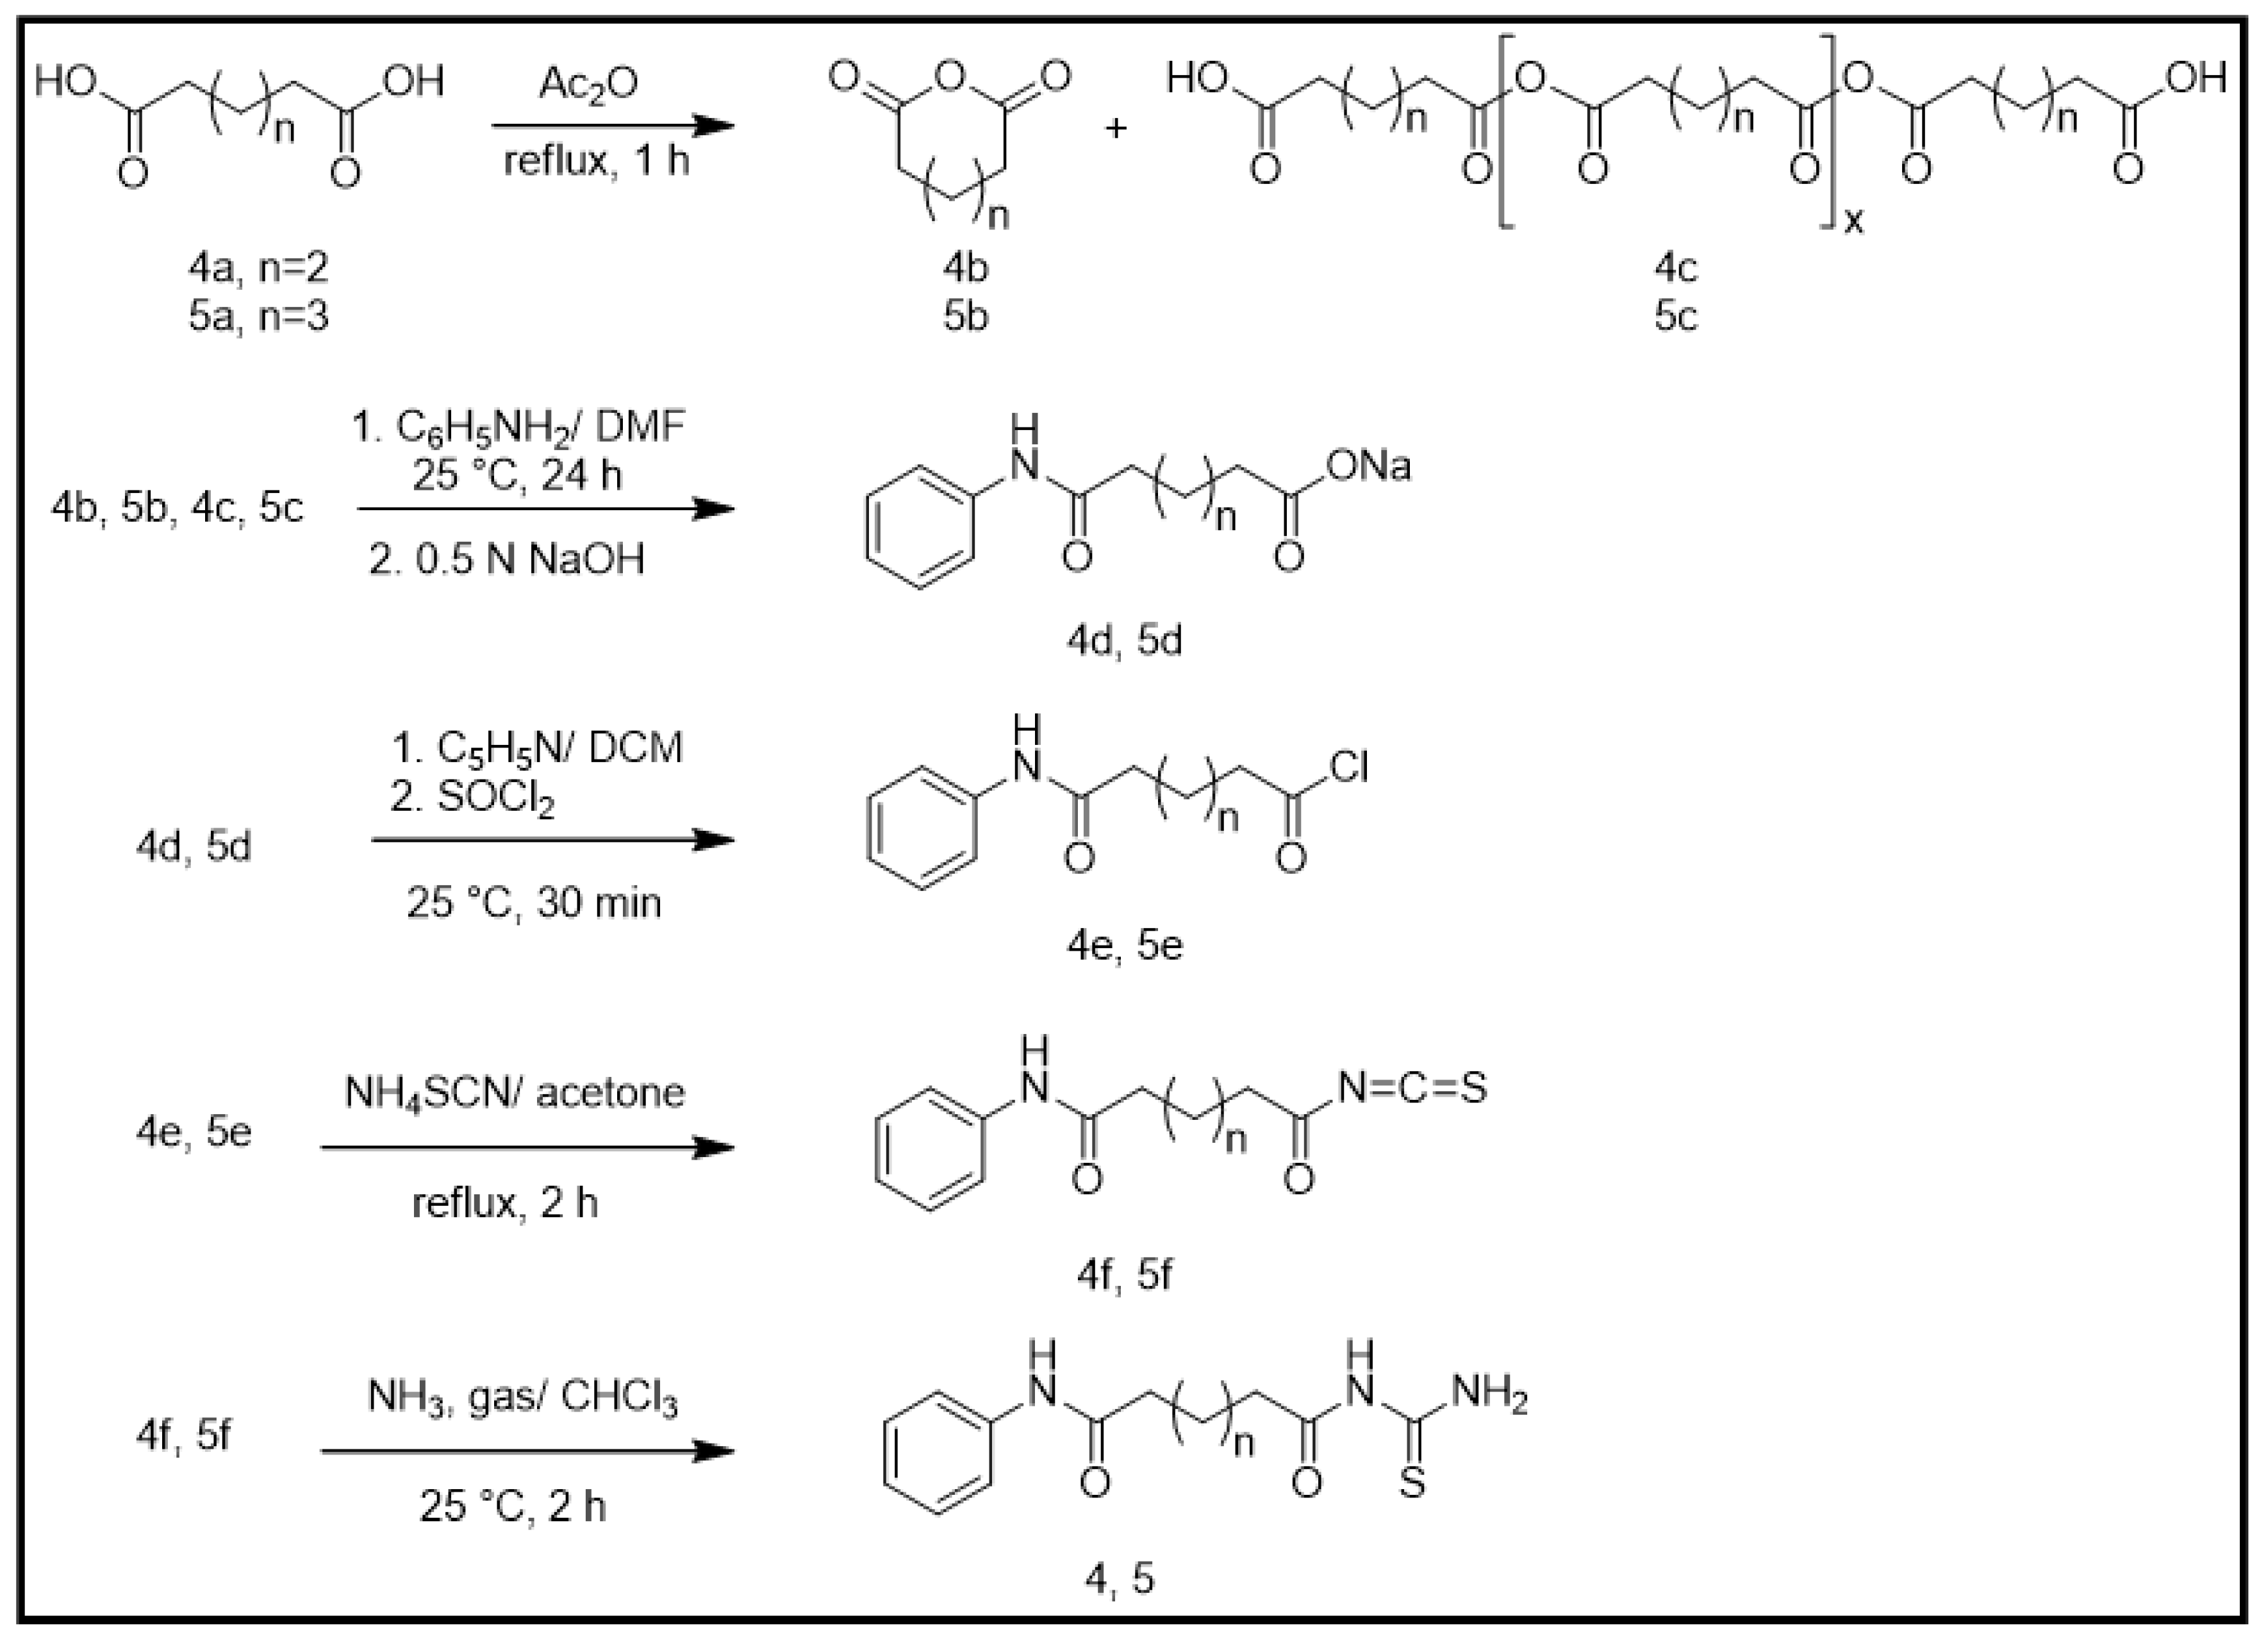
2.1. Chemical Synthesis (Scheme 1)
2.1.1. General Synthesis of Adipic and Pimelic Anhydrides (4b and 5b)
2.1.2. General Synthesis of Monosodium Adipic Monoanilide and Monosodium Pimelic Monoanilide (4d and 5d)
2.1.3. General Synthesis of Adipic Monoanilide Acid Chloride and Pimelic Monoanilide Acid Chloride (4e and 5e)
2.1.4. General Synthesis of Adipic Monoanilide Isothiocyanate and Pimelic Monoanilide Isothiocyanate (4f and 5f)
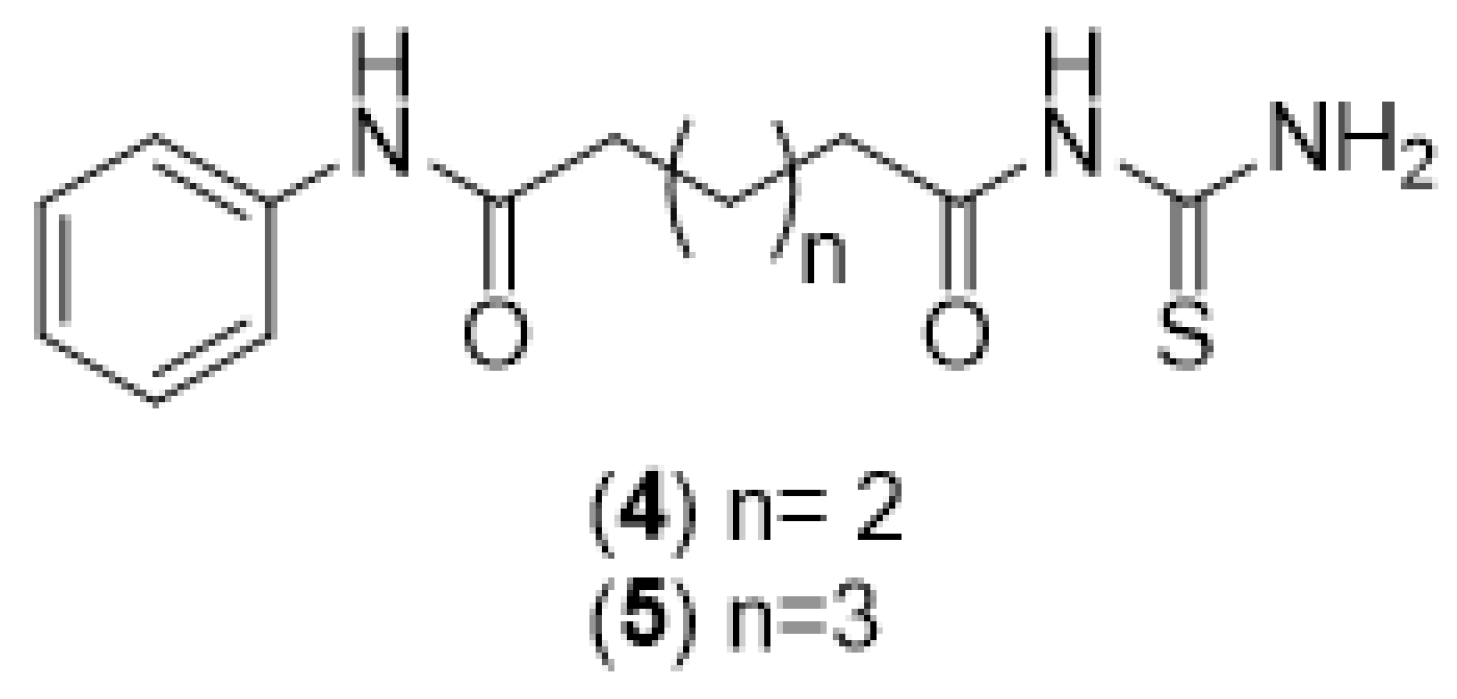
2.1.5. General Synthesis of N-Adipoyl Monoanilide Thiourea and N-Pimeloyl Monoanilide Thiourea (4 and 5)
2.2. In Vitro Cytotoxicity Study
2.2.1. Maintenance of Cell Cultures
2.2.2. Cytotoxicity Assay
2.3. Molecular Docking
3. Results and Discussion
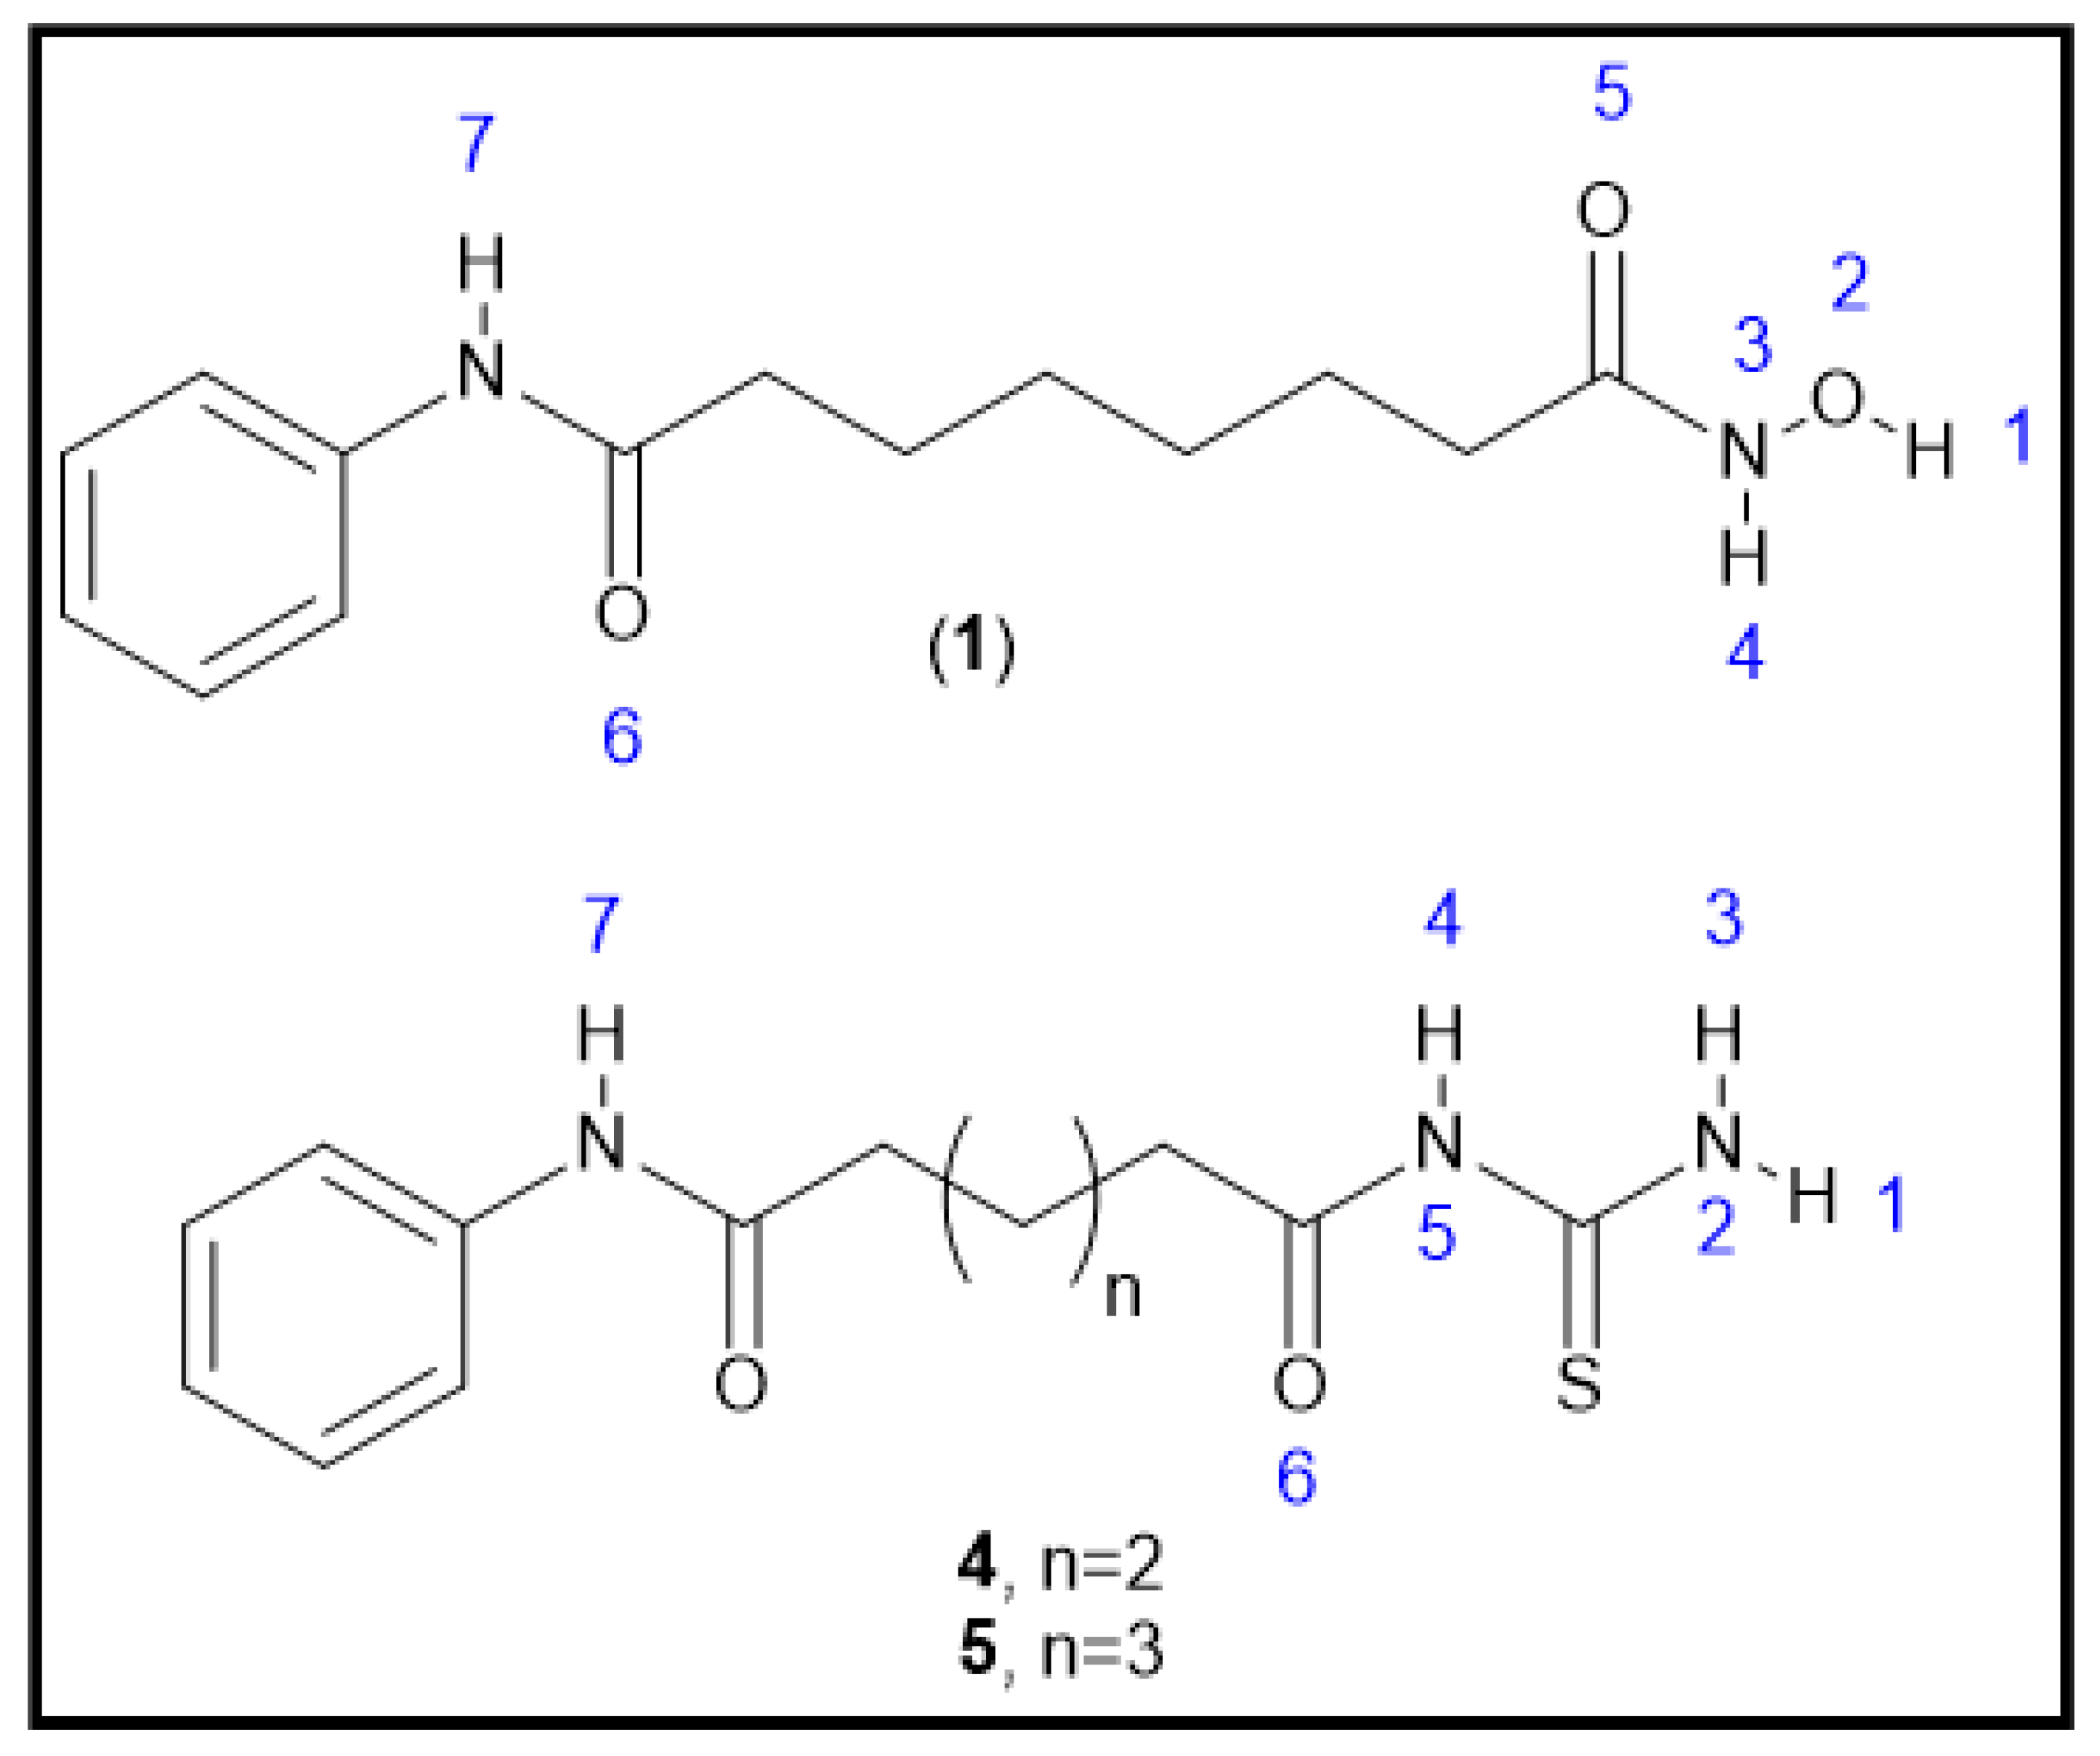
3.1. Chemical Synthesis
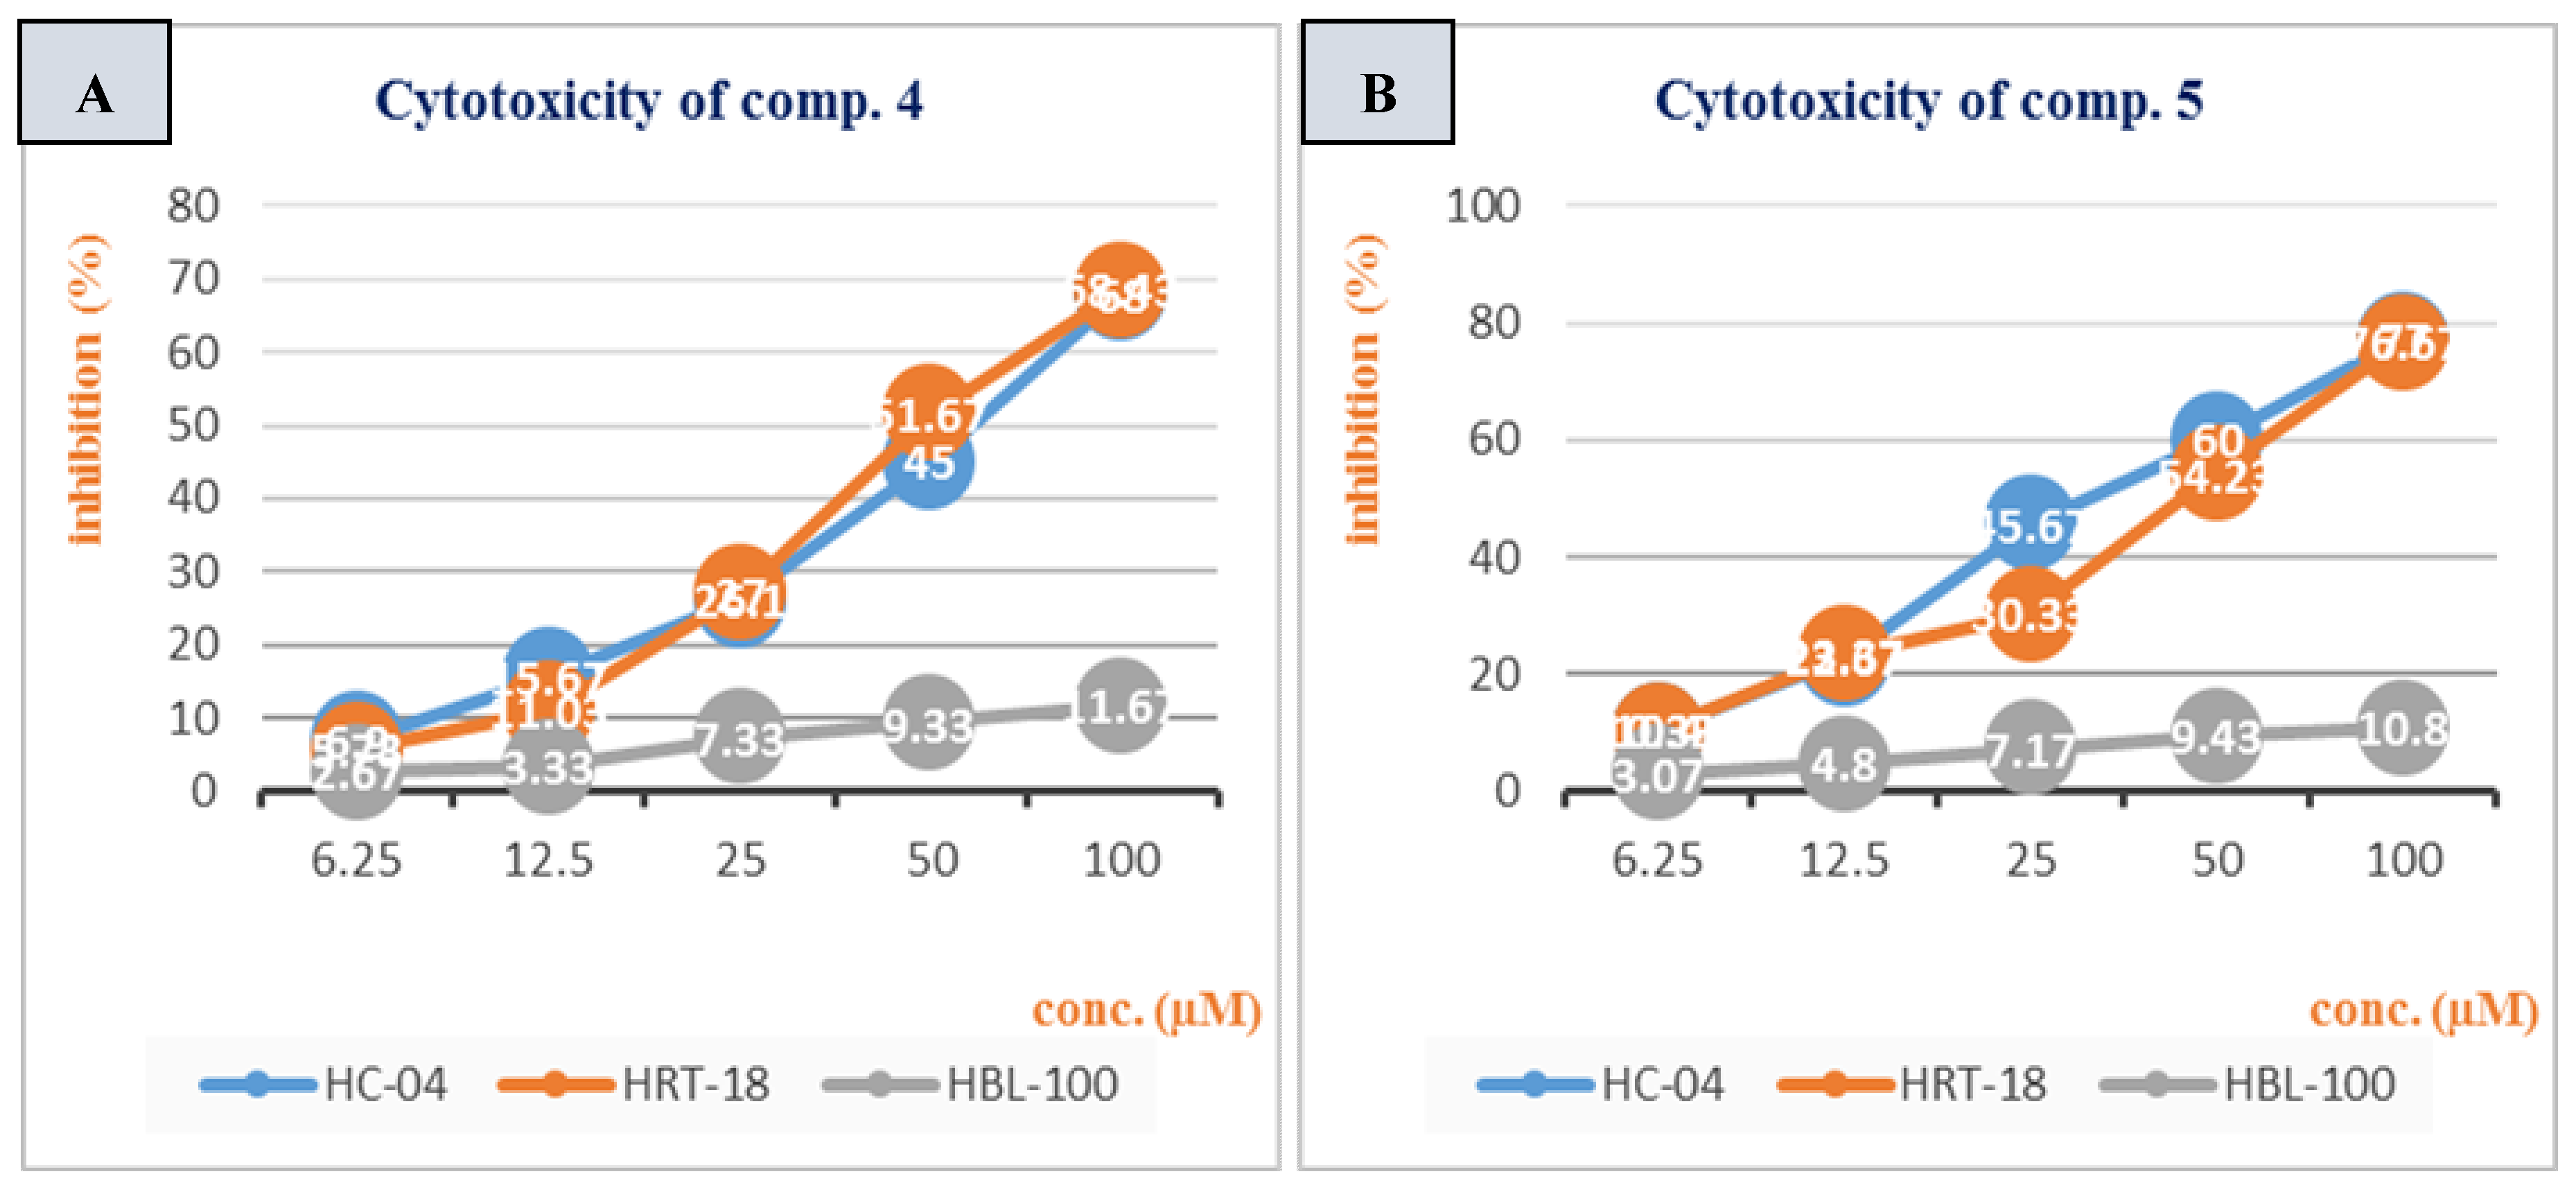
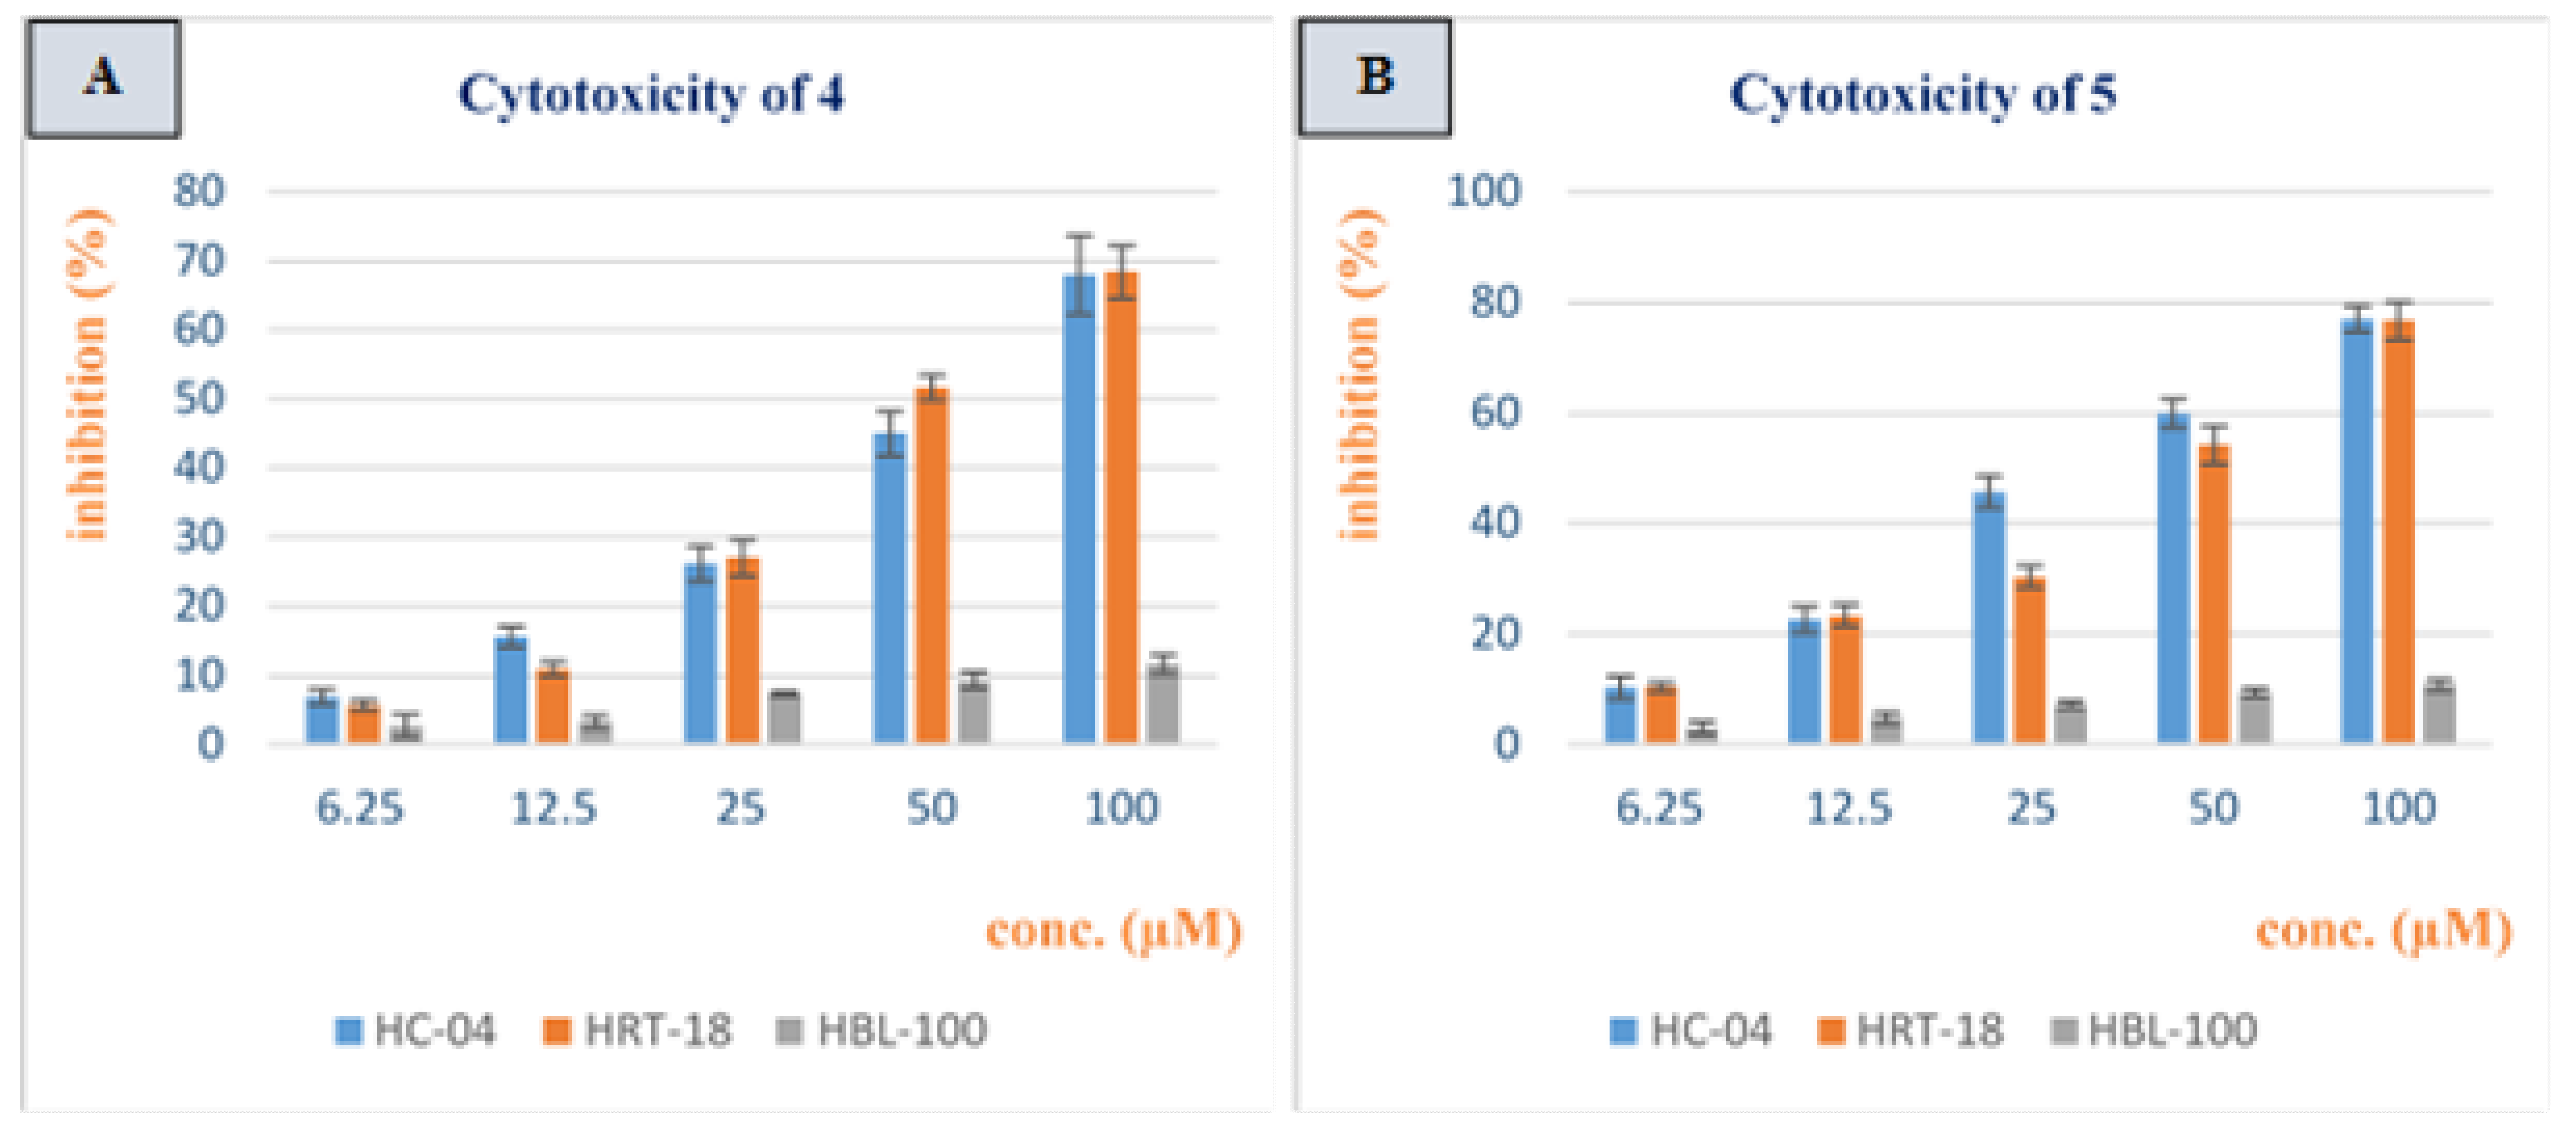
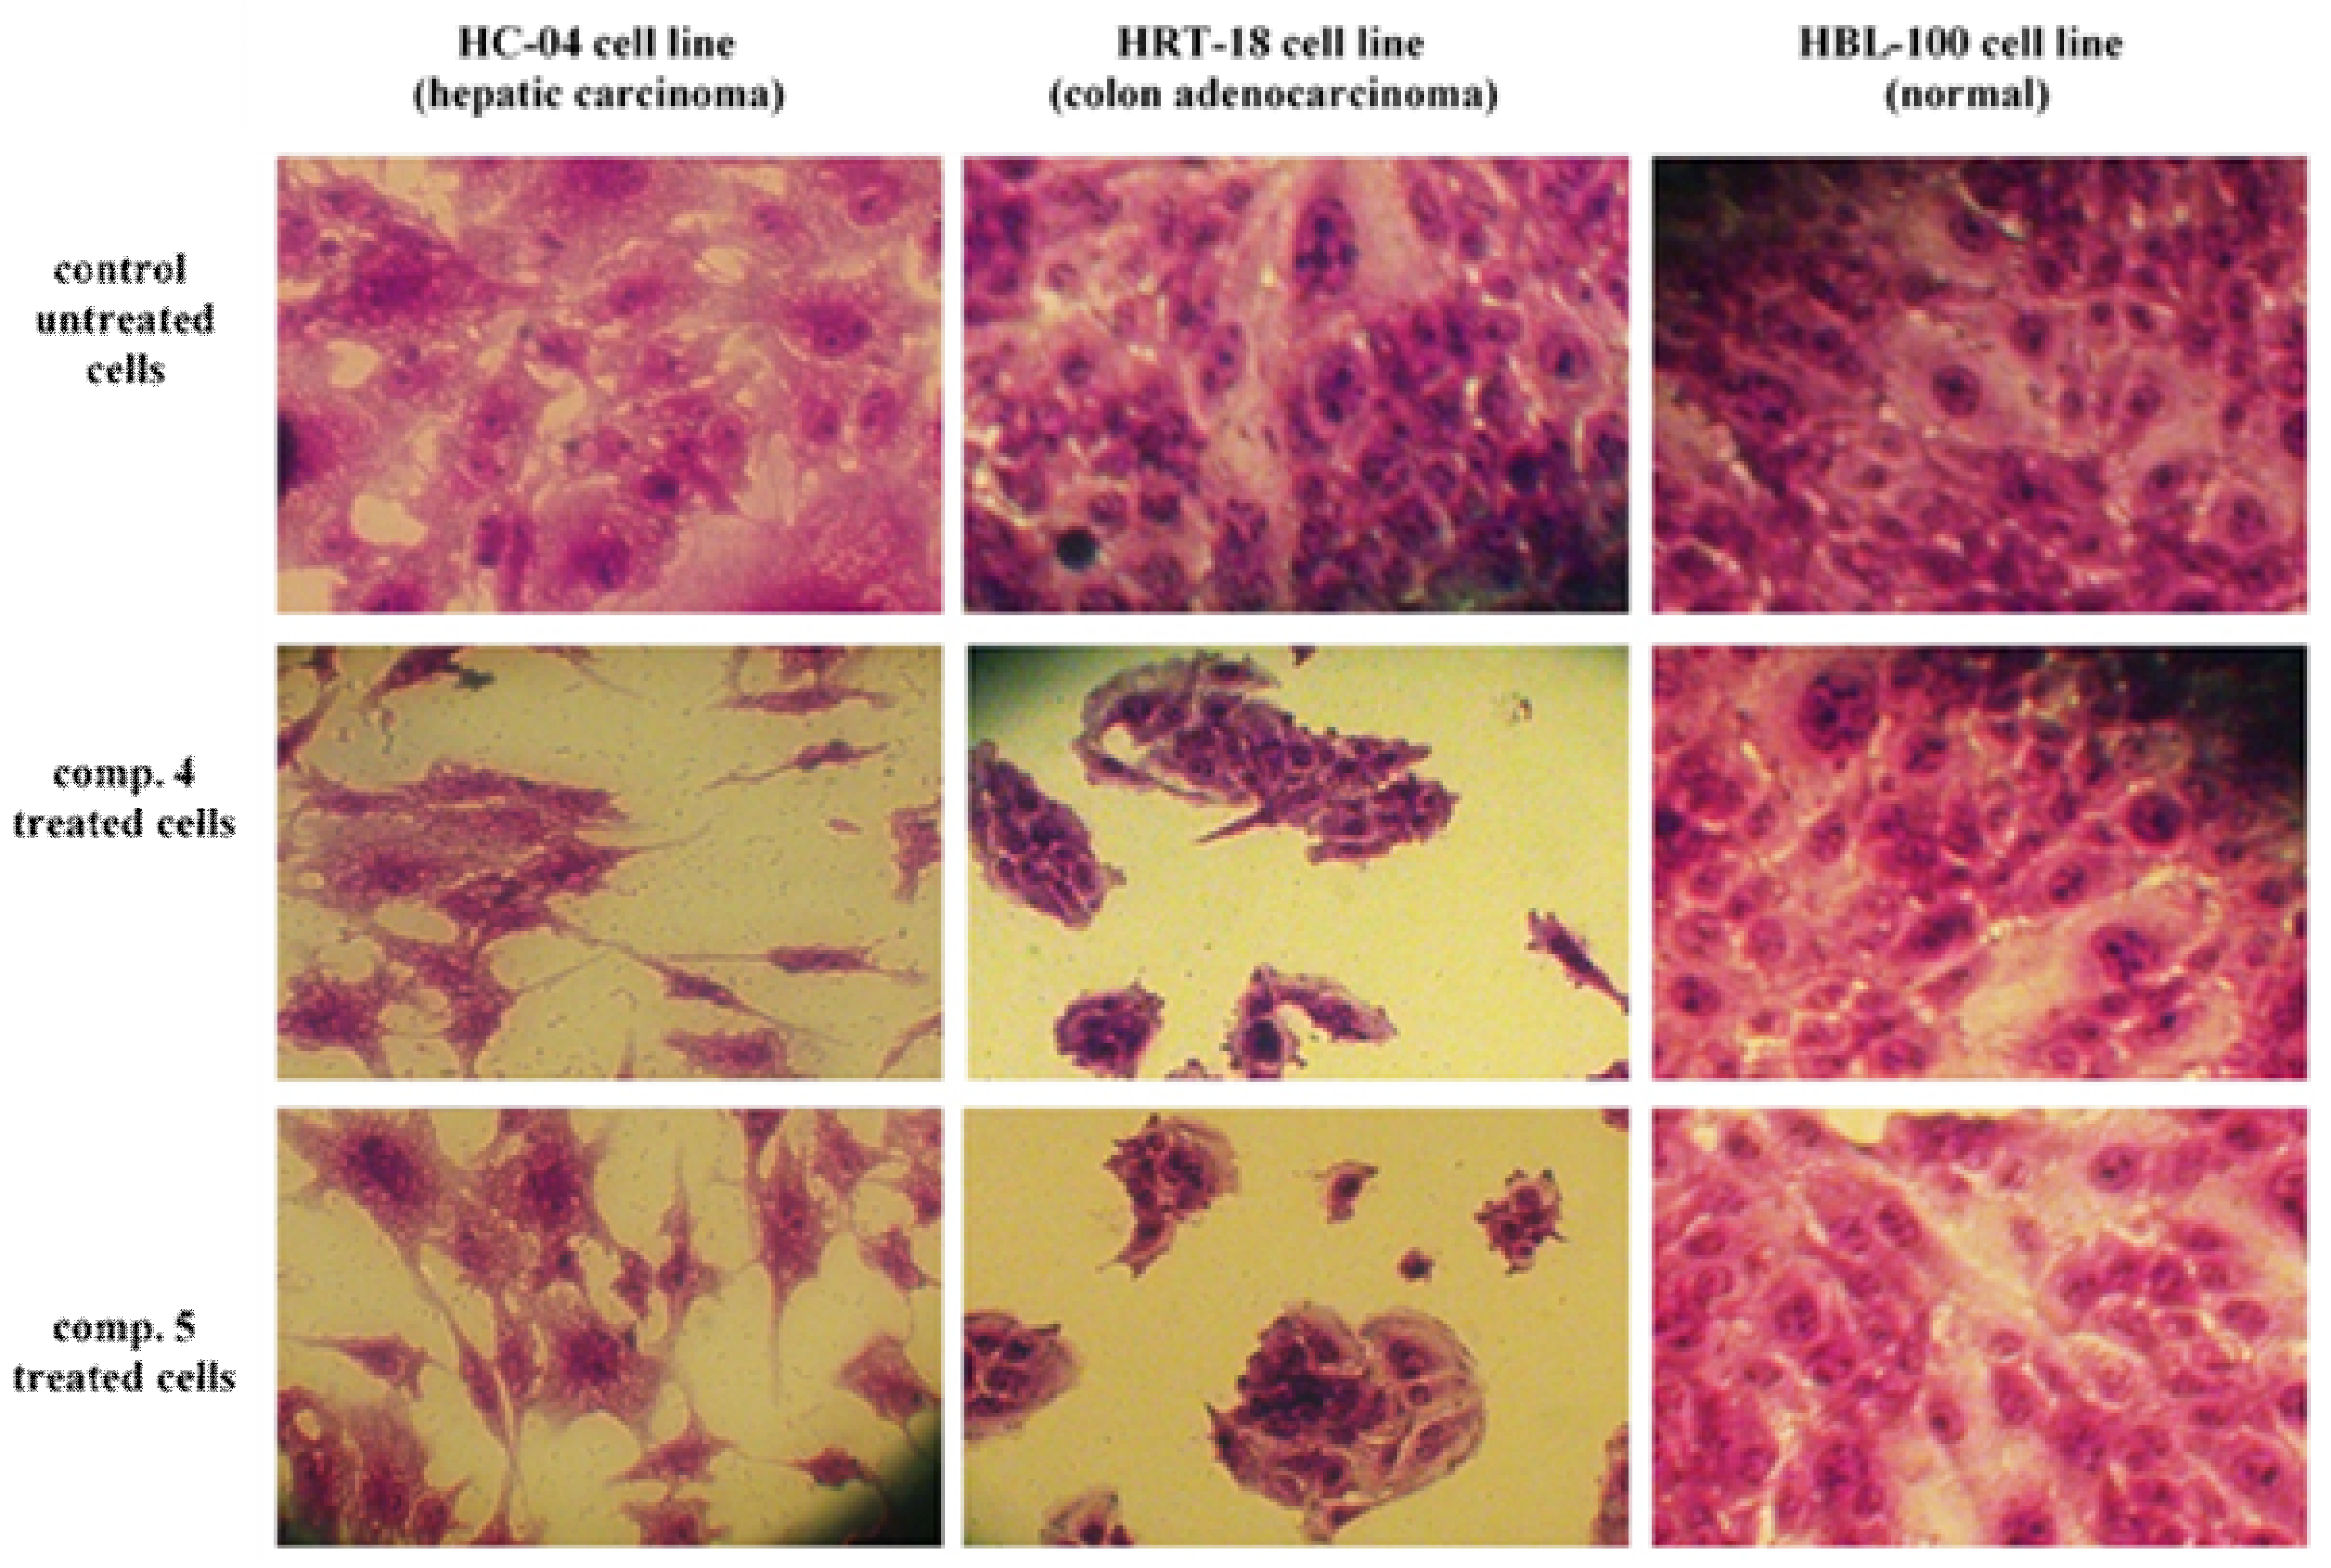
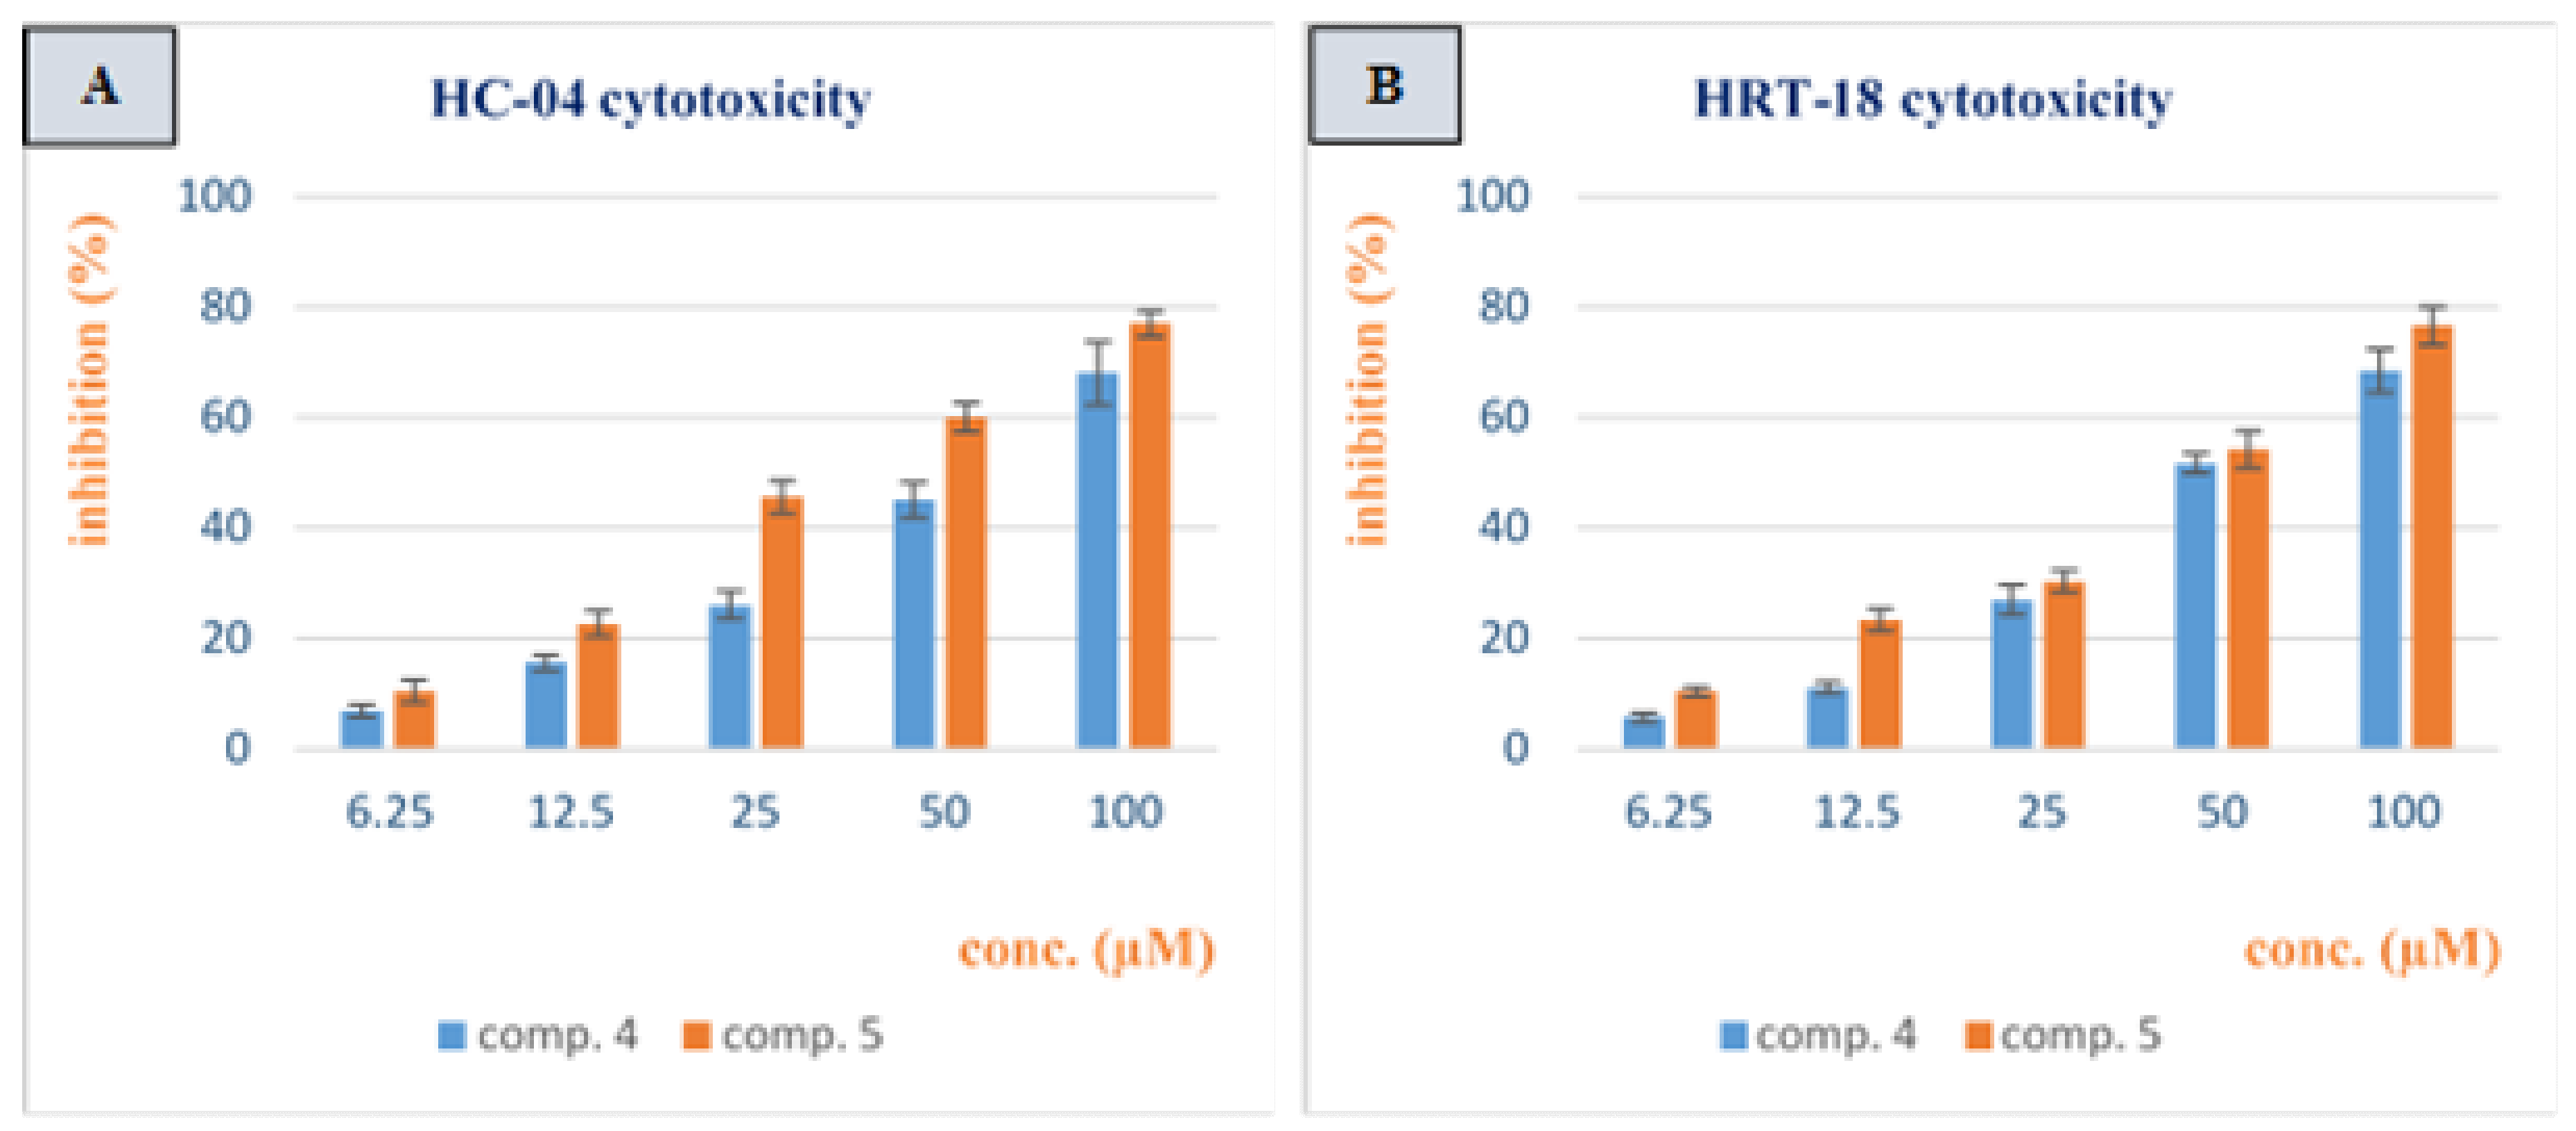
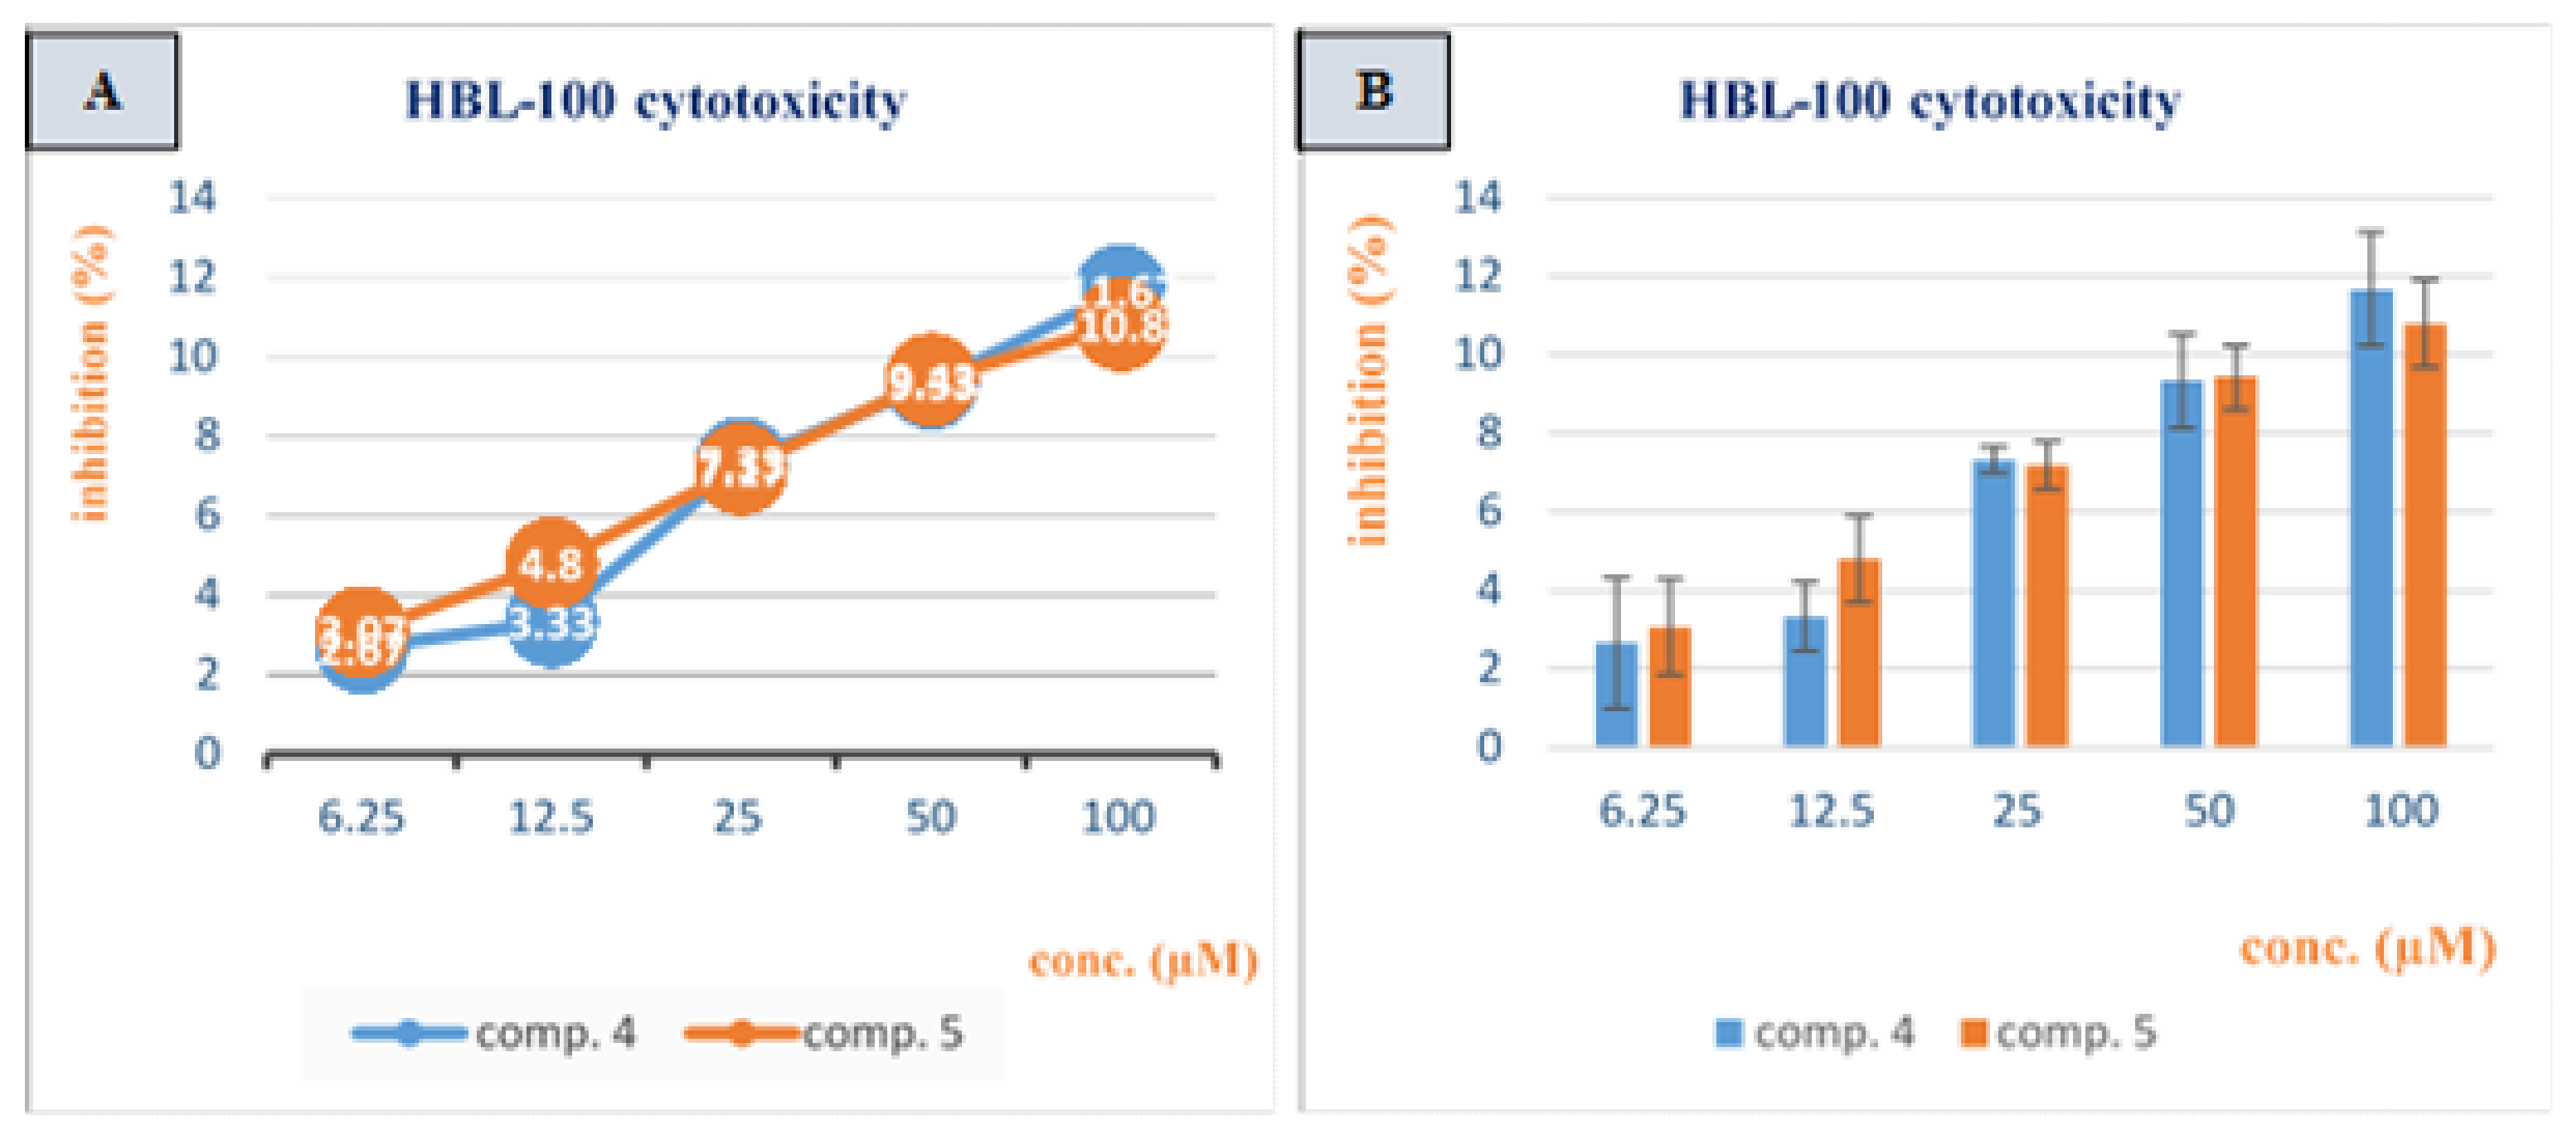
3.2. Cytotoxicity Study
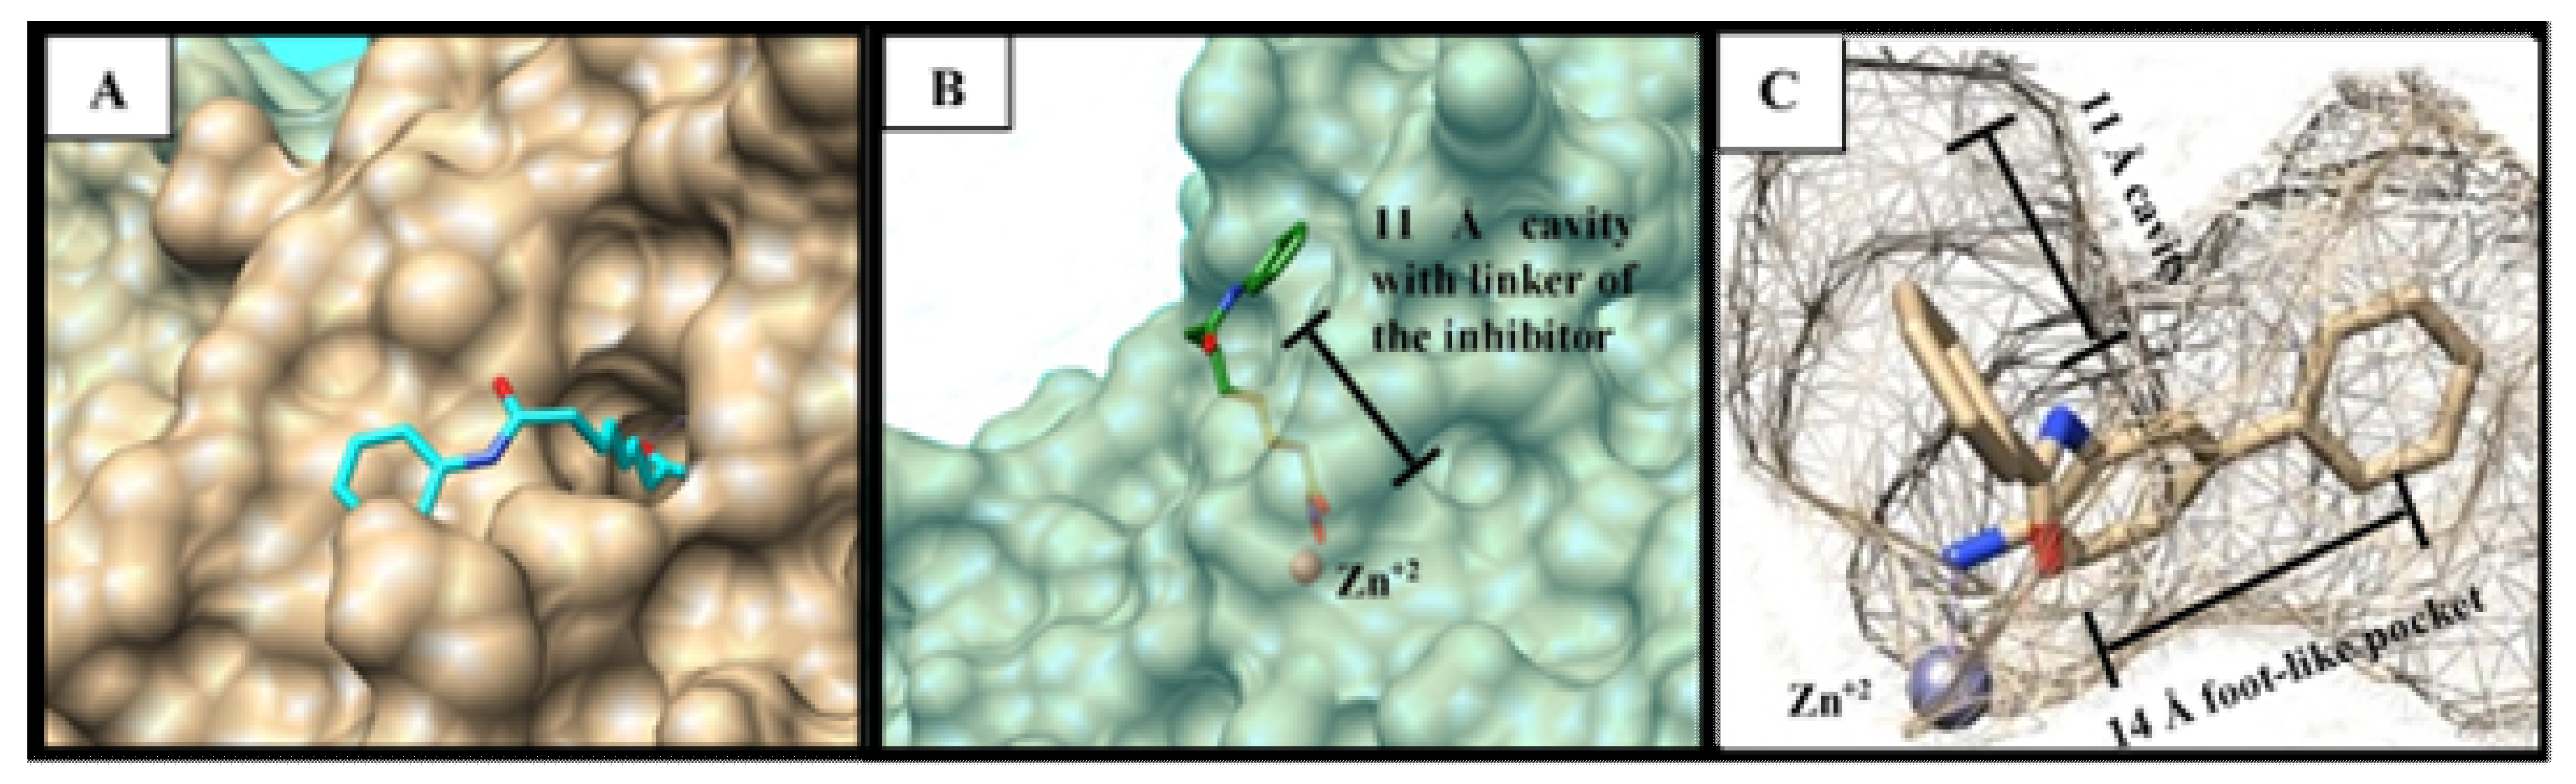
3.3. Docking Study
4. Conclusions
Supplementary Materials
Author Contributions
Funding
Conflicts of Interest
References
- Seto, E.; Yoshida, M. Erasers of Histone Acetylation: The Histone Deacetylase Enzymes. Cold Spring Harbor Perspectives in Biology. Cold Spring Harb Perspect Med. 2014, 6, 18713. [Google Scholar]
- Burtis, C.A.; Ashwood, E.R.; Bruns, D.E. Tietz Textbook of Clinical Chemistry and Molecular Diagnostics, Fifth ed.; Elsevier: Maryland Heights, MO, USA, 2012; pp. 1212–1214. [Google Scholar]
- Delcuve, G.P.; Khan, D.H.; Davie, J.R. Targeting Class I Histone Deacetylases in Cancer Therapy. Expert Opin. Ther. Targets 2013, 17, 29–41. [Google Scholar] [CrossRef] [PubMed]
- Cao, F.; Zwinderman, M.R.H.; Dekker, F.J. The Process and Strategy for Developing Selective Histone Deacetylase 3 Inhibitors. Molecules 2018, 23, 551. [Google Scholar] [CrossRef]
- Zhang, L.; Zhang, J.; Jiang, Q.; Zhang, L.; Song, W. Zinc Binding Groups for Histone Deacetylase Inhibitors. J. Enzym. Inhib. Med. Chem. 2018, 33, 714–721. [Google Scholar] [CrossRef]
- Li, Z.; Zhu, W.G. Targeting Histone Deacetylases for Cancer Therapy: From Molecular Mechanisms to Clinical Implications. Int. J. Biol. Sci. 2014, 10, 757–770. [Google Scholar] [CrossRef] [Green Version]
- Kim, H.-J.; Bae, S.-C. Histone Deacetylase Inhibitors: Molecular Mechanisms of Action and Clinical Trials as Anti-Cancer Drugs. Am. J. Transl. Res. 2011, 3, 166–179. [Google Scholar]
- Lauffer, B.E.L.; Mintzer, R.; Fong, R.; Mukund, S.; Tam, C.; Zilberleyb, I.; Flicke, B.; Ritscher, A.; Fedorowicz, G.; Vallero, R.; et al. Histone Deacetylase (HDAC) Inhibitor Kinetic Rate Constants Correlate with Cellular Histone Acetylation but Not Transcription and Cell Viability. J. Biol. Chem. 2013, 288, 26926–26943. [Google Scholar] [CrossRef] [Green Version]
- Wang, D.F.; Helquist, P.; Wiech, N.L.; Wiest, O. Toward Selective Histone Deacetylase Inhibitor Design: Homology Modeling, Docking Studies, and Molecular Dynamics Simulations of Human Class I Histone Deacetylases. J. Med. Chem. 2005, 48, 6936–6947. [Google Scholar] [CrossRef]
- Bieliauskas, A.V.; Pflum, M.K.H. Isoform-Selective Histone Deacetylase Inhibitors. Chem. Soc. Rev. 2008, 37, 1402–1413. [Google Scholar] [CrossRef]
- Manal, M.; Chandrasekar, M.J.N.; Gomathi Priya, J.; Nanjan, M.J. Inhibitors of Histone Deacetylase as Antitumor Agents: A Critical Review. Bioorg. Chem. 2016, 67, 18–42. [Google Scholar] [CrossRef]
- Marks, P.A. Discovery and Development of SAHA as an Anticancer Agent. Oncogene 2007, 26, 1351–1356. [Google Scholar] [CrossRef] [PubMed]
- Mann, B.S.; Johnson, J.R.; Cohen, M.H.; Justice, R.; Pazdur, R. FDA Approval Summary: Vorinostat for Treatment of Advanced Primary Cutaneous T-Cell Lymphoma. Oncologist 2007, 12, 1247–1252. [Google Scholar] [CrossRef] [PubMed]
- Binzet, G.; Külcü, N.; Flörke, U.; Arslan, H. Synthesis and Characterization of Cu(II) and Ni(II) Complexes of Some 4-Bromo-N-(Di(Alkyl/Aryl)Carbamothioyl) Benzamide Derivatives. J. Coord. Chem. 2009, 62, 3454–3462. [Google Scholar] [CrossRef]
- Saeed, S.; Rashid, N.; Jones, P.; Hussain, R. Thermomechanical Studies of Thermally Stable Metal-Containing Epoxy Polymers from Diglycidyl Ether of Bisphenol A and Amino-Thiourea Metal Complexes. Eur. J. Chem. 2011, 2, 77–82. [Google Scholar] [CrossRef]
- Selvakumaran, N.; Sandhiya, L.; Bhuvanesh, N.S.P.; Senthilkumar, K.; Karvembu, R. Structural Diversity in Aroylthiourea Copper Complexes-Formation and Biological Evaluation of [Cu(i)(μ-S)SCl]2,: Cis -Cu(II)S2O2, Trans -Cu(II)S2O2 and Cu(i)S3 Cores. New J. Chem. 2016, 40, 5401–5413. [Google Scholar] [CrossRef]
- Gandhaveeti, R.; Konakanchi, R.; Jyothi, P.; Bhuvanesh, N.S.P.; Anandaram, S. Unusual Coordination Mode of Aroyl/Acyl Thiourea Ligands and Their π-Arene Ruthenium (II) Piano-Stool Complexes: Synthesis, Molecular Geometry, Theoretical Studies and Biological Applications. Appl. Organometal. Chem. 2019, 33, 1–13. [Google Scholar] [CrossRef]
- Parmar, S.; Kumar, Y.; Mittal, A. Synthesis, Spectroscopic and Pharmacological Studies of Bivalent Copper, Zinc and Mercury Complexes of Thiourea. S. Afr. J. Chem. 2010, 63, 123–129. [Google Scholar]
- Prakash, J.T.J.; Nirmala, L.R. Synthesis, Spectral and Thermal Properties of Bis Thiourea Zinc Acetate (BTZA) Nonlinear Optical Single Crystal. Int. J. Comput. Appl. 2010, 8, 7–11. [Google Scholar] [CrossRef]
- Swaminathan, K.; Irving, H.M.N.H. Infra-Red Absorption Spectra Complexes of Thiourea. J. Inorg. Nucl. Chem. 1964, 26, 1291–1294. [Google Scholar] [CrossRef]
- Trott, O.; Olson, A.J. AutoDock Vina: Improving the Speed and Accuracy of Docking with a New Scoring Function, Efficient Optimization, and Multithreading. J. Comput. Chem. 2010, 31, 455–461. [Google Scholar] [CrossRef]
- Pettersen, E.F.; Goddard, T.D.; Huang, C.C.; Couch, G.S.; Greenblatt, D.M.; Meng, E.C.; Ferrin, T.E. UCSF Chimera--a Visualization System for Exploratory Research and Analysis. J. Comput. Chem. 2004, 25, 1605–1612. [Google Scholar] [CrossRef] [PubMed]
- Berman, H.M.; Westbrook, J.; Feng, Z.; Gilliland, G.; Bhat, T.N.; Weissig, H.; Shindyalov, I.N.; Bourne, P.E. The Protein Data Bank. Nucleic Acids Res. 2000, 28, 235–242. [Google Scholar] [CrossRef] [PubMed] [Green Version]
- Sulaiman, G.M.; Jabir, M.S.; Hameed, A.H. Nanoscale Modification of Chrysin for Improved of Therapeutic Efficiency and Cytotoxicity. Artif. Cells Nanomed. Biotechnol. 2018, 46 (Suppl. 1), 708–720. [Google Scholar] [CrossRef] [PubMed]
- Jabir, M.S.; Taha, A.A.; Sahib, U.I.; Taqi, Z.J.; Al-Shammari, A.M.; Salman, A.S. Novel of Nano Delivery System for Linalool Loaded on Gold Nanoparticles Conjugated with CALNN Peptide for Application in Drug Uptake and Induction of Cell Death on Breast Cancer Cell Line. Mater. Sci. Eng. C 2019, 94, 949–964. [Google Scholar] [CrossRef] [PubMed]
- Sinko, P. Martin’s Physical Pharmacy and Pharmaceutical Sciences. Physical Chemical and Biopharmaceutical Principles in the Pharmaceutical Sciences; Lippincott Williams & Wilkins: Baltimore, MD, USA, 2011; p. 74. [Google Scholar]
- Herman, D.; Jenssen, K.; Burnett, R.; Soragni, E.; Perlman, S.L.; Gottesfeld, J.M. Histone Deacetylase Inhibitors Reverse Gene Silencing in Friedreich’s Ataxia. Nat. Chem. Biol. 2006, 2, 551–558. [Google Scholar] [CrossRef]
- Hill, J.W. Studies on polymerization and ring formation. Vi. Adipic anhydride. J. Am. Chem. Soc. 1930, 52, 4110–4114. [Google Scholar] [CrossRef]
- Stowell, J.C.; Huot, R.I.; Van Voast, L. The Synthesis of N-Hydroxy-N′-Phenyloctanediamide and Its Inhibitory Effect on Proliferation of AXC Rat Prostate Cancer Cells. J. Med. Chem. 1995, 38, 1411–1413. [Google Scholar] [CrossRef]
- Letton, J.C.; Miller, L.E. Process for the Preparation of Mono-Condensation Derivatives of Adipic Acid. U.S. Patent 5286879A, 15 February 1994. [Google Scholar]
- Wolfe, S.; Godfrey, J.C.; Holdrege, C.T.; Perron, Y.G. Rearrangement of Penicillins to Anhydropenicillins. Can. J. Chem. 1968, 46, 2549–2559. [Google Scholar] [CrossRef]
- Khairul, W.M.; Daud, A.I.; Mohd Hanifaah, N.A.; Arshad, S.; Razak, I.A.; Zuki, H.M.; Erben, M.F. Structural Study of a Novel Acetylide-Thiourea Derivative and Its Evaluation as a Detector of Benzene. J. Mol. Struct. 2017, 1139, 353–361. [Google Scholar] [CrossRef]
- Klayman, D.L.; Shine, R.J.; Bower, J.D. The Reaction of S-Methiodide Derivatives of Activated Thioureas with Hydroxylic Compounds. A Novel Synthesis of Mercaptans. J. Org. Chem. 1972, 37, 1532–1537. [Google Scholar] [CrossRef]
- Furniss, B.S.; Hannaford, A.J.; Smith, P.W.G.; Tatchell, A.R. Vogel’s Textbook of Practical Organic Chemistry, Fifth ed.; Longman Scientific & Technical: Harlow, UK, 1989; pp. 416–417. [Google Scholar]
- Smith, J.F.; Li, C.; Roth, M.; Hepler, L.G. Solubility of Ammonia in Chloroform: Analysis in Terms of Henry’s Law and the Equilibrium Constant for Hydrogen-Bonded Complex Formation. Can. J. Chem. 1989, 67, 2213–2217. [Google Scholar] [CrossRef]
- Dixon, E. The Constitution of “Thiocyanates” Containing an Electronegativc Group. J. Chem. Soc. Trans. 1908, 93, 684–700. [Google Scholar] [CrossRef]
- Wu, J.; Shi, Q.; Chen, Z.; He, M.; Jin, L.; Hu, D. Synthesis and Bioactivity of Pyrazole Acyl Thiourea Derivatives. Molecules 2012, 17, 5139–5150. [Google Scholar] [CrossRef] [PubMed] [Green Version]
- Zhong, Z.; Xing, R.; Liu, S.; Wang, L.; Cai, S.; Li, P. Synthesis of Acyl Thiourea Derivatives of Chitosan and Their Antimicrobial Activities in Vitro. Carbohydr. Res. 2008, 343, 566–570. [Google Scholar] [CrossRef]
- Bai, L.; Li, K.; Li, S.; Wang, J.-X. Phase Transfer Catalytic Synthesis of Phenylacetyl Arylthioureas Under Microwave Irradiation Conditions. Synth. Commun. 2002, 32, 1001–1007. [Google Scholar] [CrossRef]
- Gorobets, N.Y.; Yermolayev, S.A.; Gurley, T.; Gurinov, A.A.; Tolstoy, P.M.; Shenderovich, I.G.; Leadbeater, N.E. Difference between 1H NMR Signals of Primary Amide Protons as a Simple Spectral Index of the Amide Intramolecular Hydrogen Bond Strength. J. Phys. Org. Chem. 2012, 25, 287–295. [Google Scholar] [CrossRef]
- Chayah, M.; Camacho, M.E.; Carrión, M.D.; Gallo, M.A. 1H and 13C NMR Spectral Assignment of N,N′-Disubstituted Thiourea and Urea Derivatives Active against Nitric Oxide Synthase. Magn. Reson. Chem. 2016, 54, 793–799. [Google Scholar] [CrossRef]
- Firdausiah, S.; Hasbullah, S.A.; Yamin, B.M. Synthesis, Structurale Elucidation and Antioxidant Study of Ortho- Substituted N, N ’ -Bis ( Benzamidothiocarbonyl) Hydrazine Derivatives. J. Phys. Conf. Ser. 2018, 979, 012010. [Google Scholar] [CrossRef]
- De Ruijter, A.J.M.; van Gennip, A.H.; Caron, H.N.; Kemp, S.; van Kuilenburg, A.B.P. Histone Deacetylases (HDACs): Characterization of the Classical HDAC Family. Biochem. J. 2003, 370, 737–749. [Google Scholar] [CrossRef]
- Zhou, H.; Wang, C.; Ye, J.; Chen, H.; Tao, R. Design, Virtual Screening, Molecular Docking and Molecular Dynamics Studies of Novel Urushiol Derivatives as Potential HDAC2 Selective Inhibitors. Gene 2017, 637, 63–71. [Google Scholar] [CrossRef]
- Eckschlager, T.; Plch, J.; Stiborova, M.; Hrabeta, J. Histone Deacetylase Inhibitors as Anticancer Drugs. Int. J. Mol. Sci. 2017, 18, 1414. [Google Scholar] [CrossRef] [PubMed]
- Watson, P.J.; Millard, C.J.; Riley, A.M.; Robertson, N.S.; Wright, L.C.; Godage, H.Y.; Cowley, S.M.; Jamieson, A.G.; Potter, B.V.L.; Schwabe, J.W.R. Insights into the Activation Mechanism of Class I HDAC Complexes by Inositol Phosphates. Nat. Commun. 2016, 7, 11262. [Google Scholar] [CrossRef] [PubMed]
- Watson, P.J.; Fairall, L.; Santos, G.M.; Schwabe, J.W.R. Structure of HDAC3 Bound to Co-Repressor and Inositol Tetraphosphate. Nature 2012, 481, 335–340. [Google Scholar] [CrossRef] [PubMed]
- Luckhurst, C.A.; Breccia, P.; Stott, A.J.; Aziz, O.; Birch, H.L.; Bürli, R.W.; Hughes, S.J.; Jarvis, R.E.; Lamers, M.; Leonard, P.M.; et al. Potent, Selective, and CNS-Penetrant Tetrasubstituted Cyclopropane Class IIa Histone Deacetylase (HDAC) Inhibitors. ACS Med. Chem. Lett. 2016, 7, 34–39. [Google Scholar] [CrossRef]
- Lobera, M.; Madauss, K.P.; Pohlhaus, D.T.; Wright, Q.G.; Trocha, M.; Schmidt, D.R.; Baloglu, E.; Trump, R.P.; Head, M.S.; Hofmann, G.A.; et al. Selective Class IIa Histone Deacetylase Inhibition via a Nonchelating Zinc-Binding Group. Nat. Chem. Biol. 2013, 9, 319–325. [Google Scholar] [CrossRef]
- Decroos, C.; Bowman, C.M.; Moser, J.A.S.; Christianson, K.E.; Deardorff, M.A.; Christianson, D.W. Compromised Structure and Function of HDAC8 Mutants Identified in Cornelia de Lange Syndrome Spectrum Disorders. ACS Chem. Biol. 2014, 9, 2157–2164. [Google Scholar] [CrossRef]
- Hai, Y.; Shinsky, S.A.; Porter, N.J.; Christianson, D.W. Histone Deacetylase 10 Structure and Molecular Function as a Polyamine Deacetylase. Nat. Commun. 2017, 8, 15368. [Google Scholar] [CrossRef]
- Jones, P.; Bottomley, M.J.; Carfí, A.; Cecchetti, O.; Ferrigno, F.; Lo Surdo, P.; Ontoria, J.M.; Rowley, M.; Scarpelli, R.; Schultz-Fademrecht, C.; et al. 2-Trifluoroacetylthiophenes, a Novel Series of Potent and Selective Class II Histone Deacetylase Inhibitors. Bioorg. Med. Chem. Lett. 2008, 18, 3456–3461. [Google Scholar] [CrossRef]
- Abdel-Atty, M.M.; Farag, N.A.; Kassab, S.E.; Serya, R.A.T.; Abouzid, K.A.M. Design, Synthesis, 3D Pharmacophore, QSAR, and Docking Studies of Carboxylic Acid Derivatives as Histone Deacetylase Inhibitors and Cytotoxic Agents. Bioorg. Chem. 2014, 57, 65–82. [Google Scholar] [CrossRef]


| Isoform/PDB Code | Ligand | Pose Rank | Energy of Binding (Kcal/mol) | Ki | H-Bonds | Distance from Zn+2 (Å) | |||
|---|---|---|---|---|---|---|---|---|---|
| no. | Involved Ligand Atoms | Involved Residue | Length (Å) | ||||||
| HDAC2/4LXZ, chain A | SAHA | 1st | −7.1 | 6.2 × 10⁻⁶ | 1 | 1H | Tyr297 | 2.029 | 2O:5.117 |
| 5O:2.198 | |||||||||
| 4 | 1st | −7.3 | 4.42 × 10⁻⁶ | 4 | 1H | His135 | 2.3 | 2N:2.028 | |
| 3H | Asp170(OD1) | 2.326 | S:3.890 | ||||||
| 3H | Asp170(OD2) | 2.165 | 6O:4.278 | ||||||
| 4H | Asp258 | 2.705 | |||||||
| 5 | 1st | −7.1 | 6.2 × 10⁻⁶ | 1 | 1H | Asp170 | 2.483 | 2N:2.012 | |
| S:3.889 | |||||||||
| 6O:4.247 | |||||||||
| HDAC7/3ZNR, chain A | SAHA | 6th | −6.9 | 8.69 × 10⁻⁶ | 2 | 5O | His137 | 2.311 | 2O:5.314 |
| 5O | His136 | 2.180 | 5O:2.224 | ||||||
| 4 | 3rd | −7.2 | 5.37 × 10⁻⁶ | 4 | 1H | Asp174(OD2) | 2.343 | 2N:1.445 | |
| 1H | Asp174(OD1) | 2.204 | S:3.781 | ||||||
| 1H | Asp268 | 2.308 | 6O:4.819 | ||||||
| 6O | His176 | 2.152 | |||||||
| 5 | 2nd | −7.2 | 5.37 × 10⁻⁶ | 3 | 6O | Gly309 | 1.986 | 2N:2.555 | |
| 1H | His176 | 2.353 | S:3.693 | ||||||
| 6O:4.267 | |||||||||
| S | His136 | 3.176 | |||||||
© 2019 by the authors. Licensee MDPI, Basel, Switzerland. This article is an open access article distributed under the terms and conditions of the Creative Commons Attribution (CC BY) license (http://creativecommons.org/licenses/by/4.0/).
Share and Cite
Al-Amily, D.H.; Hassan Mohammed, M. Design, Synthesis, and Docking Study of Acyl Thiourea Derivatives as Possible Histone Deacetylase Inhibitors with a Novel Zinc Binding Group. Sci. Pharm. 2019, 87, 28. https://0-doi-org.brum.beds.ac.uk/10.3390/scipharm87040028
Al-Amily DH, Hassan Mohammed M. Design, Synthesis, and Docking Study of Acyl Thiourea Derivatives as Possible Histone Deacetylase Inhibitors with a Novel Zinc Binding Group. Scientia Pharmaceutica. 2019; 87(4):28. https://0-doi-org.brum.beds.ac.uk/10.3390/scipharm87040028
Chicago/Turabian StyleAl-Amily, Duraid H., and Mohammed Hassan Mohammed. 2019. "Design, Synthesis, and Docking Study of Acyl Thiourea Derivatives as Possible Histone Deacetylase Inhibitors with a Novel Zinc Binding Group" Scientia Pharmaceutica 87, no. 4: 28. https://0-doi-org.brum.beds.ac.uk/10.3390/scipharm87040028