
Application of Gas Chromatography Mass Spectrometry in Tar Analysis from Underground Gasification


School of Safety Engineering, China University of Mining and Technology, Xuzhou 221116, China
*
Author to whom correspondence should be addressed.
Separations 2023, 10(1), 12; https://0-doi-org.brum.beds.ac.uk/10.3390/separations10010012
Submission received: 13 November 2022
/
Revised: 10 December 2022
/
Accepted: 23 December 2022
/
Published: 26 December 2022
(This article belongs to the Special Issue Advances in Separation Engineering)
Abstract
:The study of tar behaviors in underground coal gasification (UCG) is essential for pollution control, system safety and conversion efficiency; however, existing studies have only focused on tar in products without revealing tar evolution in the reaction zone, and the experimental conditions in reported work are far from those in the real situation. In this work, tar behaviors were studied with a self-developed apparatus to simulate the UCG process. During the experiments, the sampling method along the gasification channel was used to collect tar at different positions; the gasification object was a large raw coal block 460 mm × 230 mm × 230 mm in size, and the flow rate of the inlet gas was adjusted according to the composition of products. The tar samples were not only taken from the outlet, but also from the reaction zone, and then analyzed using gas chromatography mass spectrometry. For all the tar samples, C15H13N and its isomer were the most abundant compounds, with a total percentage greater than 14%. Most of the top five chemicals contained more than nine carbon atoms in their molecular formulae, indicating that more heavy tar than light tar is formed by low-temperature pyrolysis. Compared with the upstream tar, the downstream tar had fewer PAHs and a lower boiling point, due to the decomposition of the heavy tar. The downstream tar contained more of the element fluorine (F) than upstream and outlet tars, indicating that tar pollution remaining in the reaction zone cannot be evaluated by monitoring the outlet tar.
1. Introduction
Underground coal gasification (UCG) is a chemical mining technology which converts a coal seam into combustible gas products based on pyrolysis, combustion and gasification [1]. This technology is effective in protecting mineworkers from disasters [2] and controlling coal-derived pollution emissions on the ground [3]. However, byproducts from underground reactions, such as tar, play as an important role in the pollution of nearby water and soil, which limits the industrial application of UCG [4]. In UCG field tests, it was found that the tar migrates with underground water through the pores of rocks, resulting in a pollution problem for as long as five years after project shutdown [5]. Furthermore, the condensation of tar in the geo reactor poses a risk of gas-pipe blockage, which may lead to explosion disasters [6]. Moreover, tar yield is not beneficial for the generation of a gas product with a high heating value [7]. Therefore, study into the tar behaviors in UCG is essential for pollution control, system safety and conversion efficiency.
Xu et al. [8] studied the physical properties of coal pyrolysis in UCG and found that tar yield decreases when the temperature increases. Niu et al. [9] used a high-pressure reactor to study pressured pyrolysis in the context of UCG, using a coal core with a diameter of 90 mm sampled from Inner Mongolia, China. It was reported that when the pressure increased, the tar yield from pyrolysis decreased. Wang et al. [10] studied the effect of coal scale and atmosphere on the bituminous coal pyrolysis process in UCG, with the tar being collected after condensing the gas product from pyrolysis. It was found that the tar yield was higher when pyrolysis occurred in a CO2 environment compared with when it was conducted under N2 conditions. When coal size was increased, the pyrene, naphthalene and benzene concentrations in tar decreased, but the indene increased. Grabowski et al. [11] monitored ground and surface water during a UCG field test in the Wieczorek Mine and analyzed the environmental risk of tar in the products. It was found that the number of pollutants in the tar samples were close to the limit values, representing a potential risk. Particularly, liquid tar is formed when it cools below 40 ℃, causing a serious threat to the operation of a UCG-product system. Ding et al. [12] studied the acoustic emission characteristics of coal and its relationship with tar yields in a high-temperature oxygen-rich environment. When the temperature increased from 100 to 400 °C, the crack width on the coal surface of samples gradually increased due to heating failure; however, when the temperature increased to 500 °C, the crack width narrowed since the condensed tar sealed the pores. Aloisi et al. [13] used Gas Chromatography-Mass Spectrometry to characterize organic sulfur compounds in coal tar, and 60 sulfur compounds belonging to 14 different classes were detected. Zheng et al. [14] used the ReaxFF MD method to calculate coal pyrolysis processes and found that light and heavy tars were continuously produced. With the increase in temperature, heavy tar decomposed to produce light tar and then the light tar interacted with the heavy tar. Mallett et al. [5] monitored the water quality of a UCG field test in Queensland, Australia, and reported that the flow direction of the groundwater exerted an important influence on the migration of UCG pollutants, such as benzene.
The existing studies offer insight into the effect of temperature, pressure, atmosphere and other factors on tar yields in UCG. Tar components and migration were studied in detail in both lab experiments and field tests. However, there are still several limitations in the reported work. Firstly, these studies only focused on tar behaviors in the products, while tar behaviors in the reaction zone were barely investigated; this limits a deep understanding of the tar evolution mechanism in UCG. Secondly, in terms of lab-scale experiments, the conditions are far different to those in a field test, which means the measured tar characteristics are not instructive for tar removal in a real application. For example, in a field test, the inlet condition is adjusted according to the gas composition at the outlet, while in lab experiments the inlet conditions are determined by preset flow rates and compositions. In addition, as far as gas permeability is concerned, the permeability of a coal block formed by compressing pulverized coal is 4.19, while the permeability of a raw coal block of the same size is 0.74 [15], and the coal deformation energy difference between them is more than twice as great [16,17]. This large difference means that lab-scale experiments cannot reflect the reality of a field test.
Therefore, in this work the tar behaviors are studied with a self-developed apparatus to simulate the UCG process. The tar sample was not only taken from the outlet, but also from the reaction zone with the help of a sampling system. During the experiments, the flow rate of the inlet gas was adjusted according to the volume fraction of combustible content in the products, which is similar to actual UCG operations. The tar contents were analyzed using gas chromatography mass spectrometry in order to reveal the tar evolution mechanism in the UGC reaction zone. This work is significant in that it elucidates tar removal in real UCG applications and, thereby, the control of potential pollution of soil and groundwater.
2. Materials and Methods
The experimental system, including gas supply pipe, reactor and coal block, to simulate the UCG process is shown in Figure 1. The gasification agent used in the experiment was air, and its flow rate was adjusted during the reaction according to the gas products. The coal block size was 460 mm × 230 mm × 230 mm and the sample used was bituminous coal from Shaanxi, China, with a volatile content of 22%. There was an initial gasification channel, 10 mm × 10 mm in size, inside the coal block. The measurement units consisted of a temperature recorder and a gas analyzer. A thermocouple was placed inside the gasification channel at five different positions with a fixed interval, as shown in Figure 1 (red points 1–5). Point 4 was also the initial ignition point. A nitrogen dilution pipe was used before the gas analyzer to ensure the concentration of any measured gas would be within the measuring range of the analyzer. Compared with similar studies, we used a large original coal block cut into a specific shape, rather than numerous small coal particles built up into a simulated “coal block”. Therefore, the pore structure of the coal in this work is closer to the actual structure of an underground coal seam, representing a reasonable heat and mass transfer behavior, which is a key advantage of our experimental system compared with others.
Tar was sampled through the sampling pipe and collector from three different positions, shown as points A, B and C in Figure 1, representing upstream, downstream and outlet during the UCG process, respectively. The processing and analysis of the tar sample is shown in Figure 2. CH2Cl2 was used as a solvent for the tar, and a magnetic stirrer was applied to separate any substances which were not soluble in the CH2Cl2. After this step, the solvent was subjected to evaporation to obtain the tar for further analysis.
Trace 1300 ISQ 7000 GC-MS was used to analyze the composition of the tar. The chromatography column was SH-Rxi-5Sil MS, produced by Restek, USA, using high-purity helium as the carrier, with a flow rate of 1.0 mL/min. The injection volume was 1 μL at a temperature of 220 ℃. The scanning range of the mass spectrum was 1~1050 amu. The initial temperature was 80 ℃: this was raised to 230 ℃ at a rate of 15 ℃/min, then maintained for 1 min and increased to 300 ℃ at a rate of 10 ℃/min, and finally maintained for 8 min. Electron bombardment ionization was used with an ionization voltage of 70 eV and an ion-source temperature of 230 ℃. The compound was first qualitatively analyzed using the software msFine Analysis iQ.
In an actual GC-MS experiment, calibration curves are required for quantitative analysis and are usually used in the internal standard method [18] and the external standard method [19]. In addition to these two methods, there is also an area percentage method, which does not need to establish calibration curves. For example, Dong et al. [20] used the area percentage method to quantitatively analyze the temporal and spatial evolution characteristics of tar. Considering the convenience of tar quantitative analysis, the area percentage method was applied in this paper: the content of each chemical substance was calculated by normalizing the peak areas corresponding to various chemical substances. Existing studies only focused on the tar yield and composition at the outlet; however, in this work, the tar samples from different positions in the reaction zone were compared in order to the reveal the tar evolution during UCG.
3. Results
3.1. Gas Products and Temperature History
The question arises of how best to design a proper flow rate for injected gas. In this work, the flow rate was adjusted according to the measured composition of gas products. As shown in Figure 3, the initial flow rate of air was 5 L/min. As the reaction progressed, the oxygen concentration gradually decreased, while CO and CO2 increased. When the increase in CO was slower, the inlet flow rate increased to 10 L/min to promote the oxidization reaction and, after that, it increased further, several times, up to 40 L/min. The maximum CO and CO2 appeared at 3.7 h and 6.2 h, respectively, indicating that a proper air flow rate is important to ensure conversion efficiency. When the air flow rate is too small, the oxygen supply is insufficient to generate a considerable volume of both CO and CO2. When the air flow rate increases, oxygen is enhanced, and thus the CO and CO2 increase. When the flow rate is far greater, the oxygen is sufficient, and thus the CO decreases while the CO2 increases. When flow rate continues increasing, convective heat transfer is enhanced and cools down the reaction zone; consequently, both the CO and CO2 decrease. CH4 is mainly produced from pyrolysis and H2 is produced from the reaction of char and steam. Since the temperature is not very high, and injected gas does not include steam, the CH4 and H2 are limited throughout the entire process.
The measured temperature at different positions is shown in Figure 4. Line 4 in the figure legend represents the ignition temperature. It corresponds to the thermocouple located at point 4 denoted in Figure 1, and thus its temperature is highest at the beginning. The maximum temperature at point 4 was about 450 ℃ at 5 h and the average temperature during the whole process was 296 ℃. The temperatures at points 1 and 2 were always lower than 20 ℃, indicating that the upstream coal barely reacts. The temperature at point 3 shows an obvious fluctuation, representing the competition of combustion expansion and the gas-flow plug effect. The temperature at point 5 increased slowly and reached 120 ℃ at 5.5 h, then decreased to room temperature. In summary, the reaction occurred mainly near points 3, 4 and 5. Since the temperature at point 3 is higher than that at point 5, the reaction zone is more likely to expand in the opposite direction to the inlet flow.
3.2. Tar Behaviors
The total ion chromatogram of three tar samples is shown in Figure 5. A total of 115 types of chemicals were detected in sample A, while there were 129 types of chemicals in samples B and C.
For each sample, the top five chemicals with the largest percentages are shown in Table 1. C15H13N and its isomer are the most abundant compounds across all the tar samples, with a total percentage higher than 14%. The top five chemicals usually contain more than nine carbon atoms in their molecular formulae, except the C3H7NO in tar sample B, indicating that more heavy tar is formed than light tar, which is caused by pyrolysis in a relatively low temperature range. During the pyrolysis stage, the original coal macromolecular structure (C126H115O38N4S6) was decomposed into the heaviest tar, such as C26H16O3 and C20H10O4S, and a few light tars, such as C6H4O2NS and C8H5O4S [21], which well explains the result that more heavy tar was formed than light tar by pyrolysis.
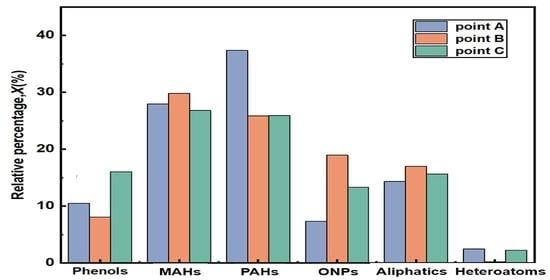
In order to further compare the tar behaviors at different positions, compound type is shown in Figure 6. The top three compounds in tar sample A are polycyclic aromatic hydrocarbons (PAHs), monocyclic aromatic hydrocarbons (MAHs), and aliphatics; tar sample A PAH has a percentage of 37.39%. The top three compounds in tar sample B are PAHs, MAHs, and aliphatics, and the percentage of PAHs in tar sample B is 37.39%. Compared with sample A, sample B has obviously fewer PAHs and more oxygenated non-phenols (ONPs), while there is little difference among the other compounds. Compared with sample B, sample C contains more phenols and fewer ONPs. In other words, the upstream contains more PAHs than the downstream and outlet, and this is due to the decomposition of heavy tar with temperature increase in the reaction zone. Murakami et al. [22] found that it is easier for the molecular weight in the gasification stage to form low molecules than during pyrolysis, and the main components of tar in these two stages were PAH compounds, again interpreting the result that the downstream tar contains fewer PAH compounds and lower boiling points compared with upstream tar.
Further, the compounds in the three tar samples were classified according to their number of aromatic rings, as shown in Figure 7. Point B contains more nonaromatic hydrocarbons than point A and point C, and no four-ring aromatic hydrocarbons were detected. Point A contains the most two-ring aromatic hydrocarbons, and point C contains the most four-ring aromatic hydrocarbons. It should be noticed that the increase in aromatic ring number means the tar is more harmful. The results show that the tar samples in different positions possess different physical and chemical properties under the same conditions, and the tar in the gas products cannot represent the complete tar evolution behaviors. At the same time, the gasification expansion of the coal block was limited, featuring a non-uniform temperature distribution, leading to more heavy tar in low-temperature pyrolysis, and corresponding to lower conversion efficiency and more pollution.
The compounds in the three tar samples were further analyzed according to boiling point range; the results are shown in Figure 8. On the whole, the boiling points of the tar samples at different locations show little difference. For tar sample A, more content is produced with a high boiling point than with a low boiling point, indicating a higher heavy-tar yield than a light-tar yield. Compared with tar sample A, sample B yielded more content with a boiling point lower than 200 ℃ and less content with a boiling point higher than 200 ℃, caused by tar decomposition at a high temperature in the reaction zone. Compared with tar sample B, sample C produced more content with a boiling point in the range of 100~200 ℃ and higher than 300 ℃, but less content with a boiling point lower than 100 ℃ and in the range of 200~300 ℃.
The elements in the different tar samples were also compared, as shown in Figure 9. The main elements in tar are C, H, O and N. In this paper, element analysis was based on the known chemical structure and content of each substance obtained by GC-MS, and normalized statistical analysis was performed. For tar sample A, the element with the highest proportion was H, with a percentage of more than 50%. Compared with sample A, sample B contained less C but more H and N, indicating an increase in saturated hydrocarbon from upstream to downstream. Compared with sample B, sample C contained more O and less N, but C and H barely changed. It should be noted that tar sample B contained the most F, which could be an important pollution source. In other words, monitoring the tar content only at the outlet or in the products might lead to underestimating tar pollution remaining in the reaction zone, which could migrate though rock pores and groundwater. Winchell et al. [23] believe that fluorine-containing substances can be fully oxidized in the pyrolysis and gasification stages and converted into HF gas or macromolecular substances containing the element F, further explaining the result that the downstream tar contains more element F than upstream and outlet tar.
In our future work, a larger coal block and a longer gasification channel will be used as the gasification target. The spatial distribution of tar may thus be more obvious, which will further validate the conclusions drawn in this work. Moreover, different types of injected gas will be used, such as pure oxygen and an oxygen/steam mixture, which is common in UCG field tests. Meanwhile, the use of oxygen could increase the reaction temperature, which might be a positive outcome since the decomposition of heavy into light tar would be strengthened.
4. Conclusions
In this work, tar behaviors were studied using a self-developed apparatus to simulate the UCG process. During the experiments, the flow rate of the inlet gas was adjusted according to the volume fraction of the combustible content in the products. The tar samples were taken not only from the outlet, but also from the reaction zone, and these were analyzed using gas chromatography mass spectrometry. The main conclusions are as follows.
For all tar samples from different positions, C15H13N and its isomer were the most abundant compounds, with a total percentage higher than 14%. Most of the top five chemicals usually contained more than 9 carbon atoms in their molecular formulae, indicating more heavy tar than light tar is formed by pyrolysis in a relatively low temperature range.
Compared with the upstream tar, the downstream tar had fewer PAH compounds and lower boiling points, due to the decomposition of heavy tar with temperature increase in the reaction zone.
The downstream tar contained more of the element F than did upstream and outlet tar, indicating that tar pollution remaining in the reaction zone cannot be evaluated by only monitoring the outlet tar in gas products.
Author Contributions
Conceptualization, L.F.; Methodology, L.F.; Investigation, J.L.; Writing—original draft preparation, J.L.; Writing—review and editing, L.F.; Supervision, J.P. and H.X.; Funding acquisition, L.F. All authors have read and agreed to the published version of the manuscript.
Funding
This research was funded by The National Natural Science Foundation of China, grant numbers 52106189 and 52174220; this research was also funded by the Fundamental Research Funds for the Central Universities, grant number 2021QN1086; finally, this research was funded by the SC doctoral project of Jiangsu Province, grant number 2021-31196.
Institutional Review Board Statement
Not applicable.
Informed Consent Statement
Not applicable.
Data Availability Statement
The data presented in this study are available on request from the corresponding author. The data are not publicly available due to privacy.
Acknowledgments
The supervision of Biao Wang on tar reaction mechanisms is appreciated.
Conflicts of Interest
The authors declare no conflict of interest.
References
- An, N.; Zagorscak, R.; Thomas, H.R.; Gao, W. A numerical investigation into the environmental impact of underground coal gasification technology based on a coupled thermal-hydro-chemical model. J. Clean. Prod. 2021, 290, 125181. [Google Scholar] [CrossRef]
- Li, Z.; Wang, L.; Ren, B.; Ding, K. The Layout of the Combustion Cavity and the Fracture Evolution of the Overlying Rock during the Process of Underground Coal Gasification. Geofluids 2022, 2022, 9264959. [Google Scholar] [CrossRef]
- Mandapati, R.N.; Ghodke, P.K. Kinetic modeling of Indian lignites pyrolysis in the context of underground coal gasification (UCG). Fuel 2021, 283, 118939. [Google Scholar] [CrossRef]
- Xie, J.; Xin, L.; Hu, X.M.; Cheng, W.M.; Liu, W.T.; Wang, Z.G. Technical application of safety and cleaner production technology by underground coal gasification in China. J. Clean. Prod. 2020, 250, 119487. [Google Scholar] [CrossRef]
- Mallett, C.W. Environmental controls for underground coal gasification. J. Power Energy 2018, 232, 47–55. [Google Scholar] [CrossRef]
- Perkins, G. Underground coal gasification—Part I: Field demonstrations and process performance. Prog. Energy Combust. Sci. 2018, 67, 158–187. [Google Scholar] [CrossRef]
- Li, J.; Yao, X.; Xu, K.; Ge, J.; Yang, D.; Fan, B. Numerical investigation of a process model integrating gasification and tar removal. Biomass Convers. Biorefinery 2021, 1–15. [Google Scholar] [CrossRef]
- Xu, M.; Xin, L.; Liu, W.; Hu, X.; Cheng, W.; Li, C.; Wang, Z. Study on the physical properties of coal pyrolysis in underground coal gasification channel. Powder Technol. 2020, 376, 573–592. [Google Scholar] [CrossRef]
- Niu, M.; Wang, R.; Ma, W.; Guo, W.; Liu, H.; Liu, S. Methane formation mechanism during pressurized pyrolysis of coal core in the context of deep underground coal gasification. Fuel 2022, 324, 124668. [Google Scholar] [CrossRef]
- Wang, Z.; Liang, D.; Li, Y.; Tian, H.; Liang, J. Influence of scale and atmosphere on the pyrolysis properties of large-scale bituminous coal. J. Anal. Appl. Pyrolysis 2021, 158, 105060. [Google Scholar] [CrossRef]
- Grabowski, J.; Korczak, K.; Tokarz, A. Aquatic risk assessment based on the results of research on minewaters as a part of a pilot underground coal gasification process. Process Saf. Environ. Prot. 2021, 148, 548–558. [Google Scholar] [CrossRef]
- Ding, R.; Sun, Q.; Xue, S.; Shi, Q.; Ge, Z.; Li, D. Experimental study on acoustic emission characteristics of high-temperature thermal damage in an oxygen-rich environment of long flame coal. J. Therm. Anal. Calorim. 2022, 147, 11391–11400. [Google Scholar] [CrossRef]
- Aloisi, I.; Zoccali, M.; Tranchida, P.; Mondello, L. Analysis of Organic Sulphur Compounds in Coal Tar by Using Comprehensive Two-Dimensional Gas Chromatography-High Resolution Time-of-Flight Mass Spectrometry. Separations 2020, 7, 26. [Google Scholar] [CrossRef]
- Zheng, M.; Li, X.; Liu, J.; Wang, Z.; Gong, X.; Guo, L.; Song, W. Pyrolysis of Liulin coal simulated by GPU-Based ReaxFF MD with cheminformatics analysis. Energy Fuels 2014, 28, 522–534. [Google Scholar] [CrossRef]
- Zhang, K.; Sang, S.; Ma, M.; Zhou, X.; Liu, C.; Shen, G. Permeability response characteristics of primary undeformed coal and tectonically deformed coal under loading−unloading conditions in Huainan coalfield, China. ACS Omega 2022, 7, 37485–37498. [Google Scholar] [CrossRef]
- Wang, C.; Cheng, Y. Role of coal deformation energy in coal and gas outburst: A review. Fuel 2023, 332, 126019. [Google Scholar] [CrossRef]
- Ding, Z.; Feng, X.; Wang, E.; Wei, Q.; Zhao, X.; Hu, Q. Acoustic emission response and evolution of precracked coal in the meta-instability stage under graded loading. Eng. Geol. 2023, 312, 106930. [Google Scholar] [CrossRef]
- Haefelfinger, P. Limits of the internal standard technique in chromatography. J. Chromatogr. A 1981, 218, 73–81. [Google Scholar] [CrossRef]
- Prando, D.; Ail, S.; Chiaramonti, D.; Baratieri, M.; Dasappa, S. Characterisation of the producer gas from an open top gasifier: Assessment of different tar analysis approaches. Fuel 2016, 181, 566–572. [Google Scholar] [CrossRef]
- Dong, M.; Feng, L.; Zhou, Q.; Zhou, S.; Xu, X.; Qin, B. Spatial and temporal evolution of tar during ex-situ underground coal gasification. Fuel 2022, 317, 123423. [Google Scholar] [CrossRef]
- Xin, H.; Zhou, B.; Tian, W.; Qi, X.; Zheng, M.; Lu, W.; Yang, H.; Zhong, X.; Wang, D. Pyrolytic stage evolution mechanism of Zhundong coal based on reaction consistency analysis of mono/multi molecular models. Fuel 2023, 333, 126371. [Google Scholar] [CrossRef]
- Murakami, T.; Yasuda, H.; Norisada, K. Comparison of tar components in syngas generated by gasification conditions of Lignite in a fluidized bed gasifier. Energy Fuels 2018, 32, 1110–1144. [Google Scholar] [CrossRef]
- Winchell, L.; Ross, J.; Brose, D.; Pluth, T.; Fonoll, X.; Norton, J.W., Jr.; Bell, K.Y. Pyrolysis and gasification at water resource recovery facilities: Status of the industry. Water Environ. Res. 2022, 94, e10701. [Google Scholar] [CrossRef] [PubMed]
Figure 1.
Schematic of the experimental system.

Figure 2.
Processing and analysis of tar sample.

Figure 3.
History of gas composition at outlet.

Figure 4.
History of measured temperature at different positions.

Figure 5.
The total ion chromatogram of three tar samples.

Figure 6.
The compound types of different tar samples.

Figure 7.
The number of aromatic rings in tar compounds.

Figure 8.
The boiling point range of compounds in tar.

Figure 9.
The element percentage of compounds in tar.


Table 1.
Top five chemicals in different tar samples.
| Tar Sample | Top 5 Chemicals | Molecular Formula | Percentage (%) | Structural Formula |
|---|---|---|---|---|
| A | (1) | C15H13N | 15.19 |  |
| (2) | C10H8 | 5.87 |  | |
| (3) | C12H15NO4 | 3.14 |  | |
| (4) | C11H10 | 2.38 |  | |
| (5) | C10H6ClNO2 | 2.07 |  | |
| B | (1) | C15H13N | 12.8 |  |
| (2) | C15H13N | 3.35 |  | |
| (3) | C3H7NO | 3.25 |  | |
| (4) | C9H13N | 2.93 |  | |
| (5) | C10H8 | 2.4 |  | |
| C | (1) | C15H13N | 8.48 |  |
| (2) | C15H13N | 5.59 |  | |
| (3) | C12H16O | 4.48 |  | |
| (4) | C12H17NO2 | 3.54 |  | |
| (5) | C9H11N3O3 | 2.36 |  |
Disclaimer/Publisher’s Note: The statements, opinions and data contained in all publications are solely those of the individual author(s) and contributor(s) and not of MDPI and/or the editor(s). MDPI and/or the editor(s) disclaim responsibility for any injury to people or property resulting from any ideas, methods, instructions or products referred to in the content. |
© 2022 by the authors. Licensee MDPI, Basel, Switzerland. This article is an open access article distributed under the terms and conditions of the Creative Commons Attribution (CC BY) license (https://creativecommons.org/licenses/by/4.0/).
Share and Cite
MDPI and ACS Style
Feng, L.; Liu, J.; Xin, H.; Pang, J. Application of Gas Chromatography Mass Spectrometry in Tar Analysis from Underground Gasification. Separations 2023, 10, 12. https://0-doi-org.brum.beds.ac.uk/10.3390/separations10010012
AMA Style
Feng L, Liu J, Xin H, Pang J. Application of Gas Chromatography Mass Spectrometry in Tar Analysis from Underground Gasification. Separations. 2023; 10(1):12. https://0-doi-org.brum.beds.ac.uk/10.3390/separations10010012
Chicago/Turabian StyleFeng, Lele, Jie Liu, Haihui Xin, and Jiabao Pang. 2023. "Application of Gas Chromatography Mass Spectrometry in Tar Analysis from Underground Gasification" Separations 10, no. 1: 12. https://0-doi-org.brum.beds.ac.uk/10.3390/separations10010012
Note that from the first issue of 2016, this journal uses article numbers instead of page numbers. See further details here.