
Influence of the Filtration Velocity on the Local Oil Distribution of Oleophilic Coalescence Filter Media

Karlsruhe Institute of Technology, Institute of Mechanical Process Engineering and Mechanics, Straße am Forum 8, 76131 Karlsruhe, Germany
*
Author to whom correspondence should be addressed.
Separations 2023, 10(4), 254; https://0-doi-org.brum.beds.ac.uk/10.3390/separations10040254
Submission received: 27 February 2023
/
Revised: 12 April 2023
/
Accepted: 13 April 2023
/
Published: 14 April 2023
Abstract
:Fibrous nonwoven coalescence filters are commonly utilized in gas-cleaning processes to separate liquid droplets from a gas stream, e.g., oil mists. These filters are mainly composed of micro glass fibers and in some cases, small amounts of synthetic fibers. The shape of the deposited oil on filter fibers of the filter media depends on several factors, including the oil saturation, wettability, roughness, diameter of the fibers and fiber arrangement. The oil deposits can take the form of, e.g., axially symmetric barrel-shaped droplets or larger structures, such as oil sails between adjacent fibers. Understanding the initial state of the coalescence filtration process and the impact of the deposited oil structures on the separation efficiency requires characterizing these structures. X-ray microtomography (µ-CT) and artificial intelligence tools for segmentation can be utilized to visualize, identify and analyze deposited oil structures in the micrometer region. To quantify and compare oil structures formed at three distinct filtration velocities (10, 25 and 40 cm s) commonly utilized in industrial applications and one defined oil saturation of oleophilic coalescence filter media, applying X-ray microtomography is the main emphasis of this work. The results indicate that there is no significant influence of the filtration velocity on the local saturation (determined via µ-CT), the number- and volume-based fractions of the identified deposited oil structures on or between adjacent fibers as well as the droplet concentrations and distributions of deposited oil droplets. It is assumed that the structure of the deposited oil formed by coalescence in the filter medium is dominated by the wetting properties of the fibers (surface tension and surface energy) and the saturation, independent of the filtration velocity.
1. Introduction
Airborne submicron oil droplets (oil mists) often occur as undesired contaminants in industrial applications and have to be removed to prevent air pollution and grant health protection at workplaces [1,2]. In real-world applications these oil droplets are separated by coalescence filter media consisting of multiple layers of a nonwoven, porous material made of micro glass fibers and sometimes small amounts of synthetic fibers [3,4]. In the past, several publications have investigated mechanisms describing droplet deposition and liquid transport in filters at the meso scale, as well as the evolution of pressure drop over time [1,3,5,6,7,8,9,10,11,12,13,14,15]. Kampa et al. [6], for example, developed a semi-empirical model describing the evolution of the pressure drop with increasing oil load of the filter material. In accordance with this model, the overall pressure drop of a coalescence filter medium is attributed to several transport mechanisms. These transport mechanisms are the oil load of the first filter layer, which is attributed to an increase of the differential pressure at the beginning of the filtration and a linear increase of the differential pressure due to the formation of oil channels, where the accumulated oil in the filter is pumped to the filter downstream side, and a steep rise of the differential pressure caused by the formation of an oil film, either on the filter upstream (oleophobic filter media) or filter downstream side (oleophilic filter media). When the oil finally drains on the filter downstream side and the mass of arriving oil on the filter upstream side equals the drainage rate, a quasi-steady state is reached. In addition, a creep of the differential pressure in this quasi-steady state can be observed, probably due to the formation of additional oil channels or a rearrangement of the oil distribution in the filter matrix [16].
However, there are several inconsistencies in the literature concerning the impact of deposited liquid structures on the filtration efficiency. In previous studies, some authors have reported an increase of the separation efficiency as the saturation increases due to deposited liquid structures [5,17,18]. Other studies [19,20,21] suggest the opposite, where the overall filtration efficiency decreases due to fiber sections that are unavailable for droplet collection because of the presence of liquid structures on fiber surfaces or between fiber intersections.
To better understand the impact of deposited microscale oil structures on mist filtration, particularly their formation under different filtration velocities and their influence on filtration efficiency, it is crucial to assess their characteristics. This involves investigating the shape, size and orientation of coalesced larger droplets, such as axially symmetric barrel-shaped droplets surrounding fibers, as well as the formation of bigger oil structures, such as oil sails between adjacent fibers. Additionally, it is important to determine how these structures form, depending on the oil saturation of the filter medium or the filtration velocity [22,23]. Oil structures on the filter’s upstream side are of particular relevance since most arriving airborne oil droplets deposit at the filter’s front face [6,10,19,24]. Therefore, a thin, porous model filter, smaller than commercially available filter layers, is necessary to investigate these deposited oil objects. The filter material should be thick enough to investigate actual deposited oil structures. Furthermore, the filter should be thin enough to prevent the formation of a nearly closed oil film that could potentially destroy different deposited oil structures. Moreover, the filter material needs to be thin enough to fit within the field of view (FOV) of the measurement system to enable the analysis of deposited oil structures in the micrometer region.
To investigate the influence of the filtration velocity on oil deposits, the exact shapes and sizes of these structures have to be examined. A potential tool for the analyzation of the deposited oil morphology is micro-computed tomography (µ-CT). In contrast to two-dimensional measurement techniques, e.g., light microscopy or SEM imaging, X-ray microtomography offers both qualitative and quantitative insights into the 3D morphology of a sample. Furthermore, high-resolution data up to approximately 1 µm can be assessed without damaging the specimen. The liquid distribution in a coalescence filter [25,26] or the local oil distribution of different saturations [24] have already been investigated, but the impact of different filtration velocities on deposited oil structures has not been assessed so far.
In this publication, deposited oil objects on thin, porous coalescence filter material formed at three different filtration velocities (10, 25 and 40 cm s), which were chosen application-orientated [9,27,28], and one saturation level ( 6.2%) are presented. Using a routine to distinguish between segmentation artifacts, deposited oil droplets, smaller oil objects and oil sails, the different µ-CT samples are compared in regard to deposited oil fractions as well as concentrations and distributions of deposited oil droplets. The presented results indicate that the filtration velocity has no significant influence on the deposited oil structures at comparable saturation levels.
2. Material and Methods
2.1. Thin Porous Filter Media
In general, the first fiber layers of the first filter layer are especially important for droplet collection, since the majority of the arriving airborne oil droplets are deposited in this area [6,10,19,24]. In order to examine deposited oil objects comparable to oil structures built up on industrially applied oil mist filters (down to sizes of 2–3 µm), the utilized filter material needs to meet several prerequisites. On the one hand, the filter media must be sufficiently thick to investigate separated oil structures, comparable to oil structures on collection-relevant fibers of industrial applied coalescence filter media. On the other hand, the filter material should be thin enough to prevent the formation of a nearly closed oil film that could potentially damage the formed oil structures on or between the filter fibers. Furthermore, the thickness of the filter material is limited due to the FOV of high-resolution µ-CT scans (approx. 0.4 mm × 0.4 mm × 0.4 mm). For a good alignment in the µ-CT scan, the thickness of the filter should not exceed half of the FOV in one dimension, so oil objects on protruding fibers either on the filter upstream or downstream side can be examined without difficulties.
Therefore, oleophilic filter material with a thickness of roughly 160 µm, a porosity of 95.88% and a basis weight of 15 g m, consisting of 80 wt.% micro glass fibers (with fiber diameters of 1.48, 2.44 and 5.00 µm) and 20 wt.% polyethylene terephthalate (PET) fibers (fiber diameter 13.6 µm) was utilized in this work. The model filters were self-produced using a sheet former (Haage Rapid Koethen with disintegrator AG04, pruefbau Dr.-Ing. H.Duerner GmbH, Peissenberg, Germany). The generated filter medium showed sufficient surface area for examining deposited oil structures that are linked to liquid structures found at the front face of the first layer in multi-layer filter media utilized in industrial applications. Additionally, it is thin enough to prevent the formation of a nearly closed oil film or oil channels, as described by Straube et al. [24]. In order to ensure the mechanical stability of the self-produced filter material, a wide-meshed polypropylene support grid with a mesh size of 7 mm × 7 mm and a web width of approximately 0.25 mm was employed. A picture of the utilized filter material is given in Figure 1.
2.2. Experimental Set-Up
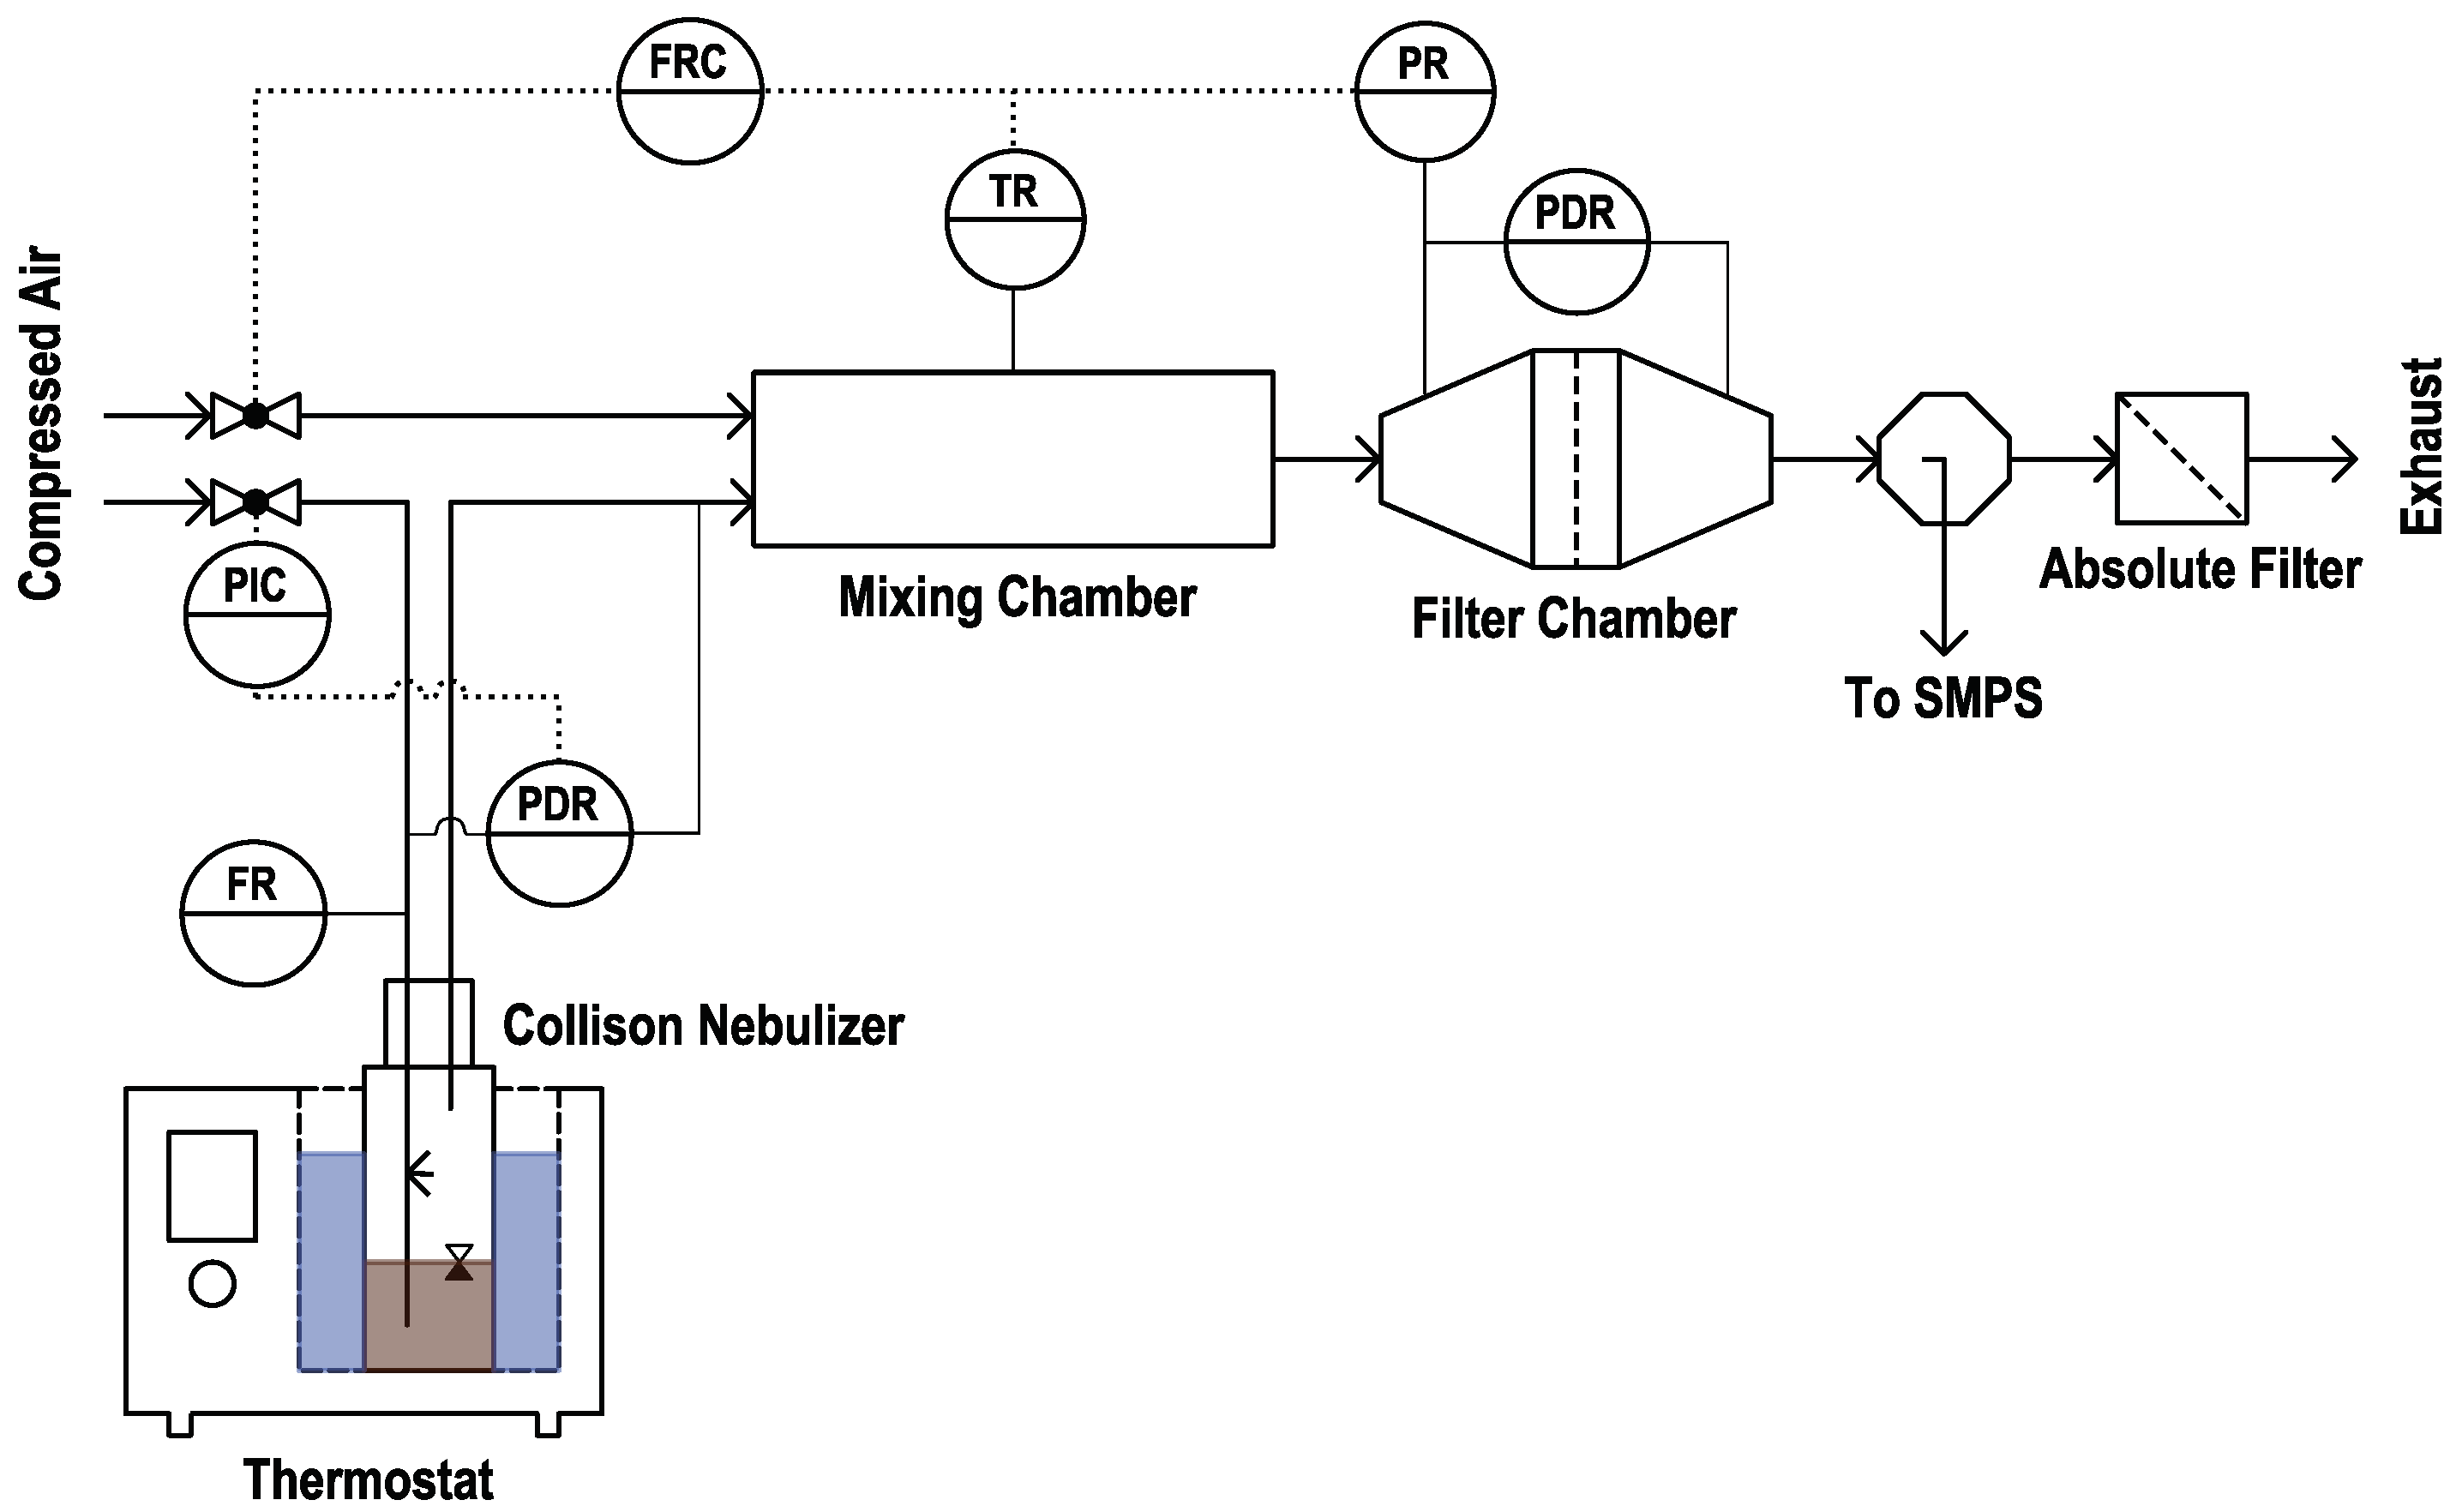
A thin porous filter media with the fiber mixture and physical properties as described in Section 2.1 was loaded with oil mist according to the experimental set-up shown schematically in Figure 2.
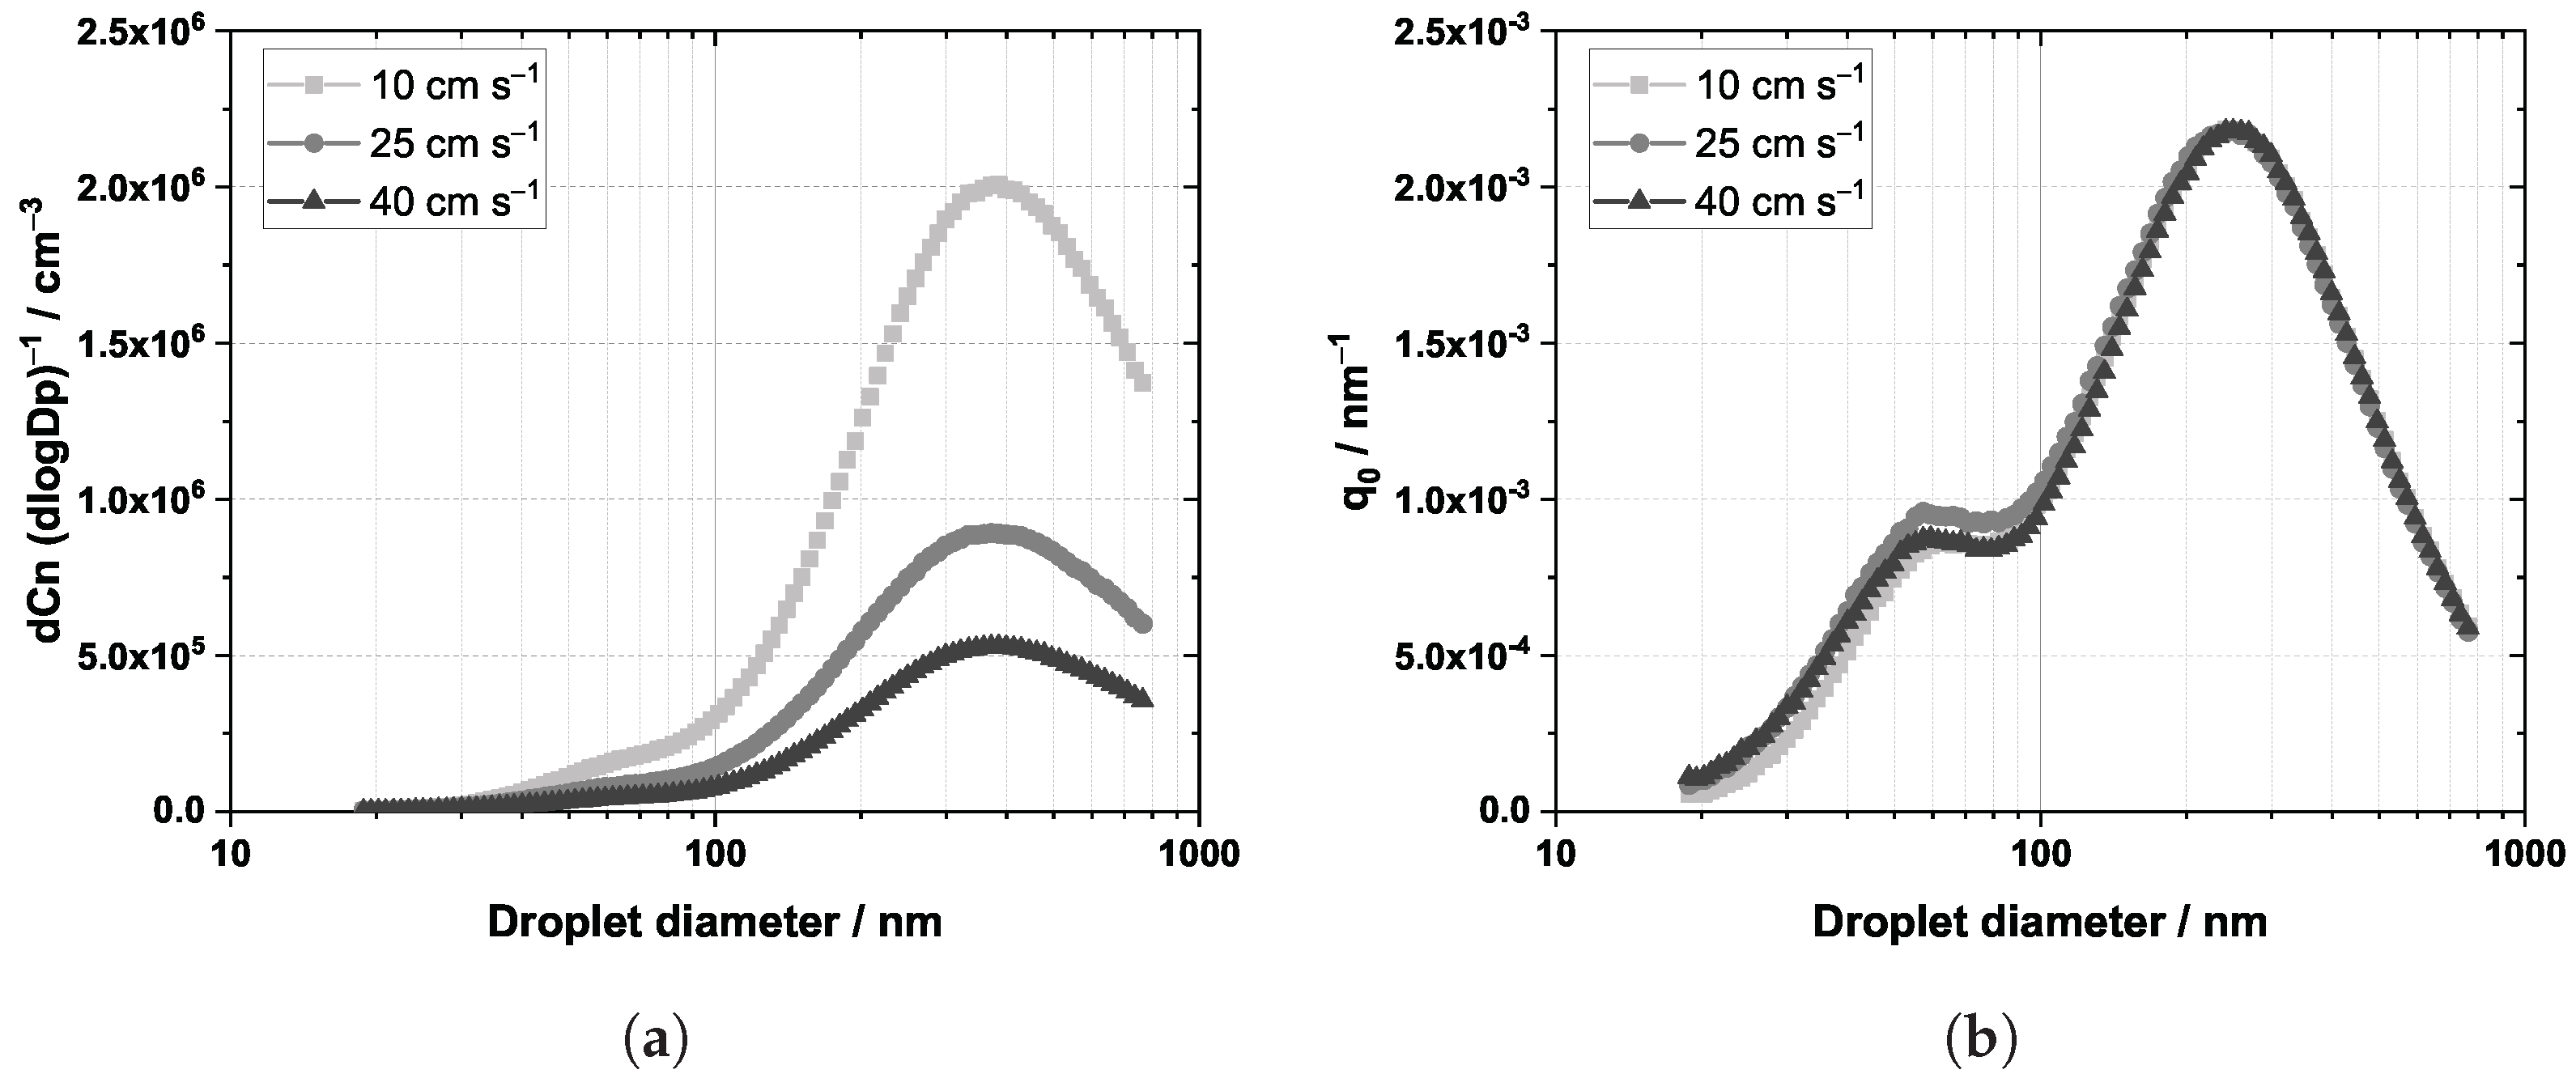
All experiments were carried out at ambient temperature (19–25 C) and pressure (approx. 1 bar). Oil mist was generated by a Collison nebulizer, which was placed in a thermostat at 22 C to ensure a constant oil temperature. Afterwards, the mist was mixed with dry compressed air in the mixing chamber to enable application-orientated filtration velocities of 10, 25 and 40 cm s and finally led to the filter chamber. The surface area of the vertically installed filter material was 32.16 cm. The oil utilized in the experiment was a standard compressor oil with a surface tension of 0.03 N m, a density of 0.87 g cm and a dynamic viscosity of 0.13 Pa s. For a constant oil-feeding rate of approx. 3.4 g m min and a droplet size distribution (approx. log-normal distributed with a number-based mean of approx. 300 nm and a geometric standard deviation of 1.84), the differential pressure across the Collison nebulizer was kept constant at 0.5 bar. The raw gas droplet distribution was measured before each experiment utilizing a Scanning Mobility Particle Sizer (Kr neutralizer, Differential Mobility Analyzer model Hauke Vienna Long and a Condensation Particle Counter model TSI 3775) behind the filter chamber. Therefore, no filter material was installed in the filter chamber. Constant raw gas concentrations and distributions are a key factor for the comparison of different deposited oil structures for one constant saturation. The number concentration and the differential number distribution of the raw gas are given exemplarily in Figure 3.
With increasing filtration velocity a decrease of the number concentration is observed due to increasing dilution with dry compressed air in the mixing chamber of the oil aerosol generated by the Collison nebulizer. Nevertheless, the oil-feeding rate remains constant and the differential number distributions are very similar for all investigated filtration velocities. This information is of crucial importance when comparing oil structures deposited on the filter for different filtration velocities.
In order to compare different filtration velocities of one defined oil loading stage, an equal saturation level for every investigated filter specimen must be ensured. The reference oil loading time was chosen to be 3 min at a filtration velocity of 25 cm s. Pretest showed that the filtration time had to be adjusted for filtration velocities of 10 cm s and 40 cm s, to guarantee a constant global saturation (determined gravimetrically) for every filter specimen. Therefore, the filtration time was reduced for a filtration velocity of 40 cm s and increased for 10 cm s, which can be attributed to an increase of inertial separation of airborne oil droplets > 300 nm with increasing filtration velocity [18]. Regarding a filtration velocity of 10 cm s, the filter material was loaded for approx. 3.6 min and for a filtration velocity of 40 cm s for approx. 2.6 min to ensure a comparable global saturation of roughly 0.062 for all investigated filtration velocities.
Due to the reduced thickness of the utilized filter material, the differential pressure across the filter was observed to be in the range of the lower resolution limit of the differential pressure sensor (roughly 1.5 mbar). Nevertheless, a small increase of the differential pressure with increasing filtration velocity was observed (approx. 0.2 mbar from 10 cm s to 25 cm s and another 0.2 mbar from 25 cm s to 40 cm s).
2.3. µ-CT Scanning
The µ-CT scans presented in this study were conducted utilizing a ZEISS Xradia 520 Versa (Carl Zeiss Microscopy GmbH, Oberkochen, Germany). A detailed description of the Versa system and the specimen preparation can be found in a previous work by Straube et al. [29]. After the oil loading of the filter material, a small specimen (approx. 6 mm × 6 mm) was cut out roughly in the center of the filter and transferred to the µ-CT system. The experiments were carried out at a tube voltage of 50 kV and a source power of 4 W. For the highest possible resolution, the 40× objective was chosen. Before a high-resolution scan was performed, a warm-up scan in order to heat up the specimen was taken (to avoid a thermal expansion of the specimen during the main scan). Figure 4 illustrates schematically the specimens and samples investigated in this work.
In total, seven µ-CT scans were investigated in this work. Samples 1 and 2 were taken from the same specimen (Specimen 1), but at two different non-overlapping positions, roughly in the middle of the specimen. The same applies to Samples 5, 6 and 7. These three scans were taken from one specimen (Specimen 4). Samples 3 and 4 were taken from two individually loaded filters. From each filter one specimen (Specimen 2 and 3) was transferred to the µ-CT and one sample (scan) was taken.
Table 1 gives an overview of the samples investigated in this work. In addition, the values of the local porosity and local saturation are presented (see Section 3.1).
Samples 1 and 2 were taken at a binning of 2, leading to a doubled pixel size (merging of pixels [30]) in comparison to the other investigated scans in this work. Doubling the pixel size reduces the scan time by a factor of 4, but lowers the resolution limit as well. Nevertheless, results for local porosity and local saturation (see Section 3.1), as well as oil droplet concentrations and distributions (see Section 3.3), are expected to be comparable to the Samples 3–7 (binning 1), as oil structures 3 µm (hard to identify with a binning of 2) only contribute a small part to the overall oil mass on a certain sample.
2.4. Segmentation of the µ-CT Scan
Segmentation of the reconstructed images obtained by the µ-CT is a crucial step for further data processing and analysis, as it allows the differentiation of individual material phases such as air, micro glass fiber, PET fiber and oil. However, if the data cannot be segmented reasonably due to similar densities or atomic numbers, there is no possibility to distinguish between the different material phases. Since oil and PET showed similar grayscale values after the reconstruction of the µ-CT scan, an artificial intelligence tool of the software Dragonfly, Versions 2021.3 and 2022.2 for Windows (Object Research Systems (ORS) Inc., Montreal, QC, Canada) was utilized. With this software, the segmentation of the acquired µ-CT data was successful. For more detailed information on the segmentation and visualization process, we refer to Straube et al. [29]. In Figure 5 are exemplary pictures given for the three different investigated filtration velocities.
The pictures in Figure 5 were taken from the same perspective in the direction of the air flow. Samples 1, 3 and 6 were exemplarily chosen to visually compare the different filtration velocities with respect to the occurrence of different formed oil structures on the filter material. On the pictures no significant differences concerning the size and shape of different deposited oil structures are visible. For example, blocked areas due to oil sails in the direction of the air flow appear to be similar for filtration velocities of 10, 25 and 40 cm s. However, these deposited oil structures, including singular oil droplets, small oil structures and oil sails are investigated in detail in Section 3.2 and Section 3.3.
3. Results and Discussion
3.1. Local Porosity and Saturation
In this section the local porosity and local saturation determined by the µ-CT are compared with the global porosity (determined with the basis weight , density of the fibers and thickness of the filter medium ) as well as the global saturation (determined gravimetrically). The determination of the local porosity and local saturation is described in detail in Straube et al. [29]. The local porosities and saturations of all investigated filter samples are given in Table 1. The local porosity was determined according to Straube et al. [29] by calculating the void space (without oil) of every investigated sample (Equation (1)).
Therefore, the voxels of micro glass and PET fibers () were divided by all voxels in a reference volume (). This reference volume was subjectively chosen, aiming to enclose the major part of the fibers in the more densely packed area of the scanned filter (see [24,29]). The global porosity was calculated according to Equation (2).
With a basis weight of the filter media of 15 g m, a thickness of 160 µm and a fiber density of 2.28 g cm, a global porosity of 95.88% can be calculated. Figure 6a presents a comparison between local and global porosity.
Only small deviations in the local porosity are visible. The mean local porosity of all investigated samples was calculated to be 96.64% and, thus, is in good accordance with the global porosity (95.88%). Similar porosity values are an indicator of comparable filter material of each experiment. Thus, deviations of the deposited oil structures due to filter inhomogeneities can be excluded. In the next step, the local and global saturations are compared. Therefore, all oil voxels (including oil objects on protruding fibers of each filter sample) were divided by the voxels of air of the reference filter volume (Equation (3), see [24,29]). With the information about the deposited mass of oil on the filter , the density of the oil and the filter surface area , the global saturation can be calculated according to Equation (4).
With an average deposited oil mass of approximately 27 mg on the thin filter media, a global saturation is calculated. In Figure 6b the local and global saturations are compared. The local saturations show no clear dependence on the filtration velocity. The local saturations fluctuate, independent of the filtration velocity (and voxel size), between 2.5% and 5.8%. On average, a saturation of 4.1%, and thus significantly less (−34%) than the global saturation (6.2%), is observed. This finding is in accordance with Straube et al. [24,29]. Lower local saturations in comparison to global saturations can be attributed to the resolution limit of the µ-CT system. Oil structures, e.g., thin oil films on filter fibers smaller than 2 µm [31] cannot be resolved and analyzed with the µ-CT. This can be seen in Figure 5. No noteworthy small oil structures, such as oil films on fibers, are visible. Thus, the local saturation is lower compared to the global saturation for the investigated samples in this work.
3.2. Identification of Deposited Oil Structures
In order to compare different deposited oil structures on fibers or at fiber intersections concerning their size, shape and frequency (number- and mass-based), a routine was developed by Straube et al. [24] to distinguish between segmentation artifacts, small oil structures, oil droplets and oil sails. According to this routine, all identified oil objects < 200 voxels were identified to be segmentation artifacts and not actually deposited oil on fibers. The majority of those artifacts were found on 2D slices of reconstructed µ-CT scans, not even close to filter fibers. Oil objects with a volume of ≥ 200 voxels and a minimum Feret diameter < 2.7 µm were classified as deposited small oil structures. Oil objects with a minimum Feret diameter ≥ 2.7 µm were identified to be deposited singular oil droplets or oil sails, dependent on their sphericity. With a sphericity > 80% for oil objects with a minimum Feret diameter between 2.7 and 4.4 µm and a sphericity > 73% for oil objects with a minimum Feret diameter bigger than 4.4 µm, the oil droplets were distinguished from oil sails. Oil sails with a minimum Feret diameter between 2.7 and 4.4 µm appeared sometimes more spherical than oil sails with a minimum Feret diameter > 4.4 µm, which is why the sphericity criterion had to be adjusted to distinguish oil droplets from oil sails in this size range. The presented criteria were selected based on manual verification of the formed oil structures of different samples and saturation levels to keep the number of false classified oil objects as small as possible (max. 15% number-based for each class) [24].
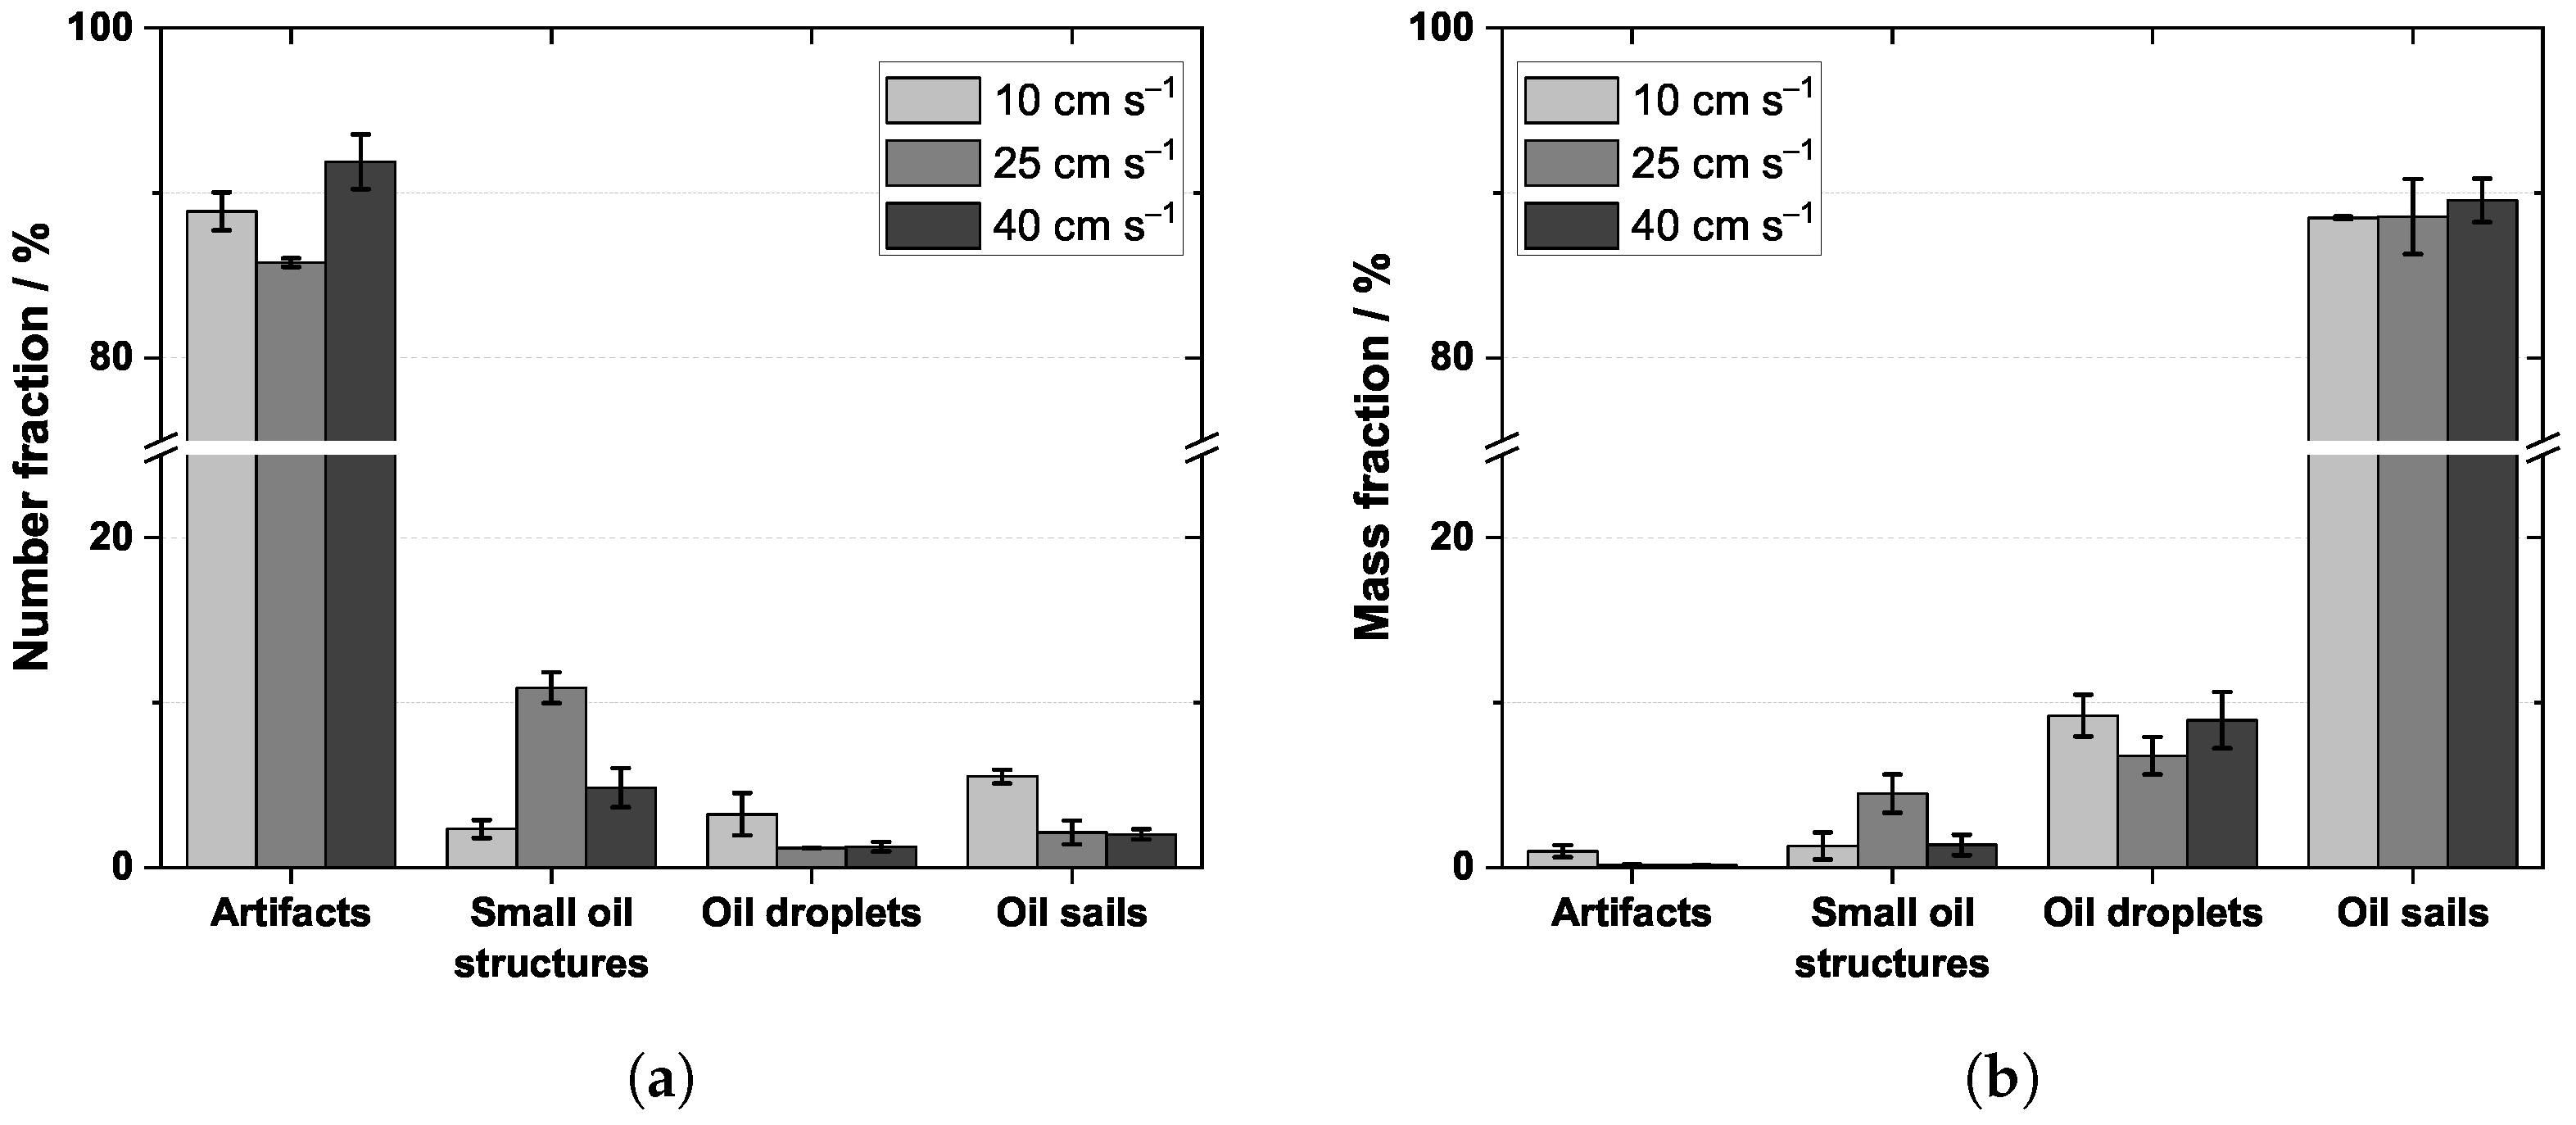
Figure 7a depicts the number fraction of each class for filtration velocities of 10, 25 and 40 cm s.
Independent of the filtration velocity, over 80% of the total number of the identified oil objects were found to be segmentation artifacts, followed by small oil structures and a roughly identical amount of deposited singular oil droplets and oil sails (error bars in Figure 7a,b indicate the standard deviation). For a filtration velocity of 10 cm s slightly more oil sails are observed in comparison to filtration velocities of 25 cm s and 40 cm s. Figure 7b presents the mass fraction of the different deposited oil structures. As can be seen, most of the oil mass is stored in oil sails between adjacent fibers, followed by singular oil droplets on fibers and small oil structures on or between neighboring fibers. However, the number of artifacts fluctuates significantly between each sample (from 4000 to 20,000, meaning > 8% number-based). Nevertheless, their mass compared to small oil structures, oil droplets and especially oil sails is negligible. Furthermore, no influence of the filtration velocity on the mass of the different deposited oil structures is observed. The highest mass fraction of artifacts was found for a filtration velocity of 10 cm s (Samples 1 and 2). A possible reason for this observation could be the limited resolution of the scan due to a doubled voxel size in comparison to the other investigated scans. However, the results for the samples with a binning of 2 are in good agreement with Samples 3–7 (filtration velocities 25 and 40 cm s). The authors assume that the shape and size of the deposited oil structures is dominated by the saturation as well as the wetting properties, meaning surface tension and surface energy, and not by the filtration velocities applied in this work [32]. Note that deposited liquid structures can of course be moved or deformed when separated on a collector, but at significantly higher local velocities compared to the application-orientated filtration velocities evaluated in this work (≫1 m s) [31,33].
3.3. Oil Droplet Concentrations and Distributions
Deposited singular oil droplets are of particular relevance due to their ability to move with increasing local flow velocity into the slipstream of the fibers [33] or are supposed to be the initial starting point for the formation of oil sails and oil channels. In total, 100 to 300 droplets were identified for the investigated samples with the routine described in Section 3.2. To investigate a potential influence of the filtration velocity on deposited droplets, the droplet concentrations as well as size and mass distributions are compared in this section.
First, the droplet number concentration is evaluated depending on the investigated filtration velocities. To compare the concentrations of deposited droplets of different scans and different scan sizes, the droplets of each sample must be related to a reference volume. This reference volume was chosen to be the filter volume of each sample (see [24]). Figure 8a depicts the number concentration of all investigated samples of this work.
Sample 5 shows a slightly higher number concentration of deposited droplets in comparison to the other samples. In general, no influence of the filtration velocity on the number concentrations of the investigated samples was found. Especially large droplets may cause an influence on the separation efficiency. Therefore, the mass concentration of the deposited oil droplets is investigated in Figure 8b. Similar to the observations regarding the number concentration, no significant influence of the filtration velocity on the mass concentration of the deposited oil droplets is observed. The mass concentrations of Samples 2, 3, 4, 6 and 7 are rather found to be in good accordance. In the next step, droplet distributions were investigated, both, in terms of number (Q distribution, Figure 9a) and mass (q distribution, Figure 9b) concentration for each size class.
Figure 9a depicts that the cumulative number distribution is independent of the flow velocity at an equivalent saturation level. The small fluctuations of the presented Q distribution can be mainly attributed to the number of identified droplets per sample. For a higher statistical accuracy, a larger number of droplets per scan would be favorable, which is due to the necessarily limited FOV (high resolution to identify droplets at sizes up to 3 µm) not possible. Figure 9b presents the differential mass distribution q. However, no significant differences of the q distributions at different filtration velocities at comparable saturations were observed. Figure 9b depicts that most of the oil mass of the oil droplets is found at a droplet diameter of roughly 9–10 µm, independent of the filtration velocity. Note that the pixel size for a filtration velocity of 10 cm s was doubled in comparison to the other samples of this work (see Table 1). Thus, the resolution of small droplets (<3 µm) caused difficulties, and some small droplets were not able to be resolved with the segmentation software. Nevertheless, the differential mass distribution for a filtration velocity of 10 cm s (red curve) is in good agreement with the distributions of the filtration velocities of 25 cm s (green curve) and 40 cm s (blue curve). Some size bins contain only a few droplets, which can be observed especially at the falling edge of the distributions. The q distribution for a filtration velocity of 40 cm s shows a peak at approximately 27 µm caused by two identified droplets in this size bin (in Sample 5). The results indicate that the mass distributions are sensitive to single droplets in individual size bins for a small number of total droplets. This can be seen from increasing error bars (number-based) of the falling edge of the distribution. Nevertheless, the presented findings of this work indicate that the local oil distribution is independent of the filtration velocity in the range of 10–40 cm s for a comparable saturation level. According to the literature, significantly higher filtration velocities would be needed to move oil droplets in the sizes found in this study [33]. Again, it is assumed that the structure of the deposited oil formed by coalescence in the filter medium is expected to be dominated by the wetting properties (surface tension and energy [32]) and the saturation, not by the filtration velocities applied in this study.
4. Conclusions
Thin porous filter media loaded with oil mist at three different filtration velocities (10, 25 and 40 cm s) and one saturation level ( 6.2%) were analyzed utilizing a µ-CT system to investigate the deposited oil structures. In the first step, the local (determined via µ-CT) and global porosity (determined gravimetrically), as well as the local (determined via µ-CT) and global saturation (determined gravimetrically) were determined. Local and global porosity showed a good agreement, which is an indicator of comparable filter material. However, local and global saturation differed significantly. These differences in the local and global saturation can be attributed to the limited resolution of the µ-CT. Small oil structures such as oil films on fibers or fiber intersections (<2 µm) cannot be resolved with the µ-CT system, due to its limited resolution. Subsequently, the number- and mass-based percentages of all identified oil structures were examined, showing a high number of segmentation artifacts (>85%). However, these artifacts showed a small oil mass compared to smaller oil structures on fibers, oil droplets or oil sails between adjacent fibers. Most of the separated oil volume was present in the form of oil sails (approx. 90%), independent of the filtration velocity. Regarding the droplet number and mass concentrations as well as the cumulative number and differential mass distributions of the deposited oil droplets, no significant differences regarding different filtration velocities were found. It is assumed that the structure of the deposited oil formed by coalescence in the filter medium is expected to be dominated by the wetting properties of the fibers (surface tension and surface energy) and saturation. As both the wetting properties of the fibers (wettable fibers and comparable filter material) and the saturation ( 6.2%) were kept constant in this work, the structure of the deposited oil is assumed to be independent of the filtration velocity (for application-orientated filtration velocities up to 40 cm s).
The presented results are important in understanding the initial stage of the coalescence filtration process. It is shown that a variation of the filtration velocity, as occurring in real-world applications, has no significant influence on the deposited oil structures. However, for more information on the influence of the filtration velocity on the local oil distribution, more experimental data including different oil saturation levels and wettabilities of the fibers (oleophobic) should be evaluated in future works, as the presented results take only one saturation level and oleophilic fibers into account. In particular, oleophobic filter material is expected to have a significant influence on deposited oil objects in the micrometer region [22].
Author Contributions
C.S.: Conceptualization, Data curation, Formal analysis, Investigation, Methodology, Resources, Validation, Visualization, Writing—original draft, Writing—review and editing. J.M.: Conceptualization, Formal analysis, Methodology, Project administration, Resources, Supervision, Writing—review and editing. A.D.: Conceptualization, Funding acquisition, Project administration, Resources, Supervision, Writing—review and editing. All authors have read and agreed to the published version of the manuscript.
Funding
This research received no external funding.
Data Availability Statement
Data will be made available on request.
Acknowledgments
We acknowledge support by the KIT-Publication Fund of the Karlsruhe Institute of Technology. We acknowledge that parts of this study were presented at FILTECH 2023 in Cologne.
Conflicts of Interest
The authors declare no conflict of interest.
Abbreviations
The following abbreviations are used in this manuscript:
| FOV | Field of view |
| µ-CT | X-ray microtomography |
| PET | Polyethylene terephthalate |
References
- Mead-Hunter, R.; King, A.J.; Mullins, B.J. Aerosol-mist coalescing filters—A review. Sep. Purif. Technol. 2014, 133, 484–506. [Google Scholar] [CrossRef]
- Kazerouni, N.; Thomas, T.L.; Petralia, S.A.; Hayes, R.B. Mortality among workers exposed to cutting oil mist: Update of previous reports. Am. J. Ind. Med. 2000, 38, 410–416. [Google Scholar] [CrossRef] [PubMed]
- Penner, T.; Meyer, J.; Kasper, G.; Dittler, A. Impact of operating conditions on the evolution of droplet penetration in oil mist filters. Sep. Purif. Technol. 2019, 211, 697–703. [Google Scholar] [CrossRef]
- Straube, C.; Yang, G.; Voll, D.; Meyer, J.; Théato, P.; Dittler, A. Influence of 3D printed downstream support structures on pressure drop and entrainment of oleophilic and oleophobic oil mist filters. Sep. Purif. Technol. 2022, 290, 120802. [Google Scholar] [CrossRef]
- Agranovski, I.E.; Braddock, R.D.; Crozier, S.; Whittaker, A.; Minty, S.; Myojo, T. Study of wet porous filtration. Sep. Purif. Technol. 2003, 30, 129–137. [Google Scholar] [CrossRef]
- Kampa, D.; Wurster, S.; Buzengeiger, J.; Meyer, J.; Kasper, G. Pressure drop and liquid transport through coalescence filter media used for oil mist filtration. Int. J. Multiph. Flow 2014, 58, 313–324. [Google Scholar] [CrossRef]
- Kampa, D.; Wurster, S.; Meyer, J.; Kasper, G. Validation of a new phenomenological “jump-and-channel” model for the wet pressure drop of oil mist filters. Chem. Eng. Sci. 2015, 122, 150–160. [Google Scholar] [CrossRef]
- Frising, T.; Thomas, D.; Bémer, D.; Contal, P. Clogging of fibrous filters by liquid aerosol particles: Experimental and phenomenological modelling study. Chem. Eng. Sci. 2005, 60, 2751–2762. [Google Scholar] [CrossRef]
- Charvet, A.; Gonthier, Y.; Gonze, E.; Bernis, A. Experimental and modelled efficiencies during the filtration of a liquid aerosol with a fibrous medium. Chem. Eng. Sci. 2010, 65, 1875–1886. [Google Scholar] [CrossRef]
- Contal, P.; Simao, J.; Thomas, D.; Frising, T.; Callé, S.; Appert-Collin, J.; Bémer, D. Clogging of fibre filters by submicron droplets. Phenomena and influence of operating conditions. J. Aerosol Sci. 2004, 35, 263–278. [Google Scholar] [CrossRef]
- Kolb, H.E.; Schmitt, R.; Dittler, A.; Kasper, G. On the accuracy of capillary flow porometry for fibrous filter media. Sep. Purif. Technol. 2018, 199, 198–205. [Google Scholar] [CrossRef]
- Kolb, E.; Kasper, G. On the functioning of coalescence filters with a drainage layer—A comment on several papers by Chang et al. Sep. Purif. Technol. 2019, 225, 54–59. [Google Scholar] [CrossRef]
- Penner, T.; Meyer, J.; Dittler, A. Oleophilic and oleophobic media combinations—Influence on oil mist filter operating performance. Sep. Purif. Technol. 2021, 261, 118255. [Google Scholar] [CrossRef]
- Penner, T.; Meyer, J.; Dittler, A. Characterization of mesoscale inhomogeneity in nonwovens and its relevance in the filtration of fine mists. J. Aerosol Sci. 2021, 151, 105674. [Google Scholar] [CrossRef]
- Azarafza, A.; King, A.; Mead-Hunter, R.; Schuler, J.; Abishek, S.; Mullins, B.J. The influence of layer separation on multilayer mist coalescing filter performance. Sep. Purif. Technol. 2021, 273, 118752. [Google Scholar] [CrossRef]
- Kolb, H.E.; Kasper, G. Mist filters: How steady is their “steady state”? Chem. Eng. Sci. 2019, 204, 118–127. [Google Scholar] [CrossRef]
- Conder, J.R.; Liew, T.P. Fine mist filtration by wet filters—II: Efficiency of fibrous filters. J. Aerosol Sci. 1989, 20, 45–57. [Google Scholar] [CrossRef]
- Davies, C.N. Filtration of aerosols. J. Aerosol Sci. 1983, 14, 147–161. [Google Scholar] [CrossRef]
- Raynor, P.C.; Leith, D. The Influence of Accumulated Liquid on Fibrous Filter Performance. J. Aerosol Sci. 2000, 31, 19–34. [Google Scholar] [CrossRef]
- Gougeon, R.; Boulaud, D.; Renoux, A. 15.P.01 Theoretical and experimental study of fibrous filters loading with liquid aerosols in the inertial regime. J. Aerosol Sci. 1994, 25, 189–190. [Google Scholar] [CrossRef]
- Payet, S.; Boulaud, D.; Madelaine, G.; Renoux, A. Penetration and pressure drop of a HEPA filter during loading with submicron liquid particles. J. Aerosol Sci. 1992, 23, 723–735. [Google Scholar] [CrossRef]
- Mullins, B.J.; Braddock, R.D.; Agranovski, I.E.; Cropp, R.A.; O’Leary, R.A. Observation and modelling of clamshell droplets on vertical fibres subjected to gravitational and drag forces. J. Colloid Interface Sci. 2005, 284, 245–254. [Google Scholar] [CrossRef]
- Mullins, B.J.; Braddock, R.D.; Agranovski, I.E.; Cropp, R.A. Observation and modelling of barrel droplets on vertical fibres subjected to gravitational and drag forces. J. Colloid Interface Sci. 2006, 300, 704–712. [Google Scholar] [CrossRef] [Green Version]
- Straube, C.; Meyer, J.; Dittler, A. Investigation of the local oil distribution on oleophilic mist filters applying X-ray micro-computed tomography. Sep. Purif. Technol. 2023, 311, 123279. [Google Scholar] [CrossRef]
- Charvet, A.; Du Rolland Roscoat, S.; Peralba, M.; Bloch, J.F.; Gonthier, Y. Contribution of synchrotron X-ray holotomography to the understanding of liquid distribution in a medium during liquid aerosol filtration. Chem. Eng. Sci. 2011, 66, 624–631. [Google Scholar] [CrossRef]
- Chaudhuri, J.; Boettcher, K.; Ehrhard, P. Optical investigations into wetted commercial coalescence filter using 3D micro-computer-tomography. Chem. Eng. Sci. 2022, 248, 117096. [Google Scholar] [CrossRef]
- Agranovski, I.E.; Myojo, T.; Braddock, R.D.; Jarvis, D. Combined Wettable/Non-wettable Filter for Mist Purification. Chem. Eng. Technol. 2001, 24, 287–292. [Google Scholar] [CrossRef]
- Charvet, A.; Gonthier, Y.; Bernis, A.; Gonze, E. Filtration of liquid aerosols with a horizontal fibrous filter. Chem. Eng. Res. Des. 2008, 86, 569–576. [Google Scholar] [CrossRef]
- Straube, C.; Meyer, J.; Dittler, A. Identification of Deposited Oil Structures on Thin Porous Oil Mist Filter Media Applying µ-CT Imaging Technique. Separations 2021, 8, 193. [Google Scholar] [CrossRef]
- Latief, F.D.E.; Fauzi, U.; Irayani, Z.; Dougherty, G. The effect of X-ray micro computed tomography image resolution on flow properties of porous rocks. J. Microsc. 2017, 266, 69–88. [Google Scholar] [CrossRef]
- Mead-Hunter, R.; Mullins, B.J.; Becker, T.; Braddock, R.D. Evaluation of the force required to move a coalesced liquid droplet along a fiber. Langmuir: ACS J. Surf. Colloids 2011, 27, 227–232. [Google Scholar] [CrossRef] [PubMed]
- Patel, S.U.; Kulkarni, P.S.; Patel, S.U.; Chase, G.G. The effect of surface energy of woven drainage channels in coalescing filters. Sep. Purif. Technol. 2012, 87, 54–61. [Google Scholar] [CrossRef]
- Fang, J.; Davoudi, M.; Chase, G.G. Drop movement along a fiber axis due to pressure driven air flow in a thin slit. Sep. Purif. Technol. 2015, 140, 77–83. [Google Scholar] [CrossRef]
Figure 1.
Pictures of the utilized filter material consisting of 80 wt.% micro glass fiber and 20 wt.% PET fiber with a basis weight of 15 g m. To increase the mechanical stability, the filter material was laid on a wide meshed support structure. (a) Filter upstream side. (b) Filter downstream side.

Figure 2.
Experimental set-up for the loading of self-produced thin filter material with oil mist. The oil mist was generated by a Collison nebulizer placed in a thermostat at a constant temperature, mixed with dry compressed air and let into the filtration chamber.
Figure 2.
Experimental set-up for the loading of self-produced thin filter material with oil mist. The oil mist was generated by a Collison nebulizer placed in a thermostat at a constant temperature, mixed with dry compressed air and let into the filtration chamber.

Figure 3.
(a) Number concentration and (b) differential number distribution of the raw gas for filtration velocities of 10, 25 and 40 cm s. The differential pressure across the nebulizer was held constant at 0.5 bar.
Figure 3.
(a) Number concentration and (b) differential number distribution of the raw gas for filtration velocities of 10, 25 and 40 cm s. The differential pressure across the nebulizer was held constant at 0.5 bar.

Figure 4.
Schematic of the investigated specimens. The blue dots represent the locations of the taken samples, approximately in the center of the specimen.
Figure 4.
Schematic of the investigated specimens. The blue dots represent the locations of the taken samples, approximately in the center of the specimen.

Figure 5.
Exemplary pictures after the segmentation of (a) Sample 1 (10 cm s), (b) Sample 3 (25 cm s) and (c) Sample 6 (40 cm s). The pictures were obtained by exporting 3D views with the utilized Dragonfly software. Micro glass fibers are shown in yellow, PET fibers in green and oil in brown color. View in the direction of air flow.

Figure 6.
(a) Local and global porosity of the filter material without oil (unloaded) for Samples 1–7. (b) Local and global saturation for filtration velocities of 10, 25 and 40 cm s for Samples 1–7. The global porosity and global saturation are indicated by dashed lines.
Figure 6.
(a) Local and global porosity of the filter material without oil (unloaded) for Samples 1–7. (b) Local and global saturation for filtration velocities of 10, 25 and 40 cm s for Samples 1–7. The global porosity and global saturation are indicated by dashed lines.

Figure 7.
(a) Number and (b) mass fractions of the identified oil objects at different filtration velocities. Error bars indicate the standard deviation.
Figure 7.
(a) Number and (b) mass fractions of the identified oil objects at different filtration velocities. Error bars indicate the standard deviation.

Figure 8.
(a) Number and (b) mass concentration of the identified deposited oil droplets, formed at three different filtration velocities.
Figure 8.
(a) Number and (b) mass concentration of the identified deposited oil droplets, formed at three different filtration velocities.

Figure 9.
(a) Cumulative number distribution Q and (b) differential mass distribution q of the deposited oil droplets. Error bars indicate the standard deviation.
Figure 9.
(a) Cumulative number distribution Q and (b) differential mass distribution q of the deposited oil droplets. Error bars indicate the standard deviation.


Table 1.
Parameters and results for local porosity and local saturation of the µ-CT scans presented in this work.
Table 1.
Parameters and results for local porosity and local saturation of the µ-CT scans presented in this work.
| Sample | Binning | Flow Velocity | Pixel Size | Local Porosity | Local Saturation |
|---|---|---|---|---|---|
| [-] | [-] | [cm s] | [nm] | [%] | [%] |
| 1 | 2 | 10 | 399.2 | 95.0 | 4.0 |
| 2 | 2 | 10 | 399.2 | 97.7 | 3.0 |
| 3 | 1 | 25 | 193.5 | 97.1 | 2.5 |
| 4 | 1 | 25 | 186.7 | 96.7 | 3.7 |
| 5 | 1 | 40 | 186.6 | 96.9 | 5.8 |
| 6 | 1 | 40 | 186.6 | 96.1 | 4.3 |
| 7 | 1 | 40 | 186.6 | 97.0 | 3.6 |
Disclaimer/Publisher’s Note: The statements, opinions and data contained in all publications are solely those of the individual author(s) and contributor(s) and not of MDPI and/or the editor(s). MDPI and/or the editor(s) disclaim responsibility for any injury to people or property resulting from any ideas, methods, instructions or products referred to in the content. |
© 2023 by the authors. Licensee MDPI, Basel, Switzerland. This article is an open access article distributed under the terms and conditions of the Creative Commons Attribution (CC BY) license (https://creativecommons.org/licenses/by/4.0/).
Share and Cite
MDPI and ACS Style
Straube, C.; Meyer, J.; Dittler, A. Influence of the Filtration Velocity on the Local Oil Distribution of Oleophilic Coalescence Filter Media. Separations 2023, 10, 254. https://0-doi-org.brum.beds.ac.uk/10.3390/separations10040254
AMA Style
Straube C, Meyer J, Dittler A. Influence of the Filtration Velocity on the Local Oil Distribution of Oleophilic Coalescence Filter Media. Separations. 2023; 10(4):254. https://0-doi-org.brum.beds.ac.uk/10.3390/separations10040254
Chicago/Turabian StyleStraube, Christian, Jörg Meyer, and Achim Dittler. 2023. "Influence of the Filtration Velocity on the Local Oil Distribution of Oleophilic Coalescence Filter Media" Separations 10, no. 4: 254. https://0-doi-org.brum.beds.ac.uk/10.3390/separations10040254
Note that from the first issue of 2016, this journal uses article numbers instead of page numbers. See further details here.