
Selective H2 Evolution and CO2 Absorption in Electrolysis of Ethanolamine Aqueous Solutions
Department of Advanced Energy Engineering Science, Kyushu University, Fukuoka 816-8581, Japan
*
Author to whom correspondence should be addressed.
Separations 2023, 10(11), 578; https://0-doi-org.brum.beds.ac.uk/10.3390/separations10110578
Submission received: 30 October 2023
/
Revised: 11 November 2023
/
Accepted: 18 November 2023
/
Published: 20 November 2023
(This article belongs to the Special Issue Advances in CO2 Adsorptive Separation for CO2 Capture)
Abstract
:Selective H2 evolution and CO2 absorption in several ethanolamine aqueous solutions are comparatively investigated using a new electrolysis reactor. H2 bubbles are generated from a cathode in any ethanolamine electrolyte, and its experimental gas evolution rates are correlated by Faraday’s first rule. No or smaller amounts of CO2 and N2 bubbles than stoichiometric ones are generated on an anode through the reaction between hydroxide ions and ethanolamine ones. No CO or O2 is observed in the system exhaust, and most of the CO2, along with N2, is still absorbed in ethanolamine aqueous solutions with the addition of KOH and/or HCOOH under high pH conditions. Variations of the concentrations of coexisting ions dissolved in the electrolytes of mono- or tri-ethanolamine (MEA or TEA) and ethylenediamine (EDA) solutions with CO2 absorption are calculated using the equilibrium constants to relate the concentrations of solute ions. Electric resistivities of the ethanolamine aqueous solutions are correlated by the pH value and are analyzed in terms of equilibrium constants among the concentrations of coexisting ions. Conditions of the MEA electrolyte to achieve high-performance electrolysis is discussed for selective H2 generation.
1. Introduction
Hydrogen (H2) is a promising secondary energy source in the near future. Because H2 is not present in natural resources, two major production methods are developed and put into industrial use. One is H2 production by electrolysis of alkaline water or relevant aqueous solutions, which uses an expensive proton exchange membrane (PEM) to separate electrolytes between two electrodes. Aqueous solutions of alkali chloride (NaCl or KCl) are also used for the production of NaOH or KOH and Cl2 for industrial uses. Then, H2 is generated as another by-product. H2 is separately generated from Cl2 using an anion exchange membrane (AEM) and two separate electrodes [1]. However, H2 purification is necessary for industrial high-grade products [2]. Another H2 production method is the steam-reformation reaction or partial oxidation from natural resources, such as hydrocarbons of methane, naphtha and coal. By-product carbon monoxide (CO), along with H2 included in the combustion gas, is recovered from exhaust gas to be utilized as industrial raw materials for synthesizing carbonyl groups. Carbon dioxide (CO2) generated is necessary to be recovered without exhausting the atmospheric environment. Most CO2 is recovered by the pressure swing adsorption (PSA) process or liquid film absorption by ethanolamine solutions in H2 production sites. Thus, industrial H2 production ways are closely related to the processes of H2 purification and CO2 recovery. Its selective production and recovery become a key for effective H2 production in place of conventional technology methods.
Here, attention is focused on alkaline water electrolysis for small-scale H2 production plants. Constituents of H2 and O2 in water electrolyte are produced from cathode and anode separated with a solid polymer film [3,4]. It is necessary not to mix the two gas products. In order to advance H2 production more effectively, a new technology is tested to evolve only H2 with the use of a nickel–hydroxide electrode for the anode. Oxygen is absorbed by the oxidation reaction from Ni(OH)2 electrodes to NiOOH during electrolysis [5]. Then, oxygen is recovered by the reverse reaction to Ni(OH)2 in the outside of the reactor. Although the products of H2 and O2 are completely separated by electrolysis, two independent processes of water electrolysis and electrode regeneration are necessary for continuous H2 production. In the present study, a new electrolysis process is tested using ethanolamine aqueous solutions. The ethanolamine aqueous solution is a candidate for materials that are widely used to recover CO2 from various exhaust gases. High CO2 capacities are expected. It is expected that selective H2 generation and CO2 absorption can be achieved using electrolysis of ethanolamine aqueous solutions. Enhancement of H2 production efficiency without CO2 or CO exhaustion is expected. So, it is necessary to fully understand the overall mechanism of H2 transfer and effective CO2 recovery from multicomponent amine mixtures. As our first trial to achieve this, attention is focused on the combination of H2 production by electrolysis of ethanolamine aqueous solutions and CO2 recovery in them at the same time. In the present study, H2 generation and simultaneous CO2 generation/absorption by the electrolysis of several alkanolamines aqueous solutions are investigated in order to make clear not only the relation between the overall transfer mechanism of electrolysis products and electrical resistivities but also CO2 absorption/desorption rates in ethanolamine aqueous solutions. A small-scale apparatus for selective H2 production without further product purification is targeted here.
Ethanolamine is the most promising absorber among several alkanolamines to separate CO2 and other gas components, such as CO and CH4, in industrial exhaust gases. Usually, CO2 is selectively recovered from exhaust gas using gas absorption towers, where aqueous alkanolamines and exhaust gas flow downward and upward counter-currently around room temperature, respectively [6]. Then, another CO product is recovered from the top as raw materials for chemical synthesis. Amine solutions after CO2 absorption are regenerated using another gas desorption tower, which is operated at higher temperatures. Research on CO2 absorption and desorption was previously performed using several kinds of ethanolamines [7,8,9,10,11]. Although their solution mechanism has been investigated from various viewpoints in terms of chemical engineering keywords [8,9], the difference between physical absorption and chemical absorption is not sufficiently quantified and clarified. In addition, the effects of other ions or molecules coexisting in alkanolamine solutions are not understood sufficiently. In the present study, CO2 absorption in several amine solvents is comparatively investigated using electrolysis reactors of three amine aqueous solutions: (1) mono-ethanolamine (MEA), with the molecular form C2H4OHNH2 described as R1NH2 (R = C2H4OH), and which is one of the primary alkanolamines, (2) tri-ethanolamine (TEA), which is (C2H4OH)3N or R3N and one of the tertiary alkanolamines and (3) ethylenediamine (EDA), which molecular form is C2H4(NH2)2, and it is a primary amine without any hydroxyl group. In addition, the [H+] ion concentration in the three amines aqueous solutions is controlled to an arbitral value using KOH and HCOOH (or (COOH)2) agents for pH adjustment. The combination of CO2 absorption and H2 generation by electrolysis using the three amine solutions is experimentally investigated here. The H2 evolution rates on an SS316 cathode plate and CO2 and N2 ones on a graphite anode plate are measured. It is investigated as to how different the H2 evolution rates and N2 or CO2 ones are among the three kinds of amine compounds under various pH conditions. Electric resistances and gas evolution rates in the electrolysis of the three amine solutions are determined. Aside from this, CO2 absorption rates in the three amine solutions during electrolysis are also determined as a function of the pH value. The present study may give useful information on small-scale H2 production by electrolysis and simultaneous CO2 absorption using amine solutions.
2. Analysis
2.1. Electrolysis of Aqueous Amine Solutions
If the current efficiency is assumed to be 1 in the electrolysis of alkaline water, the relations between the molar generation rates of H2 and O2 gases, WH2 and WO2,+ and current, I, are expressed as and using the Faraday constant, F. Consequently, the total gas generation rate is expressed by . On the other hand, when an MEA aqueous solution is electrolyzed [9], it is expected that H2, CO2 and N2 are separately generated on the cathode and anode by the overall reaction:
2C2H4OHNH2 + 6H2O → 13H2 + 4CO2 + N2
Equation (1) means that the reaction of 26H2O + 26e− = 13H2 + 26OH− proceeds on cathode and the reaction of 2C2H4OHNH2 + 26OH− = 4CO2 + N2 + 20H2O + 26e− does on anode under high pH conditions. No CO and O2 are generated in the usual electrolysis process of MEA. The stoichiometric generation rates of gases evolved from MEA are , and . The stoichiometric H2 generation rate is 6.5 H2-mol/MEA-mol from Equation (1). The ratio of the gas generation rates is H2:CO2:N2 = 13:4:1. The total generation rate is . However, when all of the CO2 and N2 generated on the anode is physically or chemically absorbed in the MEA solution, only H2 evolution may be observed on the cathode as gas bubbles. This means . Similarly, the Wtot and values for the TEA aqueous solution are and from Faraday’s first law. The stoichiometric H2 generation rate of TEA is 14 H2-mol/TEA-mol. The Wtot and values for the EDA aqueous solution are estimated as and . The stoichiometric H2 generation rate of EDA is 8 H2-mol/EDA-mol.
2.2. CO2 Dissolution into Amine Aqueous Solutions
It depends on the chemical conditions of solutes and whether CO2 bubbles evolved from the electrode or not. When CO2 gas bubbles come into contact with an aqueous solution of primary amine MEA, its overall solution process is divided into two stages: a physical diffusion process and a chemical reaction. Amine solutions absorb CO2 physically at first, and then its physical state moves to the next chemical one. The molar concentration of CO2 under the physical diffusion state is expressed by [CO2], and the chemical ones are described according to their respective ionic states as follows: [HCO3−], [CO32−], [R1NHCOO−] and [R1NH3+]. Several reactions occur among molecules or ions dissolved in solutions. When a primary amine, such as MEA, absorbs CO2 chemically, it is considered that the chemical dissolution reaction advances through a zwitterion state of R1NH2 + COO− to a carbamate of R1NHCOOH [12]. The overall reaction is described by 2R1NH2 + CO2 = R1NHCOO− + R1NH3+. Therefore, MEA has three types of CO2 loading capacities: carbonic (HCO3−), bicarbonic acid (CO32−) and carbamate (R1NHCOO−). The chemical solution process proceeds also in the case of the secondary amine (R2NH). On the other hand, the tertiary amine of TEA does not form any carbamate but only bicarbonate ions because of the absence of an N–H bond in its molecule structure. Consequently, it forms only carbonic or bicarbonic acid.
It is assumed that the overall rate of CO2 absorption from gas bubbles into the physical state is limited by the two steps: (1) diffusion in a liquid boundary layer existing outside bubbles during gas contact with solute and (2) the first-order reaction rate depending on the dissolved CO2 concentration, which means its rate is in proportion to [CO2], as follows:
All symbols used in the present paper are explained in nomenclature. It is considered that the CO2 mass-transfer rate constant through a liquid boundary layer around CO2 gas bubbles is expressed by kabs of the first term in Equation (2) according to the liquid film theory [13]. The reaction rate from a physical state to the chemical state per unit liquid volume is in proportion to the rate constant k1, which is the second term of Equation (2). It is assumed that the bulk [CO2] concentration in Equation (2) is uniform all over the liquid volume of solutions during short contact time because the time when gas bubbles pass through the MEA solution is much shorter than the [CO2] conversion time from the physical state to the chemical one. If one needs to take into consideration variations of the R1NH2 concentration with the reaction progressing, it is necessary to replace the chemical reaction term of k1V[CO2] with k2V[R1NH2][CO2]. The first reaction rate constant, k1, is then replaced by the secondary rate one, k2. The value of [CO2]S is constant regardless of time, and it depends on only the CO2 partial pressure of gas bubbles. Usually, Henry’s law holds between [CO2]S and CO2 partial pressure in the gas phase [8,13]. Equation (2) is solved with the use of the initial time condition of [CO2] = 0 at t = 0 under the assumption of the constant [CO2]S condition as follows:
Equation (3) can be approximated by a linear rate equation of in an initial time range, and its absorption rate is limited by the physical absorption process. Contrarily, the ratio of the g7 concentration in the evolved gas to the saturated one approaches a constant after sufficient contact time while bubbling, and the CO2 molar fraction ratio on the left-hand side of Equation (3) becomes equal to a constant defined as kabsA/(kabsA + k1V) under the steady state. It is considered that kabs may be independent of the kind of amines, and only k1 depends on it. When the value of k1V is much larger than that of kabsA, the yCO2,out/yCO2,in ratio of evolved gas approaches 0. On the contrary, the ratio on the left-hand side approaches unity when k1V is much smaller than kabsA, which means a very low chemical solution rate.
There is less chemical absorption site for CO2 in the molecular structure of TEA. Therefore, the chemical absorption amount of CO2 in TEA is limited to those of HCO3− and CO32−. On the contrary, the EDA aqueous solution has the six chemical absorption states of (CH2)NH2NHCOO−, (CH2)2(NHCOO−)2, (CH2)2NH2NH3+, (CH2)2(NH3)2+ as shown in Appendix A in addition to HCO3− and CO32−. Further, when EDA reacts chemically with CO2, the product of 2-imidazolinone or ethylene urea is generated by the reaction [14]:
C2H4(NH2)2 + CO2 → CO(NHCH2)2 + H2O
The Reaction (4) is irreversible. Therefore, it is expected that EDA also has a higher CO2 loading capacity than others.
2.3. Analysis of Chemical Equilibrium among Ions in Amine Solutions
At first, CO2 is absorbed physically in an MEA solution, and the concentration of free CO2 dissolved in a solution is described by [CO2]. The same physical absorption state appears also in TEA and EDA ones. Then, the free CO2 reacts with MEA and OH− dissolved in water. KOH and HCOOH added for pH adjustment are also present together with K+, H+. and COOH− ions in the solution. The reaction between MEA and CO2 proceeds via zwitterion (R1NH2 + COO−) to carbonic acid (R1NHCOOH). Therefore, CO2 and R1NH2 in aqueous solutions change to ions of HCO3−, CO32−, R1NHCOO−, or R1NH3+, which are under the chemical solution conditions. Thus, chemical CO2 dissolution has been accomplished in an aqueous MEA + KOH + HCOOH solution. If the concentrations of all ions dissolved in a MEA aqueous solution reach equilibrium, the reactions among them are expressed using the six equilibrium constants defined by Ki (i = w, 1~5) as follows:
H2O ⇄ H+ + OH− equilibrium constant Kw
CO2 + OH− ⇄ HCO3− K1
HCO3− ⇄ CO32− + H+ K2
R1NH2 + CO2 ⇄ R1NHCOO− + H+ K3
R1NH2 + H+ ⇄ R1NH3+ K4
HCOOH ⇄ H+ + COOH− K5
Reactions (5), (7), (9) and (10) are considered to be reversible and reach instantaneous equilibrium because they involve only a proton transfer. Reaction (7) is also described as HCO3− + OH− = CO32− + H2O. In contrast, the remaining Reactions (6) and (8) are nearly reversible due to finite reaction rates [13,15]. Judging from the previous data on reaction rates between CO2 and OH− or MEA [16], it is considered that Reactions (6) and (8) also reach equilibrium within a short contact time range. The equilibrium constants of Reactions (5)–(10), Kw, K1, K2, K3, K4 and K5, are determined based on the thermodynamic values of the enthalpy and entropy changes in the references as follows [16,17]:
Electrolytic neutrality holds in the whole KOH + HCOOH + R1NH2 aqueous solution. Consequently, the following formula holds true:
The respective total concentrations of R1NH2, CO2 and HCOOH in the aqueous solution, [R1NH2]0, [CO2]0 and [HCOOH]0, are defined as follows:
When any activity coefficients included in Equations (11)–(16) are described as fk, the material balance equations of Equations (17) and (20) are correlated in terms of [K+], [H+], [CO2], [CO2]0, [HCOOH]0 and [R1NH2]0 into the two relations as follows:
The activity coefficients fk for each ion Xk (k = 1~N) are determined based on the Debye-Hueckel theory [18] as the following relation:
where the constants are given as A = 0.51 (mol/dm3)−0.5, B = 0.33 × 10¹⁰ (mol/dm3)−0.5/m, and a is an average ion diameter [19]. Since the values of [H+] and [CO2] are determined from Equations (21) and (22) by means of the least squared method, the remaining ion concentrations of [OH−], [HCO3−], [CO32−], [R1NHCOO−], [R1NH3+] and [COOH−] are calculated as a function of [K+], [R1NH2]0, [CO2]0 and [HCOOH]0. Since KOH is a strong acid, its dissociation degree can be approximated as unity. This means that the relation of [KOH]0 = [K+] holds true. Thus, all ion concentrations of [H+], [OH−], [HCO3−], [CO32−], [R1NHCOO−], [R1NH3+] and [COOH−] along with [CO2], [R1NH2] and [HCOOH] are determined from the total concentrations of [CO2]0, [KOH]0, [HCOOH]0 and [R1NH2]0 based on the electric neutral balance equation. The H+ ion concentration index, pH (=), at the initial condition is controlled by both [KOH]0 and [HCOOH]0, and the rest of the ion concentrations are determined as a function of [CO2]0 using Equations (11)–(16).
When CO2 is in contact with aqueous TEA + KOH + HCOOH solutions in place of MEA + KOH + HCOOH solutions, the equilibrium relations of Reactions (8) and (9) are replaced by the following equations:
R3N + H+ ⇄ R3NH+ equilibrium constant K6
Since the tertiary amine of TEA has no N–H bond in its molecular structure, ethanol carbamic acid is not generated differently from the case of the MEA solution of Equation (8). Therefore, the CO2 absorption capacity of the TEA solution is limited to HCO3− and CO32−. Similarly, when CO2 is absorbed in the EDA solution in place of MEA and TEA one, the replacement equilibrium equations of Reactions (8) and (9) are shown in Appendix A. When EDA is used for the aqueous amine electrolyte in place of MEA or TEA, the equilibrium is achieved among several ions shown in Appendix A.
If the oxalic acid (COOH)2 is used for the pH adjustment in place of the formic acid HCOOH, the corresponding analytical equations are given in Appendix B.
3. Experimental
Figure 1 shows a schematic diagram of the experimental apparatus. A specified amount (3.00 dm3) of a fresh amine aqueous solution for each experiment is filled in an acrylic square vessel, and two electrodes are inserted. Open space between aqueous solution surfaces in the acrylic vessel and its lid is set as narrow as possible to make the time response fast. A partition made of an acrylic plate is set in the open space to separate two electrodes and evolved gases. The anode electrode plate is made of graphite having a volume resistivity ρC = 1.64 × 10⁻⁵ Ωm, and the cathode electrode one is made of SS316 having ρSS = 7.2 × 10⁻⁷ Ωm. The thickness of two plate electrodes, δ, is 1.0 mm, their area, A, is 176.3 cm2, and the distance between the anode and the cathode, l, is 13.6 cm. Since the resistances of the anode and the cathode are much lower than the overall resistance of amine electrolytes (0.5–10 Ω), the resistances of the two electrodes can be neglected. Three kinds of amine solutions are tested here. The three amines are MEA, TEA and EDA of special grade. The purity of the three amines is >99.0+%. The experiment is performed in such a way that respective amine gram concentrations are the same as 200 g/dm3 regardless of MEA, TEA and EDA aqueous solutions. This is because the gas generation rates of H2, CO2 and N2 per unit volume of each amine are expected to be almost the same among the three amine solutions with different molecular weights. The stoichiometric H2 generation rates for the three amines are 6.5 mol-H2/mol-MEA, 14 mol-H2/mol-TEA and 8 mol-H2/mol-TEA if the current efficiency is assumed to be 1. The expected maximum generation rate is reduced to almost the same value of 0.10 mol-H2/g-amine regardless of MEA, TEA and EDA. The amine molar concentration used in the experiment is 3.27 mol/dm3 for MEA, 1.35 mol/dm3 for TEA and 3.30 mol/dm3 for EDA. The pH value of each amine solution at the initial state before electrolysis or CO2 + Ar gas bubbling is controlled to a specified one by using potassium hydroxide (KOH), formic acid (HCOOH) or oxalic acid (COOH)2. The molar concentrations of KOH and HCOOH are [KOH]0 = 0.18 M and [HCOOH]0 = 0.17 M, respectively. The initial pH value is controlled between 7 and 13. Arbitral electric current and voltage can be applied between two electrodes, and variations of the overall resistances with current are determined. No corrosion was observed on two electrodes after all the electrolysis experiments were finished.
Four kinds of measurements are carried out: (1) measurement of overall resistances and gas evolution rates from two electrodes during electrolysis of MEA (or TEA, EDA) + KOH + HCOOH solutions, (2) measurement of the H2, CO2 and N2 molar fractions in the gaseous phase evolved from several amine electrolyte solutions during electrolysis, (3) the pH measurement during electrolysis with time passage and numerical analysis on variations of ion concentrations in solutions, and (4) measurement of CO2 absorption rates under the supply of a constant concentration and a flow rate of CO2 + Ar gas bubbles during electrolysis.
The flow rates of gases evolved from the anode and cathode were measured by a soap film flowmeter, and the concentrations of the molecular species, such as H2, O2, CO2, CO, CH4 and N2 in evolved gas, are detected separately by gas chromatography. Electrolyte temperature was measured regularly, and its average temperature was 21 °C. Isotherm conditions were kept throughout the experiment with air cooling. Effects of reaction heat during electrolysis are supposed to be negligibly small under the present experimental conditions.
4. Results and Discussion
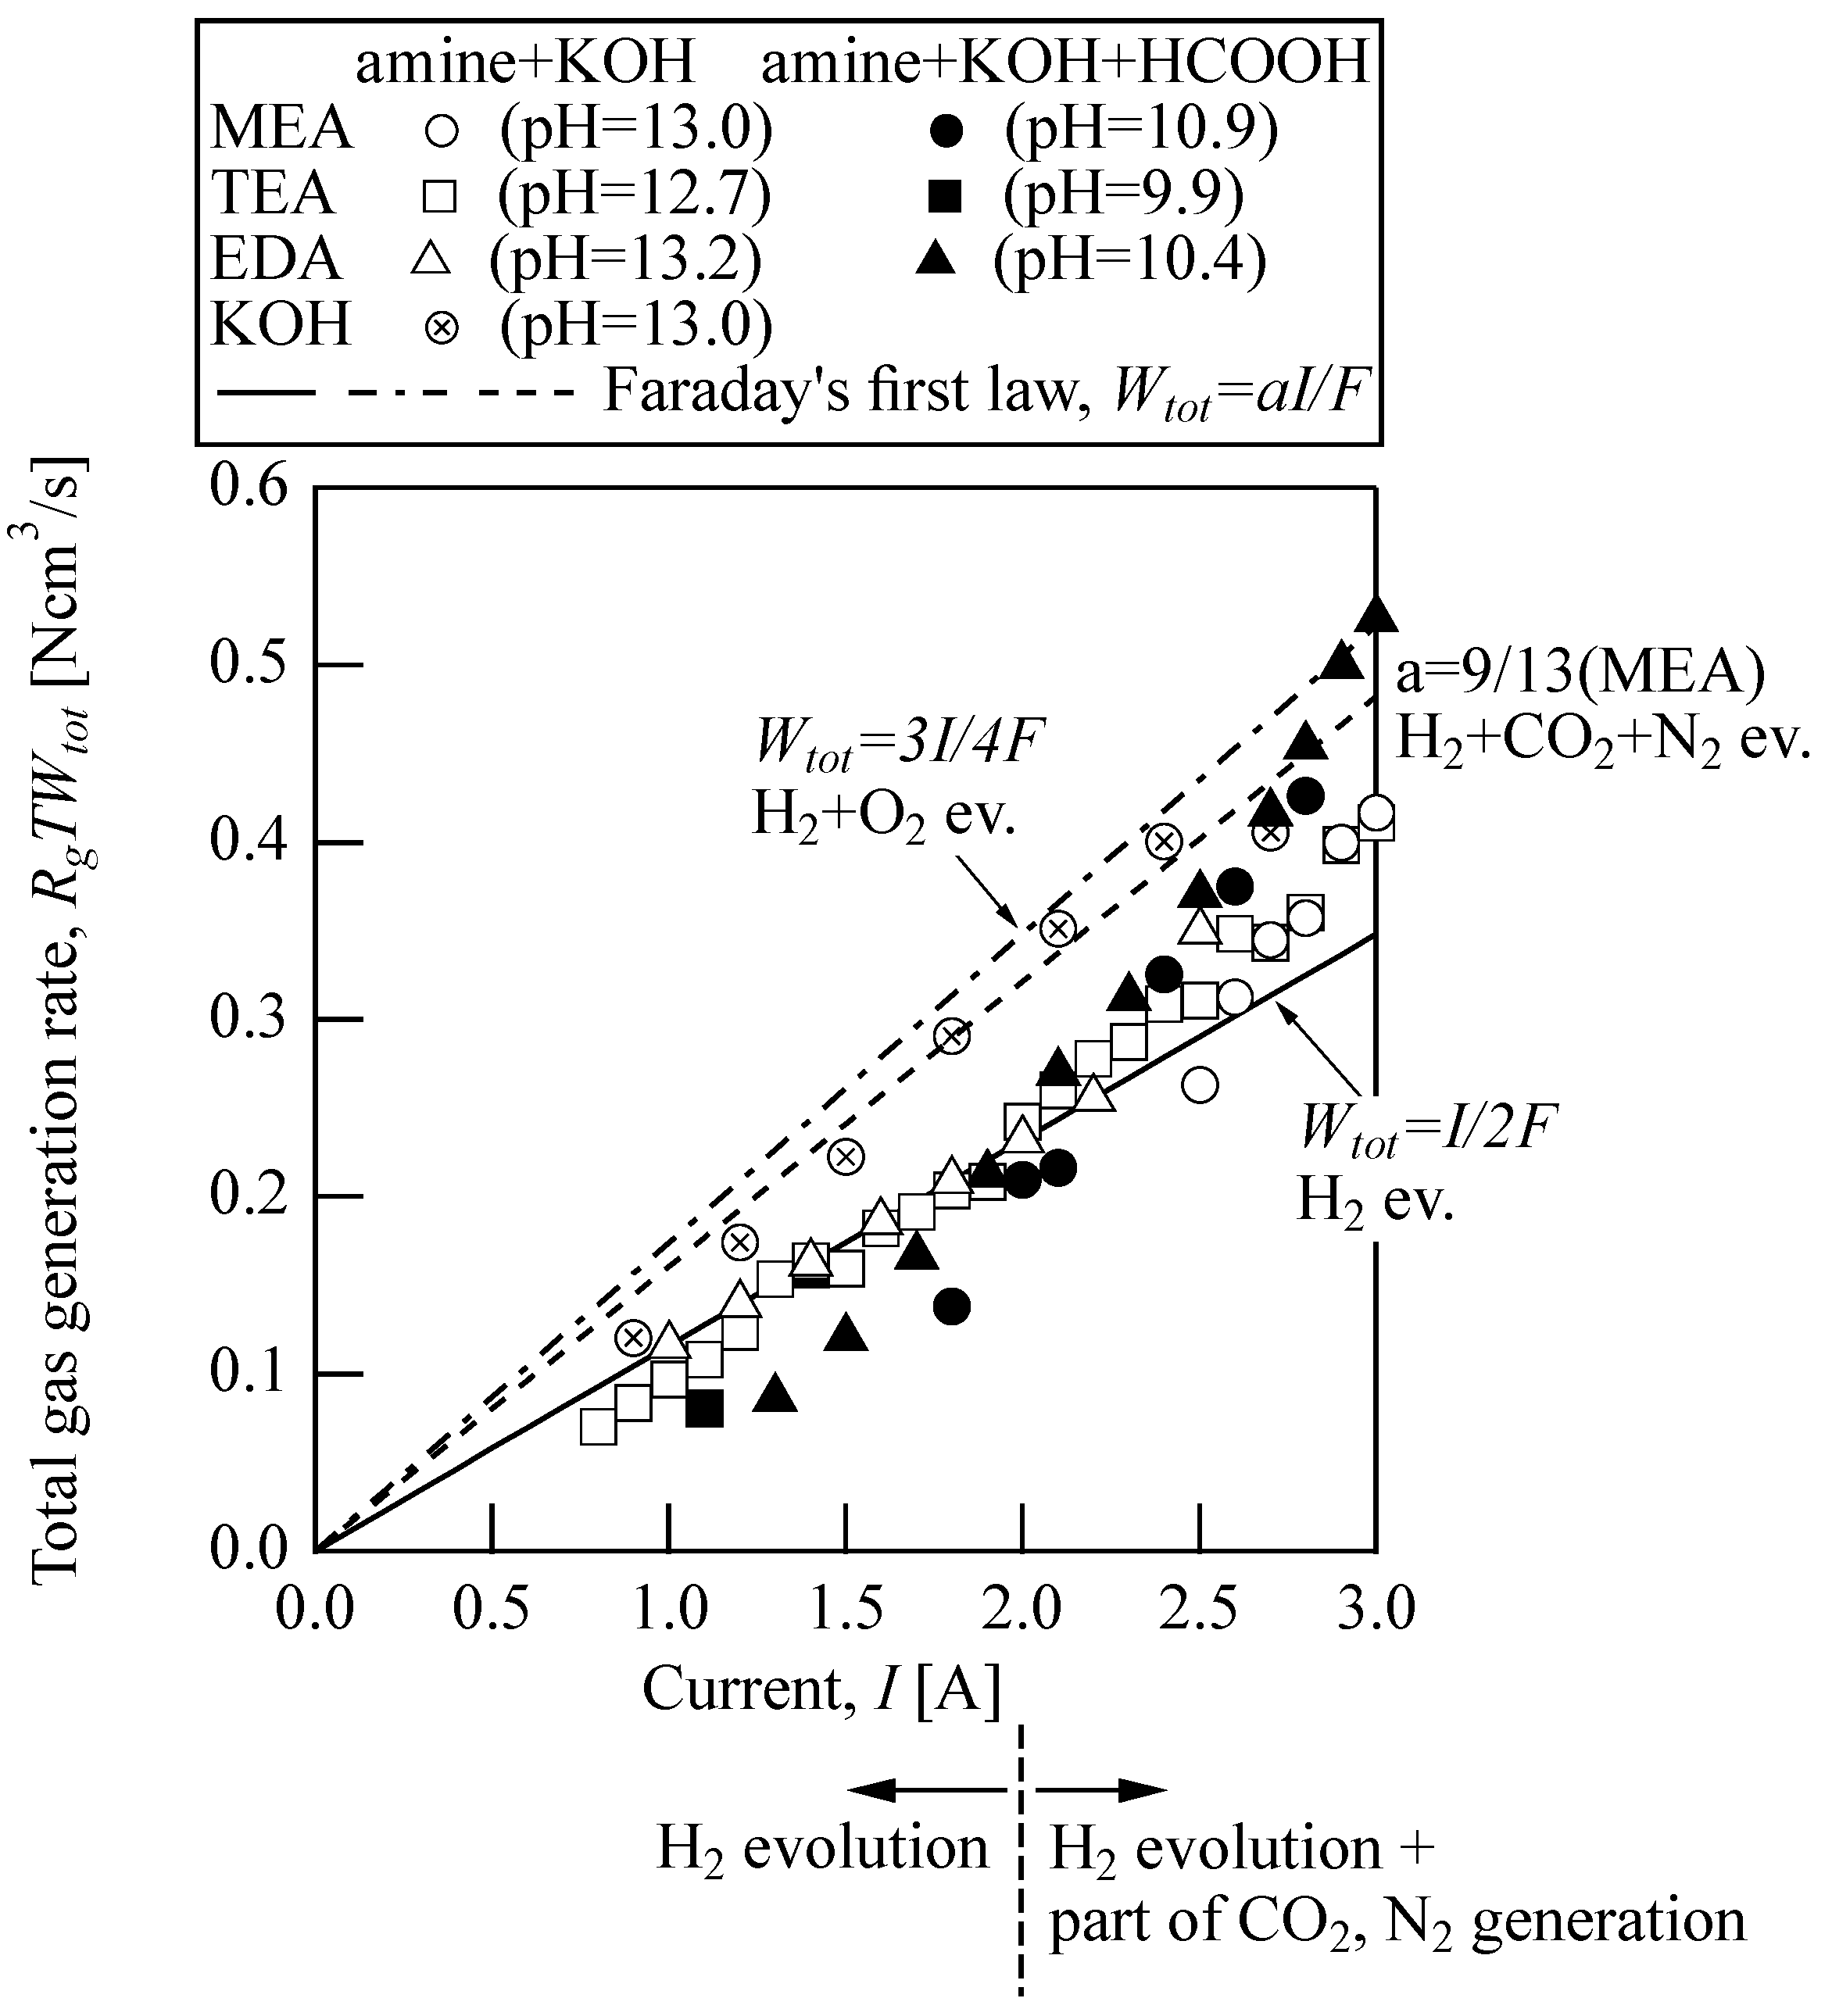
Since the flow rate of gas that evolved from the anode was negligibly low, attention was focused on the total flow rate of gas that evolved from two electrodes after the space plate separating the two electrodes was removed. Figure 2 shows the total gas evolution rates as a function of current in the case of electrolysis of six different concentrations of the amine aqueous solutions and the alkali KOH solution. The experiment is repeated under the conditions of different amine solutions and pH conditions. At least seven data for each symbol in Figure 2 are plotted under the same pH and amine conditions. The pH value is almost constant between 12.7 and 13.2 for the amine + KOH solution and between 10.4 and 10.9 for the amine + KOH + HCOOH solution throughout the electrolysis experiment. In addition to the six experiments, when the KOH solution (pH 13.0) without amine is electrolyzed, H2 and O2 gases evolved on the cathode and anode as expected. No CO2 and CO are generated from the anode electrode, which is made of graphite. This is assured by gas chromatographic analysis of evolved gas. Experimental data and estimation in the case of the KOH solution are shown by and a chained line in the Figure, respectively. The total evolution rates are compared with a chain line of WH2+O2 = 3I/4F, which is calculated by Faraday’s first law. The vertical axis of the Figure is shown by the volumetric gas generation rate of RgTWtot [Ncm3/s]. Comparatively good agreement is obtained between the experiment data shown by and the calculation chain line by WH2+O2 = 3I/4F for the electrolysis of the KOH solution. It is found that the gas absorption of H2 and O2 into the solution is negligibly small.
On the other hand, when the MEA, TEA and EDA aqueous solutions were electrolyzed, H2 was generated from the cathode of any amine solution among the six cases regardless of the different pH conditions in a similar way to the KOH solution. However, less or no bubble formation was observed on the anode of the MEA solution, and CO2 and N2 bubbles, along with CO or other gas components, were hardly generated from the anode. Small amounts of gas bubbles were observed only at comparatively higher current conditions of the TEA or EDA solution. The species of evolved gas were identified as CO2 and N2 by gas chromatography analysis, and the concentration and the flow rate were determined. Deviations between the MEA data marked by ○ and ● and Faraday’s law shown by a broken line (WH2 = I/2F) become smaller in the lower current region of I2A, where only H2 is evolved from the amine aqueous solutions. The same thing holds true in the cases of TEA (□, and EDA (△,▲). When the current approaches 3 A, the total gas generation rates become slightly larger than the solid line of Wtot = I/2F. This is because some of the CO2 and N2 generated on the anode are discharged after partial absorption into the amine solutions. The total gas evolution rate slightly deviates from the solid line of Wtot = I/2F with the increase in the electric current and approaches Wtot = 9I/13F, as shown by a broken line for the MEA solution. Although the expected asymptote lines are Wtot = 41I/56F for TEA and Wtot = 11I/16F for EDA, both lines are not shown in the Figure because the differences among the three amine solutions are negligibly small. This tendency is more appreciable for gas rates evolved from the amine solution of the lower pH (pH 10) than those under the higher pH condition (pH = 13). The condition where the gas evolution rate starts deviating from the solid line of Wtot = I/2F in Figure 2 is determined as I = 2A and pH = 10. When I > 2A and pH = 10, CO2 and N2 start generating from the anode, and the total gas generation rates approach the broken line of Wtot = 9I/13F, Wtot = 41I/56F or Wtot = 11I/16F. These results are deeply related to the [OH−] concentration in solutions. This is further discussed in the CO2 gas absorption experiment during electrolysis.
Figure 3 shows experimental results of CO2 gas dissolution rates in MEA, TEA or EDA + HCOOH aqueous solutions during electrolysis operation. A constant molar fraction and flow rate of CO2 + Ar gas mixture of yCO2,in = 0.373 and WCO2,in = 16.3 μmol/s is introduced into the amine aqueous solutions at atmospheric pressure and room temperature (T = 21 °C) under a low current condition of 2A. The current condition of I = 2A and the pH = 9 one is selected in such a way that the three amine aqueous solutions still have CO2 absorption capacity judging from the results of Figure 2. The initial amine concentration, [MEA]0, [TEA]0 or [EDA]0 and the HCOOH concentration before CO2 introduction, [HCOOH]0, are given in the Figure. The ratios of the inlet to outlet CO2 molar fraction for the three amine solutions are obtained as a function of time passage at a constant CO2 introduction rate of WCO2,in. The yCO2,ut/yCO2,in ratios on the left-hand side are deeply related to physical-to-chemical CO2 transitional rates. As shown in Section 2.3, when a conversion rate from a physical absorption state of dissolved CO2 to a chemical one is fast, the ratio on the vertical axis becomes small. The value on the left-hand side at a steady state is equal to that of kabsA/(k1V + kabsA). The ratio also depends on the kinds of amines and their pH value. Generally, conversion rates for MEA or EDA solutions are considered to be much faster than those for TEA cases under the same concentration in gram/dm3 units. This is because MEA and EDA are the primary amine solutions and have one or two N–R1 bonds in an amine molecule. Therefore, they can quickly form their zwitterion states in each molecule, and the transition from the physical state to the chemical one may be enhanced. Each molecule finally dissociates to (C2H4OH)NH3+ or (CH2)2NH2H+ ions in aqueous solutions. Thus, it is considered that the conversion rate from the physical state to the chemical one for MEA and EDA is faster than that of TEA.
Figure 4 shows yCO2,out/yCO2,in values (or the absorption rate) at the steady state for various pH conditions, where the solutions are controlled to [MEA]0 = 3.10 mol/dm3, [KOH]0 = 0.18 mol/dm3 and [HCOOH]0 = 0.15~0.36 mol/dm3. As seen in the Figure, the yCO2,out/yCO2,in ratio depends on the pH value, and the ratio becomes smaller with the increase of the pH value. Consequently, the k1V/kabsA ratio becomes larger at the higher pH value. Since the physical absorption rate constant of kabs may be independent of the amine types, the transition rate constant from a physical state to a chemical one for the MEA electrolyte denoted by k1 becomes larger with the increase of the pH value. Judging from the slope of the broken line, which means = constant, the translate rate constant indicated by k1 may be in proportion to [OH−]. Consequently, the relation of is obtained by the comparison between Equation (3) and the broken line in Figure 4. Therefore, the reaction is considered to be the first order with respect to both concentrations of CO2 and OH−. This result leads to the conclusion that Reaction (7) proceeds as R1NH2 + CO2 + OH− ⇄ R1NCOO− + H2O, according to the Danckwerts model [12].
The overall resistivities of the MEA solutions were determined from the relation between the electric potential and the current during electrolysis. Figure 5 shows variations of the overall resistivity of several amine solutions as a function of the current. The overall resistivities, ρ, are determined using the relation of . Judging from the experimental relation between I and E, the resistivities of the three amine solutions show almost constant values except for the very low current region. As seen in the Figure, the resistivities of the MEA and EDA aqueous solutions are slightly lower than that of the TEA one, having the same concentration in g/dm3 unit. The difference between the KOH solution (the broken line) and any amine solution is caused by other ions dissolved in each aqueous solution. The broken line in Figure 5 shows a theoretical resistivity based on the strong electrolyte model, which is determined by the law of Kohlrausch’s independent ionic migration and is described by for two-component infinite diluted solution mixtures. The broken line for the KOH solution is calculated using z1 = 1 and = 0.073 Sm2/mol for the K+ ion and z2 = 1 and = 0.199 Sm2/mol for OH−. A comparatively good agreement is obtained between the experimental data of the KOH solution and its theory. In addition, the Kohlraushu’s square root law also predicts the relation of . Therefore, the overall resistivities of MEA, EDA and TEA solutions increase with the increase in the total ion concentrations involved in the solution, denoted by C. Figure 6 shows a correlation of experimental resistivities at I = 3A for the three amine solutions as a function of the pH value. Any of the three amine solutions show similar variations with the pH value, and the resistivity becomes lower at higher pH values. It is noticed that the TEA solutions show comparatively higher resistivity values than other amines, regardless of the pH values. The C values are considered to become larger with the decrease in the pH values because of a greater amount of CO2 absorption and, consequently, more CO32−, HCO3−, R1NHCO2 and R1NH3+ ions generated.
As already known in previous studies, CO2 is chemically absorbed in the MEA aqueous solutions with the two types of bicarbonate (HCO3−) and carbamate (R1NHCOO−) [20]. Since two valences of MEA are necessary in order to form one carbamate, the maximum CO2 loading becomes 0.5 mol-CO2/mol-amine. On the other hand, one TEA molecule changes one bicarbonate of the potential maximum loading, which corresponds to a 1 mol-CO2/mol-amine. Figure 7 shows calculative variations of respective ion concentrations for the R1NH2 + KOH aqueous solution with the increase in CO2 loading, where the initial concentrations of [R1NH2]0 = 0.1 mol/dm3 and [KOH]0 = 0.1 mol/dm3 are assumed. The increase in [CO2]0 results in the increase of [H+] and also in the increase of [HCO3+], [CO32−], [R1NHCOO−] and [R1NH3+]. However, [CO32−] and [R1NHCOO−] start decreasing at a higher loading point than the location of [CO2]0 = 0.1. [CO32−] is the main CO2 absorption ion when pH is high. The concentrations for the R3N + KOH (TEA) aqueous solution behave in a similar way to MEA. When CO2 loading is small, or the pH value is high, the main ion species are CO32−. The ethanol carbamate ion concentration of R1NHCOO− becomes the major one around [CO2]0 = 0.1 mol/dm3 with the increase in CO2 loading. Further CO2 loading results in the fact that the major species in the MEA solution become R1NH3+ and HCO3−.
The conditions to select which amine solution is preferable for selective H2 evolution by electrolysis are to show (1) similar electric conductivity to that of the KOH alkali solution, (2) selective H2 evolution and CO2 absorption during electrolysis, and (3) sufficient CO2 absorption rate and capacity during electrolysis. All those results show that the MEA or EDA solutions can serve as an appropriate electrolyte for selective H2 generation by electrolysis under a current condition of I2A (=11.3 mA/cm2) and a pH condition of pH 10. It is preferable to use the MEA solution for electrolytes because EDA absorbs CO2 irreversibly, and the CO2 absorption rate of TEA is lower than others. Figure 8 shows a schematic diagram of the continuous MEA electrolysis system to provide selective H2 evolution and CO2 recovery. The pH condition can be controlled by KOH and HCOOH. A combination of electrolysis of the MEA alkali solution and reversible CO2 absorption in/desorption from the electrolyte can lead to selective H2 generation. The CO2 desorption will be performed using a regeneration tower heated to 100~140 °C [21]. Although CO2 and N2 are generated from an anode, CO2 generated can be immediately absorbed in amine solutions, and effective separation can be performed. The CO2 absorption is the first order with respect to the OH− concentration in solute. Since the pH value decreases with the progress of CO2 absorption, the pH control by CO2 desorption is necessary for the long-time electrolysis operation. A small amount of N2 is physically absorbed in the solution, and the rest is generated from the anode. The electrolysis of amine solutions, along with CO2 capture [10,11], can be understood by the physical absorption process and the chemical equilibrium conditions of reactions among related ions.
5. Conclusions
H2 generation on the cathode and CO2 absorption on the anode were observed during electrolysis of MEA, TEA and EDA aqueous solutions under high pH conditions of pH > 10. The H2 evolution rates are correlated by Faraday’s first law. No, or smaller amounts of CO2 bubbles than stoichiometric values, evolved in the three amine solutions because of selective CO2 absorption into amine solutions. The CO2 dissolution rate is in proportion to [CO2] and [OH−], and the CO2 chemical absorption rates for MEA and EDA are faster than that of TEA because of the presence of the N–H bond in MEA and EDA. Overall resistivities of the three amine aqueous solutions are determined and correlated as a function of the [H+] or [OH−] concentration. The resistivities of MEA solutions are kept low under high pH conditions and increase with the decrease in the pH values. This is because of the increase in the CO2 concentration in MEA solution, where ions, such as [CO32−], [HCO3−], [R1NHCO2−] and [R1NH3+], are chemically absorbed. A combination of electrolysis of the MEA alkali solution and CO2 desorption from the electrolyte can provide a continuous way to produce H2.
Author Contributions
All authors contributed to the investigation. Conceptualization, S.F. and R.S.; Methodology, M.O.; GC analysis, K.K.; Data interpretation, S.F. and R.S.; Resources, S.F., R.S., M.O. and K.K.; Software, S.F. and M.O.; Writing—original draft preparation, S.F., R.S. and K.K. All authors have read and agreed to the published version of the manuscript.
Funding
This research received no external funding.
Data Availability Statement
The data presented in this study are available on request from the corresponding author.
Acknowledgments
The authors extend their appreciation to E-plus Co., Ltd. for preparing the electrolysis reactor used in the present study.
Conflicts of Interest
The authors declare no conflict of interest.
Nomenclature
| A | total bubble surfaces in solution [m2] |
| a | mean ionic diameter [m] |
| C | total ion concentration [mol/dm3] |
| E | electric potential, voltage [V] |
| F | Faraday’s constant (=9.648 × 10⁴) [C/mol] |
| fi | activity coefficient of i component ion dissolved in solution [-] |
| I | current [A] |
| J | ionic strength of solution [mol/dm3] |
| Ki | equilibrium constant of reaction i [-] or [(mol/dm)n] |
| k | constant [m3.5/mol1.5Ω] |
| kabs | mass-transfer coefficient through boundary layer around bubbles [m/s] |
| k1 | the first-order reaction rate constant from physical solution state to chemical solution one [1/s] |
| k2 | second-order reaction rate constant [dm3/mols] |
| l | distance between two electrodes [m] |
| N | the total number of ion species dissolved in solution [-] |
| pCO2 | CO2 partial pressure [Pa] |
| V | liquid electrolyte volume [m3] |
| W | evolution rate of gas [mol/s] or [Nm3/s] |
| yCO2 | molar fraction of CO2 in gas phase [-] |
| z | ionization degree in solution [-] |
| Λ | molar conductivity [m2/molΩ] |
| ρk | electric resistivity of component k [Ωm] |
| [ ] | molar or gram concentration in solution [mol/dm3] or [g/dm3] |
| [ ]0 | molar or gram concentration in solution at initial condition [mol/dm3] or [g/dm3] |
Appendix A. EDA Solution
When EDA of (CH2)2(NH2)2 is used for an electrolyte in place of MEA or TEA aqueous solution, it reacts with CO2 and H+ ions dissolved in the aqueous solution. Then, the following reactions may progress in place of Equations (4) and (5):
(CH2)2(NH2)2 + CO2 ⇄ (CH2)2NH2NHCOO− + H+
(CH2)2NH2NHCOO− + CO2 ⇄ (CH2)2(NHCOO−)2 + H+
(CH2)2(NH2)2 + H+ ⇄ (CH)2NH2NH3+
(CH2)2NH2NH3+ + H+ ⇄ (CH2)2(NH3)2+
The kinds of ions involved in solutions are H+, (CH2)NH2NHCOO−, (CH2)2(NHCOO−)2, (CH2)2NH2NH3+, (CH2)2(NH3)2+ and may be present according to various pH values.
Appendix B. (COOH)2 Solution
When the oxalic acid (COOH)2 is used for the pH control in place of the formic acid HCOOH, the following equilibrium reactions progress in place of Equation (6):
(COOH)2 ⇄ H+ + H(COO)2− equilibrium K7
H(COO)2− ⇄ H+ + (COO)22− K8
The molar concentrations of MEA and CO2 in the aqueous solution depend on only [H+]. Therefore, the results do not depend on which of (COOH)2 or HCOOH is used for the acid control.
References
- Ng, W.K.; Wong, W.Y.; Rosli, N.A.; Loh, K.S. Commercial anion exchange membranes (AEMs) for fuel cell and water electrolyzer applications: Performance, durability and materials advancement. Separations 2023, 10, 424. [Google Scholar] [CrossRef]
- Wang, S.; Lu, A.; Zhong, C.J. Hydrogen production from water electrolysis: Role of catalysts. Nano Converg. 2021, 8, 4. [Google Scholar] [CrossRef] [PubMed]
- Schalenbach, M.; Zeradjanin, A.R.; Kasian, O.; Chervko, S.; Mayrhofen, K.J.J. A perspective on low-temperature water electrolysis challenges in alkaline and acidic technology. Int. J. Electrochem. Sci. 2018, 13, 1173–1226. [Google Scholar] [CrossRef]
- Chen, L.; Dong, X.; Wang, Y.; Xia, Y. Separating hydrogen and oxygen evolution in alkaline water electrolysis using nickel hydroxide. Nat. Commun. 2016, 7, 11741. [Google Scholar] [CrossRef] [PubMed]
- Mohamadbigy, K.H.; Bazmi, M.; Behradi, R.; Binesh, R. Amine absorption column design using mass transfer rate simulation. Pet. Coal 2005, 47, 39–46. Available online: https://www.researchgate.net/publication/237642937 (accessed on 16 November 2023).
- Teranishi, K.; Ishikawa, A.; Nakai, H. Computational chemistry studies on CO2 chemical absorption technique: Challenge on energy and environmental issues. J. Comput. Chem. Jpn. 2016, 15, A15–A29. [Google Scholar] [CrossRef]
- Suda, T.; Iwaki, T.; Mimura, T. Facile determination of dissolved species in CO2-amine-H2O system by NMR spectroscopy. Chem. Lett. 1996, 25, 777–778. [Google Scholar] [CrossRef]
- Li, L.; Maeder, M.; Burns, R.; Puxty, G.; Clifford, S.; Yu, H. The Henry coefficient of CO2 in the MEA-CO2-H2O system. Energy Procedia 2017, 114, 1841–1847. [Google Scholar] [CrossRef]
- Sato, K.; Hamada, S.; Isaka, M.; Nishimura, T.; Ashikawa, M.; Robert, M.; Usui, T. Reprocessing wastewater by electrolysis. Proc. Sanit. Eng. Symp. 2000, 8, 28–33. Available online: http://hdl.handle.net/2115/7203 (accessed on 16 November 2023).
- Hack, J.; Maeda, N.; Meier, D.M. Review on CO2 capture using amine-functionalized materials. ACS Omega 2022, 7, 39520–39530. [Google Scholar] [CrossRef] [PubMed]
- Yamada, H. Amine-based capture of CO2 for utilization and storage. Polym. J. 2021, 53, 93–102. [Google Scholar] [CrossRef]
- Danckwerts, P.V. The reaction of CO2 with ethanolamines. Chem. Eng. Sci. 1979, 34, 443–446. [Google Scholar] [CrossRef]
- Knuutila, H.; Juliussen, O.; Svendsen, H.F. Kinetics of the reaction of carbon of dioxide with aqueous sodium and potassium carbonate solution. Chem. Eng. Sci. 2010, 65, 6077–6088. [Google Scholar] [CrossRef]
- Suib, S.L. New and Future Developments in Catalyst: Activation of Carbon Dioxide; Elsevier: Amsterdam, The Netherlands, 2013; p. 163. [Google Scholar] [CrossRef]
- Hagewiesche, D.P.; Ashour, S.S.; Al-Ghawas, H.A.; Sandall, O.C. Absorption of carbon dioxide into aqueous blends of monoethanolamine and N-methyldiethanolamine. Chem. Eng. Sci. 1995, 50, 1071–1079. [Google Scholar] [CrossRef]
- Aboudheir, A.; Tontiwachwuthikul, P.; Chakma, A.; Idem, R. Kinetics of the reactive absorption of carbon dioxide in high CO2-loaded, concentrated aqueous monoethanolamine solutions. Chem. Eng. Sci. 2003, 58, 5195–5210. [Google Scholar] [CrossRef]
- Donaldson, T.L.; Nguyen, Y.N. Carbon dioxide reaction kinetics and transport in aqueous amine membrane. Ind. Eng. Chem. Fundam. 1980, 19, 260–266. [Google Scholar] [CrossRef]
- Dean, J.A. Lange’s Handbook of Chemistry, 12th ed.; McGraw Hill: New York, NY, USA, 1979; pp. 4–9. ISBN 0-07-016384-7. [Google Scholar]
- Wright, M.R. An Introduction to Aqueous Electrolyte Solutions; Wiley: Hoboken, NJ, USA, 2007; ISBN 978-0-470-84293-5. [Google Scholar]
- Horng, S.Y.; Li, M.H. Kinetics of absorption of carbon dioxide into aqueous solutions of monoethanolamine + triethanolamine. Ind. Eng. Chem. Res. 2002, 41, 257–266. [Google Scholar] [CrossRef]
- Rao, A.B.; Rubin, E.S. A technical, economic and environmental assessment of amine-based CO2 capture technology for power plant greenhouse gas control. Environ. Sci. Technol. 2002, 36, 4467–4475. [Google Scholar] [CrossRef] [PubMed]
Figure 1.
A schematic diagram of the experimental apparatus.

Figure 2.
Total gas evolution rates in the electrolysis of several amine solutions, where the initial MEA, TEA and EDA concentrations are set to be 200 g/dm3 regardless of [MEA]0, [TEA]0, and [EDA]0.
Figure 2.
Total gas evolution rates in the electrolysis of several amine solutions, where the initial MEA, TEA and EDA concentrations are set to be 200 g/dm3 regardless of [MEA]0, [TEA]0, and [EDA]0.

Figure 3.
Rates of CO2 absorption into three amine aqueous solutions. The gram concentration of [MEA]0, [TEA]0 or {EDA}0 is 200 g/dm3.
Figure 3.
Rates of CO2 absorption into three amine aqueous solutions. The gram concentration of [MEA]0, [TEA]0 or {EDA}0 is 200 g/dm3.

Figure 4.
Relation of CO2 absorption rate as a function of H+ ion concentration.

Figure 5.
Resistivity of MEA aqueous solutions as a function of current.

Figure 6.
Relation between resistivity and pH for aqueous MEA, TEA and EDA solutions at comparatively high current conditions, where [MEA]0 = 3.1 M, [TEA]0 = 1.4 M, [EDA]0 = 3.2 M, [KOH]0 = 0.18 M, and [HCOOH] = 0.15~0.36 M (mol/dm3).
Figure 6.
Relation between resistivity and pH for aqueous MEA, TEA and EDA solutions at comparatively high current conditions, where [MEA]0 = 3.1 M, [TEA]0 = 1.4 M, [EDA]0 = 3.2 M, [KOH]0 = 0.18 M, and [HCOOH] = 0.15~0.36 M (mol/dm3).

Figure 7.
Variations of calculated ion concentration in aqueous MEA + KOH solution with CO2 loading.
Figure 7.
Variations of calculated ion concentration in aqueous MEA + KOH solution with CO2 loading.

Figure 8.
Continuous H2 generation system using MEA electrolyte.

Disclaimer/Publisher’s Note: The statements, opinions and data contained in all publications are solely those of the individual author(s) and contributor(s) and not of MDPI and/or the editor(s). MDPI and/or the editor(s) disclaim responsibility for any injury to people or property resulting from any ideas, methods, instructions or products referred to in the content. |
© 2023 by the authors. Licensee MDPI, Basel, Switzerland. This article is an open access article distributed under the terms and conditions of the Creative Commons Attribution (CC BY) license (https://creativecommons.org/licenses/by/4.0/).
Share and Cite
MDPI and ACS Style
Fukada, S.; Sakai, R.; Oya, M.; Katayama, K. Selective H2 Evolution and CO2 Absorption in Electrolysis of Ethanolamine Aqueous Solutions. Separations 2023, 10, 578. https://0-doi-org.brum.beds.ac.uk/10.3390/separations10110578
AMA Style
Fukada S, Sakai R, Oya M, Katayama K. Selective H2 Evolution and CO2 Absorption in Electrolysis of Ethanolamine Aqueous Solutions. Separations. 2023; 10(11):578. https://0-doi-org.brum.beds.ac.uk/10.3390/separations10110578
Chicago/Turabian StyleFukada, Satoshi, Ryosuke Sakai, Makoto Oya, and Kazunari Katayama. 2023. "Selective H2 Evolution and CO2 Absorption in Electrolysis of Ethanolamine Aqueous Solutions" Separations 10, no. 11: 578. https://0-doi-org.brum.beds.ac.uk/10.3390/separations10110578
Note that from the first issue of 2016, this journal uses article numbers instead of page numbers. See further details here.