Article

Validation of a Size-Exclusion Chromatography Method for Bevacizumab Quantitation in Pharmaceutical Preparations: Application in a Biosimilar Study

Departamento de Ingeniería Química y Tecnología Farmacéutica, Facultad de Farmacia, Universidad de la Laguna, 38200 Tenerife, Spain
*
Author to whom correspondence should be addressed.
Submission received: 11 July 2019 / Revised: 31 July 2019 / Accepted: 22 August 2019 / Published: 4 September 2019

Abstract

:
In May 2019, the Food and Drug Administration (FDA) proposed a quality range (QR) method for the comparative analytical assessment in biosimilar studies. In this process, several reference product lots are necessary, selected from a wide period of manufacturing dates with different shelf lives, to calculate the total variability expressed as the standard deviation of reference product lots. This one depends on the between-lots variation and analytic method uncertainty (i.e., within-lots variation). During this time, the analytical method must be in control and stable but with an appropriate accuracy and precision. In such a situation, various control charts were used to fix the method requirements and detect small changes in the process. The results indicate that the method is indeed in control and stable, but does not meet the requirements of the Analytical Target Profile (ATP) approach, independently of the established uncertainty range. However, it does satisfy the traditional approach for an uncertainty range of ±2%. The application of this new QR approach shows that the selection of reference lots has an impact on the estimated standard deviation of the reference product, and consequently on the QR, penalizing good test products. The contribution of the analytic method error is known and in-control through the validation process. However, the between-lots variation requires a higher attention and control by the manufacturer. All these aspects were analyzed, using simulation and real-data from various bevacizumab lots.

Graphical Abstract

1. Introduction

In May 2019, the FDA published the guidance entitled Development of Therapeutic Protein Biosimilar: Comparative Analytical Assessment and Other Quality-Related Considerations [1] after the FDA withdrew the guidance Statistical Approaches to Evaluate Analytical Similarity [2] on June 2017 by industry comments [3]. The new guidance describes the Agency’s recommendations on the design and evaluation of comparative analytical studies intended to support a demonstration that a proposed biosimilar product is biosimilar to a reference product. Two novelties: (1) The FDA called for a minimum of 10 reference product lots to be sampled in order to establish a meaningful similarity acceptance criteria, whereas the FDA also recommends at least 6 to 10 lots of the proposed product; (2) In the quantitative data analysis, the FDA proposes a quality range (QR) method in the comparative analytical assessment. At this point, the critical quality attributes (CQAs) potential should be prioritized using risk ranking based on the clinical impact and degree of uncertainty of each attribute [1]. However, other methods of data analysis, including equivalence testing, may be used [1,4].
Furthermore, to apply the QR approach, it is necessary to know the variability of the reference product lots expressed as a standard deviation. For this, several reference lots are necessary, selected from a wide period of manufacturing dates with different shelf lives. This fact implies: (1) the potential for the between-lot variability of the reference product should be taken into account during this process, and (2) the high analytic method variability should not be an excuse for a large total variability. In such a situation, the analytic method must be in-control and stable but with an adequate accuracy and precision at all times. For example, the analytical method should be able to provide a drug content measurement with a precision sufficient for detecting a meaningful difference under a given condition. All this involves a new challenge in the analytic method validation. In this case, it is necessary to select the analytical method suitable for the intended use and demonstrate its suitability, whether it is to be used for characterization or as a quantitative method in the release and stability testing of biopharmaceutical drugs and finished products [5]. In this regard, several international regulatory organizations have published guidelines [6,7,8]. The principles underlying analytical method validation must be applied at appropriate stages so that the methods are deemed compliant with international expectations, and, in particular, so that the analytical method data derived from the methods retain their full scientific value [5].
The characterization of both biosimilar and reference products involves a variety of analytical methods, comparing their physicochemical properties, biological activities, impurities and stability. Besides this, the consistency and robustness of the manufacturing process also needs to be demonstrated by implementing quality control, assurance procedure, and process validation. Although there are no specific types of assays for evaluating biopharmaceutical drugs, including biosimilar ones, the selection of analyses is influenced by the properties of the reference product, but the exact requirements can vary across regulatory agencies [9].
Vandekerckhove et al. [10] have published a list of possible techniques for the similarity assessment of a therapeutic protein for relevant attributes classified by risk rank. However, it is important to note that other techniques may be appropriate for the biosimilar product in development, and future advances must also be taken into consideration [5].
The aim of our research was to apply (with various examples) the new FDA recommended approach for the analytical similarity assessment based on the QR method. At this point, we analyzed and estimated the level of variability for the two sources of variation: the between-lot variation and analytic method uncertainty. The protein content, expressed as a percentage of the actual concentration relative to the claim value, was used as a high-risk attribute. For this, we used a simulation and real data from various bevacizumab lots.
Previously, the proposed analytic method was validated at the time of testing and was demonstrated to be fit for the intended use. The validation was carried out at two levels: (1) a pre-study validation process in accordance with the ICH-Q2-(R1) guidelines [8], and (2) an in-study validation procedure using different control charts combined with the Analytical Target Profile (ATP) approach.

2. Materials and Methods

2.1. Materials

Bevacizumab (Avastin®, Genentech Inc., Roche Laboratory, Garden City, UK) was supplied as a 25 mg/mL solution in a phosphate buffer (pH = 6.2) containing 159 mM α,α–trehalose dehydrate and 0.04% w/v polysorbate 20. Deionized water was purified in a MilliQ plus system from Millipore (Molsheim, France), prior to use. All other chemicals and reagents were HPLC grade. All solvents were filtered with 0.45 µm (pore size) filters (Millipore) and degassed.

2.2. Size Exclusion Chromatography System

The chromatographic system used was a Waters apparatus (Milford, MA, USA) consisting of a pump (600E Multisolvent Delivery System), an auto sampler (700 Wisp model) and a differential refractive index (RI) detector (Waters model 2414). Elution was performed at room temperature in a Protein KW-804 column (8 × 300 mm, Waters). The data was collected and analysed using the Millennium32® chromatography program (Waters). This software was also used for chromatogram integration and estimating the monomer content through the relative peak area percentage values. The mobile phase was phosphate-buffered saline (300 mM NaCl, 25 mM phosphate, pH 7.0) at a flow rate of 1.0 mL/min, and an injection volume of 25 µL.

3. Results and Discussion

3.1. SEC Method

Size exclusion chromatography (SEC) separates proteins on the basis of their hydrodynamic radius, is simple to use and compatible with a high-throughput mode, and is the election method for the analysis of aggregation in therapeutic proteins [11]. The quantity of aggregate and monomer in a protein are often evaluated using SEC coupled with an ultraviolet (UV) spectrophotometer. SEC with multi-angle light scattering (SEC/MALLS) and analytical ultracentrifugation sedimentation velocity (AUC-SV) are characterization techniques used to support the SEC analysis [11]. Oliva et al. [12] have used SEC coupled with different detection modes to study the stability, level of impurities and its identification, and aggregation mechanism of bevacizumab. Typically, the SEC method is used in lot release testing, comparability and similarity assessments for purity-related product quality attributes, but not for the protein content as critical quality attributes (CQAs) due to various reasons related to the disadvantages of this techniques: a reversible aggregation process, sample dilution effect or adsorption of the protein to the chromatographic matrix. All these factors would reduce the quantity of the aggregate and monomeric protein detected [11]. Some of these were previously analyzed for us [12].
Several international regulatory organizations [6,7] recommend carrying out the validation process at two levels: The “pre-study” validation should show that the method achieves its objectives, whereas the “in-study” validation verifies that the method remains stable and in-control over time [6]. This latter plays a vital role during the analytic similarity assessment of biosimilar drugs. In all these procedures, it is necessary to consider the measurement uncertainty associated with the results and to determine whether the level of variability satisfies the specification limits [7].

3.1.1. Pre-Study Validation

A pre-study validation procedure was conducted to prove that the method could deliver quality results, following the ICH-Q2-(R1) [8]. System adequacy parameters such as the retention time, tailing factors, and theoretical plate number were measured to check the performance. All these parameters were within the specified limits. Interference from the excipients (trehalose and polysorbate 20) did not interfere with the peak of interest; their elution times were greater. To evaluate the effect of the chromatographic matrix, a sample of 30 µg/mL was injected (the same sample) into the system six times, and an RSD of 0.35% was obtained. In conclusion, the quantity of aggregate and monomer protein is not affected. The identity of both species was checked by us in a previous work using SEC/MALLS [12].
The calibration standards were prepared at five different concentration levels ranging from 5 to 30 µg/mL (n = 30), using the mobile phase as a diluent, and analytic runs were performed on different days. In such a situation, it is important to check that there is no difference between days in order to pool data. For this, the following statistical model was used:
y i j = ( β 0 + α 0 , i ) + ( β 1 + α 1 , i ) · x i , j + ε i , j
where yij is the response for the concentration xj-th for the i-th day; β0 and β1 correspond to the intercept and slope of the first day; α0,i are the differences between intercepts for day 1 and day 2, 3,…k, and α1,i are the differences in the slopes. The term ε represents the error associated with the concentration j-th measured on the i-th day. Table 1 shows the ANOVA results obtained using the “lm” function from R-program [13].
The null hypothesis of no differences between intercepts and slopes was accepted for all situations (p > 0.05). This supposes that the observed variability is only due to the analytic method error, and second, that the data from different days can be pooled to obtain the regression line. In our case, a linear relationship between the signal peak areas of bevacizumab (μV·s) and the corresponding concentrations (μg/mL) were found (Figure 1). The absence of systematic errors (bias) was verified using the plotted reference versus predicted values for the samples of the calibration [14]. The limit of detection (LOD) and limit of quantitation (LOQ) were determined as 2.14 and 6.49 µg/mL, respectively, using the signal-to-noise approach.
The accuracy was examined by the RSD of the recovery data from a minimum of nine determinations over a minimum of three concentration levels covering the specified range. The average percentage recoveries were found to be 99.1% with an RSD of 3.00%. The system precision expressed as repeatability was determined from six replicate injections of a sample at 20 µg/mL, yielding an RSD value of 0.85%. The intermediate precision of the assay was also evaluated by the same analysts, under the same work conditions, but on three different days, in accordance with the design proposed by Maroto et al. [15]. In this case, the overall precision corresponds to a time-different intermediate precision. From this study, the between-measurement variance (sm2) and the between-day variance (sday2) were calculated to be 0.025 and 0.090, respectively, for a concentration of 20 µg/mL, the intermediate precision being expressed as a percentage RSD of 1.70%.
The statistical design of the experiments was utilized to evaluate the robustness of the analytical method, in our case a factorial design with two levels and two variables. From the two-way ANOVA, the Flow main term only contributes to the model, whereas the pH term was not influenced. Figure 2 shows the contour plot of the monomer content as a function of both variables. Considering a level of variability of ± 2% for the flow rate (a real situation in this type of analytical method) and changes in the pH of ± 0.2 units, the monomer content is within the expected value, indicating that our analytical method is robust enough.
The bevacizumab was stable at 5 °C over a 24-month period; no more than a 1% difference was observed with respect to the label claim. The long-term stability data from the manufacturer show that no significant changes occur when stored at 5 °C for up to 24 months [12].

3.1.2. In-Study Validation

The main objective of this validation process was to check the maintenance of the validation conditions in the laboratory over a long time period. For this, a control sample with a nominal concentration of 25 µg/mL was analyzed each working day (n = 34). Different control charts have been used to monitor the quality and reliability of an instrument for testing CQAs. The analytic method can provide robust results if the observed variability falls within the pre-specified acceptance limits. In this case, the uncertainty in estimating these limits should be taken into account [16].
Control charts are designed under the assumption that a method to be monitored will produce measurements that are independent and identically distributed over time, when only the inherent sources of variability are present in the method [17]. For this, the normality of the data must be checked through Q-Q plots and statistical tests (e.g., Anderson-Darling, Shapiro-Wilk or chi-square). The results confirmed that the concentration distribution is not significantly different from a normal distribution at a 5% significance level according to Q-Q plots and the Anderson-Darling test. Assuming that the data are indeed normally distributed, the method mean was estimated to be 24.9 µg/mL from the X-chart. At first, all individual measurements were within the lower (LCL) and upper (UCL) control limits [24.4, 25.4] calculated according to Montgomery [17]. The Moving Range (MR)-chart allows the method’s standard deviation to be estimated, the value being 0.17 µg/mL. These data indicate that the analytical method is in control and stable. Therefore, control charts provide enough information to fix the method requirements.
Cumulative Sum (CuSum) and Exponentially Weighted Moving-Average (EWMA) control charts efficiently complement the X_bar and MR control charts when there is interest in detecting small changes in the process, around ± 1.5 SD, and the sample consists of an individual unit. However, many researchers have discussed which of them is better in accordance with the level of variability that must be detected [15]. In practice, the EWMA control chart worked well with the parameters λ = 0.4 (smoothing constant) and L = 3.054 (control limit width fixed at three standard deviations), a value recommended by Montgomery [15]. Under this scenario, the sample number #22 was out of the central limits (see Figure 3). This fact is assignable with a column change. Using a value of λ = 0.2, the change was clearer, since the samples #21 and #23 were also affected.
The CuSum control charts directly incorporate all the information into the sequence of sample values by plotting the cumulative sums of their deviations from a value objective [18]. Moreover, when an up or down tendency appears, this indicates that the process average changes, which requires a search to determine the causes. Furthermore, the CuSum control chart showed two altered zones, the first with an upward tendency (C+), located between the positions 19 and 25. Furthermore, this was a similar situation to those observed in the EWMA control chart, whereas the second one was located close to the end of the process (see Figure 4) and with a downward tendency (C−). The cause of this latter change was attributable to introducing a new bevacizumab lot from the sample #28.
At first, the CuSum control chart performed better for detecting shifts lower than 1.5 SD. However, EWMA provided the forecast for where the average will be in the next period, which makes it easier to apply in the control method.

3.2. Risk Assessment

Determining the suitability of the analytical method and the risk of taking incorrect decisions depends both on the used consistency and criteria [6]. Moreover, the control charts data analysis during the in-study validation can estimate the accuracy and precision providing a measure of data quality, whereas a joint measure including both parameters can help us to gauge the associated risk [19,20]. In our case, the β-expectation tolerance interval rule was used to assess both aspects. The balanced one-way random effects model proposed by Mee [21] was used to construct two-sided β-content tolerance intervals. This only requires calculating the method within-run (σ2E), between-run (σ2B), and total variance (σ2Tot), and the quantities of the standard normal and chi-square distribution according to the degree of freedom [21,22]. In this case, the data consists of measurements taken over a nominal concentration of 20 µg/mL, following a sampling design with nine independent runs (I = 9) and three replicates per runs (J = 3). The resulting two-sided β-expectation tolerance intervals for a nominal concentration of 25 µg/mL were 25.28 and 24.58 mg/mL, respectively corresponding to 1.13% and −1.69% from the nominal concentration [22]. Thus, the performance is adequate with regards to the nominal concentration, since both parameters were lower than the acceptance limit, λ, which was set at 3%, although a value of 2% may also be acceptable.

3.3. Analytical Method Performance

The performance requirements of any analytical method must be previously established using different tools and criteria; for example, the ATP tool is a good option. In this case, the overall uncertainty (i.e., precision + accuracy = ± 3%) and probability (95%) were established, criteria based on the quality of the results and the capability of the analytical method used in this study.
The application of the traditional acceptance criteria for the analytical measurements for nominal concentrations of 25 µg/mL indicates that the measurement has no more than a ± 2% bias and no more than a 2% variability, expressed as precision. However, various values are outside the defined region for 3% when the ATP approach is applied, and, therefore, it is not possible to ensure with at least a 95% probability that the samples are within ± 3% of 95–105% of the nominal concentration. This fact is due to bias and precision being interdependent in comparison with the traditional acceptance criteria, and therefore the method does not meet the requirements of ATP. At first, the data analysis indicates that the bias is under control but the precision must improve in order to meet the ATP. Thus, the selection of the level of performance has a great impact on the result quality and consequently affects its validity.

3.4. Quantification of Bevacizumab in Pharmaceutical Preparation

Directive 75/318EEC as amended states “Unless there is appropriate justification, the maximum acceptable deviation in the active substance content of the finished products shall not exceed ±5% at the time of manufacture. On the basis of the stability test the manufacturer must propose and justify maximum acceptable tolerance limits in the active substance content of the finished product up to the end of the proposed shelf-life” [23]. Within this limit, both the variability in production and the test procedure for the assays, i.e., the analytic method error, are included.
According to this Directive, the active substance content of the finished product up to the end of the shelf life must be higher than 95%. The expected value for the content must be at least 95% plus the analytic method error in order to satisfy this. Under this condition, the analytic method must satisfy this objective; if the opposite is true, the method must be optimized or a new one must be found.
The obtained results show that all analysed bevacizumab lots present a content of monomer, expressed as a percentage of the declared content, within acceptance limits established by the Directive. Any analytic method used to test particular CQAs should be developed, qualified, validated and implemented, and, in particular, their suitability for the intended purpose should be demonstrated. All these aspects have been analysed and verified for the proposed SEC method.

3.5. Analytical Similarity Evaluation

In the last guidance published in 2019, the FDA recommends a quality range (QR) method in the comparative analytical assessment [1]. The QR of the reference product for specific CQAs is defined as: ( μ ^ ¨ R x   ·   σ ^ R ,   μ ^ ¨ R   +   x   ·   σ ^ R ) , where μ ^ ´ R is the reference product lots mean, σ ^ R is the standard deviation of the reference product lots, and x should be appropriately justified. A comparative analysis of a quality attribute would generally support a finding that the proposed product is highly similar to the reference product when a sufficient percentage of biosimilar lot values (e.g., 90%) fall within the QR defined for that attribute.
In this work, we tested six bevacizumab commercial lots manufactured at different times and showing at least 1-year residual shelf lives, from two measurements for each lot. To apply the QR method, and for illustration purposes: (1) we arbitrarily assigned a lot number to each sample (scenario #1) and (2) the approach proposed by Wang and Chow [24] was used to obtain the between-lot ( σ B L 2 ) and within-lot variances ( σ W L 2 ), respectively.
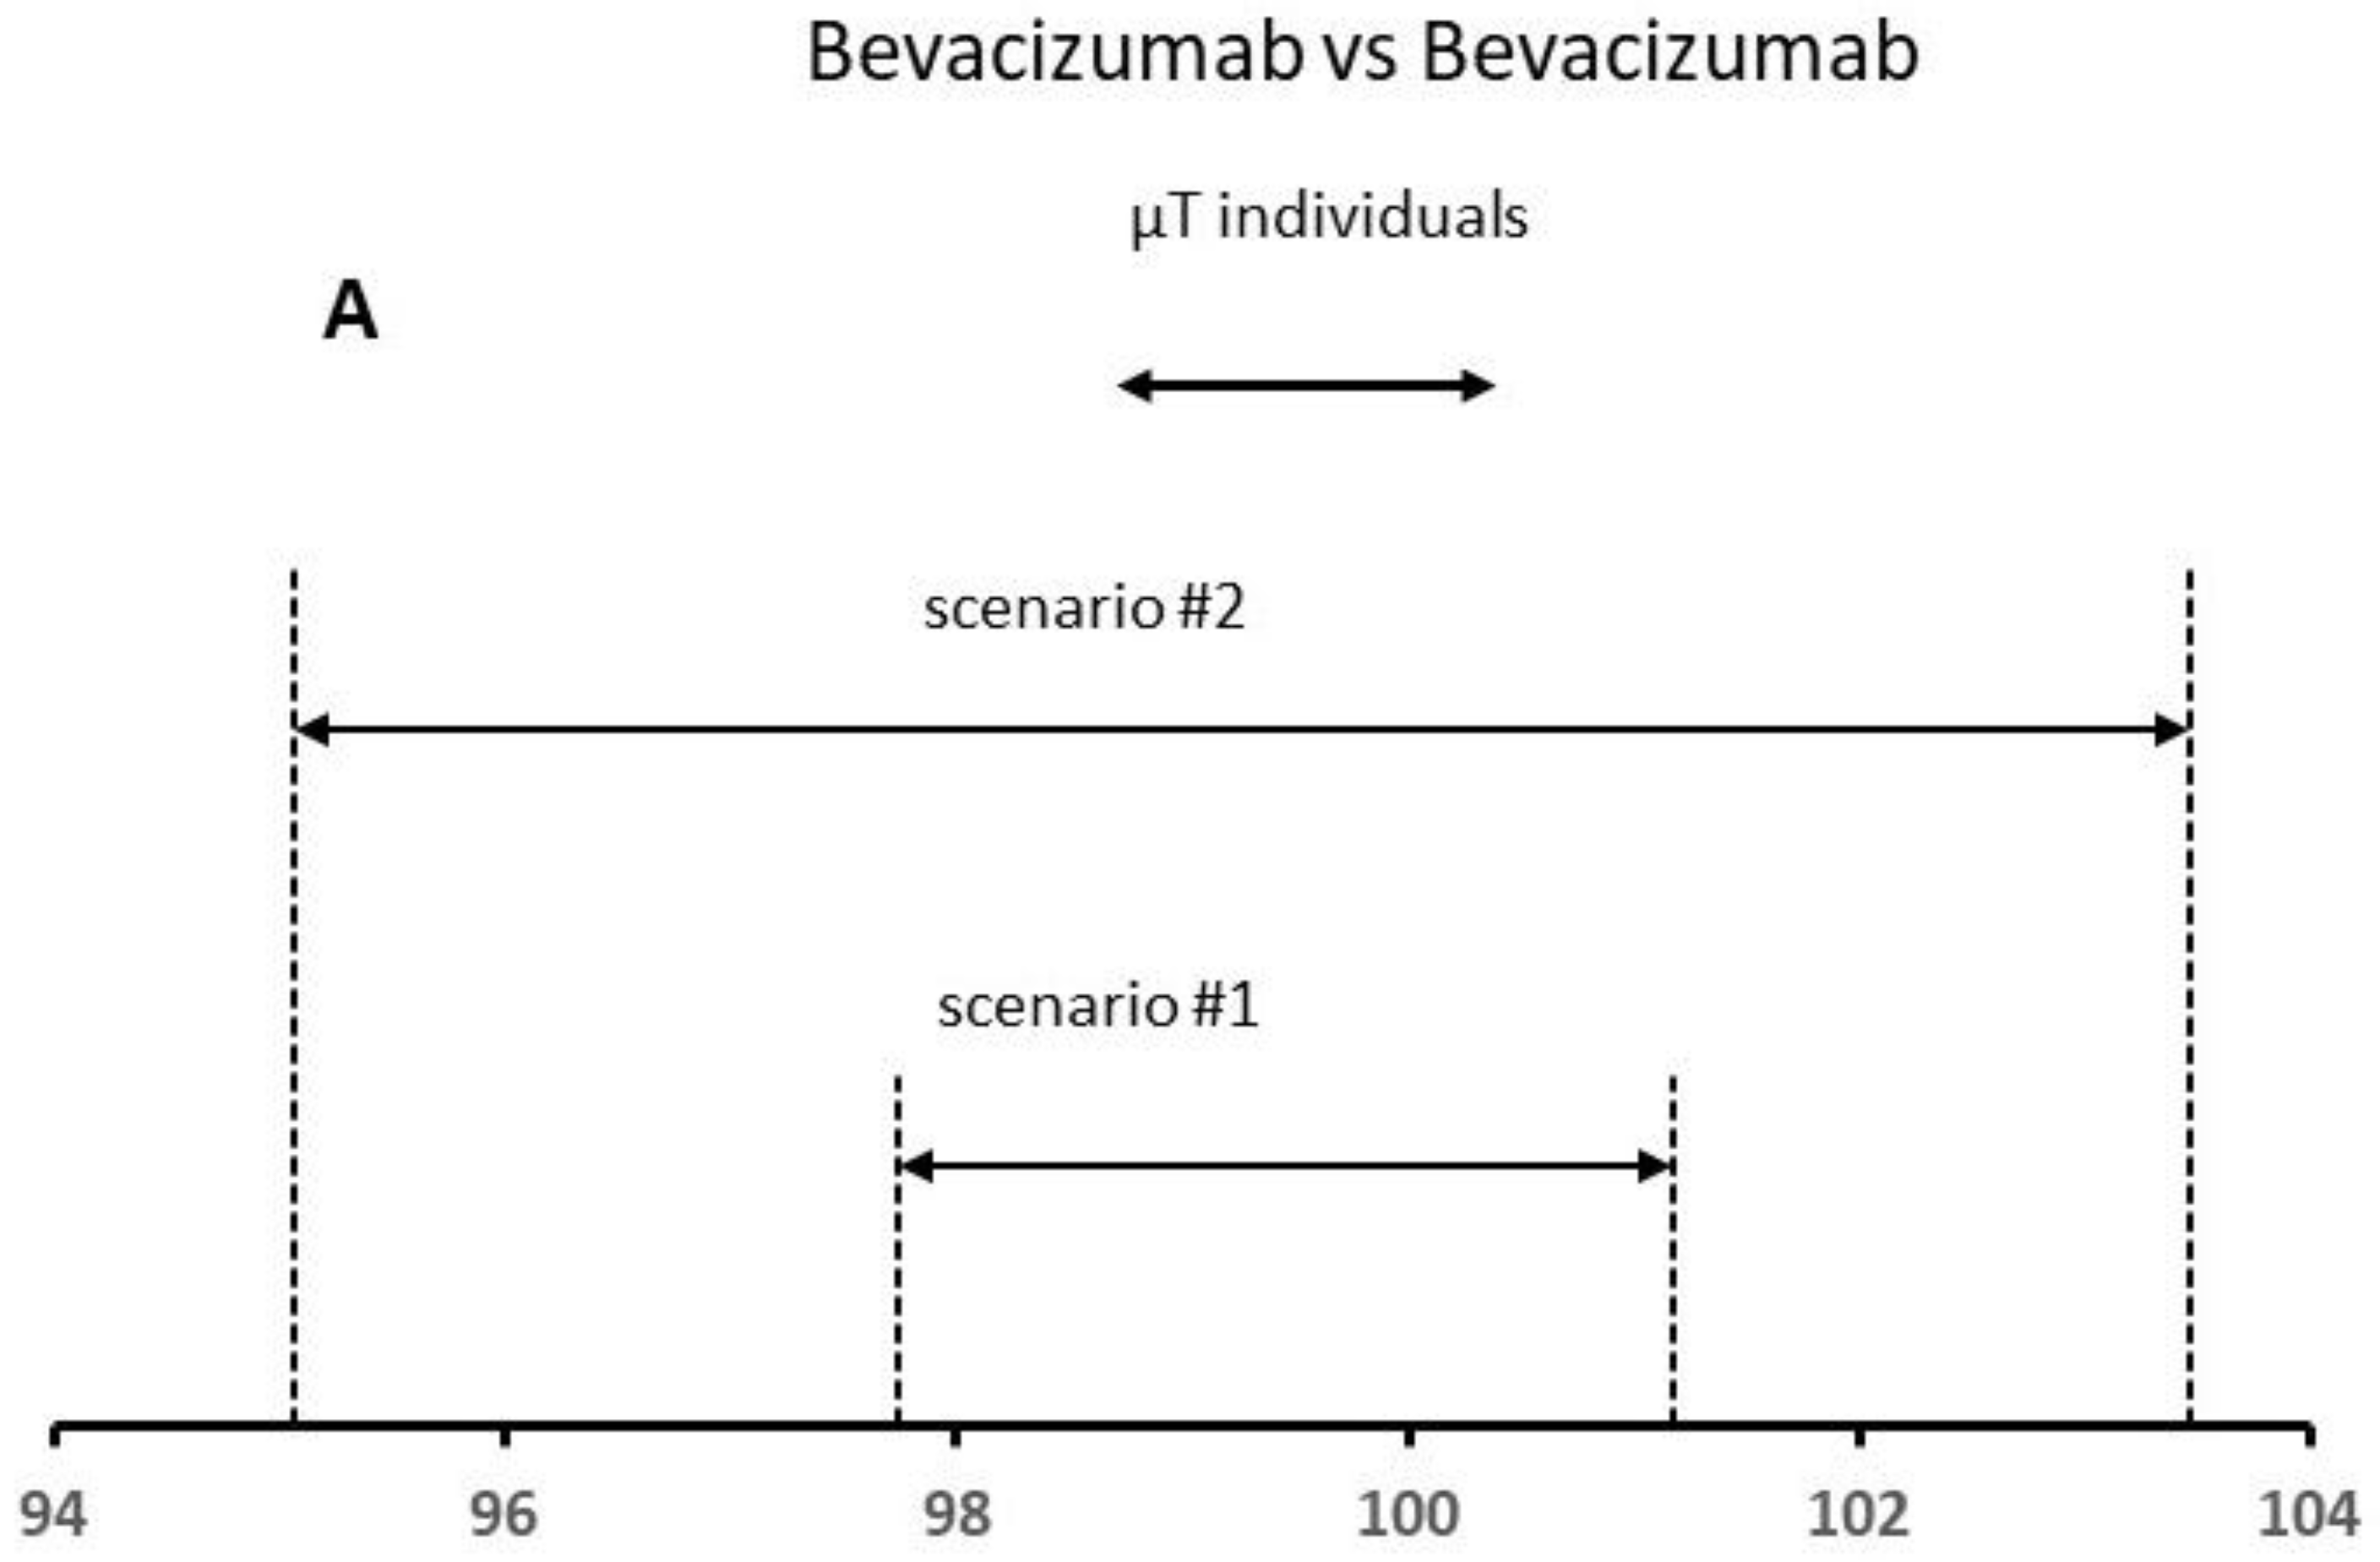
Table 2 shows the obtained results for different scenarios. For the obtained variances for scenario #1, σ B L 2 and σ W L 2 were 0.15 and 0.59, respectively, σ R being 0.86, whereas the mean for the reference product was 99.46%. The analytical method error expressed as RSD was 0.78% ( σ W R / μ ¯ R ) , the between-lot variability being 0.38%. Considering these data, the total variability is lower than 1.0%. In scenario #2, we increased the total variability up to 2.5% (value corresponds to the estimated analytic method error). The mean content was 99.26%, whereas σ B L 2 was similar to those obtained for scenario #1, and σ W L 2 (i.e., analytic method error) was 4.28, approximately 7 times higher in comparison with that estimated for scenario #1. The total variability total was 2.11%.
At this point, the analytic method error is within the expected limits (2.5%), whereas the between-lot variability is lower than 1%. The results indicate that the two main sources of variation are in-control; even the observed level of variability is close to the capability of the analytic method.
To apply the QR method, it is necessary to fix the x constant value. Recent publications and FDA presentations specify x values ranging from 2 to 3 to assure that there will be a high percentage (e.g., at least 95%) of the test values falling within the QR [25,26]. The FDA recommends a lower X value for the higher risk quality attribute such as the protein content. To apply this approach, we have considered the mean content for six lots used in this study as test lot individual values (see Figure 5). Based on the FDA criteria, a high similarity is demonstrated for both scenarios, since more than 90% of the data points (all data) for the test product were within the QR of the reference product (Figure 5A). In principle, the reference product is authorized and should always be biosimilar to itself. The results confirmed this fact.
In a second step, we analyzed the real data published by Burdick et al. [27] for the protein content (% of declared content) by RP-HPLC for the US Neupogen and Commercial EP 2006 lots. To apply the QR method, we used the “sample with replace” function from R-program to obtain the replicates for each lot [13]. The obtained variances for scenario #3, σ B L 2 and σ W L 2 , were 1.15 and 0.167, respectively, σ R being 1.15, whereas the mean for the reference product was 100.14% (Table 2). The analytical method error expressed as RSD was 0.40%, the between-lot variability being 1.15%. Considering these data, the total variability was slightly higher than 1.0%. In scenario #4, we increased the total variability up to 2.15% (value published by the author). The mean content was 100.48%, whereas σ W L 2 was 0.670 for scenario #4, and σ B L 2 (i.e., lot-to-lot variability) was 4.35, approximately 4 times higher in comparison to that estimated for scenario #3. The total variability total was 2.32%.
At this point, the analytic method error is within the expected limits for an HPLC method (2–5%), whereas the between-lot variability is higher than 2.0%. Based on the FDA criteria, a high similarity is only demonstrated for scenario #4, since more than 90% of the data points (all data) for the test product were within the QR of the reference product (Figure 5B).

4. Conclusions

The validity of the proposed method was controlled and verified during routine use, using two approaches: (1) the “pre-study” validation shows that the method is specific, linear, accurate, precise, robust, and stability indicating; and (2) the “in-study” validation was verified using control charts, including quality control samples, to monitor the method parameters. The results indicate that the method is in control and stable.
The β-tolerance interval approach provides information about the method’s suitability and controls the risk of incorrect decision-making. For this, the sampling design and level of analytic variability during the pre-study validation should be controlled in order to take the correct decision. The results indicate that the method does not meet the requirements of the ATP approach, independently of the established uncertainty range, but that it fulfills the traditional approach for an uncertainty range of ±2%.
Applying the new FDA recommended approach to the analytic similarity assessment shows that the selection of reference lots has an impact on the estimation of σ R and consequently on the QR, penalizing good test products. Thus, the result of the biosimilarity tests may not be reproducible.
The two main sources of variability associated with the estimate of σ R were analyzed. The contribution of analytic method uncertainty is known and in-control through the analytic method validation. However, the between-lot variability of the reference product requires a higher attention and control by the manufacturer. The presence of a lot with unexpected content may imply rejecting the biosimilarity test. This will be assessed and discussed in a further work.

Author Contributions

Conceptualization, A.O. and M.L.; methodology, validation, and statistical and formal analysis with R-program, A.O. and M.L.; writing—original draft preparation, A.O.; writing—review and editing, A.O. and M.L.

Funding

This research was funded by the Ministerio de Economía y Competitividad of Spain as part of project SAF 2010-17083.

Conflicts of Interest

The authors declare no conflict of interest.

References

  1. FDA. Guidance on Development of Therapeutic Protein Biosimilar: Comparative Analytical assessment and Other Quality-Related Considerations; The United States Food and Drug Administration: Silver Spring, MD, USA, May 2019. [Google Scholar]
  2. The United States Food and Drug Administration. FDA Takes Steps to Foster Greater Efficiency in Biosimilar Development by Reconsidering Draft Guidance on Evaluating Analytical Studies. 2018. Available online: https://www.fda.gov/news-events/fda-brief/fda-takes-steps-foster-greater-efficiency-biosimilar-development-reconsidering-draft-guidance (accessed on 10 July 2019).
  3. FDA. Guidance on Statistical Approaches to Evaluate Analytical Similarity; The United States Food and Drug Administration: Silver Spring, MD, USA, September 2017. [Google Scholar]
  4. FDA. Guidance on Scientific Considerations in Demonstrating Biosimilarity to a Reference Product; The United States Food and Drug Administration: Silver Spring, MD, USA, 2015. [Google Scholar]
  5. Falconer, R.; Jackson-Matthews, D.; Mahler, S. Analytical strategies for assessing comparability of biosimilars. J. Chem. Technol. Biotechnol. 2011, 86, 915–922. [Google Scholar] [CrossRef]
  6. Boulanger, B.; Rozet, E.; Moonen, F.; Rudaz, S.; Hubert, P. A risk-based analysis of the AAPS conference report on quantitative bioanalytical methods validation and implementation. J. Chromatogr. B 2009, 877, 2235–2243. [Google Scholar] [CrossRef] [PubMed]
  7. Eurachem/CITAC Guide, Use of Uncertainty Information in Compliance Assessment. Available online: http://www.eurachem.org/ (accessed on 10 June 2019).
  8. International Conference on Harmonization (ICH) of Technical Requirements for the Registration of Pharmaceutical for Human Use Guideline. Validation of Analytical Procedures: Text and methodology (ICH-Q2-R1). Available online: http://www.ich.org/ (accessed on 1 June 2019).
  9. Markenson, J.; Alvarez, D.F.; Jacobs, I.; Kirchhoff, C. A practical guide about biosimilar data for health care provides treating inflammatory diseases. Biologics 2017, 11, 13–21. [Google Scholar] [PubMed]
  10. Vandekerckhove, K.; Seidi, A.; Gutka, H.; Kumar, M.; Gratzl, G.; Keire, D.; Coffey, T.; Kuehne, H. Rational selection, critically assessment, and tiering of quality attributes and test methods for analytical similarity evaluation of biosimilars. AAPS J. 2018, 20, 1–9. [Google Scholar] [CrossRef] [PubMed]
  11. Hong, P.; Koza, J.; Bouvier, E.S.P. A review size-exclusion chromatography for the analysis of protein biotherapeutics and their aggregates. J. Liq. Chromat. Rel. Technol. 2012, 35, 2923–2950. [Google Scholar] [CrossRef] [PubMed]
  12. Oliva, A.; Llabrés, M.; Fariña, J.B. Fitting bevacizumab aggregation kinetic data with the Finke-Watzky two-step model: Effect of thermal and mechanical stress. Eur. J. Pharm. Sci. 2015, 77, 170–179. [Google Scholar] [CrossRef] [PubMed]
  13. R Core Team. R: A Language and Environment for Statistical Computing; R Foundation for Statistical Computing: Vienna, Austria, 2018; Available online: https://www.R-project.org/ (accessed on 1 June 2019).
  14. Silva, M.; Ferreira, M.; Braga, J.; Sena, M. Development and analytical validation of a multivariate calibration method for determination of amoxicillin in suspension formulations by near infrared spectroscopy. Talanta 2012, 89, 342–351. [Google Scholar] [CrossRef] [PubMed]
  15. Maroto, A.; Boqué, R.; Riu, J.; Rius, F. Estimation of measurement uncertainty by using regression techniques and spiked samples. Anal. Chim. Acta 2001, 446, 131–143. [Google Scholar] [CrossRef]
  16. Salah, S.; Chow, S.; Song, F. On the evaluation of reliability, repeatability, and reproducibility of instrumental evaluation methods and measurement systems. J. Biopharm. Stat. 2017, 27, 331–337. [Google Scholar] [CrossRef] [PubMed]
  17. Montgomery, D. Introduction to Statistical Quality Control, 6th ed.; Wiley: New York, NY, USA, 2008. [Google Scholar]
  18. De Vargas, V.; Dias Lopes, L.F.; Mendonca Souza, A. Comparative study of the performance of the CuSum and EWMA control charts. Comput. Ind. Eng. 2004, 46, 707–724. [Google Scholar] [CrossRef]
  19. Hubert, P.; Nguyen-Huu, J.; Boulanger, B.; Chapuzet, E.; Chiap, P.; Cohen, N.; Compagnon, P.; Dewé, W.; Feinberg, M.; Lallier, M.; et al. Harmonization of strategies for the validation of quantitative analytical procedures. A SFSTP Proposal-Part I. J. Pharm. Biomed. Anal. 2004, 36, 579–586. [Google Scholar] [PubMed]
  20. Barnett, K.; Harrington, B.; Graul, T. Validation of liquid chromatographic methods. In Liquid Chromatography; Fanali, S., Haddad, P., Poole, C., Eds.; Elsevier: New York, NY, USA, 2013; pp. 57–73. [Google Scholar]
  21. Mee, R. β-Expectation and β-content tolerance limits for balanced one-way ANOVA random model. Technometrics 1984, 26, 251–254. [Google Scholar] [CrossRef]
  22. Hoffman, D.; Kringle, R. A total error approach for the validation of quantitative analytical methods. Pharm. Res. 2007, 24, 1157–1164. [Google Scholar] [CrossRef] [PubMed]
  23. Directive 75/318/ECC, Specifications and Control Tests on the Finished Product. Available online: http://www.ema.europa.es/ (accessed on 30 April 2019).
  24. Wang, T.; Chow, S. On the establishment of equivalence acceptance criterion in analytical similarity assessment. J. Biopharm. Stat. 2017, 27, 206–212. [Google Scholar] [CrossRef] [PubMed]
  25. Chow, S.H.; Song, F. Analytical similarity assessment. WIREs Comput. Stat. 2017, 9, 1–9. [Google Scholar] [CrossRef]
  26. Lee, J.; Kang, A.K.; Bae, J.S.; Kim, K.D.; Lee, K.H.; Lim, K.L.; Choo, M.J.; Chang, S.J. Evaluating of analytical similarity between trastuzumab biosimilar CT-P6 and reference product using statistical analyses. mABS 2018, 10, 547–571. [Google Scholar] [CrossRef] [PubMed]
  27. Burdick, R.; Coffey, T.; Gutka, H.; Gratzi, G.; Conlon, H.D.; Huang, C.-T.; Boyne, M.; Kuehne, H. Statistical approaches to assess biosimilarity from analytical data. AAPS J. 2017, 19, 4–14. [Google Scholar] [CrossRef] [PubMed]
Figure 1. The regression line “peak area vs. concentration” obtained by pooling data from different days (left). The plot of the peak area/concentration ratio vs. concentration shows the variability of the slopes between points (right).
Separations 06 00043 g001
Figure 2. The contour plot of the monomer content obtained in the evaluation of robustness. The intersection of two variables (pH and Flow) allows for the defining of the space design (the underlined area).
Separations 06 00043 g002
Figure 3. The EWMA control chart with the parameters λ = 0.4 and L = 3.054. Under these conditions, the sample #22 was outside the control limits, whereas the number of points beyond the limits was three for λ = 0.2. The causes were attributable to a column change. UCL and LCL are the upper and lower control limits.
Separations 06 00043 g003
Figure 4. The CuSum control chart shows two altered zones. The first shows an upward tendency (C+) related to a column change, and the second shows a downward tendency (C−), due to the introduction of a new bevacizumab lot. UDB and LDB are the upper and lower control limits.
Separations 06 00043 g004
Figure 5. Results of the QR approach for different scenarios using (A) Bevacizumab and (B) Neupogen data. The similarity is demonstrated when the µT individual values are within the QR of the reference product.
Separations 06 00043 g005aSeparations 06 00043 g005b
Table 1. The ANOVA results obtained using Equation (1). The null hypothesis of no differences between intercepts and slopes was accepted for all situations.
ParameterEstimatet-ValueP(>׀t׀)
β0−3.862−0.9740.343
β16.34932.4<2 × 10⁻¹⁶
α0,1−1.108−0.1970.846
α0,2−0.601−0.1070.916
α0,31.8840.3360.741
α0,44.3840.7820.445
α0,51.3140.2340.817
α1,10.1610.5810.568
α1,20.3361.210.241
α1,30.1280.4610.65
α1,4−0.052−0.1860.854
α1,50.2690.9730.344
Table 2. Values of the mean and standard deviation for the reference product obtained by the simulation data set under different scenarios.
Scenario μ ^ R σ ^ R σ B L σ W L
#199.460.860.3810.590
#299.262.100.3682.069
#3100.141.151.0750.403
#4100.482.334.3510.819

