1. Introduction
Remarkable progress has been achieved in exploring ambient ionization techniques for mass spectrometry (MS) in the past two decades [
1,
2,
3,
4,
5,
6,
7]. The simplicity and minimization of sample preparation are unique features of these developed techniques [
6,
7]. Reducing/minimizing sample preparation steps can significantly reduce analysis time, but ion suppression effects [
8,
9] caused by nontarget ions in complex samples may obscure the target ion peaks with low concentrations and poor ionization efficiency. Conventionally, liquid separation techniques can be coupled online with MS using atmospheric pressure ionization (API) methods [
10], including electrospray ionization (ESI) and atmospheric pressure chemical ionization as the interface. Owing to a similar flow rate to API, capillary-based separation techniques such as capillary electrophoresis (CE) [
11,
12,
13] and capillary electrochromatography (CEC) [
14] have been coupled with MS without considerable compromise. A wall coating or stationary packing capillary is used as a channel for conducting CEC [
14]. Moreover, the preconcentration of analytes in the capillary has been extensively studied by using different sample stacking approaches for CE analysis [
15,
16,
17,
18,
19]. Conventional API techniques, such as ESI, have been used as the ionization method to couple online with these capillary-based techniques with MS [
20,
21,
22,
23,
24]. In some of these approaches, liquid and gas sheaths are required to couple CE with ESI-MS [
20,
21,
22]. When coupling most of the recently developed ambient ionization methods with liquid separation techniques, such as CE, direct coupling may not be feasible. Nevertheless, few reports have demonstrated the feasibility of coupling CE with ambient ionization MS [
25,
26,
27]. In addition, if online preconcentration, such as sample stacking in CE, can be carried out for low-concentration analytes followed by online detection of MS, then the sample pretreatment and analysis time can be substantially reduced.
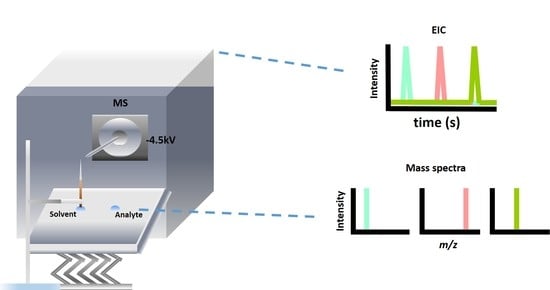
An ionization method called contactless atmospheric pressure ionization (C-API) [
28,
29,
30,
31] is a continuous flow ion source, which uses a tapered capillary as the sampling tube and the ionization emitter. Owing to capillary action, sample solution can be continuously directed from the capillary inlet immersed in a microliter-sized droplet to the tapered end that is placed close to (~0.5 mm) the inlet of the mass spectrometer applied with a high voltage (e.g., ±4.5 kV) [
28,
29,
30,
31]. Fine charged droplets eluted from the capillary outlet readily form gas-phased ions [
28,
29,
30,
31]. Although no direct electric contact is made on the capillary outlet, the electric field provided by the inlet of the mass spectrometer is sufficient to induce the charge accumulation of the eluent on the capillary outlet to generate electrospray. Moreover, capillary action ensures continuous flow of the sample solution to the capillary outlet and facilitates the stabilization of ion signals.
Given that a short and tapered capillary is used as the sampling tube and the ionization emitter in C-API, the combination of the capillary-based separation/preconcentration techniques with C-API is possible. A short and tapered capillary can be used as an interface to couple capillary-based separation/preconcentration system with C-API-MS without requiring any additional accessories. Without applying any additional electric contact on the capillary, the electric field provided by the inlet of the mass spectrometer was expected to be sufficient for direct separation/preconcentration to occur in the capillary. We herein demonstrate the feasibility of using a short and tapered capillary as the interface to couple CE/CEC and sample stacking in CE online with C-API-MS without requiring any additional interfacing components.
2. Experimental
2.1. Preparation of Tapered Capillaries
The capillary was placed vertically using a metal stand, whereas its lower end was clamped by an object with a weight of 50 g. The capillary was heated at its lower end using a butane torch to draw a narrow tip. The tapered capillary with a given length was cut using a ceramic cutter. The tapered end of the resultant capillary was dipped into aqueous HF (24%,
v/
v) for 20 min, followed by rinse with deionized water. HF is a hazardous acid and should be handled with care.
Figure S1 shows the resultant tapered capillary. The as-prepared capillary was thoroughly dried in an oven to remove water prior to experiments. The tapered end of these capillaries was fragile and should be handled with care.
2.2. Capillary-Based On-Line Concentration Combined with C-API-MS Analysis
When conducting online concentration of analytes, the capillary (ID: 50 μm; OD: 365 μm) was flushed with aqueous sodium hydroxide (1 N) for 1 h, deionized water again for 1 h, and the solvent containing acetonitrile and deionized water (3:2, v/v) for another 1 h. The capillary was tapered based on the procedures described above. The tapered capillary was cut according to the required length used for the stacking experiments. Ammonium bicarbonate and ammonium acetate buffers (10 mM), which were used as leading and terminating buffers for in-capillary preconcentration experiments, were initially prepared in deionized water followed by 10-fold dilution with acetonitrile/deionized water (2:1, v/v). The tapered capillary (~6.8 cm) was then placed in front of the inlet of the mass spectrometer with a distance of ~0.5 mm and filled with ammonium bicarbonate buffer at pH 11, which had been 10-fold diluted by acetonitrile/deionized water (2:1, v/v), by immersing the capillary inlet to a droplet (10 μL) containing the buffer for 2 min based on capillary action. Subsequently, the capillary inlet was immersed into a sample droplet (10 μL) for 3 min followed by immersing in a droplet containing ammonium acetate buffer (1 mM, pH 5), which had been 10-fold diluted by acetonitrile/deionized water (2:1, v/v), by moving the metal plate to the sample or buffer droplet. Model samples including lysine and histidine were prepared in deionized water initially. Prior to analysis, the model samples were then 10-fold diluted by the solvent containing acetonitrile and deionized water (3:2, v/v). After the analytes appeared in the electropherogram and completed the analysis, the capillary was flushed by immersing its inlet in the solvent containing acetonitrile and deionized water (3:2, v/v) for 30 min to ensure all the residues were removed. The sample, buffer, and running solvent were introduced to the capillary based on capillary action.
2.3. Quantitative Analysis of Histidine in Aqueous Samples
We prepared a model sample containing histidine (50 µM) spiked with creatinine (1 mM) as the internal standard in deionized water. The standard addition method was used to determine the concentration of histidine in the sample. The as-prepared sample was 100-fold diluted prior to analysis. Histidine standards with different concentrations (0.28, 0.43, 0.65, 0.97, 1.45, 2.18, and 3.27 µM) were spiked to the 100-fold-diluted sample prior to online preconcentration followed by C-API-MS analysis using a short capillary (length: ~6.8 cm) as the interface. Three replicates were conducted. The calibration curve was plotted by plotting the ratio of the intensity of the peak derived from histidine to that of the peak derived from creatinine versus the concentration of spiked histidine. The intercept cross the X axis was obtained. The experimental concentration of histidine in the sample was estimated by multiplying 100 by the intercept of the X axis.
2.4. Setup of C-API-Based Separation and MS Analysis
A tapered capillary coated with trichloro(octadecyl)silane (C
18) with a given length was placed vertically in front of the orifice of the mass spectrometer. The details of the wall coating of the capillary are described in
Supporting Information. The voltage applied on the inlet of the mass spectrometer was −4.5 kV. An aluminum metal plate (10 cm × 10 cm) used for the deposition of samples and running solvents was placed on a screw-driven adjustable stand in front of the mass spectrometer. The tapered capillary was placed orthogonally to the metal plate and its inlet was immersed in the running solvent deposited on the metal plate by adjusting the screw-driven stand. The solvent through the capillary from the capillary inlet in the solvent droplet could reach the outlet of the capillary owing to capillary action. The capillary was conditioned by the running solvent that was used for separation for 30 min prior to injection of the sample. When injecting samples, the metal plate was moved to the droplet containing the sample (~10 μL) for a given time (e.g., 2 s) to introduce the sample into the capillary inlet. The metal plate was then moved back to the droplet containing the running solvent. Mass spectra were acquired by the mass spectrometer during the infusion of samples and solvents.
2.5. Separation of Small Organics in a C18-Wall Coated Capillary On-Line Combined with C-API MS
Five organics including arginine, atrazine, ametryn, prometryn, and adenosine were selected as model samples for conducting separation in a C18-wall coated capillary (length: ~3.5 cm). Running solvents were prepared by mixing acetonitrile and water with different ratios. The mixtures of analytes were prepared by mixing an equal concentration (50 μM, 20 μL) of analytes. Prior to introduction to the capillary, the analytes were 10-fold diluted by acetonitrile/deionized water (1:4, v/v). The final concentration of each analyte in the mixture was 1 μM. The capillary was filled with the running solvent, initially followed by immersing the capillary inlet in a sample droplet (10 μL) for 2 s and then a droplet containing the running solvent. The mass spectrometer was switched on to acquire the mass spectra when introducing the sample and running solvent to the capillary.
3. Results and Discussion
When stacking a large volume of analytes with a low concentration in a capillary, a certain electrical field is applied to the two ends of the capillary and a sample zone containing trace analytes in the capillary can be concentrated between leading and terminating buffer zones with high and low ion motilities, respectively [
14,
15,
16,
17]. In general, a long capillary is required to fill a sufficiently long sample zone in the capillary for stacking target analytes into a narrow window for detection. Nevertheless, we demonstrated that a short capillary (few cm) can be used to concentrate trace analytes in a short capillary followed by online detection by C-API-MS.
Figure 1 shows the typical setup of our approach. A short and tapered capillary held by a pair of tweezers was placed vertically in front (~0.5 mm) of the mass spectrometer. The inlet of the mass spectrometer was applied with a voltage of −4.5 kV when the positive ion mode was conducted. No direct electric contact was made on the C-API capillary. Liquid droplets (5–10 μL) containing samples and solvents were placed on the aluminum plate (10 cm × 10 cm). The short capillary was filled with the solvent by immersing its inlet into the solvent droplet. When introducing the sample, the metal plate was moved to the sample droplet, in which the sample can be continuously introduced into the capillary based on capillary action.
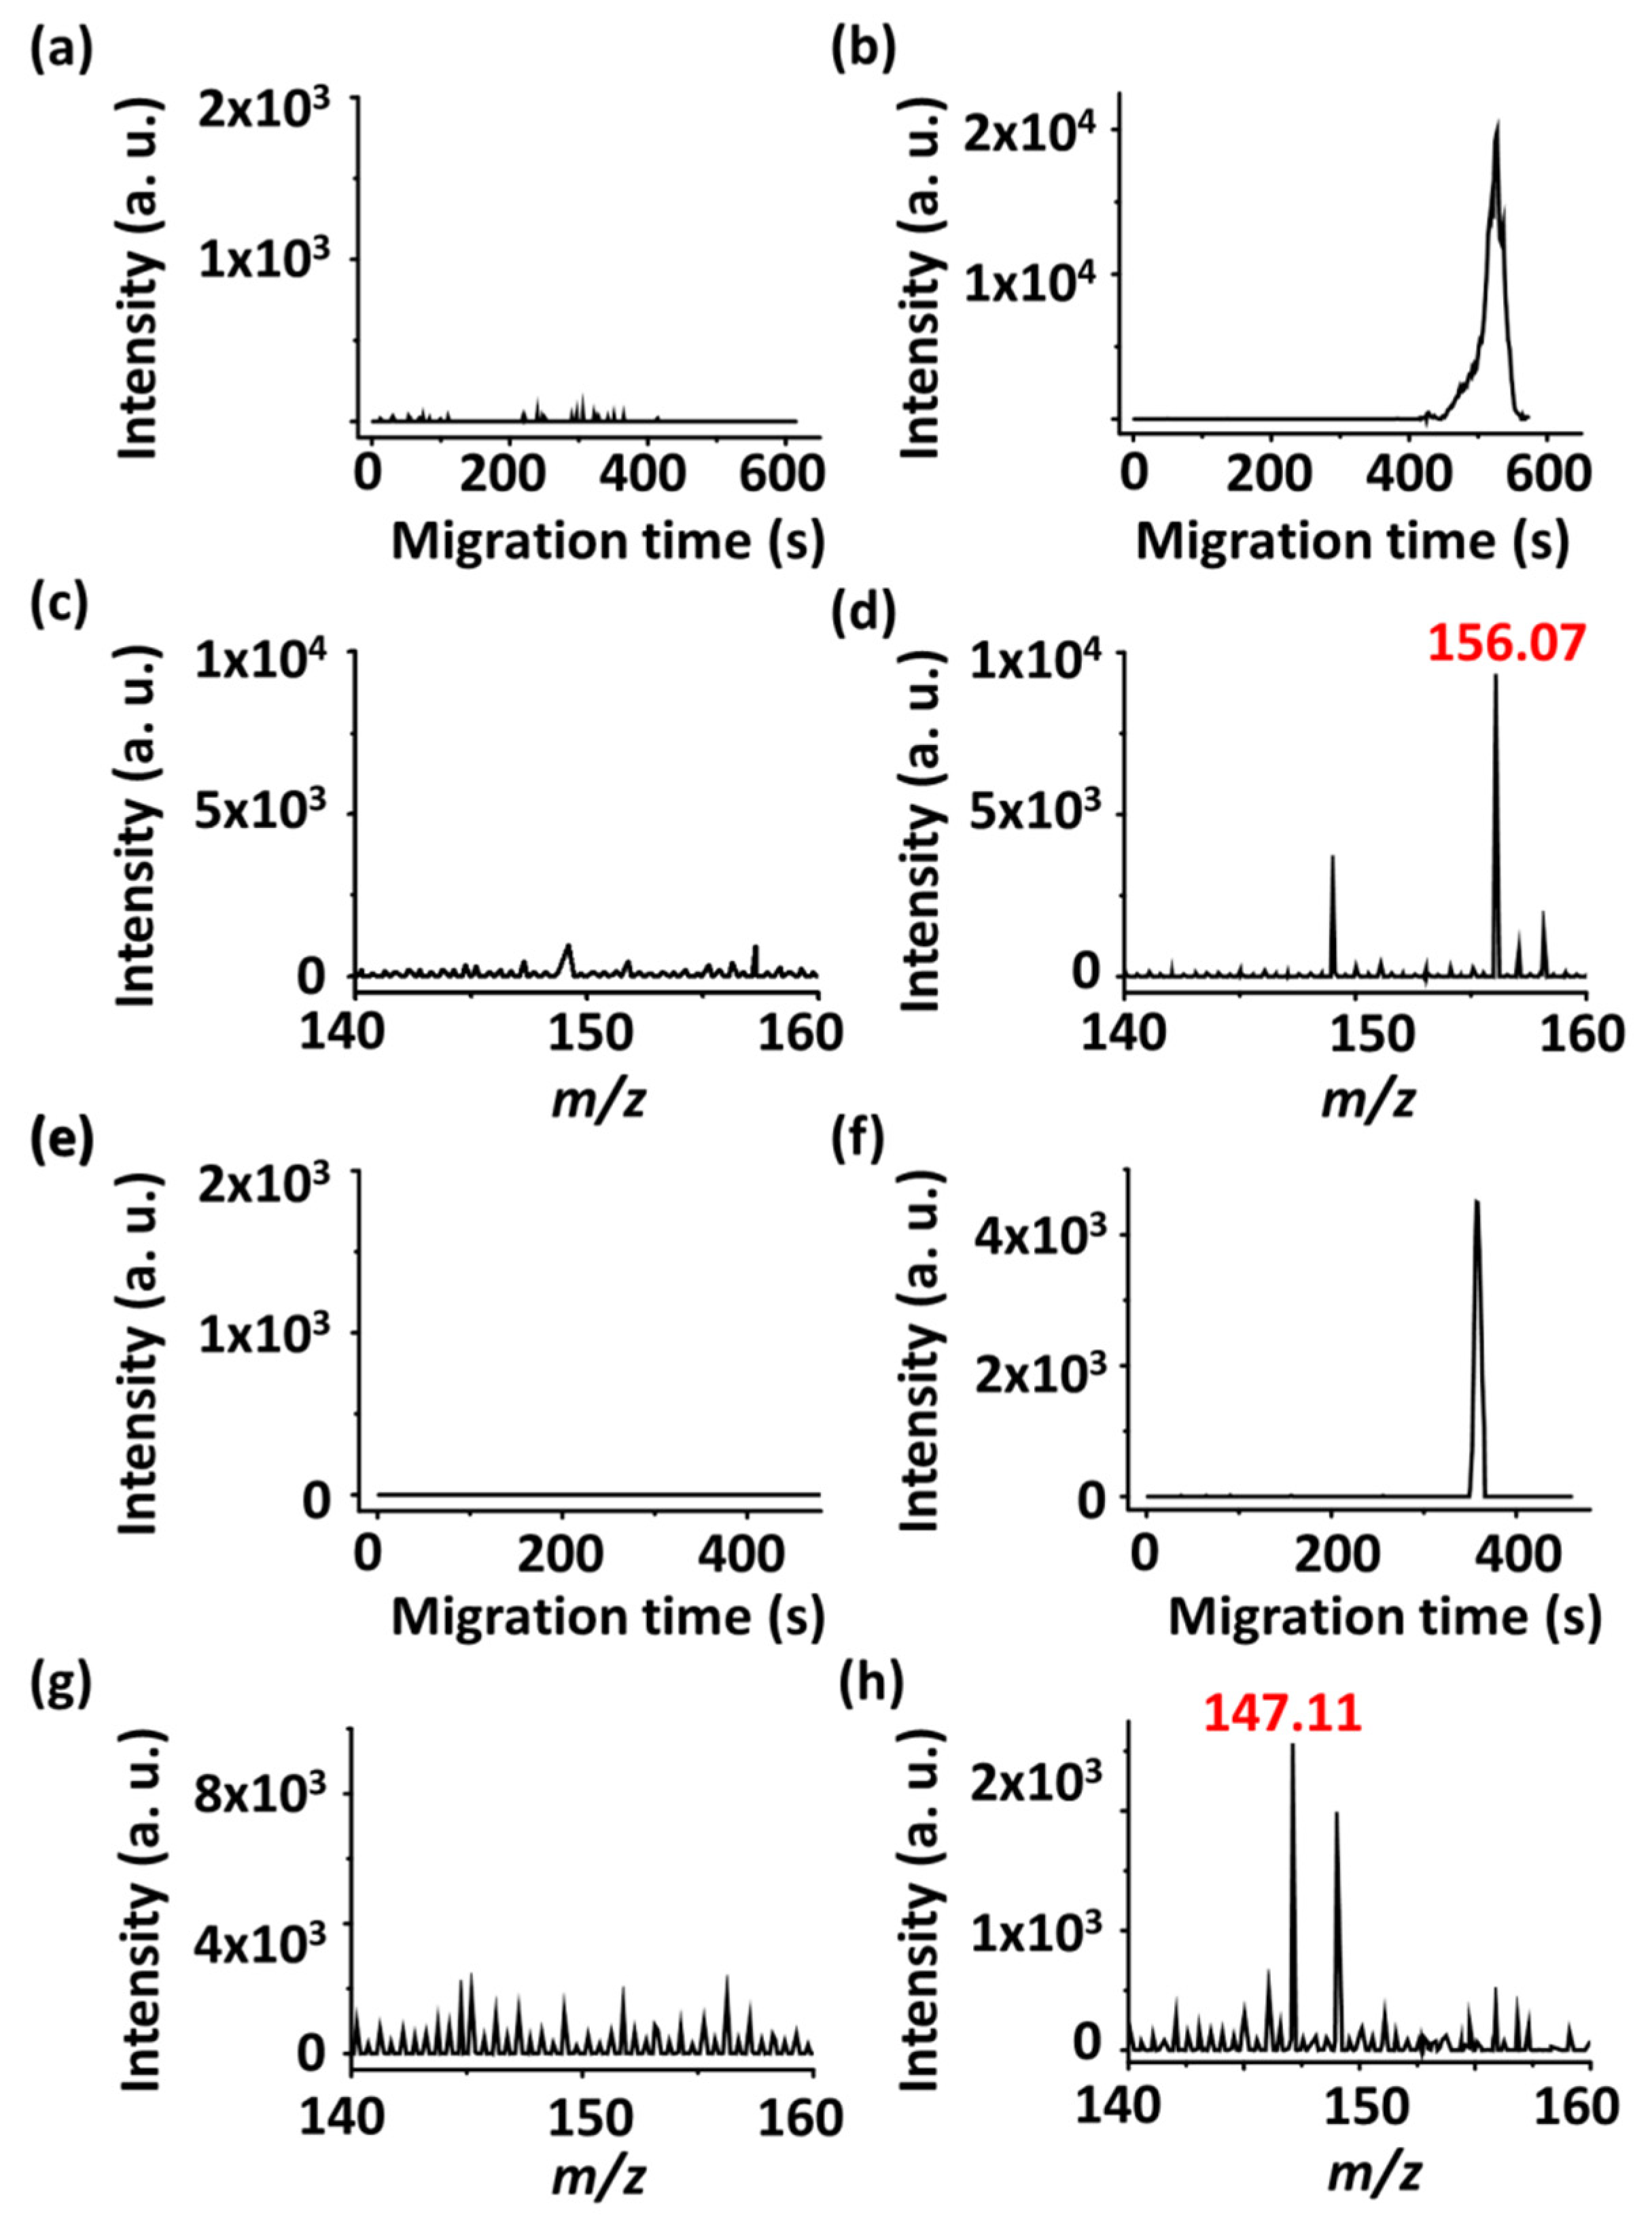
We initially used histidine (5 nM, MH
+ = 156.07) as the model sample to demonstrate the feasibility of using the current setup to preconcentrate and detect the sample online using C-PAI-MS. Histidine was prepared in deionized water initially. Prior to analysis, the model samples were 10-fold diluted by the solvent containing acetonitrile and deionized water (2:1,
v/
v). Leading (pH 11) and terminating buffers (pH 5) were used to stack the model sample in the capillary. Ammonium bicarbonate and ammonium acetate buffers used as leading and terminating buffers, respectively, were initially prepared in deionized water followed by 10-fold dilution with the solvent containing acetonitrile/deionized water (2:1,
v/
v). When conducting the in-capillary preconcentration experiment, the mass spectrometer was switched on in the beginning when the leading buffer was introduced to the capillary. Specifically, a tapered capillary (length: ~6.8 cm; tip diameter: ~14 μm) was filled with ammonium bicarbonate buffer (1 mM, pH 11) for 2 min. The sample solution was introduced for 3 min based on capillary action by immersing the capillary inlet to the sample droplet. The capillary was moved to the droplet containing ammonium acetate buffer (1 mM, pH 5), and the buffer was continuously infused into the capillary based on capillary action.
Figure 2a,b show the extracted ion chromatograms (EICs) at
m/
z 156.07 obtained before and after in-capillary preconcentration, respectively.
Figure 2c,d show the corresponding mass spectra. The peak resulting from protonated histidine was only observed after sample stacking (
Figure 2b,d). The peak at
m/
z 149.02 was derived from the solvent background. In addition, lysine was further used as the model sample to demonstrate the feasibility of using the current approach for online preconcentration and detection by C-API-MS.
Figure 2e,f show the EICs at
m/
z 147.11 obtained before and after online preconcentration by pH junction stacking, respectively.
Figure 2g,h show the corresponding mass spectra. Similar to the results obtained when histidine was used as the model sample, the peak resulting from protonated lysine only appeared after preconcentration. These results indicate that conducting online preconcentration and detection of amino acids using a short capillary as the preconcentration tube and ionization emitter is possible for C-API-MS analysis.
Amino acids, such as histidine, can be found in urine with a concentration range of 17–90 μM [
32]. To further demonstrate the feasibility of using our approach for the analysis of endogenous histidine, we prepared a simulated sample by spiking histidine (50 µM) and creatinine (1 mM) in deionized water. The standard addition method was used to determine the concentration of histidine in the sample. The mixture as mentioned above was 100-fold diluted prior to analysis. Different concentrations of histidine standards (0.28, 0.43, 0.65, 0.97, 1.45, 2.18, and 3.27 µM) were spiked to the 100-fold-diluted sample prior to online preconcentration followed by C-API-MS analysis using a short capillary (length: ~6.8 cm) as the interface. The experimental steps were the same as those used to obtain
Figure 2.
Figure 3 shows the resultant mass spectra of the samples. The peaks appearing at
m/
z 114.07 (red dot), 136.04 (blue dot), and 152.02 (green dots) were derived from protonated creatinine, sodium, and potassium adducts of creatinine, respectively. The peak at
m/
z 156.07 (yellow dot), corresponding to protonated histidine, was observed in the mass spectrum before addition of additional histidine (
Figure 3a). Moreover, the ion intensity of the protonated histidine increased with increasing concentration of the spiked histidine (yellow dots,
Figure 3b–h).
Figure 3i shows the resultant calibration curve by plotting the ion intensity of the protonated histidine to the sum of the ion intensity derived from creatinine versus the concentration of spiked histidine. According to the resultant equation (
y = 0.1597
x + 0.0785,
R2 = 0.9961), the intercept on the
x axis was −0.4915. That is, ~0.4915 μM histidine existed in the 100-fold-diluted sample according to the results obtained by standard addition. The concentration of histidine in the sample was ~49 μM, which was ~2% off from the true concentration of histidine in the prepared sample. These results suggest the feasibility of using the current approach for quantitative analysis.
In addition, we coated the wall of the C-API capillary with C
18 [
33] to conduct CEC online with C-API-MS analysis. The details of the C
18 modification and fabrication of the capillary are described in the
Supporting Information. The C
18-modified capillary (~3.5 cm) was used as the separation column and ionization emitter in combining CEC and C-API-MS. We applied −4.50 kV on the inlet of the mass spectrometer. The solvents consisting of acetonitrile and deionized water with different ratios were used as the mobile phase. The mixture containing arginine, atrazine, prometryn, ametryn, and adenosine with different hydrophobicity was used as the model sample. The hydrophobicity of these analytes varied, and the order of hydrophobicity from low to high is as follows: arginine (
logKow = −4.79) [
34], adenosine (
logKow = −1.12) [
35], atrazine (
logKow = + 2.60) [
36], ametryn (
logKow = +3.07) [
36], and prometryn (
logKow = + 3.40) [
36].
Kow is the concentration of solute in octanol phase/the concentration in water phase.
Figure 4a–d present the resultant EICs at
m/
z 175 (arginine, black curve), 216 (atrazine, red curve), 228 (ametryn, blue curve), 242 (prometryn, green curve), and 268 (adenosine, pink curve) derived from the mixture by using acetonitrile and deionized water with different volume ratios of 8/2, 6/4, 3/7, and 2/8, respectively, as the mobile phase. No considerable improvement was observed in the separation between arginine (black curve) and the four other analytes when the mobile phase containing acetonitrile and deionized water with the ratios (
v/
v) of 8/2 (
Figure 4a) and 6/4 (
Figure 4b) were used in the separation. When the acetonitrile-to-deionized water ratio was changed to 3/7, the separation was improved (
Figure 4c). Five peaks resulting from the five model analytes can be separated. When the acetonitrile-to-deionized water ratio was adjusted to 2/8, the separation among analyte peaks was further improved (
Figure 4d). The order of the elution time of these analytes followed the presented order of their hydrophobic properties. Specifically, arginine with a relatively low hydrophobicity was eluted first. Subsequently, adenosine (pink curve), atrazine (red curve), ametryn (blue curve), and prometryn (green curve) were eluted in sequence. The total analysis time for the separation of these five model analytes was 2 min. Furthermore, triazine molecules, namely, atrazine, ametryn, and prometryn, with similar chemical structures can be separated in this short C-API capillary. These results indicate that conducting fast separation in the C-API capillary for analytes with similar chemical structures is feasible using the online C-API-MS approach. The setup is remarkably simple, and the analysis time is relatively short.
We further examined whether the developed hyphenated technique is suitable for quantitative analysis. Ametryn ([M+H]
+ = 228) was selected as the target analyte, and arginine ([M+H]
+ = 175) was used as the internal standard.
Figure 5a illustrates the plot of the ratio of the intensity integrated area of the ion at
m/
z 228 to the ion at
m/
z 175 from their corresponding EICs versus the concentration (0.23–6.00 μM) of ametryn. The ratio increased with the increasing concentration of ametryn. The linear dynamic range was 0.23–1.78 μM (
y = 1.2896
x − 0.049,
R2= 0.9971) (
Figure 5b).
Figure 5c shows the corresponding EICs at
m/
z 228 (ametryn, red curve) and 175 (arginine, blue curve) obtained from the samples containing ametryn within the linear dynamic range (0.23–1.78 μM). These results indicate that the current approach is suitable for conducting quantitative analysis.


