
Analytical Determination of Allergenic Fragrances in Indoor Air
by
 , , ,
, , ,
Catia Balducci
1, 
Marina Cerasa
1,
Pasquale Avino
2,*,
Paolo Ceci
3 ,
,
Alessandro Bacaloni
4 and
Martina Garofalo
1,4 1
Institute of Atmospheric Pollution Research (CNR-IIA), National Research Council of Italy, Via Salaria Km 29.3, Monterotondo, P.O. Box 10, 00015 Rome, Italy
2
Department of Agricultural, Environmental and Food Sciences (DiAAA), University of Molise, Via De Sanctis, 86100 Campobasso, Italy
3
Institute of Atmospheric Pollution Research, Division of Rome, c/o Ministry of Environment, Land and the Sea, Via Cristoforo Colombo 44, 00147 Rome, Italy
4
Department of Chemistry, Sapienza University of Rome, Piazzale Aldo Moro 5, 00185 Rome, Italy
*
Author to whom correspondence should be addressed.
Separations 2022, 9(4), 99; https://0-doi-org.brum.beds.ac.uk/10.3390/separations9040099
Submission received: 16 February 2022
/
Revised: 9 April 2022
/
Accepted: 12 April 2022
/
Published: 13 April 2022
(This article belongs to the Special Issue Development and Application of Green or Sustainable Strategies in Analytical Chemistry)
Abstract
:Among all the emerging contaminants, fragrances are gaining more relevance for their proven allergenic and, in some cases, endocrine-disrupting properties. To date, little information exists on their concentration in the air. This study aims to fill this gap by developing a method for the determination of semivolatile fragrances in the indoor gaseous phase with sampling protocols usually adopted for the collection of atmospheric particulate matter (sampling time 24 h, flow rate 10 L min−1) and instrumental analysis by gas chromatography coupled with mass spectrometry. The method was developed on 66 analytes and tested at three concentration levels: 20 compounds showed analytical recoveries ≥72% with percentage standard deviations always better than 20%. For most compounds, negligible sampling breakthroughs were observed. The method was then applied to real samples collected in a coffee bar and in a private house. Considering the fragrances for which the method has shown good effectiveness, the highest concentrations were observed for carvone in the coffee bar (349 ng m−3) and camphor in the house (157 ng m−3). As concerns certain or suspected endocrine disruptors, lilyal and galaxolide were detected at both sites, α-isomethylionone was the second most concentrated compound in the house (63.2 ng m−3), musk xylene and musk ketone were present at lower concentration (≈ 1 or 2 ng m−3).
1. Introduction
In recent years, interest in indoor air quality has been increasing considerably [1,2]. It is ascertained that in the developed countries, people (and, in particular, sensitive subjects such as children and the elderly) spend up to 90% of their time indoors [3,4] where generally inadequate ventilation, high temperatures, humidity, together with slow degradation processes can increase the concentration of pollutants compared to outdoor ones [5]. As a result, inhalation exposure peaks indoors due to residence times and higher concentrations of contaminants [6]. Among all pollutant classes, fragrances have been identified as one of the main causes of indoor pollution [7,8]. Recent studies report that more than 2600 fragrances are contained in everyday products and especially in the most developed countries, the demand and consumption of perfumed products such as incense or candles, personal care, or cleaning products have increased. In the last period, toxicological and clinical studies on the effects of this class have increased together with their diffusion, but for many substances, there is little information on the ability to interact with biological tissues (bioactivity), and on their behavior once dispersed in the environment [9,10,11,12,13]. The main health effects related to fragrances are linked to their allergenic properties [12], to which dermatological effects (e.g., irritation, dermatitis, eczema, psoriasis) and respiratory problems are also added [7,8]. Above all, some fragrances are recognized as endocrine disruptors [14,15], among which lylial, α-isomethylionone, benzyl salicylate, and nitro-musks are listed.
Despite all the evidence reported, there are a few studies on fragrances in the air, especially as regards indoor environments where their concentrations are presumably higher [16]. Of all fragrances, light terpenes, such as limonene and pinenes, are the most investigated due to their allergenic properties or to the ability to react with ozone to generate secondary particles [4,17,18].
Less information exists on higher molecular weight fragrances in the indoor gas phase. As there are no pre-established protocols for the analysis of these substances, among the few studies carried out, the procedures adopted are different. Furthermore, there are no studies that evaluate the volatility and degradation of these substances or that consider their distribution between the gas and the particulate phase. Lamas et al. [19,20] reported two studies on higher molecular weight fragrances in the indoor gas phase by adopting two different analytical procedures obtaining satisfactory results. Both involved sample collection by active sampling, followed by glass funnel microfiltration and ultrasound-assisted extraction in one case, and solid-phase microextraction in the other. The latter procedure was also used by Regueiro et al. [21] for the analysis of nine synthetic musks. Ramirez et al. measured musks by using Tenax cartridges and thermal desorption in GC-MS (gas chromatography coupled with mass spectrometry) [22]. Balci et al. [23], evaluated the ability of synthetic musks to diffuse indoors, through an experiment in controlled conditions, by using Amberlite XAD-2 resin sandwiched between polyurethane foam followed by extraction with an ultrasonic bath. Also, concerning the indoor concentrations of fragrances in the particulate phase, so far little information is available [24,25].
This study aimed to provide information in this field through the development of a method for assessing the indoor concentration of semivolatile fragrances at sampling conditions applied for the capture of atmospheric particulate matter (PM) in interiors. At this stage, the results concerning fragrances in the gaseous phase are reported. These results are preparatory to subsequent studies in which the investigation will be extended to the simultaneous collection of fragrances and other classes in both aerial and particulate phases. The feasibility of the method has been assessed for 66 fragrances, although the focus was not on the lighter ones such as limonene, for which extensive studies already exist. After verifying the efficiency of the method, it was applied to real samples collected in indoor environments, in which a semi-quantitative or quantitative determination of the compounds was carried out, depending on the goodness of accuracy and precision of the method itself.
2. Materials and Methods
2.1. Materials
All standards, marketed by Supelco, Sigma-Aldrich, Merck, Germany, were of purity grade ≥98%. Concerning fragrances, they were Fragrance allergen mix A1 (24 components, product no. 89131), Fragrance allergen mix A2 (40 components, no. 16558), Musk ketone solution (no. 46377), and Musk xylene solution (no. 46383). All tests for the development of the analytical method in the laboratory were performed using a solution of all the standards previously mentioned (Fragrance Standard solution = FS solution). The deuterated Internal Standards (IS solution at 5 ng µL−1) used as references for quantitative analysis were naphthalene-d8 (catalog product no. 176044), diethyl phthalate-d4 (no. 492221), and benzo[a]anthracene-d12 (no. 456306). To assess the recovery of the IS solution, a mixed solution of 2-metylnaphtalene-d10 (Product no. 454249) and Pyrene-d10 (no. 490695) was used (Syringe Standard solution = SS solution at 10 ng µL−1). The adsorbent used for air sampling was Supelco Amberlite XAD-2 (20–60 mesh) (Restek, Bellafonte, PA, USA). The solvents were of super purity grade (produced by Romyl Ltd., Cambridge, UK) and were purchased from Deltek srl (Naples, Italy).
2.2. Gas Chromatography–Mass Spectrometry
The GC–MS analyses were performed using a Trace 1300 GC Ultra coupled with the mass spectrometer ISQ 7000 Series (ThermoFisher Scientific, Rodano, Italy). The temperatures of the transfer line and ion source were set at 280 and 250 °C, respectively. Separation was carried out on Rxi-5Sil MS (Restek, Bellafonte, PA, USA) capillary column (30 m × 0.25 mm i.d., 0.25 μm film thickness). Helium was the carrier gas, employed at a constant column flow of 1.0 mL min−1 while the injection was performed in splitless mode at 280 °C. The GC oven temperature was programmed from 55 °C (held 1.30 min.) to 90 °C (at 40 °C min−1, held 3 min), to 260 °C at 5 °C min−1. A final ramp to 300 °C at 20 °C min−1 (held 5 min) was set to ensure the elution of all solutes from the column.
A full scan acquisition, in the m/z range 40–320, was used for compound identification through the mass spectrum observation. Four minutes of solvent delay were applied to the acquisition to prevent filament damage. Three ions for each compound were chosen to define the selected ion monitoring acquisition. One ion was chosen for the quantitative determination, the other two were used to confirm the correct determination. For a number of selected compounds, the internal standards and syringe standards, the retention times together with quantification and confirm ions are listed in Table 1. Tables S1 and S2 report these parameters for all the analytes. Each chromatogram was processed using the Thermo Scientific™ Xcalibur™ software.
Given the high number of target compounds, two different SIMs were used (SIM_A and SIM-B), to minimize the effects of interference between nearby peaks. The first SIM was dedicated to the most polar compounds, less suitable for the type of stationary phase used for chromatographic separation and to the particularly volatile ones. These substances generally showed less affinity with the method developed and greater variability in results.
The MS detector response curves were drawn by plotting the peak area ratios between the fragrances and the respective deuterated internal standard. Five concentration levels of target fragrances ranging from 0.02 to 1.6 ng µL−1 were processed with three replicates, while the concentration of the internal standards was kept constant at 0.2 ng µL−1.
The instrumental limit-of-detection (LODinst) was set equal to the analyte concentration corresponding to three times the signal-to-noise ratio (S/N). The instrumental LOD was determined by evaluating the S/N for the analytes starting from the lowest point of the calibration curve (0.02 ng µL−1) and proceeding by dilutions. The instrumental limit of quantification (LOQ) was set equal to analyte concentration corresponding to 10 times the signal-to-noise ratio.
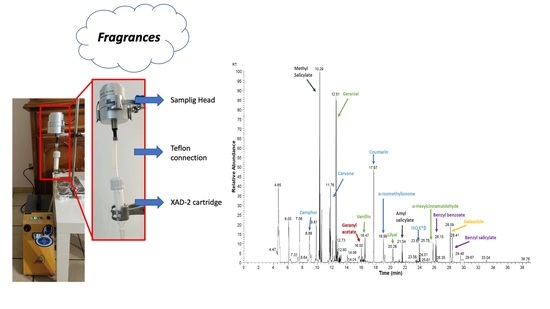
2.3. Sampling System and Analytical Procedure
The sampling was performed with a low-flow air sampler (Silent Sequential Air Sampler FAI Instruments, Palombara, Italy) using a constant airflow rate of 10 L min−1 with a sampling cycle set at 24 h, for a total volume of about 14.4 m3.
To collect the molecules present in the gaseous phase, 3 g of XAD-2 contained in a 2 cm diameter glass cartridge was used.
The target compounds collected on the adsorbent cartridge were extracted by solvent elution. This extraction technique allowed the minimization of handling and processing of the samples, improving the quality of the blanks and reducing the risk of analyte losses. The samples were eluted with 30 mL of acetone after adding the IS solution used for quantitative analysis (100 ng). The eluate was then reduced to 500 μL (in a graduated tube) under a gentle stream of nitrogen. Finally, 1 μL of the sample was injected into the GC-MS after spiking with 100 ng of the SS solution.
2.4. Indoor Sampling
Real samplings were carried out to test the method in two indoor environments in Rome (Italy), namely, a private house and a coffee bar. The house was a flat of 65 m2 on the third floor of a building. Two people lived there. The sampler was placed in the corridor where the air was influenced by the activities carried out in all the rooms. The coffee bar had an area of about 70 m2. The place was quite frequented and inside there were four tables occupied most of the time. Samplings started at 9:00 a.m. and lasted 24 h. They were carried out in September 2021 with an average temperature of about 23 °C. The windows in the house and the doors in the coffee bar were open ensuring good ventilation in the sampling locations. In addition, during the hottest hours of the day, an air conditioning system worked in the coffee bar.
3. Results and Discussion
3.1. Method Setting and Effectiveness
The setting of the method involved several phases: the optimization of the instrumental method and the choice of the best adsorbent for the collection of fragrances in the gaseous phase. This is both in terms of adaptability to the operating conditions required by the method adopted and in terms of capture efficiency evaluated through the breakthrough phenomenon, the optimization, and validation of the analytical procedure for the analyte determination.
All the tests for the method development and the method validation were carried out in triplicate.
3.1.1. GC Analysis
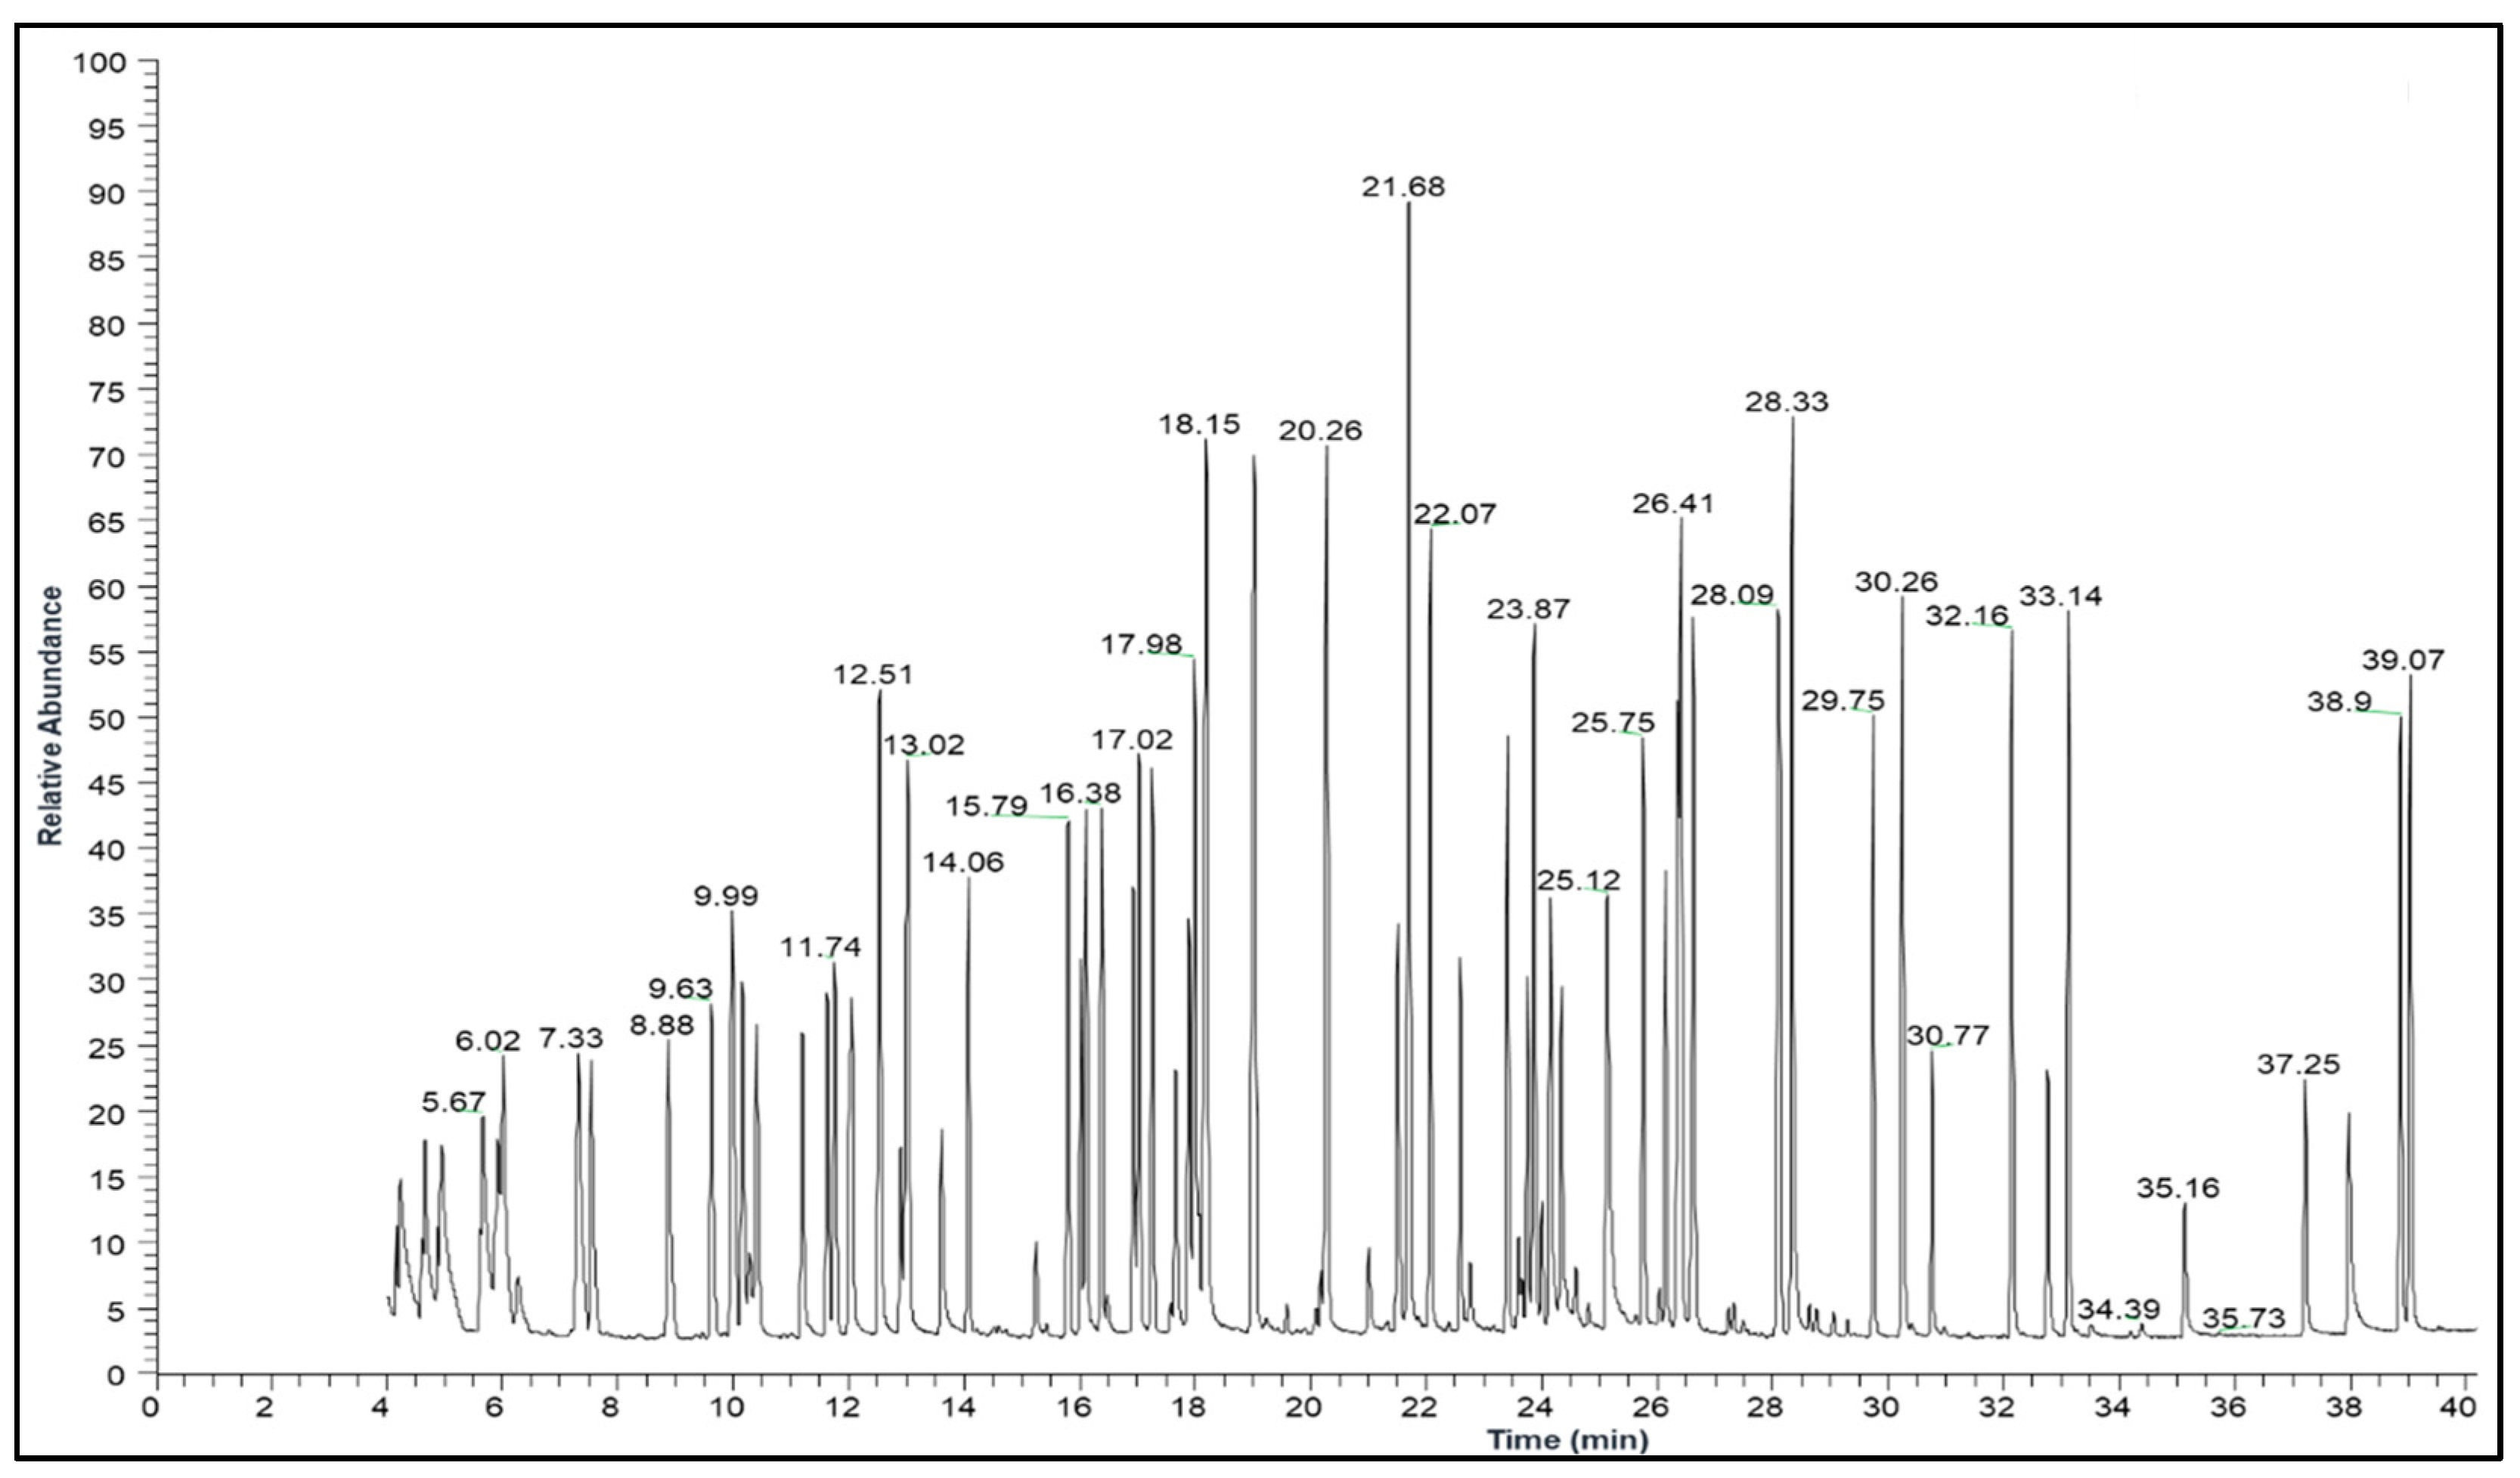
The full-scan chromatogram of the target substances is shown in Figure 1. Injector and column temperature settings were optimized for compounds with higher volatility, therefore the most volatile substances (retention time 4.2–6.3 min), such as terpenes, showed a low resolution and tailed peaks.
The curve correlation coefficients (R) were in the range 0.9999–0.9943 with the lower associated with eugenol and santalol.
The LODinst values were between 0.001 ng µL−1 and 0.02 ng µL−1. For example, the S/N ratio was equal to 3:1 at a concentration of 0.001 ng µL−1 for eugenyl acetate and benzyl benzoate and equal to 0.02 ng µL−1 for ebanol. Table 2 reports the calibration curves, the respective values of R, and the LODinst for a number of selected fragrances.
3.1.2. Sampling and Extraction Optimization
Three adsorbent materials were tested, Amberlite XAD-2, Amberlite XAD-4, and Florisil. Elution tests showed that XAD-4 was the adsorbent most susceptible to the presence of impurities, even after the cleaning step. Furthermore, it was the most sensitive to degradation when treated with a polar solvent (acetone). As for the Florisil, it was discarded both for the strong resistance shown to the airflow during sampling and for the inhomogeneity and difficulty in packing the cartridges.
The most satisfactory results in terms of cartridge packing and blanks were obtained with XAD-2, which was chosen as the definitive adsorbent.
During the setup phase of the elution procedure, an attempt was made to perform a selective clean-up of the sample by eluting it with solvents of different polarities. For this purpose, elution tests were performed by spiking a known amount of FS solution on packaged cartridges. In one experiment n-hexane and acetone were used in sequence, in another trimethylpentane was followed by DCM. For this, 5.0 mL of the non-polar solvents were used, and subsequently, progressive additions of the more polar solvents were carried out. The eluates were collected separately to evaluate the partitioning of the analytes (10 mL each time). Table S3 reports the results obtained for selected fragrances. For both n-hexane and trimethylpentane, about 10% of the analytes were already eluted by the addition of little milliliters, consequently, it was decided to proceed using a single solvent and collect the elute in a single fraction. The recoveries showed by dichloromethane were, in all cases, lower than those obtained, with acetone. The differences were in the range of 10–60% (for geranyl acetate and musk xylene respectively), therefore acetone was chosen as the eluting solvent. These allow the minimization of the time of the evaporation phase and therefore of the losses of the more volatile target compounds. The total amount of solvent necessary to recover the fragrances was determined by spiking the XAD-2 cartridge with 1000 ng of the target compounds. Based on the results already obtained during the clean-up tests, 20, 5, 5, and 5 mL subsequent additions of acetone were made, and the different fractions were collected separately. After the addition of the IS solution, the samples were evaporated at 500 μL and the SS solution was added before GC-MS analysis. The recovery of analytes in each fraction was evaluated and the final volume of acetone for elution was set at 30 mL.
3.1.3. Blank Evaluation
The blank of the method was evaluated by analyzing pre-cleaned XAD-2 (Soxhlet extraction with toluene for 24 h) according to the procedure developed. In order to monitor possible interference, the blank check was repeated at time intervals during the study. In the used operative condition, benzyl alcohol showed the worst blank corresponding to values higher than 100 ng m−3. Variable blanks were observed for camphor and ebanol with values in the ranges of 0–26 ng m−3 and 0–54 ng m−3 respectively. For all the other compounds, the blanks were always lower than 4 ng m−3.
3.1.4. Effectiveness of the Method
Little information exists about the levels of fragrances in the air, but the results reported are characterized by wide variability [19,22].
For this reason, the evaluation of the method efficiency was carried out by spiking the sampling cartridges with amounts of analytes equal to 100 ng, 3000 ng, and 7500 ng and 100 ng of internal standards (each level in triplicate). After carrying out all the analytical steps (addition of the IS solution, elution, evaporation, addition of the SS solution, and instrumental analysis), recoveries (R%) were evaluated as the ratio between the amount of substance detected through the analysis and that effectively added. Table S4 reports, for all the fragrances investigated, the average values of the R% for each level with the respective standard deviation (SD). They can be considered representative of the precision and accuracy of the method.
As expected, terpenes recoveries were less than 55% on all the three levels, indeed both extraction and instrumental method used are not suitable for these classes of substances [26,27]. Concerning alcohols, good results were not achieved principally due to the chromatographic column which was not suitable for this class of polar compounds
Except for very volatile fragrances or those belonging to the alcohol class, the standard deviations associated with percentage recoveries on individual levels were generally good, even when the tests were carried out on different days. On the contrary, the percentage recoveries on the three spike levels were different for a lot of compounds, and in general, grew with the amount of standard added. This could be due to a higher retention capability of XAD-2 versus analytes at low concentrations.
Since there are no guidelines or standardized methods for the analysis of fragrances, there are no acceptance criteria to refer to in order to evaluate the validity of the developed analytical method.
A range of R% and a maximum SD was established as a criterion for considering the method valid for each compound. Only compounds whose average R% is between 65% and 115% and whose differences between minimum and maximum R% evaluated for all tests did not differ by more than 30% can be quantified. Of the 66 analytes, 20 met these criteria and are reported in Table 3.
Finally, for each of the 20 selected fragrances, the LOD of the sample (LODsample) was calculated considering the final extract volume (500 μL), the sample size (≈14.4 m3 of air), and the minus percentage recovery of the respective internal standard (%ISrec) found in the method validation phase (evaluated respect to the syringe standard) [28,29]. The used formula is reported below.
The LOQ of the samples was calculated as the LOD of the sample and it was in the range of 0.07 ng m−3 to 0.48 ng m−3.
3.1.5. Breakthrough Evaluation
In order to ensure the representativeness of the samples, experiments were carried out to detect whether analyte leaks from the adsorbent cartridge occurred under the established sampling conditions. It was therefore verified that fragrances did not undergo breakthrough phenomena [30]. For this purpose, a sampling train was set up consisting of a zero air filter of ACF (Activated Carbon Fiber) [31,32], followed by a first cartridge containing XAD-2 marked with native compounds, and downstream a second XAD-2 cartridge. With the aim of maximizing the evidence of leaks, the first cartridge was labeled with a high amount of native compounds (7500 ng of the FS solution). To ensure that the ACF filter blocked all incoming analytes and worked as a zero filter, fluorene-d10 was spiked on it and checked for its absence downstream of the sampling train (the two XAD-2 cartridges). The experiment was performed in duplicate. After sampling, each adsorbent of the sampling train was processed and analyzed separately. The results showed no trace of fluorene-d10 in either of the two XAD-2 cartridges and the absence of breakthrough for most of the compounds. Among compounds considered suitable for quantitative analysis, the highest leaks were associated with salicylaldehyde and camphor and corresponded to 13.5% and 5.9%, respectively. Except for musk ketone, whose losses were equal to 1.7%, values always lower than 1% were observed for the other fragrances. The results, for all the investigated analytes, are reported in Table S5.
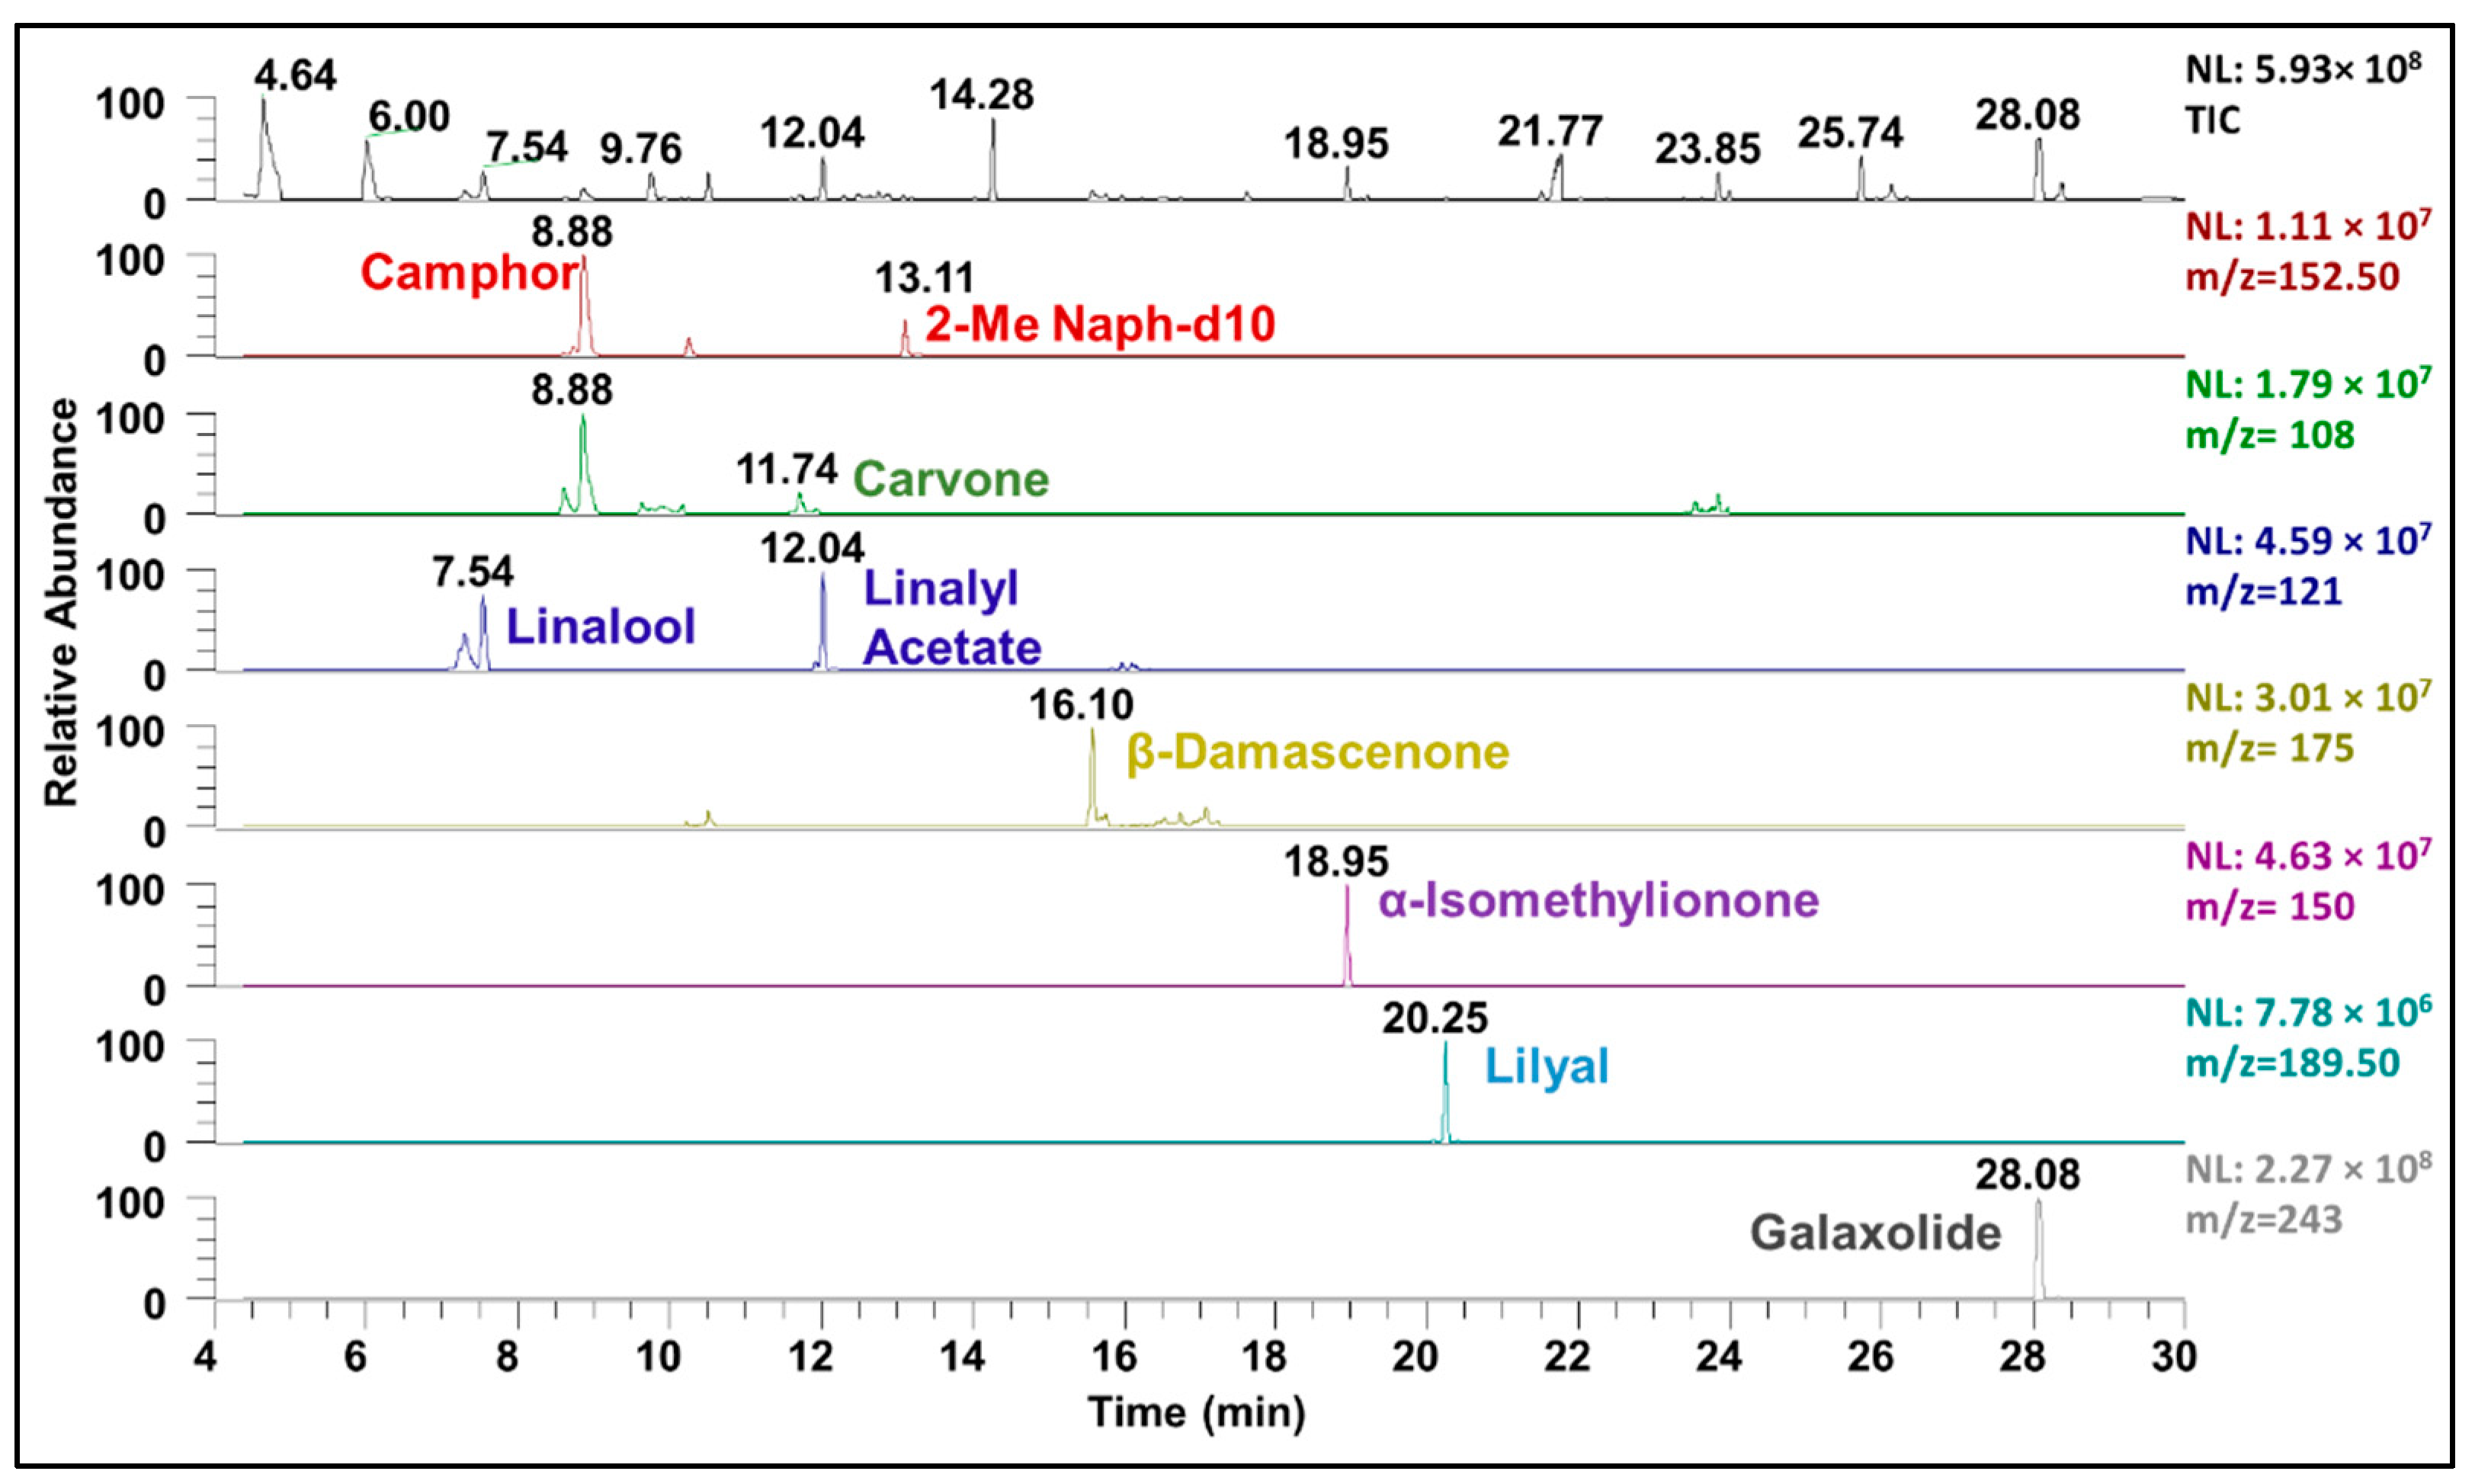
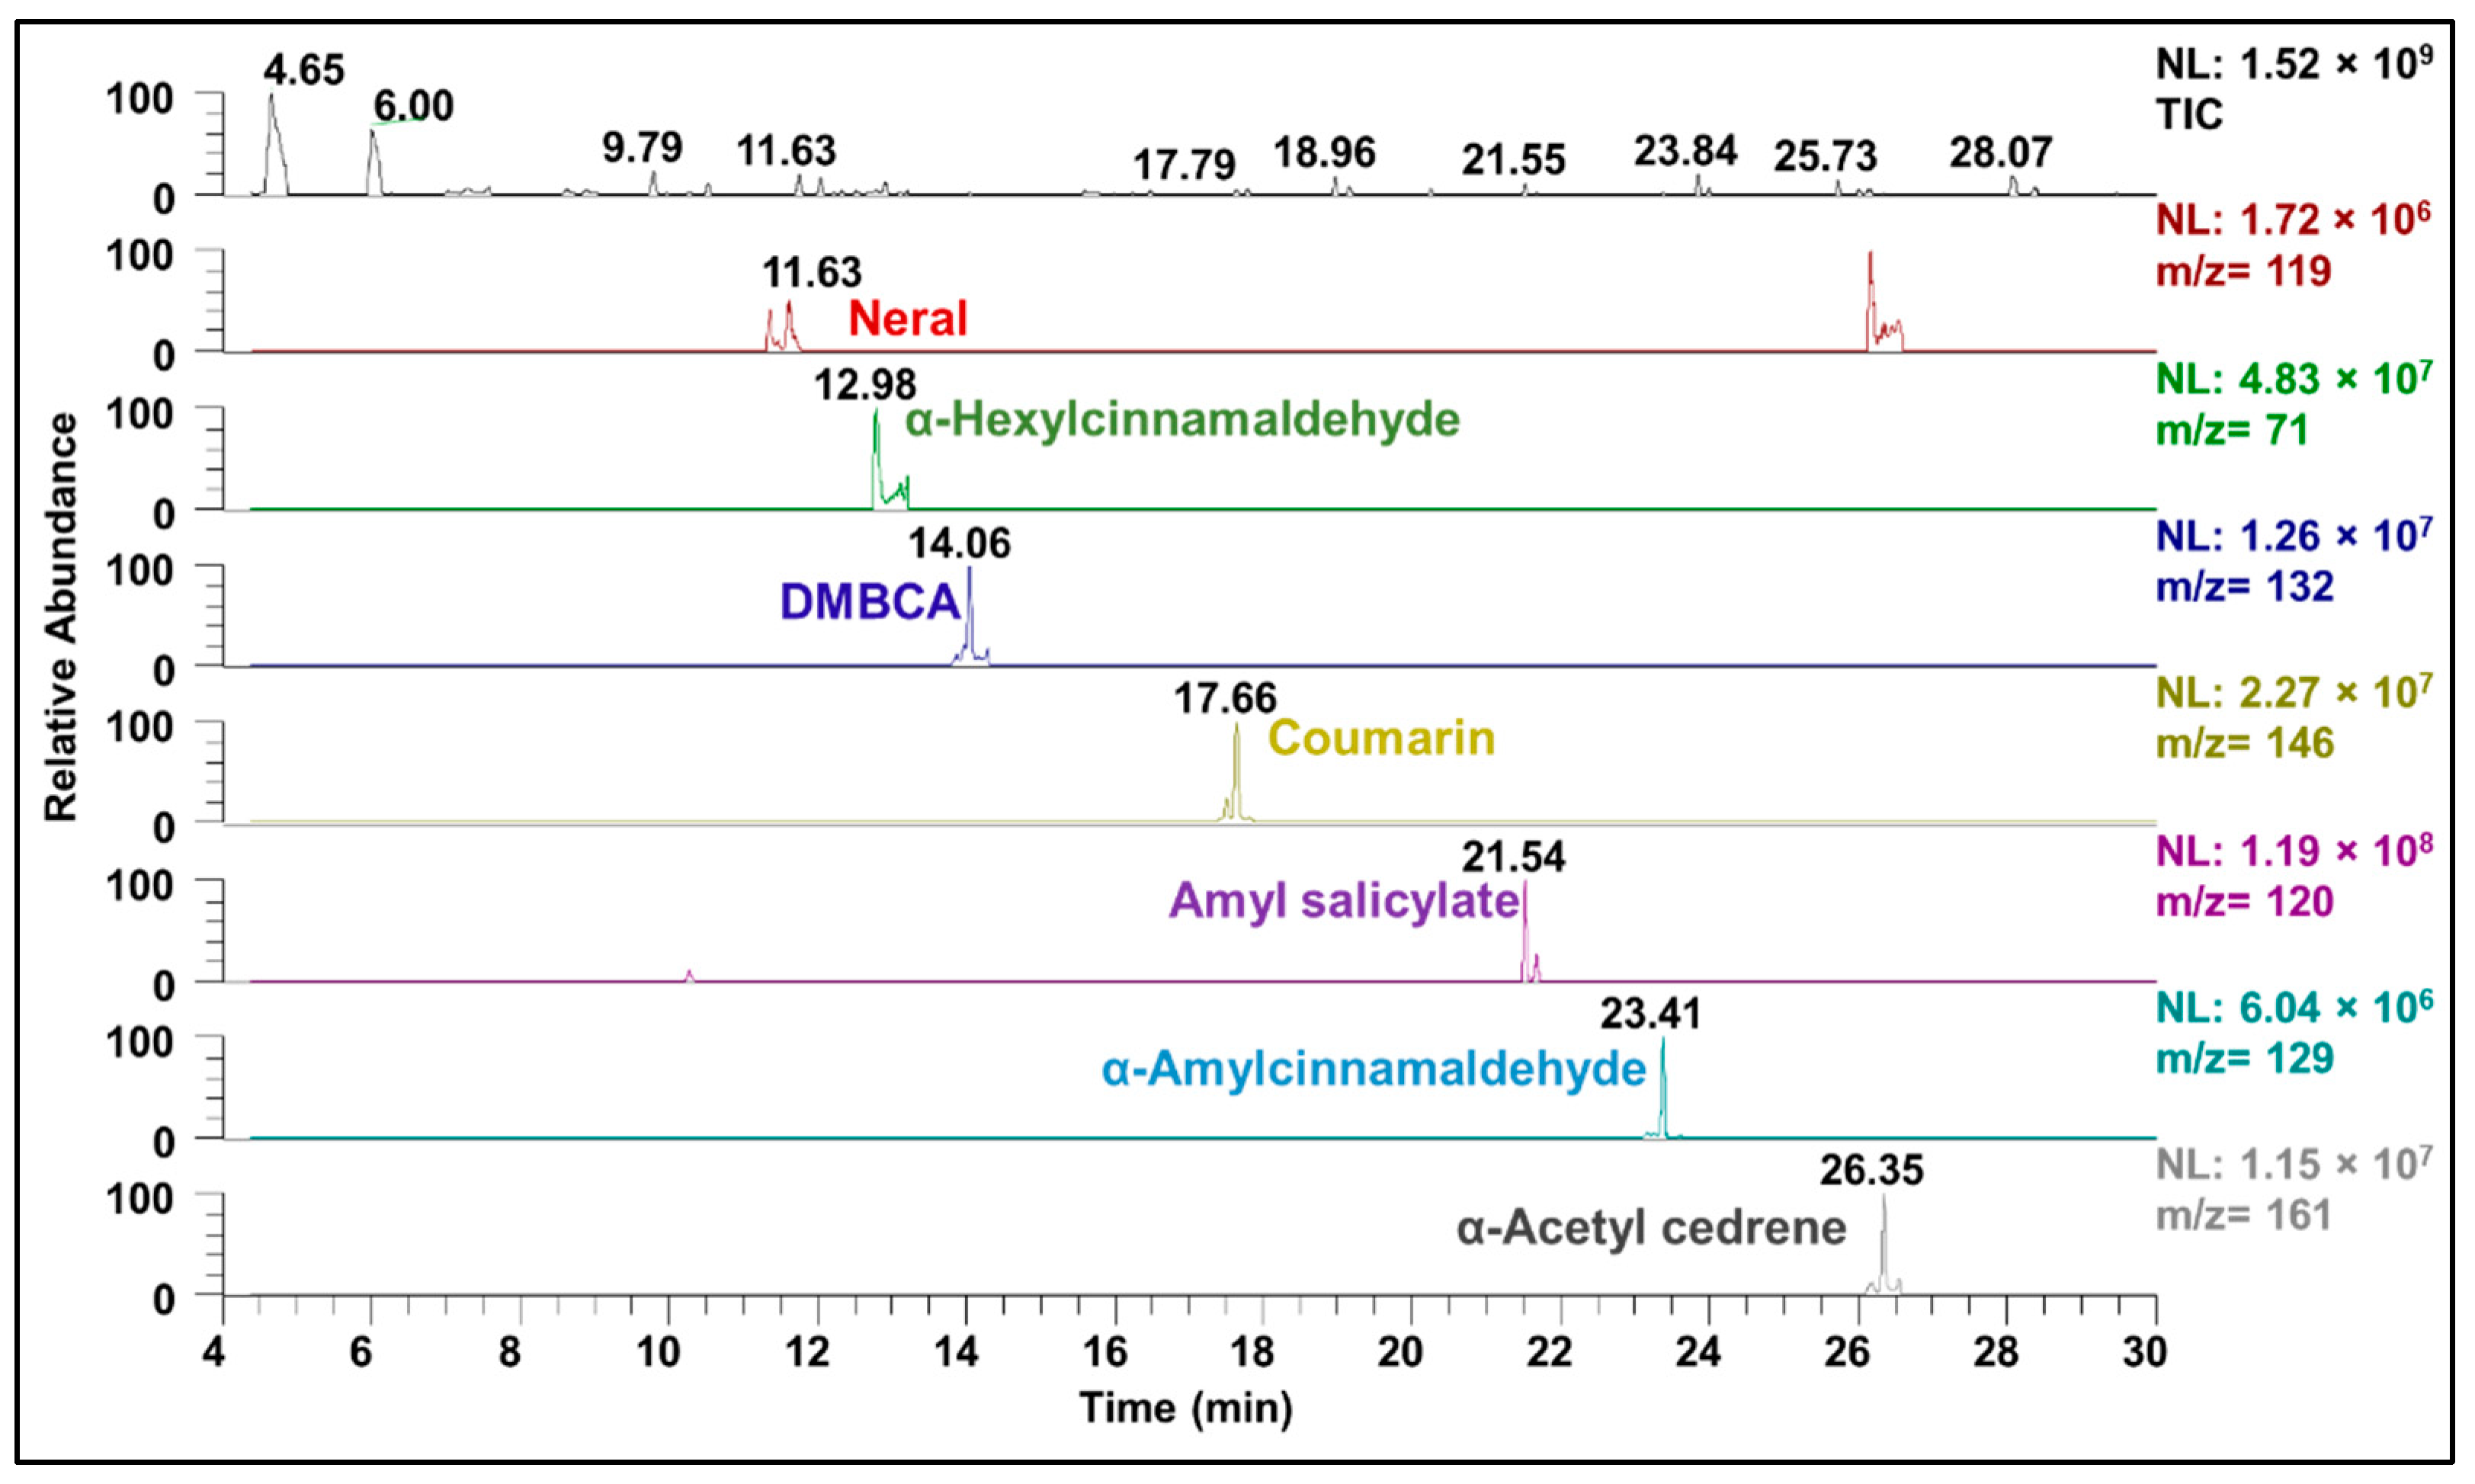
3.2. Concentrations of Fragrances in the Real Samples
Once validated, the developed method was tested to collect real samples in two different indoor environments, that is, a house and a coffee bar. Figure 2 and Figure 3 show the SIM-B chromatograms of samples collected at the sites. In each case, the total ion chromatogram (TIC) is reported together with selected ion chromatograms for the visualization of specific target compounds. Table 4 reports the aerial concentrations of the 20 fragrances suitable for quantitative determination. Almost all fragrances were detected with the only exception of folione and ISO E® γ. The highest concentrations were observed for carvone in the coffee bar (349 ng m−3) and camphor in the house (157 ng m−3). Carvone is a terpenoid and it is the main component of the essential oil of various species of mint. It is extensively used in perfumery, as a perfuming agent in cosmetics, and as a flavor in various foods [33]. Its presence in the coffee bar could depend on the presence of mint-flavored food products such as chewing gum, which are included in the products sold at this store. The second most concentrated compound in the bar was neral.
Neral is an unsaturated aldehyde and together with the geometrical isomer geranial constitutes the citral, which is one of the most widely used flavoring compounds in foods and beverages due to its intense lemon aroma/flavor [34]. Camphor is used in incense and insecticides [35,36]. In pharmacology, it is largely used in topical preparations due to its mild local anesthetizing effect and the production of a circumscribed sensation of heat [37]. In the house, its presence could be connected to the use of mosquito repellent, in fact, also the presence of N, N-diethyl-meta-toluamide (DEET, an insect repellent too) was determined. Concerning endocrine disruptors, α-isomethylionone, was detected in both sites and was the second most concentrated substance in the house (63.2 ng m−3), musk xylene and musk ketone were present at lower concentrations (≈1 or 2 ng m−3). Finally, a semi-quantitative determination was made for fragrances whose method accuracy and precision were not good enough to allow a quantitative analysis. The measured concentration values are shown in Table S6, but the uncertainty associated with the measurements must be considered (see Table S4). In the bar, the menthol had a concentration certainly higher than 1000 ng m−3. Among confirmed or suspected endocrine disruptors, lylial and galaxolide 1 and 2 were detected in both environments at concentrations of approximately 10 ng m−3. Concentration values in the order of 100–200 ng m−3 were instead observed for benzyl salicylate.
The indoor concentrations of musks observed in this study are comparable with those reported in the literature. According to Ramirez et al. [22], in a study conducted in a chemical laboratory, an office, a medical center, a pharmacy, a hairdresser’s shop, and, a flower shop, musk xylene was detected in the range of 2.9–766 ng m−3 (lower concentration flower shop, maximum concentration hairdresser), musk ketone was in the range of 1.9–68.5 ng m−3 (pharmacy and hairdresser respectively), and galaxolide was in the range of 47.1–1256 ng m−3 (min. pharmacy and max hairdresser). In Spain, Reguerio et al. [21] detected aerial galaxolide at 57 ng m−3 in a rest facility, while musks were always lower than LOD in all the ambient investigated (LOD ≈ 0.1 ng m−3).
According to our knowledge, some fragrances have been measured in indoor environments for the first time in this study. Some others have been investigated in Spain by Lamas et al. [19,20] under normal daily conditions or in environments treated with aerosols diffusion units and different common cleaning products. In the normal conditions recorded in different home places (washroom, laundry room, corridor, living room, kitchen, bedroom, and storage room), the concentrations were comparable with those measured in the present study. Citral was often lower than the LOD (1.9 ng m−3), it was detected in only two cases (living room and kitchen) and it was at levels higher than 440 ng m−3. α-isomethylionone, lylial, and benzyl salicylate were in the range of 15–765 ng m−3, 116–1090 ng m−3, and 14–18 ng m−3, respectively. Only α-isomethylionone was detected in all samples and its highest levels were reached in the kitchen, while the highest concentrations of lilyal were measured in a washroom and that of benzyl salicylate in a storage room. Concerning menthol and camphor, their presence has been detected but not measured by Cobo-Golpe and coworkers through GG-high resolution mass spectrometry (GC-HRMS) in portable dehumidifiers condensed water [38].
4. Conclusions
A method for the determination of gas-phase fragrances indoors was developed. The applied sampling system is constituted by a XAD-2 cartridge sampling 24 h, at a flow rate of 10 L min−1. 66 fragrances were tested and for 20 analytes, accuracy and precision tested in triplicate on three levels of concentration were considered good enough to allow quantitative determination (% absolute recovery in the range 72% ± 9%–92% ± 13%). For much of the other compounds, the effectiveness of the method was good enough to gain information on the order of concentration in the monitored sites. The applicability of the technique in real samples was tested in a house and a coffee bar. Almost all fragrances were detected, and results showed that the method is sensitive enough to reveal fragrance concentrations at levels of ng m−3 in real samples. This method can be used in the future for the indoor simultaneous collection of gaseous and particulate fragrances together with other classes.
Supplementary Materials
The following supporting information can be downloaded at: https://0-www-mdpi-com.brum.beds.ac.uk/article/10.3390/separations9040099/s1, Table S1. Compounds detected through SIM-A; Table S2. Compounds detected through SIM-B; Table S3. Percent recovery of the standards during the tests for the extraction procedure setting. Table S4. Percentage Recovery (%R) and Standard Deviation (SD) of the method at three levels of native compounds; Table S5. % of ng lost during the sampling for Breakthrough evaluation; Table S6. Results of the semi-quantitative determination of fragrances in the house and in the coffee bar.
Author Contributions
Conceptualization, C.B. and M.G.; methodology, P.A. and A.B.; validation, M.G. and M.C.; resources, P.C.; writing—original draft preparation, C.B., M.G.; writing—review and editing, P.A., M.C., A.B. and P.C. All authors have read and agreed to the published version of the manuscript.
Funding
This research received no external funding.
Institutional Review Board Statement
Not applicable.
Data Availability Statement
All data are available from the corresponding author upon request.
Acknowledgments
We acknowledge Mattia Perilli for technical support.
Conflicts of Interest
The authors declare no conflict of interest.
References
- Settimo, G.; Manigrasso, M.; Avino, P. Indoor air quality: A focus on the european legislation and state-of-the-art research in Italy. Atmosphere 2020, 11, 370. [Google Scholar] [CrossRef] [Green Version]
- Maroni, M.; Axelrad, R.; Bacaloni, A. NATO’s efforts to set indoor air quality guidelines and standards. Am. Ind. Hyg. Assoc. J. 1995, 56, 499–508. [Google Scholar] [CrossRef]
- Takaoka, M.; Norbäck, D. The Indoor Environment in Schools, Kindergartens and Day Care Centres. In Indoor Environmental Quality and Health Risk toward Healthier Environment for All; Springer: Berlin/Heidelberg, Germany, 2020; ISBN 9789813291812. [Google Scholar]
- Baloch, R.M.; Maesano, C.N.; Christoffersen, J.; Banerjee, S.; Gabriel, M.; Csobod, É.; de Oliveira Fernandes, E.; Annesi-Maesano, I.; Szuppinger, P.; Prokai, R.; et al. Indoor air pollution, physical and comfort parameters related to schoolchildren’s health: Data from the European SINPHONIE study. Sci. Total Environ. 2020, 739, 139870. [Google Scholar] [CrossRef] [PubMed]
- Nehr, S.; Hösen, E.; Tanabe, S. Ichi Emerging developments in the standardized chemical characterization of indoor air quality. Environ. Int. 2017, 98, 233–237. [Google Scholar] [CrossRef] [PubMed]
- González-Martín, J.; Kraakman, N.J.R.; Pérez, C.; Lebrero, R.; Muñoz, R. A state–of–the-art review on indoor air pollution and strategies for indoor air pollution control. Chemosphere 2021, 262, 128376. [Google Scholar] [CrossRef] [PubMed]
- Wolkoff, P.; Nielsen, G.D. Effects by inhalation of abundant fragrances in indoor air—An overview. Environ. Int. 2017, 101, 96–107. [Google Scholar] [CrossRef] [PubMed]
- Basketter, D.; Kimber, I. Fragrance sensitisers: Is inhalation an allergy risk? Regul. Toxicol. Pharmacol. 2015, 73, 897–902. [Google Scholar] [CrossRef]
- Nawaz, T.; Sengupta, S. Chapter 4—Contaminants of Emerging Concern: Occurrence, Fate, and Remediation. In Advances in Water Purification Techniques; Elsevier: Amsterdam, The Netherlands, 2018; ISBN 9780128147917. [Google Scholar]
- Yadav, D.; Rangabhashiyam, S.; Verma, P.; Singh, P.; Devi, P.; Kumar, P.; Hussain, C.M.; Gaurav, G.K.; Kumar, K.S. Environmental and health impacts of contaminants of emerging concerns: Recent treatment challenges and approaches. Chemosphere 2021, 272, 129492. [Google Scholar] [CrossRef]
- Enyoh, C.E.; Verla, A.W.; Qingyue, W.; Ohiagu, F.O.; Chowdhury, A.H.; Enyoh, E.C.; Chowdhury, T.; Verla, E.N.; Chinwendu, U.P. An overview of emerging pollutants in air: Method of analysis and potential public health concern from human environmental exposure. Trends Environ. Anal. Chem. 2020, 28, e00107. [Google Scholar] [CrossRef]
- Christensson, J.B.; Hagvall, L.; Karlberg, A.T. Fragrance allergens, overview with a focus on recent developments and understanding of abiotic and biotic activation. Cosmetics 2016, 3, 19. [Google Scholar] [CrossRef]
- Bickers, D.R.; Calow, P.; Greim, H.A.; Hanifin, J.M.; Rogers, A.E.; Saurat, J.H.; Sipes, I.G.; Smith, R.L.; Tagami, H. The safety assessment of fragrance materials. Regul. Toxicol. Pharmacol. 2003, 37, 218–273. [Google Scholar] [CrossRef]
- Patel, S.; Homaei, A.; Sharifian, S. Need of the hour: To raise awareness on vicious fragrances and synthetic musks. Environ. Dev. Sustain. 2020, 23 (Suppl. 3), 4764–4781. [Google Scholar] [CrossRef]
- Dodson, R.E.; Nishioka, M.; Standley, L.J.; Perovich, L.J.; Brody, J.G.; Rudel, R.A. Endocrine disruptors and asthma-associated chemicals in consumer products. Environ. Health Perspect. 2012, 120, 935–943. [Google Scholar] [CrossRef] [PubMed] [Green Version]
- Wieck, S.; Olsson, O.; Kümmerer, K.; Klaschka, U. Fragrance allergens in household detergents. Regul. Toxicol. Pharmacol. 2018, 97, 163–169. [Google Scholar] [CrossRef]
- Chen, J.; Møller, K.H.; Wennberg, P.O.; Kjaergaard, H.G. Unimolecular Reactions following Indoor and Outdoor Limonene Ozonolysis. J. Phys. Chem. A 2021, 125, 669–680. [Google Scholar] [CrossRef]
- Nørgaard, A.W.; Kofoed-Sørensen, V.; Mandin, C.; Ventura, G.; Mabilia, R.; Perreca, E.; Cattaneo, A.; Spinazzè, A.; Mihucz, V.G.; Szigeti, T.; et al. Ozone-initiated terpene reaction products in five European offices: Replacement of a floor cleaning agent. Environ. Sci. Technol. 2014, 48, 13331–13339. [Google Scholar] [CrossRef]
- Lamas, J.P.; Sanchez-Prado, L.; Garcia-Jares, C.; Llompart, M. Determination of fragrance allergens in indoor air by active sampling followed by ultrasound-assisted solvent extraction and gas chromatography-mass spectrometry. J. Chromatogr. A 2010, 1217, 1882–1890. [Google Scholar] [CrossRef]
- Lamas, J.P.; Sanchez-Prado, L.; Lores, M.; Garcia-Jares, C.; Llompart, M. Sorbent trapping solid-phase microextraction of fragrance allergens in indoor air. J. Chromatogr. A 2010, 1217, 5307–5316. [Google Scholar] [CrossRef]
- Regueiro, J.; Garcia-Jares, C.; Llompart, M.; Lamas, J.P.; Cela, R. Development of a method based on sorbent trapping followed by solid-phase microextraction for the determination of synthetic musks in indoor air. J. Chromatogr. A 2009, 1216, 2805–2815. [Google Scholar] [CrossRef]
- Ramírez, N.; Marcé, R.M.; Borrull, F. Development of a thermal desorption-gas chromatography-mass spectrometry method for determining personal care products in air. J. Chromatogr. A 2010, 1217, 4430–4438. [Google Scholar] [CrossRef]
- Balci, E.; Genisoglu, M.; Sofuoglu, S.C.; Sofuoglu, A. Indoor air partitioning of Synthetic Musk Compounds: Gas, particulate matter, house dust, and window film. Sci. Total Environ. 2020, 729, 138798. [Google Scholar] [CrossRef] [PubMed]
- Fontal, M.; van Drooge, B.L.; Grimalt, J.O. A rapid method for the analysis of methyl dihydrojasmonate and galaxolide in indoor and outdoor air particulate matter. J. Chromatogr. A 2016, 1447, 135–140. [Google Scholar] [CrossRef] [PubMed]
- Van Drooge, B.L.; Rivas, I.; Querol, X.; Sunyer, J. Organic Air Quality Markers of Indoor and Outdoor PM 2. 5 Aerosols in Primary Schools from Barcelona. Int. J. Environ. Res. Public Health 2020, 17, 3685. [Google Scholar] [CrossRef] [PubMed]
- Kruza, M.; McFiggans, G.; Waring, M.S.; Wells, J.R.; Carslaw, N. Indoor secondary organic aerosols: Towards an improved representation of their formation and composition in models. Atmos. Environ. 2020, 240, 117784. [Google Scholar] [CrossRef]
- Angulo-Milhem, S.; Verriele, M.; Nicolas, M.; Thevenet, F. Indoor use of essential oils: Emission rates, exposure time and impact on air quality. Atmos. Environ. 2021, 244, 117863. [Google Scholar] [CrossRef]
- Bokowa, A.; Diaz, C.; Koziel, J.A.; Mcginley, M.; Barclay, J.; Guillot, J.; Sneath, R.; Capelli, L.; Zorich, V. Summary and Evaluation of the Odour Regulations Worldwide. Atmosphere 2021, 12, 206. [Google Scholar] [CrossRef]
- Delgado-Saborit, J.M.; Aquilina, N.; Baker, S.; Harrad, S.; Meddings, C.; Harrison, R.M. Determination of atmospheric particulate-phase polycyclic aromatic hydrocarbons from low volume air samples. Anal. Methods 2010, 2, 231–242. [Google Scholar] [CrossRef] [Green Version]
- Hayward, S.J.; Lei, Y.D.; Wania, F. Sorption of a diverse set of organic chemical vapors onto XAD-2 resin: Measurement, prediction and implications for air sampling. Atmos. Environ. 2011, 45, 296–302. [Google Scholar] [CrossRef]
- Balducci, C.; Cecinato, A.; Paolini, V.; Guerriero, E.; Perilli, M.; Romagnoli, P.; Tortorella, C.; Nacci, R.M.; Giove, A.; Febo, A. Volatilization and oxidative artifacts of PM bound PAHs at low volume sampling (2): Evaluation and comparison of mitigation strategies effects. Chemosphere 2017, 189, 330–339. [Google Scholar] [CrossRef]
- Cerasa, M.; Guerriero, E.; Mosca, S. Evaluation of Extraction Procedure of PCDD/Fs, PCBs and Chlorobenzenes from Activated Carbon Fibers (ACFs). Molecules 2021, 26, 6407. [Google Scholar] [CrossRef]
- Morcia, C.; Tumino, G.; Ghizzoni, R.; Terzi, V. Carvone (Mentha spicata L.) oils. In Essential Oils in Food Preservation, Flavor and Safety; Elsevier: Amsterdam, The Netherlands, 2016; ISBN 9780124166448. [Google Scholar]
- Mercer, D.G.; Rodriguez-Amaya, D.B. Reactions and interactions of some food additives. In Chemical Changes During Processing and Storage of Foods; Elsevier: Amsterdam, The Netherlands, 2021; ISBN 9780128173800. [Google Scholar]
- Kholibrina, C.R.; Aswandi, A. The Consumer Preferences for New Sumatran Camphor Essential Oil-based Products using a Conjoint Analysis Approach. IOP Conf. Ser. Earth Environ. Sci. 2021, 715, 012078. [Google Scholar] [CrossRef]
- Cansian, R.L.; Astolfi, V.; Cardoso, R.I.; Paroul, N.; Roman, S.S.; Mielniczki-Pereira, A.A.; Pauletti, G.F.; Mossi, A.J. Atividade inseticida e repelente do óleo essencial de Cinnamomum camphora var. linaloolifera Y. Fujita (Ho-Sho) e Cinnamomum camphora (L.) J Presl. var. hosyo (Hon-Sho) sobre Sitophilus zeamais Mots. (Coleoptera, Curculionedae). Rev. Bras. Plantas Med. 2015, 17, 769–773. [Google Scholar] [CrossRef]
- Zuccarini, P.; Soldani, G. Camphor: Benefits and risks of a widely used natural product. Acta Biol. Szeged. 2009, 53, 77–82. [Google Scholar] [CrossRef] [Green Version]
- Cobo-Golpe, M.; Ramil, M.; Cela, R.; Rodríguez, I. Portable dehumidifiers condensed water: A novel matrix for the screening of semi-volatile compounds in indoor air. Chemosphere 2020, 251, 126346. [Google Scholar] [CrossRef] [PubMed]
Figure 1.
GC-MS full-scan chromatogram of the FS solution.

Figure 2.
SIM-B chromatogram of the sample collected in the house.

Figure 3.
SIM-B chromatogram of the sample collected in the coffee bar.


Table 1.
Molecular weight (MW), CAS number, retention time, and m/z ratios were used for the fragrance determination.
Table 1.
Molecular weight (MW), CAS number, retention time, and m/z ratios were used for the fragrance determination.
| Compound | MW | CAS | Retention Time (min) | Quantitative (m/z) | Confirmation (m/z) |
|---|---|---|---|---|---|
| Salicylaldehyde | 122.12 | 90-02-8 | 6.28 | 122 | 65, 121 |
| Camphor | 152.23 | 464-49-1 | 8.88 | 81 | 95, 108 |
| Folione | 154.21 | 111-12-6 | 10.42 | 123 | 95, 111 |
| Neral | 152.23 | 5392-40-5 | 11.63 | 119 | 69, 84 |
| Carvone | 150.22 | 2244-16-8 | 11.74 | 108 | 54, 82 |
| Geranial | 152.23 | 141-27-5 | 12.51 | 152 | 84, 83 |
| DMBCA | 192.25 | 151-05-1 | 14.06 | 132 | 91, 117 |
| Geranyl acetate | 196.29 | 105-87-1 | 16.00 | 136 | 68, 93 |
| β-Damascenone | 190.28 | 23696-85-7 | 16.10 | 175 | 69, 190 |
| δ-Damascone | 192.30 | 57378-68-4 | 16.38 | 123 | 69, 192 |
| β-Damascone | 192.30 | 23726-91-2 | 17.02 | 177 | 123, 192 |
| Coumarin | 229.16 | 91-64-5 | 17.66 | 146 | 89, 118 |
| α-Isomethylionone | 206.32 | 127-51-5 | 18.98 | 150 | 135, 206 |
| Eugenyl acetate | 206.24 | 93-28-7 | 20.26 | 164 | 131, 149 |
| 3-Propylidenephthalide | 174.2 | 17369-59-4 | 21.50 | 159 | 104, 174 |
| α-Amylcinnamaldehyde | 202.29 | 78605-96-6 | 23.41 | 129 | 201, 202 |
| ISO E® γ | 234.38 | 68155-67-9 | 23.65 | 191 | 109, 121 |
| Musk xylene | 297.26 | 81-15-2 | 28.33 | 282 | 127, 297 |
| Musk ketone | 294.30 | 81-14-1 | 30.77 | 279 | 280, 294 |
| Benzyl cinnamate | 238.28 | 103-41-3 | 32.76 | 131 | 192, 193 |
| Naphthalene-d8 | 136.22 | 1146-65-2 | 9.91 | 108 | 136 |
| 2-Methylnaphthalene-d10 | 152.26 | 7297-45-2 | 13.11 | 122 | 152 |
| Diethyl phthalate-d4 | 226.26 | 93952-12-6 | 22.04 | 181 | 153 |
| Pyrene-d10 | 212.31 | 7297-45-2 | 33.06 | 106 | 212 |
| Benzo[a]anthracene-d12 | 240.36 | 1718-53-2 | 30.08 | 120 | 240 |
Table 2.
Calibration curves, curve correlation coefficient R, and instrumental LOD of selected fragrances.
Table 2.
Calibration curves, curve correlation coefficient R, and instrumental LOD of selected fragrances.
| Compound | Calibration Curve | R | LODinst |
|---|---|---|---|
| Salicylaldehyde | Y = −0.0153816 + 1.12523 X | 0.9959 | 0.001 |
| Camphor | Y = −0.00116375 + 1.10579 X | 0.9997 | 0.001 |
| Folione | Y = −0.0066146 + 0.477204 X | 0.9997 | 0.004 |
| Neral | Y = −0.00723682 + 0.355397 X | 0.9998 | 0.006 |
| Carvone | Y = −0.0138041 + 0.775145 X | 0.9997 | 0.003 |
| Geranial | Y = −0.00914425 + 0.353934 X | 0.9994 | 0.007 |
| DMBCA | Y = −0.0171582 + 1.34708 X | 0.9998 | 0.001 |
| Geranyl acetate | Y = −0.00736214 + 0.312877 X | 0.9997 | 0.012 |
| β-Damascenone | Y = −0.0567008 + 2.59694 X | 0.9995 | 0.001 |
| δ-Damascone | Y = −0.0204197 + 0.950358 X | 0.9993 | 0.004 |
| β-Damascone | Y = −0.0483275 + 2.02308 X | 0.9993 | 0.002 |
| Coumarin | Y = −0.027222 + 1.94787 X | 0.9997 | 0.002 |
| α-Isomethylionone | Y = −0.0390646 + 1.8334 X | 0.9994 | 0.002 |
| Eugenyl acetate | Y = −0.0778768 + 3.53241 X | 0.9996 | 0.001 |
| 3-Propylidenephthalide | Y = −0.0430587 + 2.29359 X | 0.9996 | 0.001 |
| α-Amylcinnamaldehyde | Y = −0.0496146 + 1.74195 X | 0.9992 | 0.002 |
| ISO E® γ | Y = −0.00185945 + 0.122102 X | 0.9985 | 0.026 |
| Musk xylene | Y = −0.0189596 + 0.656847 X | 0.9988 | 0.005 |
| Musk ketone | Y = −0.0329199 + 0.791557 X | 0.9967 | 0.005 |
| Benzyl cinnamate | Y = −0.0813413 + 1.95804 X | 0.9954 | 0.002 |
Table 3.
Percentage Recovery (%R) and Standard Deviation (SD) of the method at three levels of native compounds.
Table 3.
Percentage Recovery (%R) and Standard Deviation (SD) of the method at three levels of native compounds.
| Compound | Level 1 (100 ng) | Level 2 (3000 ng) | Level 3 (7500 ng) |
|---|---|---|---|
| %R (SD) | %R (SD) | %R (SD) | |
| Salicylaldehyde | 77.1 (8) | 92.7 (7) | 83.4 (14) |
| Camphor | 82.7 (7) | 77.9 (1) | 86.9 (8) |
| Folione | 72.8 (4) | 88.7 (3) | 97.7 (0) |
| Neral | 71.4 (7) | 86.9 (4) | 92.2 (1) |
| Carvone | 64.6 (9) | 75.7 (3) | 93.7 (3) |
| Geranial | 66.7 (6) | 85.1 (7) | 91.9 (4) |
| DMBCA | 74.8 (2) | 82 (6) | 92.5 (5) |
| Geranyl acetate | 66.9 (1) | 70.4 (5) | 84.3 (3) |
| ß-Damascenone | 69.3 (1) | 66.2 (5) | 86.2 (6) |
| δ-Damascone | 70.4 (0) | 68.7 (4) | 86.3 (6) |
| ß-Damascone | 72.4 (1) | 73.0 (5) | 91.3 (6) |
| Coumarin | 67.1 (5) | 70.7 (5) | 86.4 (4) |
| a-Isomethylionone | 79.6 (1) | 70.5 (4) | 89.8 (6) |
| Eugenyl acetate | 75.4 (1) | 81.2 (4) | 88.9 (5) |
| 3-Propylidenephthalide | 69.1 (0) | 77.9 (2) | 83.3 (3) |
| a-Amylcinnamaldehyde | 70.9 (1) | 85.1 (3) | 91.4 (4) |
| ISO E® γ | 78.3 (3) | 83.1 (4) | 92.2 (3) |
| Musk xylene | 90 (5) | 90.5 (11) | 92.4 (6) |
| Musk ketone | 65.4 (1) | 76.9 (5) | 73.6 (3) |
| Benzyl cinnamate | 79.3 (5) | 88.1 (5) | 115 (8) |
Table 4.
Concentration (ng m−3) of fragrances collected in the house and in the coffee bar.
| Compound | House | Coffee Bar | Compound | House | Coffee Bar |
|---|---|---|---|---|---|
| (ng m−3) | (ng m−3) | (ng m−3) | (ng m−3) | ||
| Salicylaldehyde | 54.4 ± 4.3 | 32 ± 2.6 | ß-Damascone | ND 1 | 0.14 ± 0.01 |
| Camphor | 157 ± 11.0 | 75.7 ± 5.3 | Coumarin | 29.6 ± 1.5 | 39.1 ± 1.9 |
| Folione | ND | ND | α-Isomethylionone | 63.2 ± 0.6 | 74.1 ± 0.7 |
| Neral | 46.8 ± 1.8 | 162 ± 6.5 | Eugenyl acetate | 0.45 ± 0.01 | 0.86 ± 0.01 |
| Carvone | 39.5 ± 3.2 | 349 ± 6.5 | 3-Propylidenephthalide | 0.68 ± 0.01 | 1.04 ± 0.01 |
| Geranial | 39.8 ± 2.4 | 19.4 ± 1.2 | a-Amylcinnamaldehyde | 8.33 ± 0.08 | 19.1 ± 0.2 |
| DMBCA | 17.2 ± 0.3 | 17.1 ± 0.3 | ISO E® γ | ND | ND |
| Geranyl acetate | 18.1 ± 0.2 | 17.2 ± 0.2 | Benzyl cinnamate | 0.97 ± 0.04 | 0.96 ± 0.04 |
| ß-Damascenone | 7.85 ± 0.01 | ND | Musk xylene | 2.38 ± 0.02 | 1.32 ± 0.01 |
| δ-Damascone | ND | 1.03 ± 0.07 | Musk ketone | 1.25 ± 0.06 | 1.54 ± 0.07 |
1 ND not detected.
Publisher’s Note: MDPI stays neutral with regard to jurisdictional claims in published maps and institutional affiliations. |
© 2022 by the authors. Licensee MDPI, Basel, Switzerland. This article is an open access article distributed under the terms and conditions of the Creative Commons Attribution (CC BY) license (https://creativecommons.org/licenses/by/4.0/).
Share and Cite
MDPI and ACS Style
Balducci, C.; Cerasa, M.; Avino, P.; Ceci, P.; Bacaloni, A.; Garofalo, M. Analytical Determination of Allergenic Fragrances in Indoor Air. Separations 2022, 9, 99. https://0-doi-org.brum.beds.ac.uk/10.3390/separations9040099
AMA Style
Balducci C, Cerasa M, Avino P, Ceci P, Bacaloni A, Garofalo M. Analytical Determination of Allergenic Fragrances in Indoor Air. Separations. 2022; 9(4):99. https://0-doi-org.brum.beds.ac.uk/10.3390/separations9040099
Chicago/Turabian StyleBalducci, Catia, Marina Cerasa, Pasquale Avino, Paolo Ceci, Alessandro Bacaloni, and Martina Garofalo. 2022. "Analytical Determination of Allergenic Fragrances in Indoor Air" Separations 9, no. 4: 99. https://0-doi-org.brum.beds.ac.uk/10.3390/separations9040099
Note that from the first issue of 2016, this journal uses article numbers instead of page numbers. See further details here.