Article

Qualitative and Quantitative Detection of Acacia Honey Adulteration with Glucose Syrup Using Near-Infrared Spectroscopy

Faculty of Food Technology and Biotechnology, University of Zagreb, 10000 Zagreb, Croatia
*
Author to whom correspondence should be addressed.
Submission received: 24 September 2022 / Revised: 10 October 2022 / Accepted: 12 October 2022 / Published: 15 October 2022
(This article belongs to the Special Issue Novel Applications of Separation Technology)

Abstract

:
Honey adulteration with cheap sweeteners such as corn syrup or invert syrup results in honey of lesser quality that can harm the objectives of both manufacturers and consumers. Therefore, there is a growing interest for the development of a fast and simple method for adulteration detection. In this work, near-infrared spectroscopy (NIR) was used for the detection of honey adulteration and changes in the physical and chemical properties of the prepared adulterations. Fifteen (15) acacia honey samples were adulterated with glucose syrup in a range from 10% to 90%. Raw and pre-processed NIR spectra of pure honey samples and prepared adulterations were subjected to Principal Component Analysis (PCA), Partial Least Squares (PLS) regression, and Artificial Neural Network (ANN) modeling. The results showed that PCA ensures distinct grouping of samples in pure honey samples, honey adulterations, and pure adulteration using NIR spectra after the Multiplicative Scatter Correction (MSC) method. Furthermore, PLS models developed for the prediction of the added adulterant amount, moisture content, and conductivity can be considered sufficient for screening based on RPD and RER values (1.7401 < RPD < 2.7601; 7.7128 < RER < 8.7157) (RPD of 2.7601; RER of 8.7157) and can be moderately used in practice. The R2validation of the developed ANN models was greater than 0.86 for all outputs examined. Based on the obtained results, it can be concluded that NIR coupled with ANN modeling can be considered an efficient tool for honey adulteration quantification.

1. Introduction

Honey is a food product of high value and, because of this, it is increasingly becoming a target for adulteration. At the global level, two factors are crucial for the authenticity of honey: production and origin [1]. The main production problems are the contact of bees with contaminated water, air, and plants and inadequate beekeeping practices, such as overheating and feeding bees during honey production, for which beekeepers are directly responsible [2]. This is an indirect way of honey adulteration. This approach negatively affects the proline content, sugar content, and mineral content in honey [3]. Furthermore, direct adulteration includes the addition of cheap sweeteners such as starch (corn) syrup and invert syrup (syrup containing glucose and fructose) to honey, resulting in honey of lesser quality [4]. Despite being performed for short-term financial gain, adulteration can harm the objectives of both manufacturers and consumers [5].
As the adulterating substances include characteristic ingredients of honey, it is difficult to identify adulterations [6]. As stated by Naila et al. [7], the detection and quantification of honey adulteration by the addition of different sugars are traditionally performed by highly sophisticated analytical methods such as high-performance liquid chromatography (HPLC), gas chromatography (GC), isotope ratio mass spectroscopy (IRMS), high-performance anion exchange chromatography with pulsed amperometric detection (HPAEC-PAD), or stable carbon isotopic ratio mass spectrometry. Considering the complexity of the above-mentioned methods, researchers have lately focused on spectroscopic methods [8] such as visible spectroscopy (VIS), near-infrared spectroscopy (NIRS), mid-infrared spectroscopy (MIR), and fluorescence coupled with chemometrics [9]. For example, Rios-Corripio et al. [10] presented an efficient application of attenuated total reflectance-Fourier transform infrared (ATR-FTIR) spectroscopy and partial least squares (PLS) modeling to study honey adulteration with standard sugar solutions (glucose, fructose, and sucrose) and with cheap syrups (corn, inverted, and cane sugar). Başar and Özdemir [8] also applied ATR-FTIR coupled with genetic-algorithm-based inverse least squares and partial least squares for the calibration of corn syrup, beet sugar, and water addition to honey. Furthermore, Kumaravelu and Gopal [11] used NIRS and chemometrics to detect the Jagger adulterants in honey, while Skaff et al. [1] applied near- and mid-infrared spectroscopy and Principal Component Analysis (PCA) for classification of honey samples adulterated with glucose, fructose, sucrose, and high-fructose corn syrup. Elhamdaoui et al. [9] applied Fourier transform mid-infrared (FT-MIR) spectroscopy with PCA and hierarchical cluster analysis (HCA) for quantitative discrimination of honey samples adulterated with sugar syrup. There are also examples of the efficient usage of combined VIS and NIR spectra (VIS–NIR) for analysis of honey adulteration: (i) Ferreiro-González et al. [12] used VIS–NIR spectra in combination with HCA, PCA, and linear discriminant analysis (LDA) for the discrimination of honey adulterated with high-fructose corn syrup; (ii) Valinger et al. [13] applied UV–VIS–NIR spectra coupled with PLS and artificial neural networks (ANNs) for quantification of honey adulteration with high-fructose syrup; (iii) Raypah et al. [14] used VIS–NIR spectra coupled with PCA and PLS for discrimination and quantification of honey adulteration with distilled water, apple cider vinegar, and high-fructose syrup.
As described, most of the suitable dealings with honey adulteration are focused on the development of tools for fast and efficient discrimination of the adulterated samples and for quantification of added adulterants. However, there is limited information about the physical and chemical properties of honey samples after adulteration [13]. Therefore, the aim of this work was to develop PLS and ANN models for the detection and quantification of acacia honey adulteration with glucose syrup, and also to develop PLS and ANN models to describe the physical (adulterant content, moisture content, conductivity, and total color change) and chemical (total phenolic content (TPC) and antioxidant activity measured by the Ferric Reducing Antioxidant Power method (FRAP) were used for quantitative analysis) characteristics of pure honey samples and prepared adulterations.

2. Materials and Methods

2.1. Materials

2.1.1. Honey Samples and Adulterant

Fifteen (15) samples of acacia (Robinia pseudoacacia) honey from the Krapina-Zagorje County region (in the northwest of Croatia) provided by members of the Krapina Beekeepers’ Association, from 2018, were investigated in this study. Glucose syrup (Food Colours, Piotrkow Trybulski, Poland) was used as the adulterant. All samples (honey and adulterant) were kept in glass vials in the dark at room temperature. All analyses were performed in 2018, when samples were gathered.

2.1.2. Chemicals

TPTZ (2,4,6-Tris(2-pyridyl)-s-triazine), gallic acid (98%), and iron (II) sulphate heptahydrate were obtained from Sigma-Aldrich Chemie (Steinheim, Germany). Hydrochloric acid (30%), iron (III) chloride hexahydrate, and sodium carbonate were from Gram-Mol d.o.o. (Zagreb, Croatia). Sodium acetate trihydrate was from J.T. Baker (Deventer, The Netherlands). Folin–Ciocalteu reagent was obtained from Kemika d.d. (Zagreb, Croatia), while acetic acid was from T.T.T. d.o.o. (Sveta Nedjelja, Croatia). Chemicals were of analytical reagent grade.

2.2. Methods

2.2.1. Preparation of Honey Adulterations

Glucose syrup and 15 samples of pure honey were combined in weight ratios of 10%, 20%, 30%, 40%, 50%, 60%, 70%, 80%, and 90% to create honey adulterations as previously described by Ferreiro-González et al. [12]. Pure honey (adulterated 0%) and pure glucose syrup (adulterated 100%) were included in the analysis. In all, 165 samples were created (11 different ratios per each sample). After the adulterant was added, the samples were maintained at 35 °C for 24 h while periodically being manually mixed to ensure homogeneity prior to testing.

2.2.2. Moisture Content

A refractometer [13] was used to test the moisture content (ATC, Eustisa, FL, USA). The results of the triplicate moisture content measurements were presented as the average value ± standard deviation.

2.2.3. Conductivity

Using a Seven Compact conductometer (Mettler Toledo, Schwerzenbach, Switzerland), the conductivity of samples of pure honey and prepared adulterated samples was evaluated. Aqueous solutions of the honey samples were made by combining 2 g of the sample with 8 mL of distilled water at room temperature for conductivity measurements [13]. Triplicate conductivity measurements were presented as the average value ± standard deviation.

2.2.4. Color Measurements

The color of all samples (pure honey samples as well as prepared adulterations and pure honey) was determined using a PCE-CSM3 colorimeter (PCE Instruments, Meschede, Germany) [13]. Based on the color information (Hunter’s color coordinates were used) of pure honey samples (for each individual sample) as the reference, the total color change (△E) (Equation (1)) was determined to characterize how the color of the honey samples changed when different amounts of adulterant were added.
Δ E = ( L L 0 ) 2 + ( a a 0 ) 2 + ( b b 0 ) 2
where L0, a0, and b0 values were determined for pure honey samples (control samples) and L, a, and b values were determined for the prepared adulterations. The color measurements were conducted in triplicate, and the results were expressed as the average value ± standard deviation.

2.2.5. Total Polyphenolic Content Measurement

Using a customized approach proposed by Beratta et al. [15], the total polyphenolic content of the pure honey samples and honey adulterations was assessed spectrophotometrically using the Folin–Ciocalteu reagent and a honey sugar analog of honey served as the control sample. A sugar analog of honey made of fructose (40%), glucose (30%), maltose (2%), and sucrose (2%) was used to decrease potential interference of the primary sugar elements in honey with the analytical procedure. In addition, 30% aqueous solutions of pure honey and honey adulterations were used for TPC measurements.
The following ingredients were combined and stirred for two minutes: 100 µL of honey aqueous solution (30%), equal to 10 mg of pure honey; 1 mL of 10% Folin–Ciocalteu reagent solution; 1 mL of 7.5% sodium carbonate solution. After being kept in the dark for 30 min, the absorbance of the prepared samples was measured at 760 nm. TPC was calculated as mg of gallic acid (GAE) per kilogram of honey. TPC measurements were performed in triplicate and the results were expressed as the average value ± standard deviation.

2.2.6. Antioxidant Activity Measurement by the Ferric Reducing Antioxidant Power Method

The FRAP method was used to quantitatively evaluate the antioxidant activity (AOX) of the pure honey samples and honey adulterations in accordance with the approach described by Benzie and Strain [16]. In addition, 50 µL of 30% honey aqueous solution and 450 mL of 37 °C-heated FRAP reagent were combined. Then, 0.3 mol/L of acetate buffer, 0.01 mol/L of TPTZ solution, and 0.02 mol/L of an aqueous solution of iron (III) chloride hexahydrate were previously mixed in a ratio of 10:1:1 to obtain the FRAP reagent. After being kept in the dark for 10 min, the produced samples’ absorbances were measured at 593 nm. A sugar analog of the honey was used as the blank sample. The antioxidant activity of the samples was expressed as mmol of FeSO4·7H2O of a 30% honey aqueous solution. Measurements were performed in triplicate and results were expressed as the average value ± standard deviation.

2.2.7. NIR Spectra Measurement

NIR spectra were gathered using the NIR spectrophotometer NIR-128L-1.7-USB/6.25/50 μm (Control Development, South Bend, IN, USA) with a halogen light source (HL-2000) and installed Control Development software Spec32 (v.1.32, Control Development, South Bend, IN, USA). Spectra were gathered in the wavelength range of 904–1699 nm. For every sample, three consecutive spectra were recorded across the entire spectral range.

2.2.8. Statistical Analysis

Average values and standard deviations were estimated using Statistica v.13.0 software (Tibco, Palo Alto, CA, USA)

2.2.9. NIR Spectra Pre-Processing and Data Modeling

Pre-processing of NIR spectra in the wavelength ranges of 904–962 nm and 1400–1699 nm was performed using the Unscrambler software (Version X 10.1. CAMO AS, Oslo, Norway). The efficiency of the following pre-processing methods was tested using: (i) raw spectra, (ii) first-order Savitzky–Golay derivative (SG1), (iii) standard normal variate (SNV), (iv) multiplicative scatter corrections (MSCs), (v) first-order Savitzky–Golay derivative followed by standard normal variate (SG1 + SNV), and (vi) first-order Savitzky–Golay derivative followed by multiplicative scatter corrections (SG1 + MSC). After pre-processing, Principal Component Analysis (PCA) was performed using the Unscrambler software in order to find similarities and differences across samples.
The potential of using Partial Least Squares (PLS) regression models for the prediction of adulterant content, moisture content, conductivity, total color change, total phenolic content, and antioxidant activity measured by the FRAP method of pure and adulterated honey samples based on NIR spectra in the wavelength range of 904–962 nm and 1400–1699 nm was estimated using the Unscrambler X software. Raw and pre-processed spectra were analyzed separately. The performance of the developed models was estimated based on: (i) the coefficients of determination for calibration (R2cal) and cross-validation (R2cval), (ii) root-mean-square error for calibration (RMSEC) and cross-validation (RMSECV), (iii) standard error for calibration (SEC) and cross-validation (SECV), (iv) average value of the difference between predicted and measured values (Bias), and (v) ratio of predicted deviation (RPD) and range error ratio (RER).

2.2.10. Artificial Neural Networks Modeling

Based on the PLS performance, an optimal pre-processing method was selected for artificial neural network modeling using Statistica v.13.0 software (Tibco, Palo Alto, CA, USA). Multiple-Layer Perceptron networks (MLP networks), which include an input layer, a hidden layer, and an output layer, were developed to simultaneously predict: (i) adulterant content, moisture content, and total color change; (ii) conductivity, total polyphenolic content, and antioxidant activity measured by the FRAP method of pure honey samples and the prepared adulteration based on the NIR spectra. ANN models include five neurons in the input layer, each representing one of the first five PCA variables. The first five principal components, which together represent more than 99.99% of data variability, were used as the ANN inputs. Identity, Logistic, Hyperbolic tangent, and Exponential were among the options selected at random to serve as the hidden activation function and output activation function. For the hidden layer, the MLP chooses a random number of neurons between 3 and 11.
ANN modeling was performed using data matrix dimensions of 165 × 8: 165 rows representing 15 pure honey samples, 135 honey adulterations, and 15 pure adulterant samples. Here, 8 columns included 5 PCA coordinates (factors) and 3 columns included the analyzed model outputs. Data were randomly divided by the software into three groups for the ANN modeling: 70% for network training, 15% for network testing, and 15% for model validation. There were 1000 networks created for each group of outputs. The back-error propagation approach was used for ANN training. The performance of the proposed ANN models was estimated based on R2 and Root-Mean-Squared Error (RMSE) values for training, test, and validation.

3. Results and Discussion

3.1. Effect of the Adulterant Addition on Physical and Chemical Properties of the Honey Samples

According to the European Commission [17], the European Union is the second world producer of honey, with an average production of around 218,000 t in 2021, which is a slight decrease compared to 2018 when 238,000 t was produced. The year 2018 was selected as the samples analyzed in this work originated from 2018. Croatia contributed 7400 t of total EU honey production in 2018 [17]. In this work, acacia honey samples were adulterated and analyzed because they are the most abundant type of honey in the northwest part of Croatia.
In this work, moisture content, conductivity, total color change, total phenolic content, and antioxidant activity measured by the FRAP method of acacia honey samples adulterated with glucose syrup were analyzed (Figure 1). The results showed that the average moisture content of pure honey samples was 16.93 ± 0.67% (Figure 1a). Similar results were presented by Denžić Lugomer et al. [18] for Croatian acacia honey (moisture content 16.40 ± 1.11%) and Uršulin-Trstenjak et al. [19] for acacia honey from the northwest part of Croatia (moisture content 16.78 ± 1.03%). The addition of glucose syrup reduced the moisture content slightly to around 13.40 ± 0.71% when 90% of the adulterant was added. As presented in Figure 1b, the addition of glucose syrup reduced the conductivity from 170.77 ± 17.82 µS/cm (0%) to 17.83 ± 0.09 µS/cm (100%) with an almost linear trend, opposite to the results obtained by Valinger et al. [13] where the addition of high-fructose syrup to acacia honey resulted in a conductivity increase. For Croatian acacia honey samples analyzed by Uršulin-Trstenjak et al. [19], the conductivity was 150.00 ± 30.00 µS/cm, and for acacia honey samples analyzed by Šarić et al. [20], the conductivity was 200.00 ± 59.00 µS/cm. Yakubu et al. [21] described conductivity as a frequently used method in routine honey quality control and it is considered an effective standard for assessment of the botanical origin and purity of honey. In addition, Kropf et al. [22] stated that the bright color of honey corresponds to lower conductivity in comparison to dark-colored honeys, which is in agreement with the results presented in this work.
The addition of glucose syrup results in samples lightening, i.e., an increase in L coordinate compared to pure honey samples. The total color change (Figure 1c) increased from 0.7 (10% of adulterant) to 2.28 (90% of adulterant) with an increasing amount of adulterant added to the sample.
Color assessment of honey based on visual comparison or spectrophotometric measurements has been widely utilized as an additional method for determination of the botanical origin of the honey [23] and can represent a good method of preliminary control of honey adulteration. Consumers place a high value on the appearance of honey. Honey’s color is a sensory feature that changes across different varieties of honey and is affected by chemical factors such as mineral concentration and polyphenol level [24]. Furthermore, analysis of the chemical properties (TPC and AOX) of the prepared adulterants revealed that the addition of adulterant had a negative effect on both TPC and FRAP (Figure 1d,e). The chemical compositions of honey vary significantly depending on the source of flora from which honey is collected and the geographical structure [25]. Previously analyzed acacia honey samples from Croatia measured different concentrations of TPC and AOX depending on the year and region. For example, Krpan et al. [26] obtained TPC = 43.55 ± 6.45 mgGAE/kg and FRAP = 72.87 ± 15.44 µM Fe(II) for acacia samples from Northwest Croatia. Šarić et al. [27] obtained TPC = 86.26 ± 8.34 mgGAE/kg for acacia honey from Northwest Croatia, while Bešlo et al. [28] measured TPC = 186 ± 36 mgGAE/kg for acacia honey samples from East Croatia. The results confirm the statement that the physicochemical parameters of honey, such as pH, water content, sugar composition, color, acidity, and electrical conductivity, represent quality indicators that characterize each individual variety of honey as well as the origin and season [29].

3.2. NIR Spectra of Honey Aduterations

Near-infrared spectra of pure honey samples and all prepared adulterants were recorded in the wavelength range from 904 to 1699 nm. Raw spectra of all samples are present at Figure 2a. Spectra analysis was performed using the wavelength range from 904 to 962 nm and from 1400 to 1699 nm, corresponding to the C-H third overtone and water first overtone, respectively. The effect of the NIR spectra pre-processing methods on the sample grouping was analyzed. As mentioned before, the (i) first-order Savitzky–Golay derivative, (ii) standard normal variate, (iii) multiplicative scatter corrections, (iv) first-order Savitzky–Golay derivative followed by standard normal variate, and (v) first-order Savitzky–Golay derivative followed by multiplicative scatter corrections were used. It can be noticed that MSC pre-treatment (Figure 2b) ensured the samples grouping in three groups as follows: (i) pure honey samples, (ii) adulterations, and (iii) pure adulterant. Furthermore, it can be observed that the first two PC contributed to over 90% of the total variance. The wavelengths that contributed the most to the first three principal components are shown in Figure 2c. Adulterations were prepared using 15 different honey samples and, therefore, it was not possible for PCA to discriminate the amount of adulteration in all parallels (Figure 2b). To overcome that problem, the average spectra for each specific amount of adulterant were calculated, as previously described by Ferreiro-Gonzelez et al. (2018), where the average UV–VIS–NIR spectra were used for detection of honey adulteration. The PCA of the average NIR spectra pre-processed using the MSC method is given in Figure 2d. The specific grouping of the samples with an increase in the amount of added adulterant can be noticed. It can be seen that the addition of even 10% of the adulterant had a significant effect on the sample position on the PC score plot. As for the individual samples (Figure 2b), the first two PCs for average spectra contributed to around 99% of the total variance. The wavelengths that contributed the most to the first three principal components of the average NIR spectra are shown in Figure 2e. The presented results indicate that NIR spectra coupled with PCA can be used for honey sample adulteration detection and are consistent with the available literature. For example, El Orche et al. [30] presented an efficient application of fluorescence spectroscopy and PCA for discrimination of the three oil classes, Vitalis et al. [31] applied PCA for analysis of NIR spectra for adulterated tomato paste, while Bodor et al. [32] analyzed the effect of the heat treatment on the spectral patterns of the unifloral honeys using PCA.

3.3. PLS Modeling of Honey Adulteration Properties

Given that the addition of adulterants to food products lowers their quality and can harm human health [33], it is critical to have an efficient tool that can distinguish the adulterated product from the unadulterated and quantify the amount of the added adulterant. In this work, PLS regression was used to quantify the adulteration of the honey samples based on the NIR spectra and to quantify the effect of the adulterant addition on physical and chemical properties of the samples prepared with glucose syrup as the adulterant. PLS is a method that increases the correlation between spectral data and the parameters to be quantified. PLS latent variables (LVs) indicate significant changes in the spectral data while also being significant in the assessment of the important parameters [34]. PLS models were developed using preselected NIR spectra ranges and using different spectra pre-processing methods. When working with NIR spectra, random noise and systematic variations in the base line can cause problems during analysis, but they can be overcome by different pre-processing techniques such as SNV, MSC, and SG [35]. The models developed in this work were evaluated using cross-validation. The best model among the created models was chosen using the coefficient of determination (R2), standard error of calibration (SEC), and standard error of cross-validation (SECV). The model selected as the best, based on the cross-validation, was further used for the prediction of the analyzed variable value using an independent set of data. The results of PLS models for prediction are given in Table 1.
As indicated in Table 1, some of the used pre-processing methods improved the results of PLS modeling when compared to raw spectra, while others did not contribute to the model performance. For prediction of the added adulterant amount, moisture of the samples, and total color change, the best performance was obtained using the multiplicative scatter corrections (MSCs). Raw spectra were the best selection for prediction of conductivity, total phenolic content, and antioxidant activity as determined by the FRAP method. Results also showed that the highest R2pred was obtained for the PLS model developed for the prediction of the amount of the adulterant. The PLS model selected for prediction of the adulterant amount achieved R2cal of 0.8978, RMSEC of 10.1552%, R2cval of 0.8557, RMSECV of 12.2011%, R2pred of 0.8660, RMSEP of 11.4736%, Bias of 0.7141, RPD of 2.7601%, and RER of 8.7157%. Oppositely, the lowest R2pred of 0.2101 was obtained for the PLS model developed for prediction of the total color change. The PLS model selected for prediction of the total color change achieved R2cal of 0.3213, RMSEC of 0.6728, R2cval of 0.2292, RMSECV of 0.7359, R2pred of 0.2101, RMSEP of 0.8631, Bias of −0.1893, RPD of 1.0389, and RER of 4.3934. In comparison to the results presented by Valinger et al. [13], it can be noticed that PLS modeling was more efficient for the prediction of honey adulteration properties prepared with high-fructose syrup. The RPD and RER statistics were also considered in the external validation set in order to evaluate the prediction models’ usability on an independent dataset. According to Parrini et al. [36], the model can be considered sufficient for screening if RPD is between 1.5 and 2.5. Moreover, RER values between 3 and 10 and higher than 10 indicate moderate and good practical utility, respectively [37]. Based on those ranges, the PLS model for prediction of the amount of added adulterant (RPD of 2.7601; RER of 8.7157), the model for prediction of the moisture content (RPD of 1.7401; RER of 7.7128), and the model for prediction of the conductivity (RPD of 1.9668; RER of 7.3805) can be considered sufficient for screening and can be moderately used in practice. Other developed PLS models achieved even lower values for RPD and RER and can be considered as nonreliable and should be improved.
Based on available literature data, NIR spectroscopy coupled with PLS modeling has been extensively used for fast and efficient food adulteration detection. Pereira et al. [38] proposed PLS models for the detection of simulated goat milk adulteration with cow milk and quantification of the fat and protein content in the samples based on NIR spectra. Similarly, Mabood et al. [39] developed a PLS model that achieved an R2 of 94% and an RMSEC of 1.10% for the quantification of camel milk adulteration with goat milk in the range from 0% to 20%. Basri et al. [40] employed PLS regression for the detection and quantification of palm oil adulteration with lard based on NIR and obtained an R2 of approximately 0.99. Furthermore, Alamprese et al. [34] applied PLS to discriminate the adulteration of minced beef with turkey meat using FT-NIR. Cocchi et al. [41] explored the possibility of using NIR to quantify the degree of adulteration of durum wheat flour with common wheat flour. Amirvaresi et al. [42] and Shawky et al. [43] utilized PLS regression for estimation of the adulteration in saffron samples based on NIR and MIR spectroscopy, while Genis et al. [44] developed PLS using NIR spectra to predict green pea and spinach adulteration rates with R2 and root-mean-square error of prediction (RMSEP) values, which were found to be 0.9957 and 7.87 for green pea and 0.9968 and 4.69 for spinach, respectively. Wang et al. [45] developed a PLS regression model using raw NIR spectra for detection of quinoa flour adulteration by wheat flour.

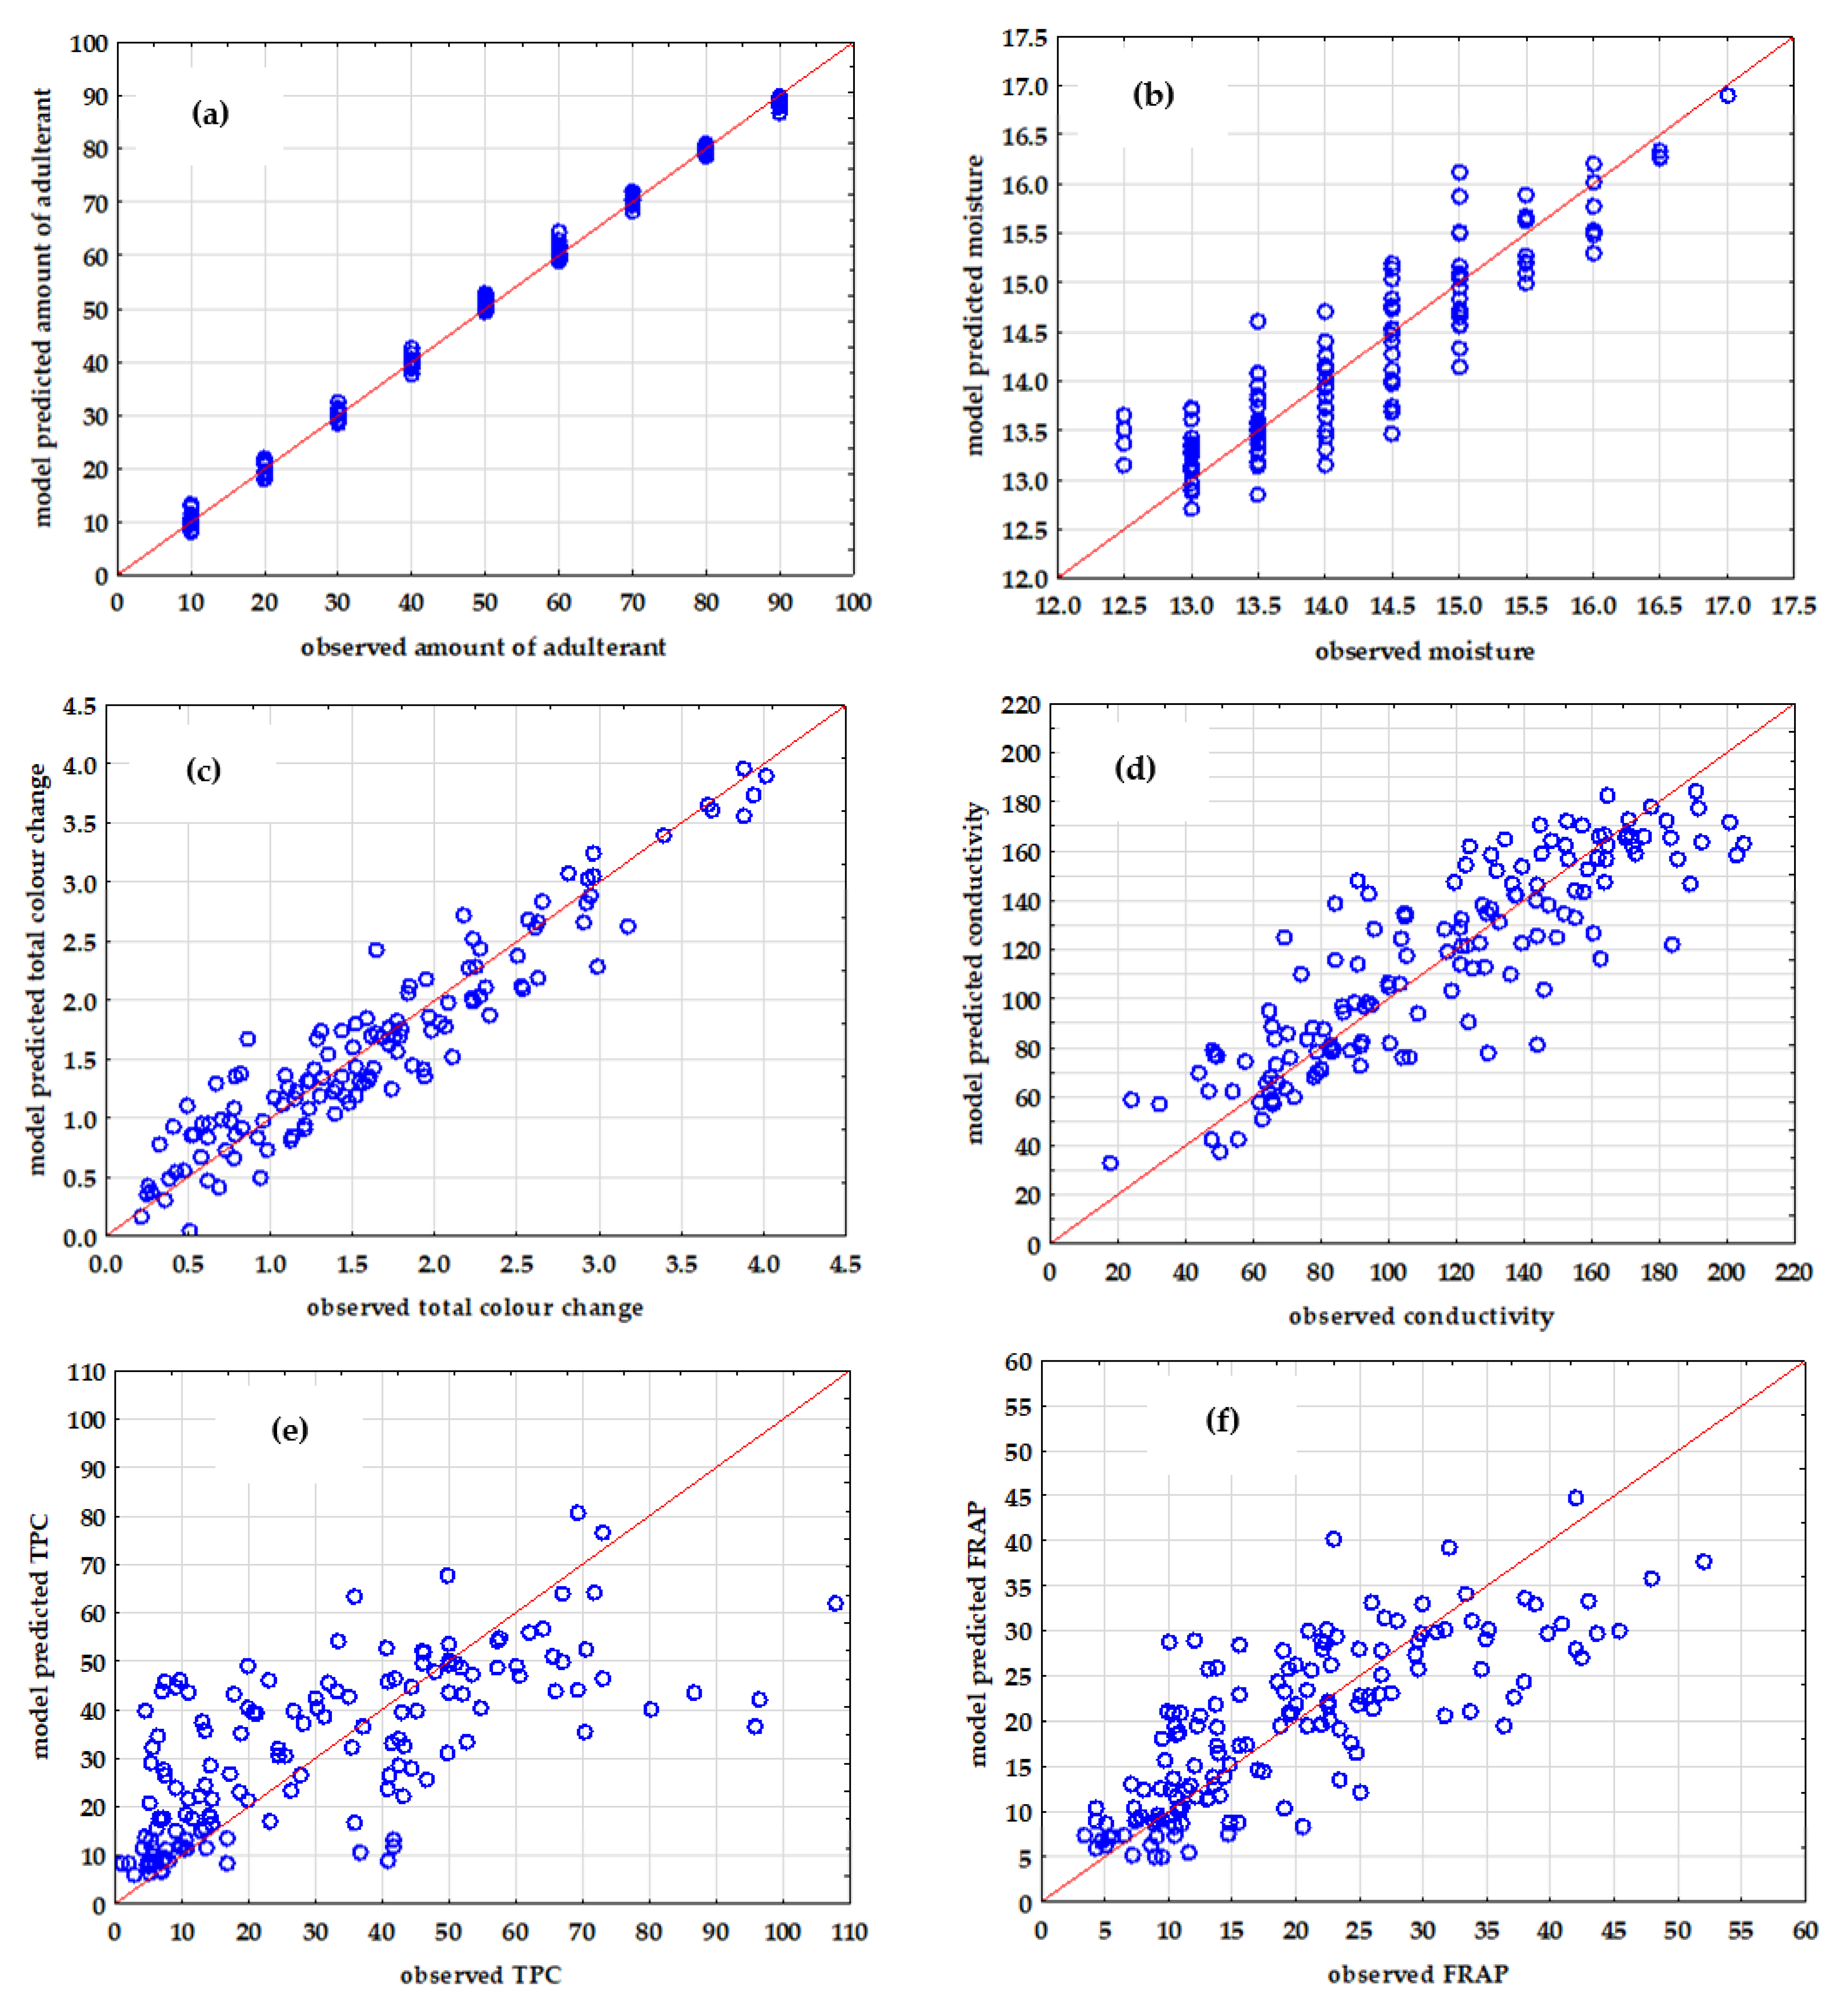
3.4. ANN Modeling of Honey Adulteration Properties

Partial Least Squares linear regression models are not always successful in accurately predicting parameters that are not connected to a particular compound or class of related compounds (e.g., different sugar molecules for sweetness), but rather to a complex combination of factors (e.g., water content) [46]. In these situations, it has been demonstrated that using nonlinear models such as artificial neural networks (ANNs) to create the best possible prediction model is preferable [13,47,48]. In this work, two types of ANNs were developed. The first one was for simultaneous prediction of the amount of adulterant, moisture content, and total color change, while the second was for simultaneous prediction of conductivity, TPC, and FRAP. ANN output variables were grouped according to the results of PLS modeling where MSC pre-treatment of NIR spectra ensured the best prediction of adulterant, moisture content, and total color change, while the prediction of conductivity, TPC, and FRAP was the most efficient using raw NIR spectra. Selected networks are given in Table 2.
The ANNs applicability was estimated based on the coefficients of determination for training, test, and validation and the root-mean-square errors for training, test, and validation. It can be noticed that ANNs developed for the prediction of conductivity, TPC, and FRAP achieved a higher R2 and lower RMSE at all three levels compared to ANNs for the prediction of adulterant, moisture content, and total color change. The optimal ANN architecture was selected by also taking into account the number of neurons in the hidden layer (fewer neurons in hidden layer mean simpler network). For simultaneous prediction of the amount of adulterant, moisture content, and total color change of pure honey samples and prepared adulterations, MLP 5-8-3 was selected. The selected ANN was characterized by 5 neurons in the input layer, 8 neurons in the hidden layer, and 3 neurons in the output layer. The hidden activation function was Tanh, while the output activation function was the Identity function. R2training was 0.9625, RMSEtraining was 0.0748, R2test was 0.9215, RMSEtraining was 0.0777, R2validation was 0.9202, and RMSEvalidation was 0.0551 for the described ANN. MLP 5-9-3 was selected for the simultaneous prediction of conductivity, TPC, and FRAP of pure honey samples and prepared adulterations. The selected ANN was characterized by 5 neurons in the input layer, 9 neurons in the hidden layer, and 3 neurons in the output layer. The hidden activation function was the logistic function, and the output activation function was the exponential function. The described ANN achieved R2training of 0.8401, RMSEtraining of 1.4883, R2test of 0.8323, RMSEtraining of 1.5301, R2validation of 0.7254, and RMSEvalidation of 1.5553. As presented in Table 3 and in Figure 3, the first ANN was the most efficient for the prediction of adulterant amount (R2training = 0.9991, RMSEtraining = 1.2010%, R2test = 0.9987, RMSEtraining = 1.4554%, R2validation = 0.9987, and RMSEvalidation = 1.9674%) (Figure 3a), while the second ANN was the most efficient for the prediction of conductivity (R2training = 0.9396, RMSEtraining = 19.7537 µS/cm, R2test = 0.9130, RMSEtest = 20.9560 µS/cm, R2validation = 0.8994, and RMSEvalidation = 21.4561 µS/cm) (Figure 3d).
Comparing the obtained results with those achieved using PLS modeling, it can be noticed that ANN modeling was more efficient for prediction of adulterated honey properties based on NIR spectra, which was also previously presented by Son et al. [49] for rice sample analysis, Basile et al. [46] for grape texture prediction, and by Chen et al. [50] for identification of tea varieties.

4. Conclusions

The applicability of NIR spectroscopy was assessed for the detection and quantification of honey adulteration and analysis of the physical and chemical properties of prepared adulterations. Multiplicative scatter corrections of NIR spectra resulted in a distinctive grouping of samples in pure honey samples, honey adulterations, and pure adulteration in the PCA score plot. PLS models created for prediction of the amount of added adulterant, moisture content, and conductivity can be considered adequate for screening and have a limited practical application. Furthermore, the developed ANN models achieved R2validation over 0.86 for all analyzed outputs (adulterant content, moisture content, conductivity, total color change, total phenolic content, and antioxidant activity measured by the FRAP method) and can be considered as an efficient tool for honey adulteration quantification.

Author Contributions

Conceptualization, A.J.T.; methodology, M.B.; validation, T.J. and D.V.; formal analysis, L.L. and F.G.; investigation, L.L. and F.G.; writing—original draft preparation, M.B., T.J. and D.V.; writing—review and editing, J.G.K. and A.J.T.; supervision, J.G.K. All authors have read and agreed to the published version of the manuscript.

Funding

This research received no external funding.

Institutional Review Board Statement

Not applicable.

Informed Consent Statement

Not applicable.

Data Availability Statement

Not applicable.

Acknowledgments

The authors would like to thank members of the Beekeepers’ Association Krapina for providing the honey samples.

Conflicts of Interest

The authors declare no conflict of interest.

References

  1. Skaff, W.; El Hajj, R.; Hanna-Wakim, L.; Estephan, N. Detection of adulteration in honey by infrared spectroscopy and chemometrics: Effect on human health. J. Food Process. Preserv. 2021, 2021, e15438. [Google Scholar] [CrossRef]
  2. Soares, S.; Amaral, J.S.; Oliveira, M.B.P.P.; Mafra, I. A Comprehensive review on the main honey authentication issues: Production and origin. Compr. Rev. Food Sci. Food Saf. 2017, 16, 1072–1100. [Google Scholar] [CrossRef] [PubMed] [Green Version]
  3. Guler, A.; Bakan, A.; Nisbet, C.; Yavuz, O. Determination of important biochemical properties of honey to discriminate pure and adulterated honey with sucrose (Saccharum officinarum L.) syrup. Food Chem. 2007, 105, 1119–1125. [Google Scholar] [CrossRef]
  4. Ruiz-Navajas, Y.; Viuda-Martos, M.; Fernandez-Lopez, J.; Zaldivar-Cruz, J.M.; Kuri, V.; Perez-Alvarez, J.A. Antioxidant activity of artisanal honey from Tabasco, Mexico. Int. J. Food Prop. 2011, 14, 459–470. [Google Scholar] [CrossRef] [Green Version]
  5. Orian, M.; Ropciuc, S.; Paduert, S. Honey adulteration detection using Raman spectroscopy. Food Anal. Methods 2018, 11, 959–968. [Google Scholar] [CrossRef]
  6. Siddiqui, A.J.; Musharraf, S.G.; Iqbal Choudhary, M.; Rahman, A.-U. Application of analytical methods in authentication and adulteration of honey. Food Chem. 2016, 217, 687–698. [Google Scholar] [CrossRef]
  7. Naila, A.; Flint, S.H.; Sulaiman, A.; Ajit, A.; Weeds, Z. Classical and novel approaches to the analysis of honey and detection of adulterants. Food Control 2018, 90, 152–165. [Google Scholar] [CrossRef]
  8. Başar, B.; Özdemir, D. Determination of honey adulteration with beet sugar and corn syrup using infrared spectroscopy and genetic-algorithm-based multivariate calibration. J. Sci. Food Agric. 2018, 98, 5616–5624. [Google Scholar] [CrossRef] [PubMed]
  9. Elhamdaoui, O.; El Orche, A.; Cheikh, A.; Mojemmi, B.; Nejjari, R.; Bouatia, M. Development of fast analytical method for the detection and quantification of honey adulteration using vibrational spectroscopy and chemometrics tools. J. Anal. Methods Chem. 2020, 2020, 8816249. [Google Scholar] [CrossRef] [PubMed]
  10. Rios-Corrpio, M.A.; Rojas-López, M.; Delgado-Macuil, R. Analysis of adulteration in honey with standard sugar solutions and syrups using attenuated total reflectance-Fourier transform infrared spectroscopy and multivariate methods. CyTA-J. Food 2012, 10, 119–122. [Google Scholar] [CrossRef]
  11. Kumaravelu, C.M.; Gopal, A. Detection and quantification of adulteration in honey through near infrared spectroscopy. Int. J. Food Prop. 2015, 18, 1930–1935. [Google Scholar] [CrossRef]
  12. Ferreiro-González, M.; Espada-Bellido, E.; Guillén-Cueto, L.; Palma, M.; Barroso, C.G.; Barbero, G.F. Rapid quantification of honey adulteration by visible-near infrared spectroscopy combined with chemometrics. Talanta 2018, 188, 288–292. [Google Scholar] [CrossRef] [PubMed]
  13. Valinger, D.; Longin, L.; Grbeš, F.; Benković, M.; Jurina, T.; Gajdoš Kjusurić, J.; Jurinjak Tušek, A. Detection of honey adulteration—The potential of UV-VIS and NIR spectroscopy coupled with multivariate analysis. LWT 2021, 145, 111316. [Google Scholar] [CrossRef]
  14. Raypah, M.E.; Omar, A.F.; Muncan, J.; Zulkurnain, M.; Abdul Najib, A.R. Identification of stingless bee honey adulteration using visible-near infrared spectroscopy combined with aquaphotomics. Molecules 2022, 27, 2324. [Google Scholar] [CrossRef] [PubMed]
  15. Beratta, G.; Granata, P.; Ferrero, M.; Orioli, M.; Maffei Facino, R. Standardization of antioxidant properties of honey by a combination of spectrophotometric/fluorimetric assays and chemometrics. Anal. Chim. Acta 2005, 533, 185–191. [Google Scholar] [CrossRef]
  16. Benzie, I.F.; Strain, J.J. The ferric reducing ability of plasma (FRAP) as a measure of “antioxidant power”: The FRAP assay. Anal. Biochem. 1996, 239, 70–76. [Google Scholar] [CrossRef] [Green Version]
  17. Natural Apiculture Programs. Available online: https://agriculture.ec.europa.eu/farming/animal-products/honey/national-apiculture-programmes_en (accessed on 15 July 2022).
  18. Denžić Lugomer, M.; Pavliček, D.; Kiš, M.; Končurat, A.; Majnarić, D. Quality assessment of different types of Croatian honey between 2012 and 2016. Vetrinaska Stanica 2017, 48, 93–99. [Google Scholar]
  19. Uršulin-Trstenjak, N.; Puntarić, D.; Levanić, D.; Gvozdić, V.; Pavlek, Ž.; Puntarić, A.; Puntarić, E.; Puntarić, I.; Vidosavljević, D.; Lasić, D.; et al. Pollen, physicochemical, and mineral analysis of croatian acacia honey samples: Applicability for identification of botanical and geographical origin. J Food Qual. 2017, 2017, 8538693. [Google Scholar] [CrossRef]
  20. Šarić, G.; Mtković, D.; Hruškar, M.; Vahčić, N. Characterisation and classification of Croatian honey by physicochemical parameters. Food Technol. Biotechnol. 2008, 46, 355–367. [Google Scholar]
  21. Yakubu, A.; Sahabi, S.; Sani, G.D.; Faruku, S. Determination of sugar adulteration in honey using conductivity meter and pH meter. Res. J. Environ. Sci. 2021, 11, 50–57. [Google Scholar]
  22. Kropf, U.; Jamnik, M.; Bertoncelj, J.; Golob, T. Linear regression model of the ash mass fraction and electrical conductivity for Slovenian honey. Food Technol. Biotechnol. 2008, 46, 335–340. [Google Scholar]
  23. Popov-Raljić, J.; Arsić, N.; Zlatković, B.; Basarin, B.; Mladenović, M.; Laličić-Petronijević, J.; Ivkov, M.; Popov, V. Evaluation of color, mineral substances and sensory uniqueness of meadow and acacia honey from Serbia. Rom. Biotechnol. Lett. 2015, 20, 10784–10799. [Google Scholar]
  24. Pauliuc, D.; Dranca, F.; Oroian, M. Antioxidant Activity, total phenolic content, individual phenolics and physicochemical parameters suitability for Romanian honey authentication. Foods 2020, 9, 306. [Google Scholar] [CrossRef] [Green Version]
  25. Aker, D.; Nisbet, C. Antioxidant activities, total phenolic and flavonoid contents of honey collected from different botanical origins. Ankara Üniv. Vet. Fak. Derg. 2020, 67, 133–136. [Google Scholar] [CrossRef]
  26. Krpan, M.; Marković, K.; Šarić, G.; Skoko, B.; Hruškar, M.; Vahčić, N. Antioxidant activities and total phenolics of acacia honey. Czech J. Food Sci. 2009, 27, S245–S247. [Google Scholar] [CrossRef]
  27. Šarić, G.; Marković, K.; Major, N.; Krpan, M.; Uršulin-Trstenjak, N.; Hruškar, M.; Vahčić, N. Changes of antioxidant activity and phenolic content in acacia and multifloral honey during storage. Food Technol. Biotechnol. 2012, 50, 434–441. [Google Scholar]
  28. Bešlo, D.; Bešlo, K.; Agić, D.; Vikić-Topić, D.; Lučić, B. Variations of total phenolic content in honey samples caused by different calibration lines. Croat. Chem. Acta 2020, 93, 367–375. [Google Scholar] [CrossRef]
  29. Boussaid, A.; Chouaibi, M.; Rezig, L.; Hellal, R.; Donsì, F.; Ferrari, G.; Hamdi, S. Physicochemical and bioactive properties of six honey samples from various floral origins from Tunisia. Arab. J. Chem. 2018, 11, 265–274. [Google Scholar] [CrossRef] [Green Version]
  30. El Orche, A.; Bouatia, M.; Mbarki, M. Rapid analytical method to characterize the freshness of olive oils using fluorescence spectroscopy and chemometric algorithms. J. Anal. Methods Chem. 2020, 2020, 8860161. [Google Scholar] [CrossRef]
  31. Vitalis, F.; Zaukuu, J.-L.Z.; Bodor, Z.; Aouadi, B.; Hitka, G.; Kaszab, T.; Zsom-Muha, V.; Gillay, Z.; Kovacs, Z. Detection and quantification of tomato paste adulteration using conventional and rapid analytical methods. Sensors 2020, 20, 6059. [Google Scholar] [CrossRef]
  32. Bodor, Z.; Benedek, C.; Aouadi, B.; Zsom-Muha, V.; Kovacs, Z. Revealing the effect of heat treatment on the spectral pattern of unifloral honeys using aquaphotomics. Molecules 2022, 27, 780. [Google Scholar] [CrossRef] [PubMed]
  33. Thangaraju, S.; Modupalli, N.; Natarajan, V. Food adulteration and its impacts on our health/balanced nutrition. In Food Chemistry: The Role of Additives, Preservatives and Adulteration; Sen, M., Ed.; John Wiley & Sons, Inc.: Hoboken, NJ, USA, 2021; pp. 189–216. [Google Scholar] [CrossRef]
  34. Alamprese, C.; Amigo, J.M.; Casiraghi, E.; Engelsen, S.B. Identification and quantification of turkey meat adulteration in fresh, frozen-thawed and cooked minced beef by FT-NIR spectroscopy and chemometrics. Meat Sci. 2016, 121, 175–181. [Google Scholar] [CrossRef]
  35. Krepper, G.; Romeo, F.; Fernandes, D.D.S.; Diniz, P.H.G.D.; de Araújo, M.C.U.; Di Nezio, M.S.; Pistonesi, M.F.; Centurión, M.E. Determination of fat content in chicken hamburgers using NIR spectroscopy and the Successive Projections Algorithm for interval selection in PLS regression (iSPA-PLS). Spectrochim. Acta A Mol. Biomol. Spectrosc. 2018, 189, 300–306. [Google Scholar] [CrossRef] [PubMed]
  36. Parrini, S.; Staglianò, N.; Bozzi, R.; Argenti, G. Can grassland chemical quality be quantified using transform near-infrared spectroscopy? Animals 2022, 12, 86. [Google Scholar] [CrossRef] [PubMed]
  37. Ortiz, A.; León, L.; Contador, R.; Tejerina, D. Near-Infrared Spectroscopy (NIRS) as a tool for classification of pre-sliced Iberian salchichón, modified atmosphere packaged (map) according to the official commercial categories of raw meat. Foods 2021, 10, 1865. [Google Scholar] [CrossRef] [PubMed]
  38. Pereira, E.V.S.; Fernandes, D.D.S.; de Araúju, M.C.A.; Diniz, P.H.G.D.; Maciel, M.I.S. Simultaneous determination of goat milk adulteration with cow milk and their fat and protein contents using NIR spectroscopy and PLS algorithms. LWT 2020, 127, 109427. [Google Scholar] [CrossRef]
  39. Mabood, F.; Jabeen, F.; Ahmed, M.; Hussain, J.; Al Mashaykhi, S.A.A.; Al Rubaiey, Z.M.A.; Farooq, S.; Boqué, R.; Ali, L.; Hussain, Z.; et al. Development of new NIR-spectroscopy method combined with multivariate analysis for detection of adulteration in camel milk with goat milk. Food Chem. 2017, 221, 746–750. [Google Scholar] [CrossRef]
  40. Basri, K.N.; Hussain, M.N.; Bakar, J.; Sharif, Z.; Khir, M.F.A.; Zoolfakar, A.S. Classification and quantification of palm oil adulteration via portable NIR spectroscopy. Spectroc. Acta A Mol. Biomol. Spectrosc. 2016, 173, 335–342. [Google Scholar] [CrossRef]
  41. Cocchi, M.; Durante, C.; Foca, G.; MArchetti, A.; Tassi, L.; Ulrici, A. Durum wheat adulteration detection by NIR spectroscopy multivariate calibration. Talanta 2006, 68, 1505–1511. [Google Scholar] [CrossRef]
  42. Amirvaresi, A.; Nikounezhad, N.; Amirahmadi, M.; Daraei, B.; Parastar, H. Comparison of near-infrared (NIR) and mid-infrared (MIR) spectroscopy based on chemometrics for saffron authentication and adulteration detection. Food Chem. 2021, 334, 128647. [Google Scholar] [CrossRef]
  43. Shawky, E.; El-Khair, M.A.; Selim, D.A. NIR spectroscopy-multivariate analysis for rapid authentication, detection and quantification of common plant adulterants in saffron (Crocus sativus L.) stigmas. LWT 2020, 122, 109032. [Google Scholar] [CrossRef]
  44. Genis, H.E.; Durina, S.; Boyaci, I.H. Determination of green pea and spinach adulteration in pistachio nuts using NIR spectroscopy. LWT 2021, 136, 110008. [Google Scholar] [CrossRef]
  45. Wang, Z.; Wu, Q.; Kamruzzamn, M. Portable NIR spectroscopy and PLS based variable selection for adulteration detection in quinoa flour. Food Control 2022, 138, 108970. [Google Scholar] [CrossRef]
  46. Basile, T.; Marsico, A.D.; Perniola, R. Use of artificial neural networks and NIR Spectroscopy for non-destructive grape prediction. Foods 2022, 11, 281. [Google Scholar] [CrossRef] [PubMed]
  47. Jurinjak Tušek, A.; Jurina, T.; Čulo, I.; Valinger, D.; Gajdoš Kljusurić, J.; Benković, M. Application of NIRs coupled with PLS and ANN modelling to predict average droplet size in oil-in-water emulsions prepared with different microfluidic devices. Spectroc. Acta A Mol. Biomol. Spectrosc 2022, 270, 120860. [Google Scholar] [CrossRef]
  48. Valinger, D.; Kušen, M.; Jurinjak Tušek, A.; Panić, M.; Jurina, T.; Benković, M.; Radojčić Redovniković, I.; Gajdoš Kljusurić, J. Development of near infrared spectroscopy models for the quantitative prediction of olive leaves bioactive compounds content. Chem. Biochem. Eng. Q. 2018, 32, 535–543. [Google Scholar] [CrossRef]
  49. Son, S.; Kim, D.; Choi, M.C.; Lee, J.; Kim, B.; Choi, C.M.; Kim, S. Weight interpretation of artificial neural network model for analysis of rice (Oryza sativa L.) with near-infrared spectroscopy. Food Chem. X 2022, 15, 100430. [Google Scholar] [CrossRef]
  50. Chen, Q.; Zhao, J.; Liu, M.; Cai, J. Nondestructive identification of tea (Camellia sinensis L.) varieties using FT-NIR spectroscopy and pattern recognition. Czech J. Food Sci. 2008, 26, 360–367. [Google Scholar] [CrossRef]
Figure 1. Average values of physical and chemical properties of pure honey samples and prepared glucose syrup adulterations: (a) moisture content, (b) conductivity, (c) total color change, (d) total phenolic content, and (e) antioxidant activity measured by FRAP method.
Separations 09 00312 g001
Figure 2. (a) NIR spectra of pure honey samples and prepared glucose syrup adulterations (N = 160); (b) PCA score plot of NIR spectra after MSC pre-processing (ο—0% of adulterant; ο—10–90% of adulterant; ο—100% of adulterant); (c) PCA loading plot after NIR spectra MSC pre-processing; (d) PCA score plot of average NIR spectra by adulterant amount after MSC pre-processing; (e) PCA loadings of average NIR spectra after MSC pre-processing.
Separations 09 00312 g002
Figure 3. Comparison between observed and predicted ANN models: (a) amount of adulterant, (b) moisture content, (c) total colour change, (d) conductivity, (e) total phenolic content, and (f) antioxidant activity measured by the FRAP method. (ο—experimental data).
Separations 09 00312 g003
Table 1. Applicability of PLS models for prediction of honey adulteration and physical and chemical properties of pure honey samples and prepared glucose syrup adulterations based on different NIR spectra pre-treatments (selected PLS models are marked bold).
PropertyPre-TreatmentR2calRMSECR2cvalRMSECVR2predRMSEPBiasRPDRER
Amount of adulterantNo0.853012.18060.806814.15800.823813.2365−0.19312.39257.5549
SG0.827613.19270.743116.09560.016957.029525.51420.55531.7535
SNV0.850512.28540.828613.32380.830212.9964−0.29642.43677.6944
MSC0.897810.15520.855712.20110.866011.47360.71412.76018.7157
SG-SNV0.841812.63880.774315.49180.095014.306923.27212.21356.9896
SG-MSC0.846412.45360.775815.26490.038238.822440.66120.81572.5758
moistureNo0.60390.75730.46090.92050.61260.7638−0.00201.62467.2008
SG0.54050.84490.40020.97610.04683.74263.53470.33161.4696
SNV0.60280.78550.40610.97390.62010.7564−0.00211.64057.2713
MSC0.65170.73560.59510.97290.66230.71310.00391.74017.7128
SG-SNV0.54890.83720.47440.91080.04593.45562.99320.35911.5916
SG-MSC0.61830.77010.47620.91040.115717.56818.72250.07060.3131
conductivityNo0.733326.46760.666729.88360.722225.3602−0.04271.96687.3805
SG0.721827.03300.637531.22930.038846.8494−4.66101.06473.9951
SNV0.728426.70880.698728.59520.719325.49360.13991.95657.3418
MSC0.727426.75630.679129.28070.716225.63560.08911.94577.3012
SG-SNV0.709927.60110.620132.00040.021661.852623.41370.80643.0261
SG-MSC0.739326.16590.6530.48760.053747.004511.11631.06123.9820
total colour changeNo0.24870.70780.16960.75390.10130.9191−0.16420.97564.1257
SG0.23320.71510.21750.74150.06971.2607−0.83170.71133.0078
SNV0.32220.67230.22570.73470.20980.8631−0.18881.03894.3934
MSC0.32130.67280.22920.73590.21010.8631−0.18931.03894.3934
SG-SNV0.22970.71670.18750.74010.01831.68521.39880.53212.2501
SG-MSC0.23000.71660.18770.73950.06454.34541.32220.20640.8726
TPCNo0.578715.10620.401618.13460.330819.89890.36181.16565.3772
SG0.616114.42030.446517.47670.180726.82912.67120.86453.9882
SNV0.586814.96030.404718.20620.211520.39650.21481.13725.2460
MSC0.587614.94650.366118.62340.319120.36720.31091.13885.2535
SG-SNV0.625514.24300.410418.14520.171026.57353.93640.87294.0266
SG-MSC0.566415.32440.375118.97770.224126.65042.93170.87034.0149
FRAPNo0.45157.66890.39408.78290.50157.7951−0.30051.41926.2365
SG0.39418.57290.33039.11630.023620.1556−16.79230.54892.4119
SNV0.51547.66700.40638.37260.48297.9384−0.23641.39366.1239
MSC0.60686.90560.47468.13350.40328.8715−0.59491.24705.4798
SG-SNV0.50237.76910.38128.73520.027737.877922.72380.29211.2834
SG-MSC0.50507.74830.40148.56610.080425.058719.62550.44151.9400
Table 2. Characteristics of ANNs selected for prediction of honey adulteration and physical and chemical properties of pure honey samples and prepared glucose syrup adulterations based on different NIR spectra pre-treatments (selected ANN models are marked bold).
Property/
Pre-Treatment
MLPTraining Perf./
Training Error
Test Perf./
Test Error
Validation Perf./
Validation Error
Hidden ActivationOutput Activation
Amount of adulterant-moisture-total colour change/
MSC
MLP 5-4-30.9434
0.1503
0.9306
1.9238
0.9232
1.9672
ExponentialExponential
MLP 5-10-30.9440
0.0858
0.9340
0.1142
0.9247
0.1186
ExponentialIdentity
MLP 5-7-30.9422
0.1112
0.9297
0.1476
0.9203
0.2004
ExponentialExponential
MLP 5-9-30.9617
0.1092
0.9354
0.1304
0.9056
0.1888
ExponentialExponential
MLP 5-8-30.9625
0.0748
0.9215
0.0777
0.9202
0.0851
TanhIdentity
conductivity TPC-FRAP/
No
MLP 5-5-30.8120
1.5222
0.8086
1.5611
0.7243
1.5771
LogisticIdentity
MLP 5-5-30.8222
1.4466
0.8104
1.5394
0.7384
1.5773
TanhIdentity
MLP 5-11-30.8104
1.4836
0.8298
1.5460
0.7268
1.6095
LogisticIdentity
MLP 5-6-30.7968
1.5257
0.8427
1.5606
0.7303
1.5814
LogisticLogistic
MLP 5-9-30.8401
1.4883
0.8323
1.5301
0.7254
1.5553
LogisticExponentail
Table 3. Correlation coefficients of ANN models.
ANNOutputR2training
RMSEtraining
R2test
RMSEtest
R2validation
RMSEvalidation
MLP 5-4-3amount of adulterant0.9991
1.2010
0.9987
1.4554
0.9987
1.9674
Moisture0.9116
0.2087
0.9072
0.5663
0.8503
0.6017
total colour change0.9505
0.2364
0.9431
0.3623
0.9261
0.5244
MLP 5-4-3Conductivity0.9396
19.7537
0.9130
20.9560
0.8994
21.4561
TPC0.7234
16.3911
0.7152
16.4769
0.5639
17.7901
FRAP0.8604
5.2505
0.8156
6.5094
0.6726
8.2014
Publisher’s Note: MDPI stays neutral with regard to jurisdictional claims in published maps and institutional affiliations.

