
An Incentive Based Dynamic Ride-Sharing System for Smart Cities
by
 , , and
Abu Saleh Md Bakibillah
1 ,
,
Yi Feng Paw
1,
Md Abdus Samad Kamal
2,*,
Susilawati Susilawati
1 and
Chee Pin Tan
1 1
School of Engineering, Monash University, Bandar Sunway, Selangor 47500, Malaysia
2
Graduate School of Science and Technology, Gunma University, Kiryu 376-8515, Japan
*
Author to whom correspondence should be addressed.
Smart Cities 2021, 4(2), 532-547; https://0-doi-org.brum.beds.ac.uk/10.3390/smartcities4020028
Submission received: 14 March 2021
/
Revised: 16 April 2021
/
Accepted: 20 April 2021
/
Published: 22 April 2021
(This article belongs to the Special Issue Connected and Cooperative Transportation Systems for the Future Society)
Abstract
:Connected and automated vehicle (CAV) technology, along with advanced traffic control systems, cannot ensure congestion-free traffic when the number of vehicles exceeds the road capacity. To address this problem, in this paper, we propose a dynamic ride-sharing system based on incentives (for both passengers and drivers) that incorporates travelers of similar routes and time schedules on short notice. The objective is to reduce the number of private vehicles on urban roads by utilizing the available seats properly. We develop a mobile-cloud architecture-based system that enables real-time ride-sharing. The effectiveness of the proposed system is evaluated through microscopic traffic simulation using Simulation of Urban Mobility (SUMO) considering the traffic flow behavior of a real smart city. Moreover, we develop a lab-scale experimental prototype in the form of Internet of Things (IoT) network. The simulation results show that the proposed system reduces fuel consumption, CO and CO emissions, and average waiting time of vehicles significantly, while increasing the vehicle’s average speed. Remarkably, it is found that only 2–10% ride-sharing can improve the overall traffic performance.
1. Introduction
In the last couple of decades, private cars have become a dominant form of transportation for the people who live in urban areas. For example, private car occupancy rates in Europe range from 1.1 to 1.8 for travelers [1]. Similar private car occupancy rates are found in the United States [2]. The increasing number of private cars causes serious traffic congestion, extra energy consumption, and emissions. The traffic congestion is further escalated when private cars are used with only with a single rider. Particularly, the urban areas are highly susceptible to traffic congestion during peak hours. The annual cost of traffic congestion in 471 urban areas in the U.S. in terms of extra travel time and fuel are estimated to be approximately 160 billion USD in 2015 [3]. Furthermore, transportation contributes about 29% of the total U.S. greenhouse gas (GHG) emissions, which considerably affects environmental sustainability [4]. In Europe, traffic congestion costs 0.5% of the community GDP, and it is predicted that by 2050, the congestion cost will be increased by 50% [5]. Even in Asia, traffic congestion and GHG emissions have become a severe problem. The total carbon dioxide (CO) emissions from transportation in Kuala Lumpur, Malaysia, reached a substantial 6112 tons in 2015 [6]. Aside from traffic congestion and emissions, the surplus vehicles cause other problems, such as the necessity for infrastructure maintenance and the requirement of parking spaces. Due to the limited available space in most cities, it is impractical to construct new roads and infrastructures to mitigate traffic congestion. Hence, reducing traffic congestion and GHG emissions has become a critical concern for both transport researchers and policymakers.
A number of approaches have been proposed to reduce traffic congestion and emissions in urban areas. Some researchers focused on the incentive-based motivation to handle traffic congestion issues. The incentive based system comprised of certain credit/point rewards to encourage commuters either to change their preferences of departure from rush hours or to transpose their mode of travel. A study was conducted to investigate the effect of an incentive based system during rush hours in the Netherlands [7]. Another research performed a pilot field study on the effectiveness of an incentive based active demand management (ADM) system that mainly focused on the automotive sector [8]. The system anticipated future traffic conditions and offered multiple options based on user requests and the shortest routes for various departure times. Each of the options was related to a fixed value point, and the amount of rewards for users was heavily dependent on their contributions to alleviate traffic congestion and behavioral change, i.e., high rewards for traveling on less congested routes during off-peak hours and low rewards on the other side. Some researchers proposed a lottery-based revenue-neutral incentive mechanism to reduce traffic congestion in urban networks [9]. The goal was to promote public transit usage during off-peak periods. These incentive based systems are found to be effective and showed positive impacts on the urban traffic network, however, the systems have not been able to resolve the congestion problem completely.
On the other hand, ride-sharing is a potential mode of transportation that can produce considerable economic and environmental advantages by mitigating traffic congestion during peak hours, reducing fuel consumption and emissions, minimizing travel time, and decreasing parking costs [10]. In addition, ride-sharing enables its users to share car-related costs, which can be appreciable. As reported, ride-sharing along with public transportation can solve the oil and gas dependent problems [11]. For example, the fuel saving potential of ride-sharing in the U.S. was found to be 5.4% if there was more than one passenger in 1 of every 10 cars [12]. A study conducted by the International Energy Agency (IEA) found that including one person to every travel trip would cause a fuel saving of 7.7% and reduce the total vehicle kilometers traveled (VKT) by 12.5% in the Economic Cooperation and Development (OECD) countries [13]. The benefits of allocating ride-share lanes in urban areas are also demonstrated [14].
While the concept of ride-sharing is not new, in recent years the technological developments have increased its popularity. Specifically, the Internet-based mobile technology and the global positioning system (GPS) are the key to enable real-time or dynamic ride-sharing systems [10]. A dynamic ride-sharing is an automatic ride-matching process with sufficient convenience and flexibility between drivers and passengers on very short notice or even en-route [15]. Dynamic ride-sharing is different from traditional carpooling and vanpooling in that it is organized on a trip-by-trip basis rather than on a regular basis [16]. Dynamic ride-sharing may be a network organized and managed by a government entity or an unofficial system run by participants. This latter arrangement is referred to as “casual carpooling.” Casual carpooling, in comparison to the low use of organized dynamic ride-sharing services, has seen a lot of use. In line with this expectation, different ride-sharing algorithms have been proposed. In [17], the optimal ride-matching algorithms are addressed to reduce gross system-wide vehicle miles and individual travel costs for system users. They came to the conclusion that dynamic ride-sharing, even with low participation rates, could be a viable choice for minimizing system-wide vehicle miles, trips, and travel costs. In [18], an integrated system for peer-to-peer (P2P) ride-sharing and shared autonomous (fully-automated) fleet vehicles (SAFVs) is proposed to maximize ride-matching ratio while optimizing the number of required SAFVs. The authors use a dynamic programming (DP) algorithm to match riders with regular personal-auto drivers through P2P communication. Similarly, in [19], the concept of using autonomous vehicles as a part of shared mobility systems in intelligent, urban transportation systems is discussed. The authors compared the cost of using autonomous vehicles to the traditional car fleet available in car-sharing schemes and vehicles owned by individuals.
Today, there are a few companies across the world, e.g., GrabTaxi Holdings Pte. Ltd. (Singapore), and Uber Technologies Inc. (San Francisco, CA, USA), that provide ride-sharing transportation services via peer-to-peer (P2P) mobile networking enhanced by smart phones. However, it is observed that the ride-sharing services offered by them do not contribute to mitigating traffic congestion, and in reality, they sometimes aggravate traffic situations further in urban areas [20]. According to the corporate agenda or original business proposal of these companies, the mitigation of traffic congestion is not their main concern, but instead, they have indirectly created more jobs and income generating opportunities, and consequently, increased the number of vehicles on road networks. Therefore, a new mode of comprehensive transport system needs to be introduced in order to reduce future road traffic congestion in urban road networks.
In this paper, we propose an incentive-based dynamic ride-sharing system in the form of cooperative transportation depending on mobile-cloud computing, which facilitates real-time ride-sharing. The incentive system is formulated based on point rewards considering the traffic condition (e.g., level of congestion) and the number of riders in order to achieve the maximum benefit of ride-sharing. To evaluate the performance of the proposed ride-sharing system, microscopic traffic simulations are conducted considering realistic traffic flow patterns of a smart city. The results demonstrate the potential of the proposed system to significantly reduce fuel consumption, CO and CO emissions, and average waiting time of vehicles as well as to increase the average speed. Furthermore, to test and validate the proposed system and to realize a smart city concept, a lab scale prototype is developed based on IoT concepts using small-scale autonomous vehicles that can communicate wirelessly.
2. Proposed Concept
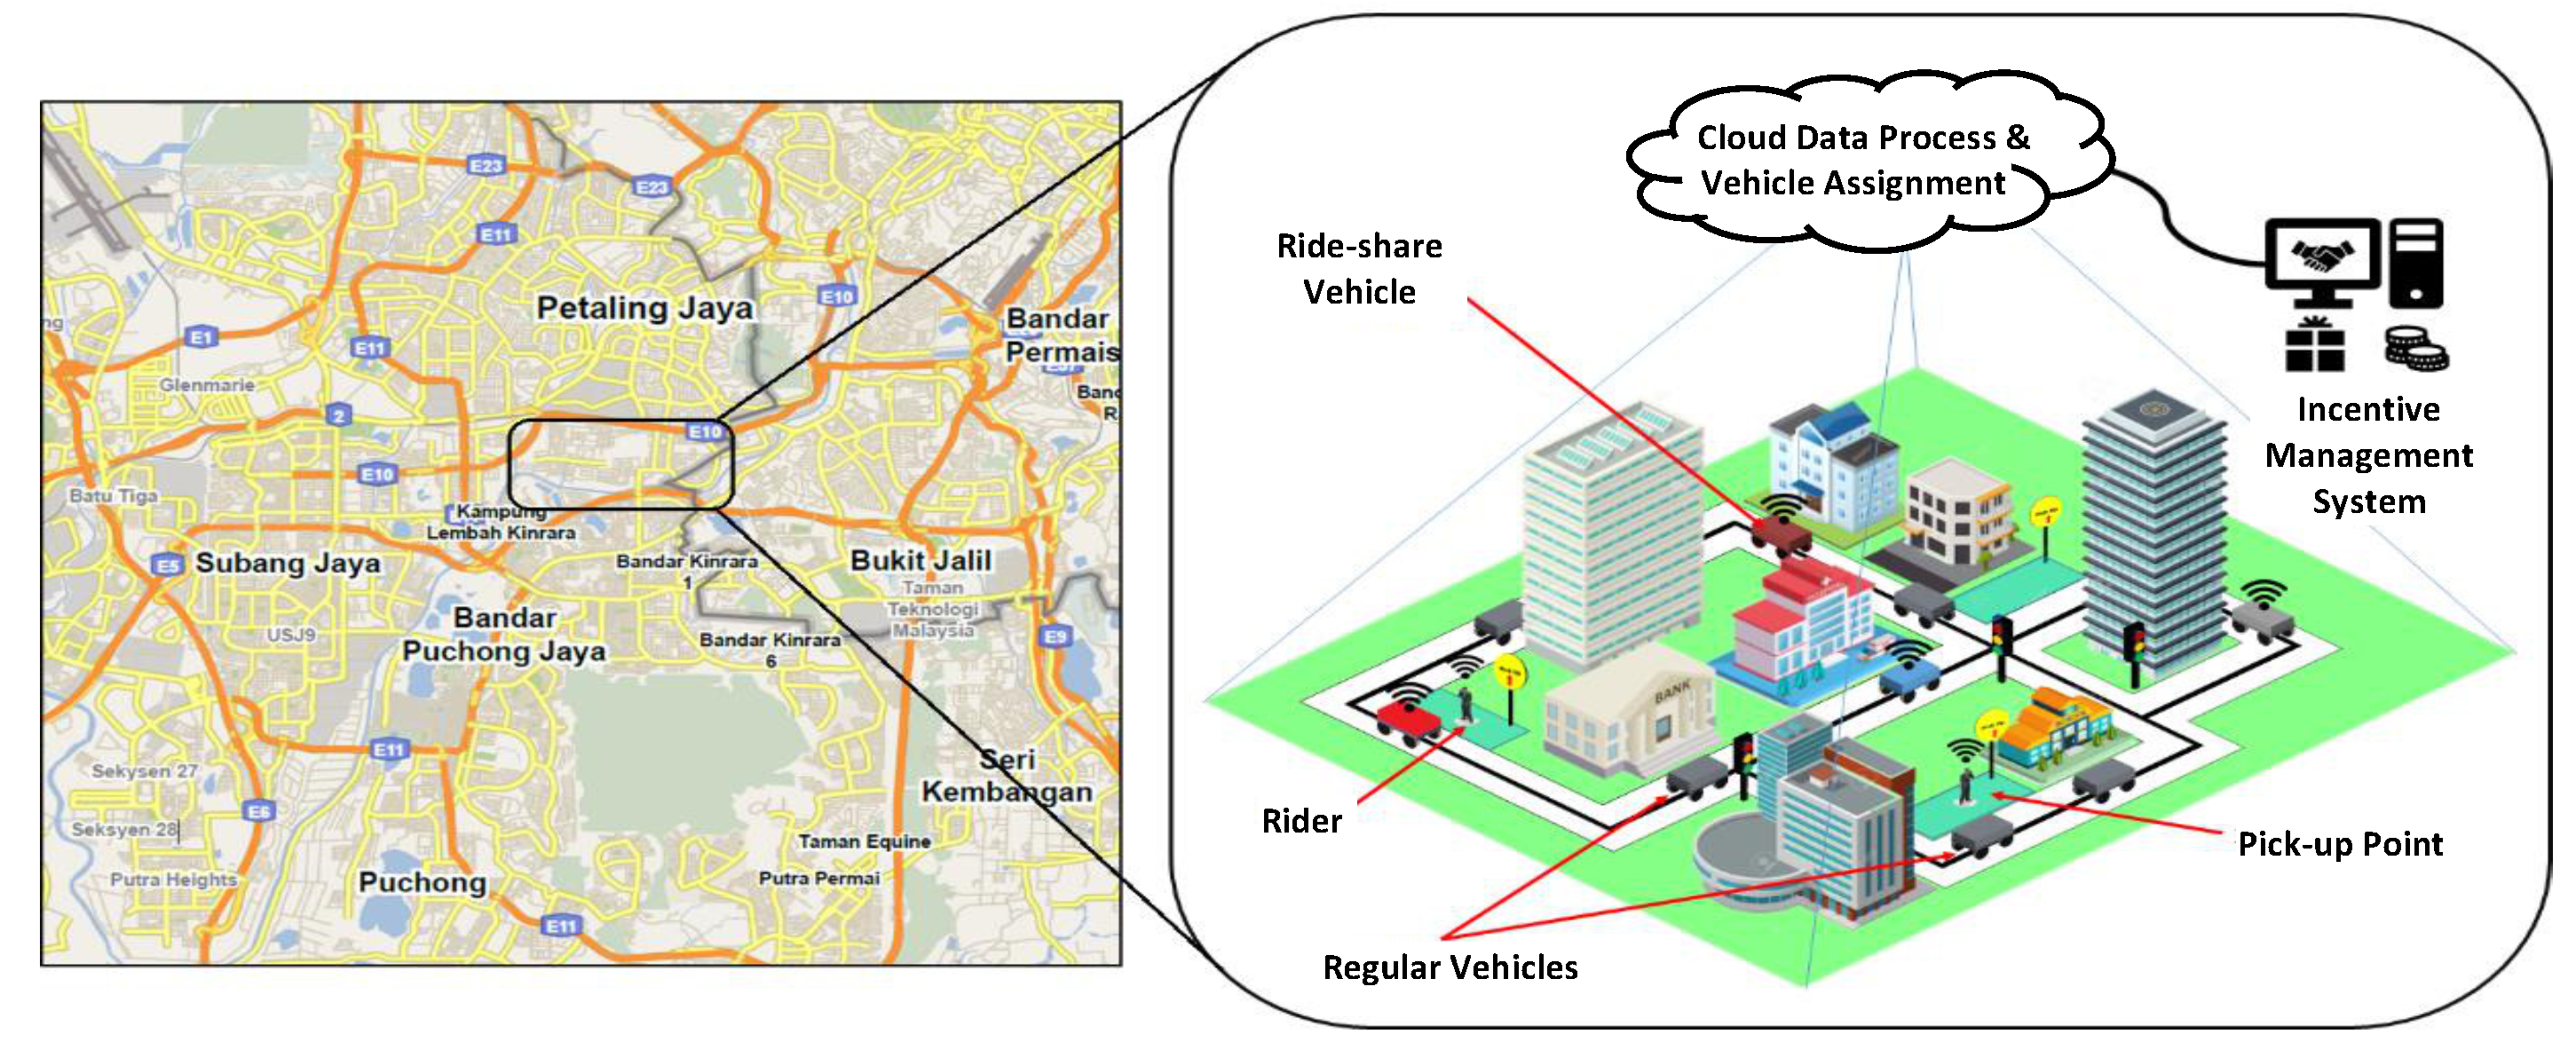
In this work, we choose a real busy urban area called Sunway City located in Subang Jaya, Malaysia to model and evaluate the performance of the proposed dynamic ride-sharing system. The traffic flow pattern in the road network of Sunway City varies from moderate to congested at different times of a day. Specifically, traffic congestion has become a regular problem over the past couple of years during peak hours. Moreover, it becomes difficult to find parking spaces due to the excessive number of vehicles. Therefore, in order to solve these undesirable problems, a cooperative transportation system in the sort of dynamic ride-sharing can play an important role, as it will require few vehicles to transport the same number of people from one place to another. This will in fact reduce the energy consumption as well as GHG emissions and ensure the number of vehicles is below the road capacity, resulting in a congestion free urban network.
The overall concept of the proposed incentive based dynamic ride-sharing system for a smart city is shown in Figure 1. The proposed system comes with a feature where either a driver or a rider can become a participant. It is therefore very useful for users who want to travel within the city network for a short distance. When a passenger requests a ride via the mobile phone application, the data are processed in the cloud in real-time. Then, the passenger is assigned to the nearest vehicle (registered in the system) considering the unoccupied seats and travel destinations. After completion of a trip, there is a provision of incentives, which will give both drivers and passengers mutual benefits in terms of point rewards rather than monetary rewards. However, we set a restriction on the proposed incentive system to prevent the participants, specifically the drivers, to earn more reward points by offering excessive rides. This is because our goal is to encourage people to share their private vehicles while traveling, to alleviate traffic congestion rather than motivate them to be involved as drivers by promoting the system as an alternative source of earnings.
3. Ride-Sharing System Development
3.1. Ride-Sharing System Architecture
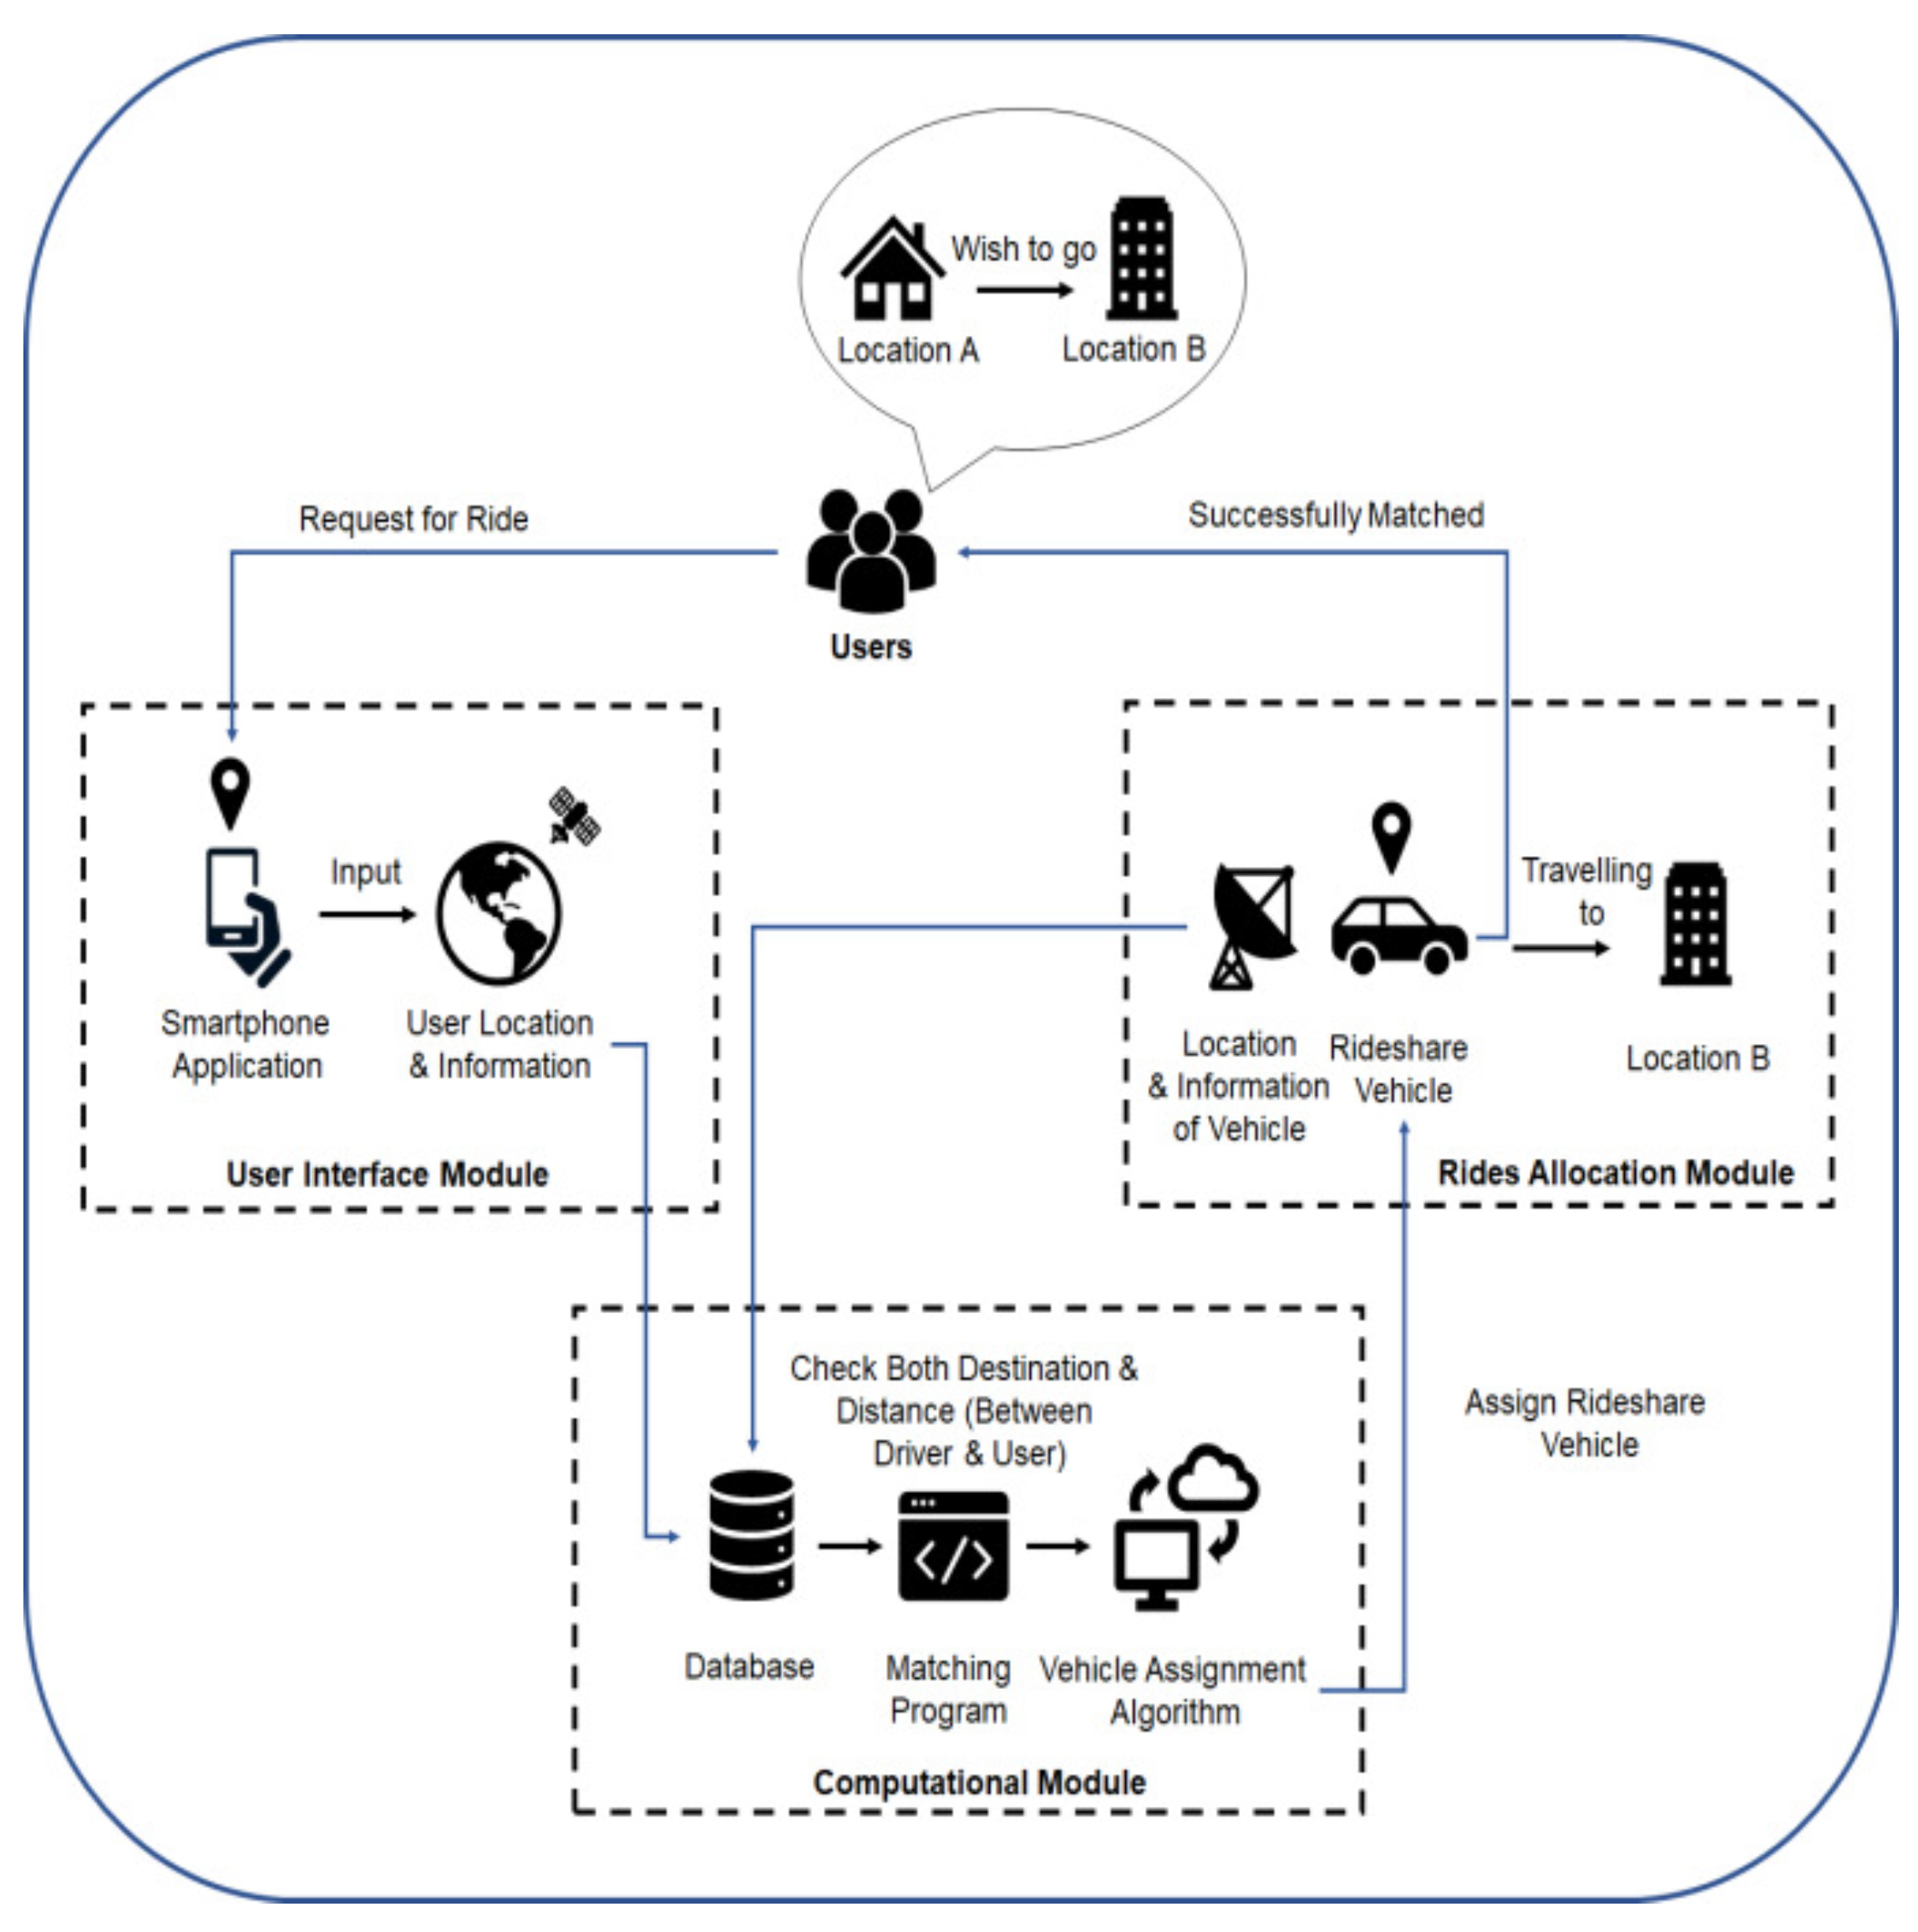
The system architecture of the proposed ride-sharing system is shown in Figure 2. The ride-sharing system operation starts at the user level, followed by the user interface module, then the computational module, and finally the module for allocation of riders. The user interface module allows users to request rides using the smart phone application that we have developed, while the module collects all necessary information including the location and destination of the riders. After collecting all the necessary information, they are sent to the computation module. The computational module receives data both from the user interface module and from the allocation module for rides and store the information in a database. The data are then used in a ride matching program.
On the other hand, the rides allocation module is responsible for sending the location and destination of the driver (vehicle) to the computational module and subsequently, after a successful match, the module receives notification of providing ride-sharing service to the rider. Note that for a successful matching, the proposed ride-sharing system is subjected to some constraints, such as (i) the number of existing riders of a vehicle does not surpass the number of available seats at any instant, (ii) both the rider and driver share the same destination and at the same time a rider’s location is along the same traveling direction of a driver, and (iii) these constraints yield explicit point-based incentives for both riders and drivers.
3.2. Point Reward Based Incentive System
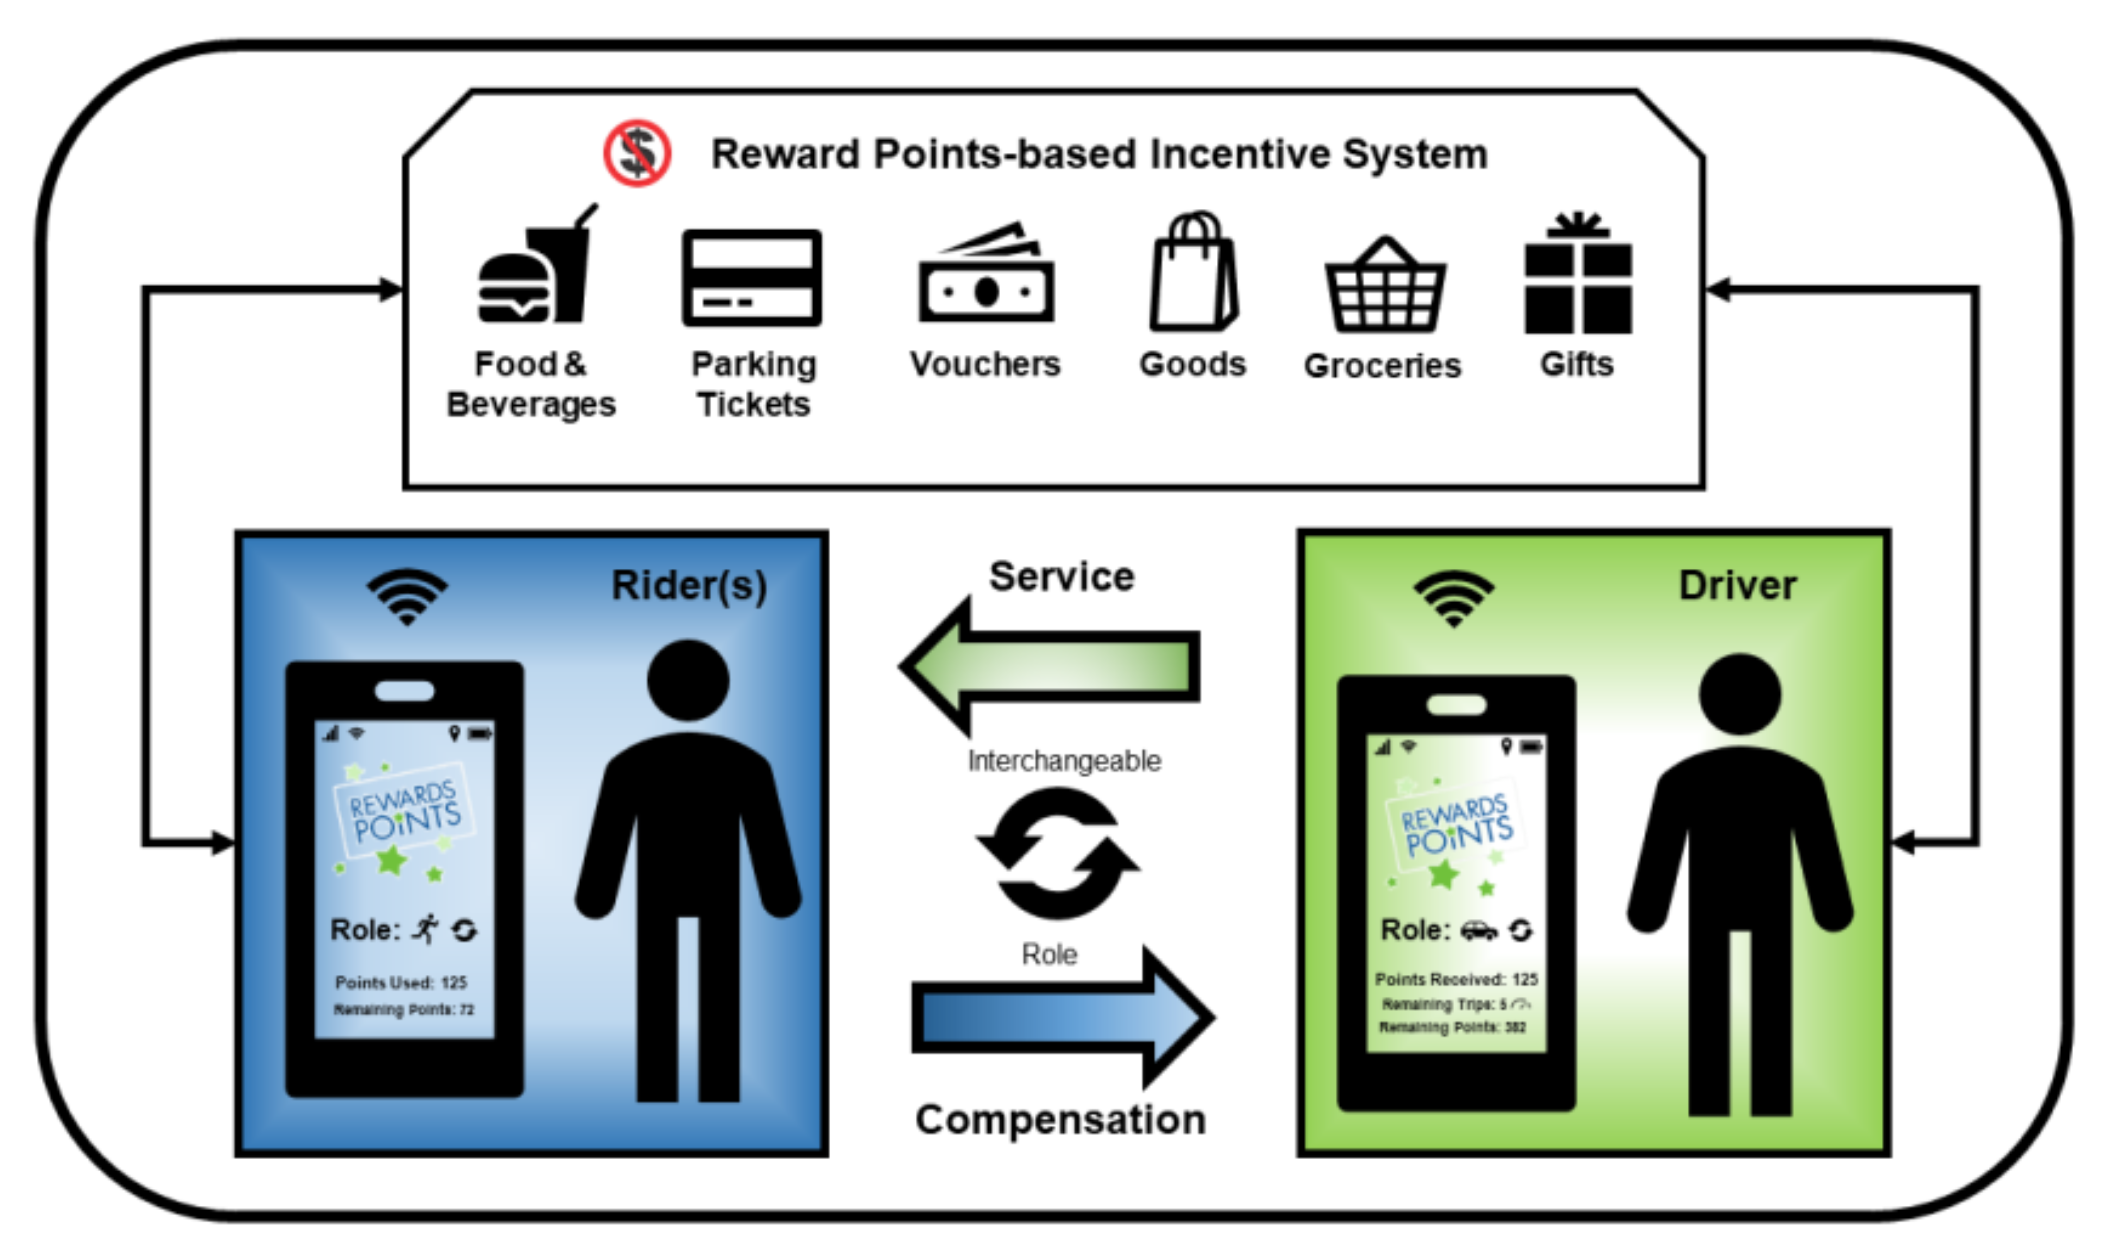
The overview of the point reward-based incentive system is illustrated in Figure 3. In the context of a smart city, this incentive system can be integrated into existing systems so that both drivers and passengers can make full use of the collected points to purchase or redeem for any available product or service. This point based incentive system can also boost the sales of various products. For the incentive system, the point rewards are computed based on the following criteria.
- Base point —point to be charged for taking a successful ride;
- Point per minute —point to be charged for every minute of travel within the ride;
- Point per km —point to be charged for every km of travel within the ride;
- Traffic scaling factor —a factor that regulates reward point depending on traffic condition and time, e.g., traffic congestion during peak hours;
- Passenger(s) scaling factor —a factor that regulates reward point according to the number of passenger(s) in each vehicle.
Hence, the point to be charged per rider is calculated as
where t is the travel time and d is the travel distance. The points to be earned by a driver is calculated as
where denotes the number of riders sharing the same vehicle. The points are calculated only when a trip is completed, which ensures the proper use of the factors.
The values of and are given in Table 1. When the traffic congestion becomes worse, the value of decreases, i.e., for serious traffic congestion, both riders and drivers will be charged/earn less points. The purpose is to encourage the riders to use the ride-sharing system so that the number of vehicles entering the network gets reduced and thus, alleviate traffic congestion. On the other hand, the value of decreases when the number of passengers to share the same vehicle becomes more. The purpose is to restrain drivers from earning excessive reward points as the main goal of the proposed ride-sharing system is to overcome traffic congestion rather than creating new job opportunities. The values of , , and are considered as 20, 5, and 10, respectively. Note that these values are determined hypothetically to evaluate the potential savings from the incentive (point reward) based ride-sharing system. In the future, these values can be optimized using substantial ride-sharing data.
3.3. Ride-Sharing Simulation Model
We have developed the simulation environment using a microscopic traffic simulation software known as SUMO to evaluate the effectiveness of the proposed cooperative dynamic ride-sharing system. SUMO is an open source software that is used widely for traffic simulation, and it runs on XML programming language [21]. Python is used to interface with and control the events in SUMO.
A model of the multi-lane traffic network of Sunway City is built in SUMO. The traffic network consists of eight junctions, six of them having signalized intersections. The traffic flow in the network is varied from moderate to congested, imitating the real traffic scenario of the city. The duration of traffic signals is set similar for every signalized intersection in each direction, e.g., 30 s for green, 3 s for yellow, and 60 s for red. We only consider gasoline driven passenger cars with Euro norm 4 and Krauss microscopic car-following model in the simulation [22]. The Krauss model is based on the safe speed and is computed as
where denotes the speed of the preceding vehicle at time t, is the gap between vehicles, represents the driver’s reaction time, is the speed of the following vehicle at time t, and b is the comfortable deceleration of the vehicle. The value of may be higher than the maximum speed limit of the road or greater than what the vehicle is able to reach before the next step due to its acceleration capacity. Therefore, the desired speed of the vehicle is the minimum of these values and is given as
where is the maximum allowable speed on the road, is the maximum acceleration of the vehicle, and t represents step size of the simulation.
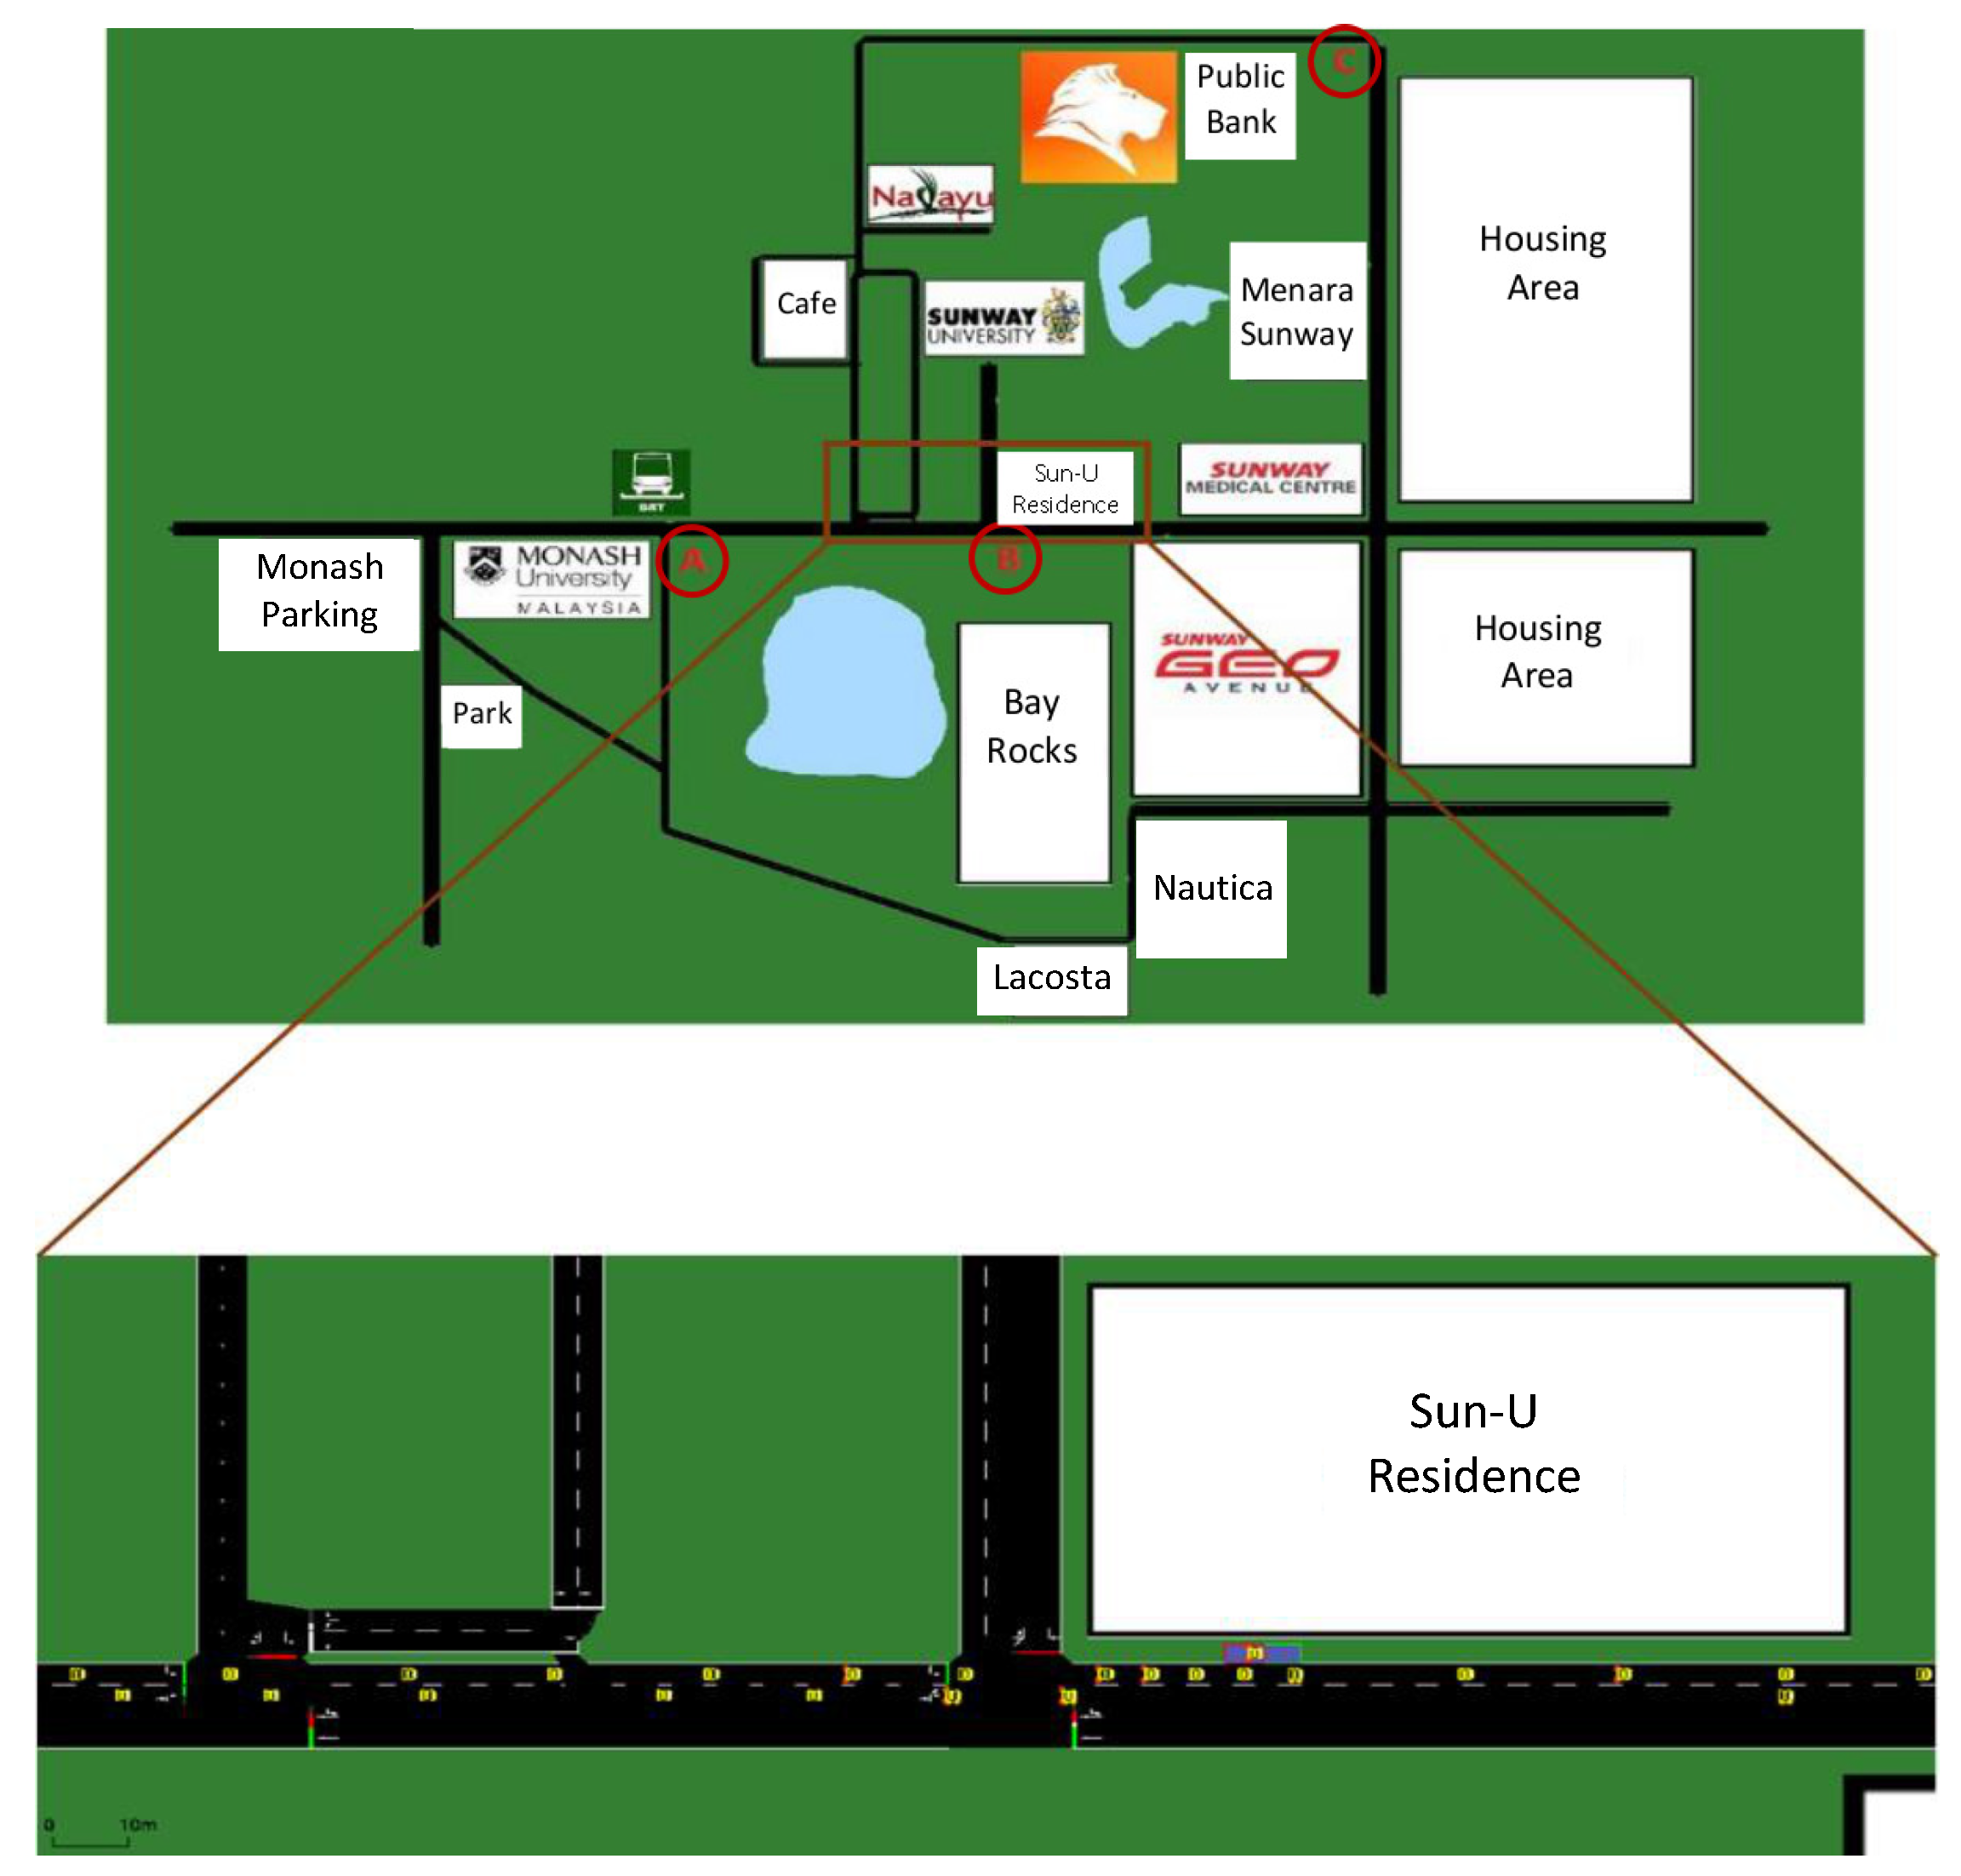
To evaluate the proposed system, two pick-up locations point A (Monash University Malaysia) and point B (Sun-U Residence), and one destination location point C (Public Bank) are considered for ride-sharing simulation as shown in Figure 4. The traveling routes are from point A to point C via point B, and point B to point C only. The distance traveled by a vehicle from point A to Point C and from Point B to Point C is 1.02 km and 0.74 km, respectively. In the simulation, we consider that each person drives a car, and of the total number of cars, 60% drive from point A, and the remaining 40% drive from point B. A passenger can request a ride randomly during the simulation time-frame. The vehicles that register for the ride-sharing service will stop temporarily for about 8 sec to pick-up the passengers. Every vehicle for ride-share can take up to four passengers. If a passenger requests a ride at the time when a ride-share vehicle is stopped to pick-up other passengers, and if there is any empty seat, the passenger will be assigned to that car.
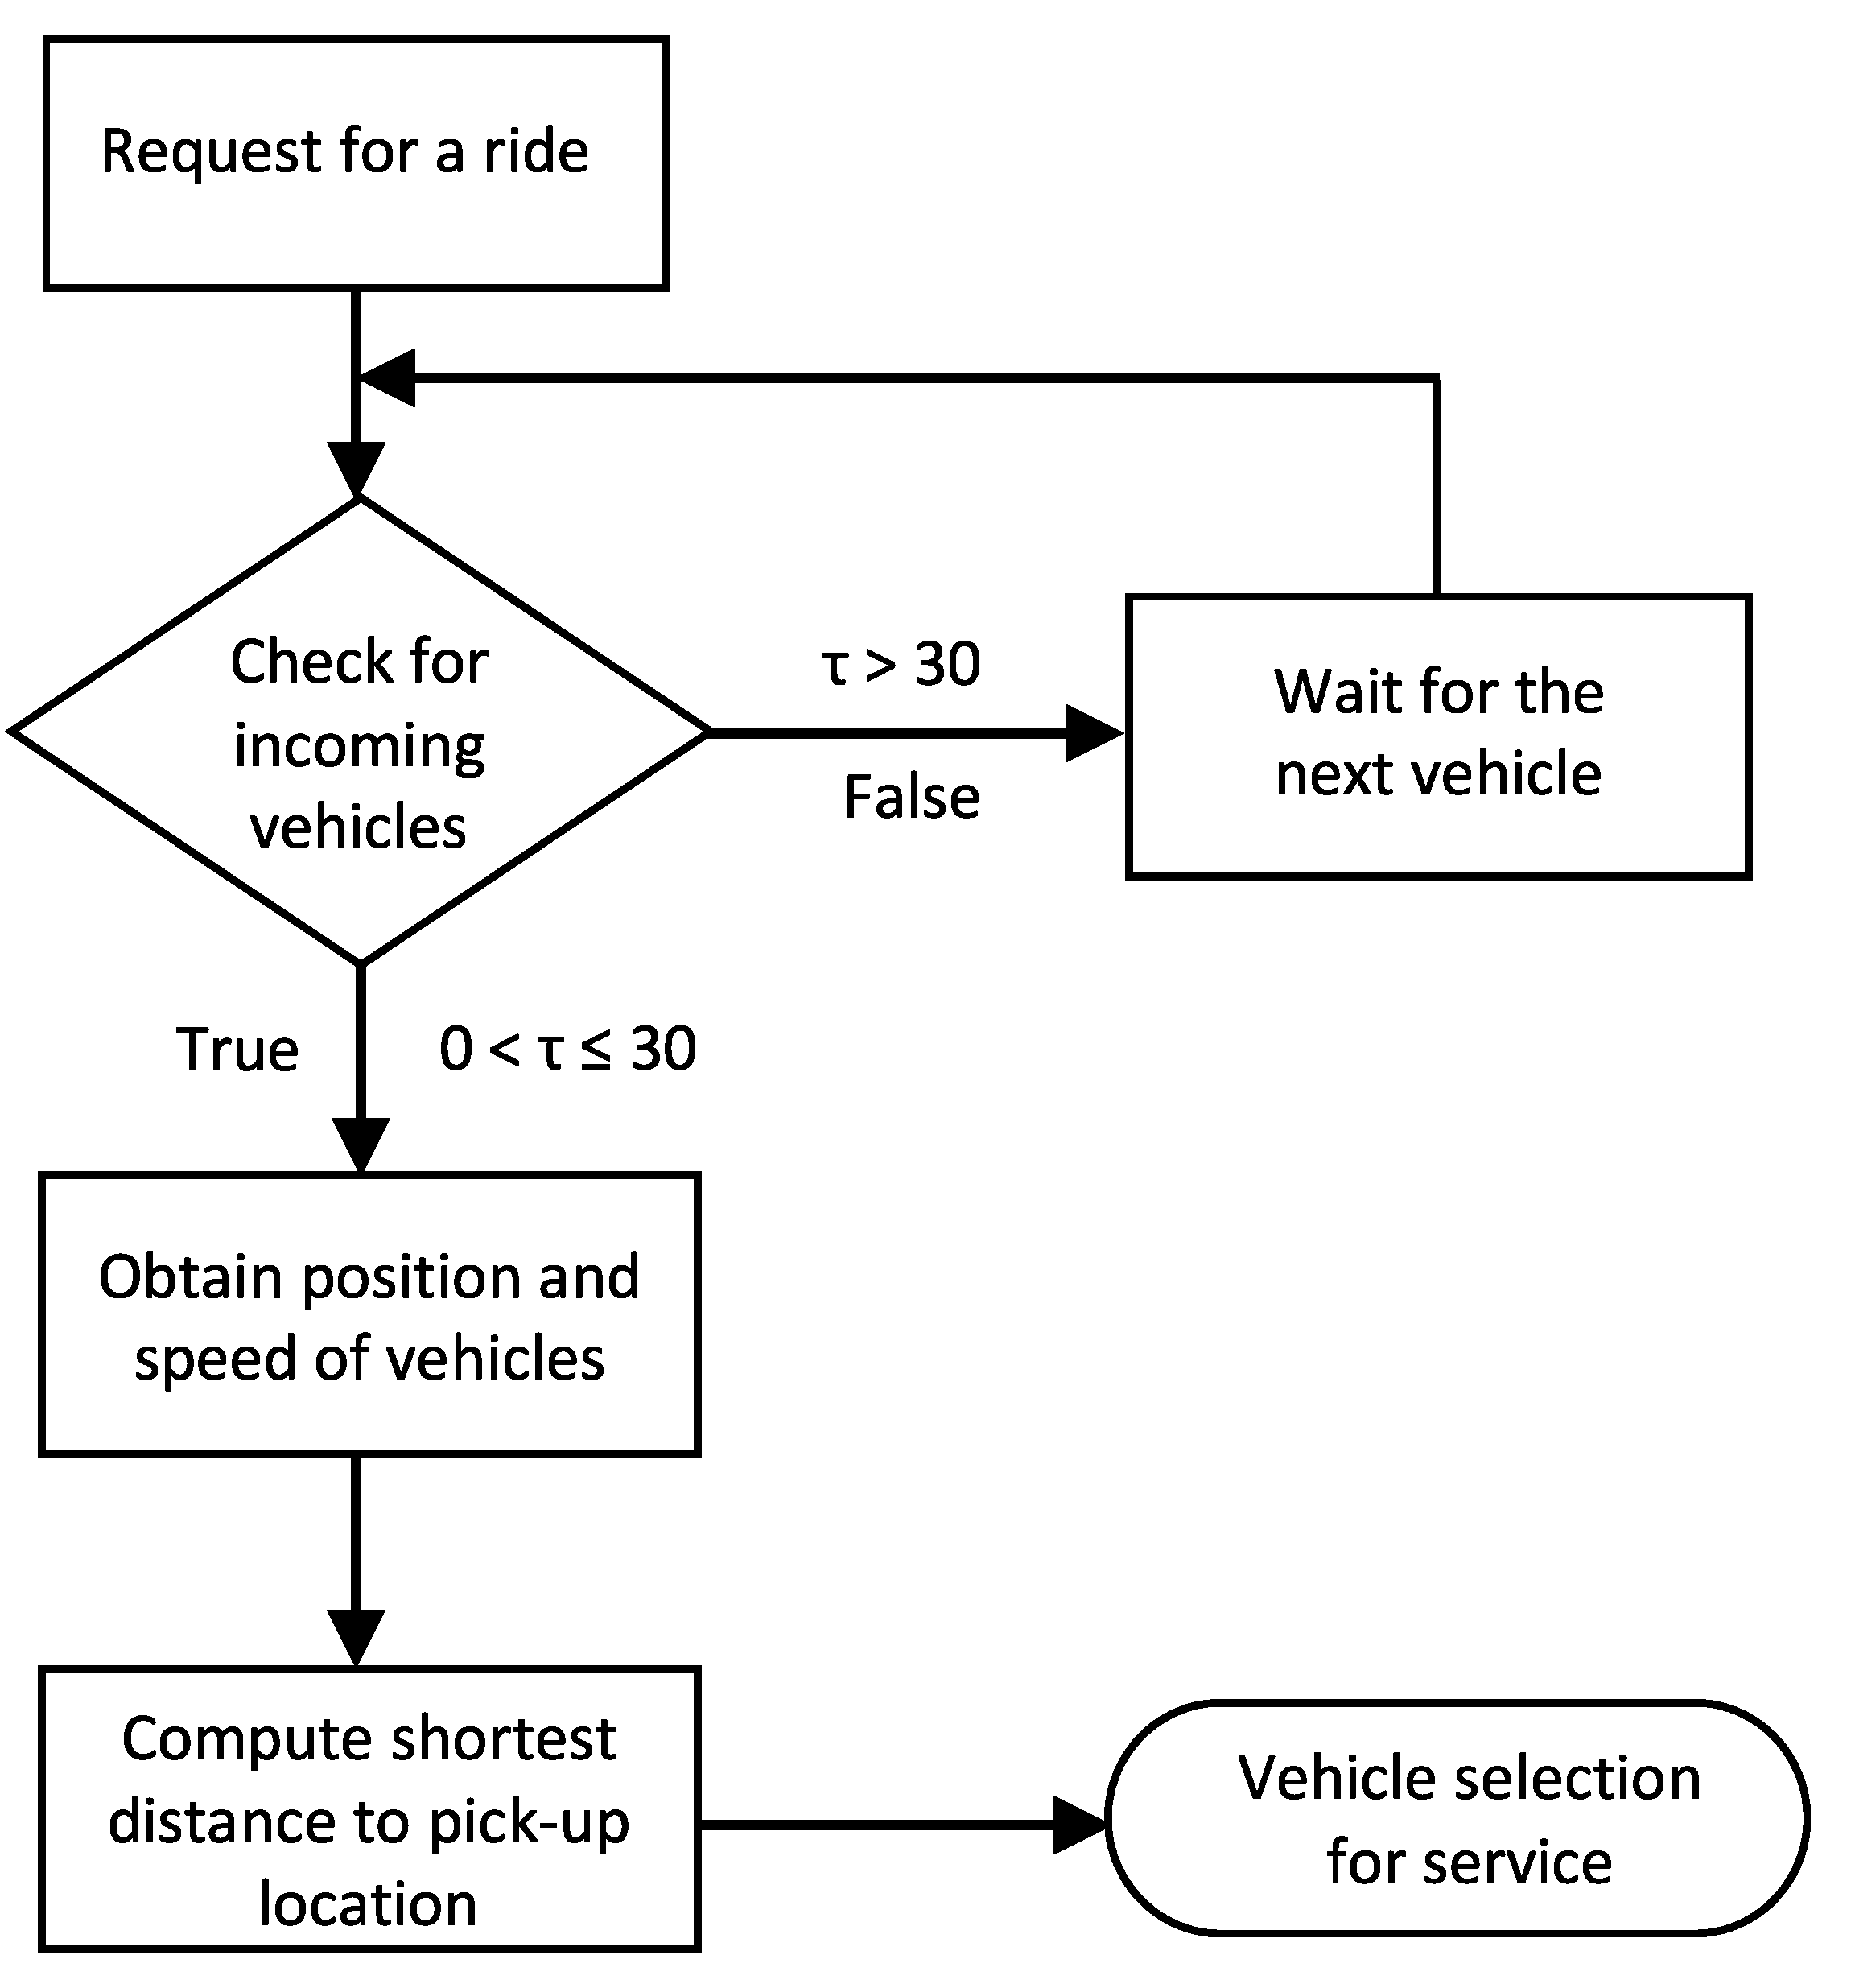
We consider several parameters when developing the ride-sharing algorithm to simulate the process of picking up the passenger who requests a ride, including the current position and speed of the vehicle that provides the ride-sharing service, as well as the destination of the passenger. Few conditions are set to select the ride-sharing vehicle by the algorithm, such as the nearest vehicle to the pick-up location, the traveling direction and destination, and the available seats. After receiving a request from a user, the cloud at first inspects the vehicles coming in the same direction of the passenger’s pick-up location. Next, each nearby vehicle’s position and speed are obtained at that particular time and the distance (set) to the destination is calculated. Finally, a vehicle is selected for the ride-sharing service. If there is no vehicle nearby, the passenger’s pick-up location, the cloud waits for the next upcoming vehicle with a maximum waiting time of 30 s. Note that the vehicle positions are obtained in the form of X and Y coordinates, and the distance is calculated in terms of magnitude. The flow chart of the ride-sharing algorithm used in the simulation is illustrated in Figure 5 and it is based on the following conditions:
- The vehicle coming towards a specific pick-up point (either A or B, depends on the location of a user who requests for a ride) will be chosen to serve the passenger.
- If the speed of a vehicle is higher than a threshold value and it is reaching the peak-up location and at the same time a passenger requests for a ride, then the ride request will not be accepted by that particular driver (due to the time needed to stop the vehicle and to avoid hard braking).
- If a vehicle has just passed the pick-up location, the passenger will be informed that the vehicle has passed (even though that particular vehicle has the shortest distance to the pickup point) and will be asked to wait for another ride-sharing vehicle that shares the same destination.
- If a vehicle has just crossed the pick-up location and a passenger requests for a ride at that time, then the nearest upcoming vehicle will be assigned to the passenger.
The authors have developed two simulation models with and without ride-sharing. At first, the simulation is conducted without a ride-sharing service in the traffic network. Then, the ride-sharing system is implemented into three different stages based on the percentage of usage of the system by riders and drivers. The total users of ride-sharing system are set to 20% in every stage, however, the percentage of drivers and riders using the system varies from one stage to another. The four different cases of simulation are given in Table 2. For interpretation, consider a case, e.g., case 3 where the total ride-sharing users are 20%, which are equivalent to 20 persons who participate in the ride-sharing system when the total number of vehicles is 100. Among the users, there are 5 riders and 15 drivers who offer the service. That means, the number of vehicles is reduced by 5 after employing the ride-sharing system. Note that the pick-up location is at point B, therefore, only vehicles from point B will be reduced, as drivers will become riders.
4. Simulation Results
We conduct microscopic traffic simulations considering a real traffic network in Sunway City using SUMO. The traffic flows on various roads of the city are typically not uniform. In our settings, the traffic flow rate along the ride-sharing route is found between 570 veh/h and 660 veh/h, representing above near congested traffic flow scenarios. We collect the driving data from SUMO, which are then used to evaluate the performance of the proposed cooperative dynamic ride-sharing system and compared with the existing traditional transportation system without ride-sharing. The average fuel consumption, CO, and CO emissions are obtained from SUMO’s Emissions model called HBEFA3/PC_G_EU4 (a gasoline powered Euro norm 4 passenger car modeled using the HBEFA3 based model), which are then used to calculate the total fuel used by all cars, total CO and CO emissions. We also calculate the average speed and average waiting time of cars for each of the four mentioned cases.
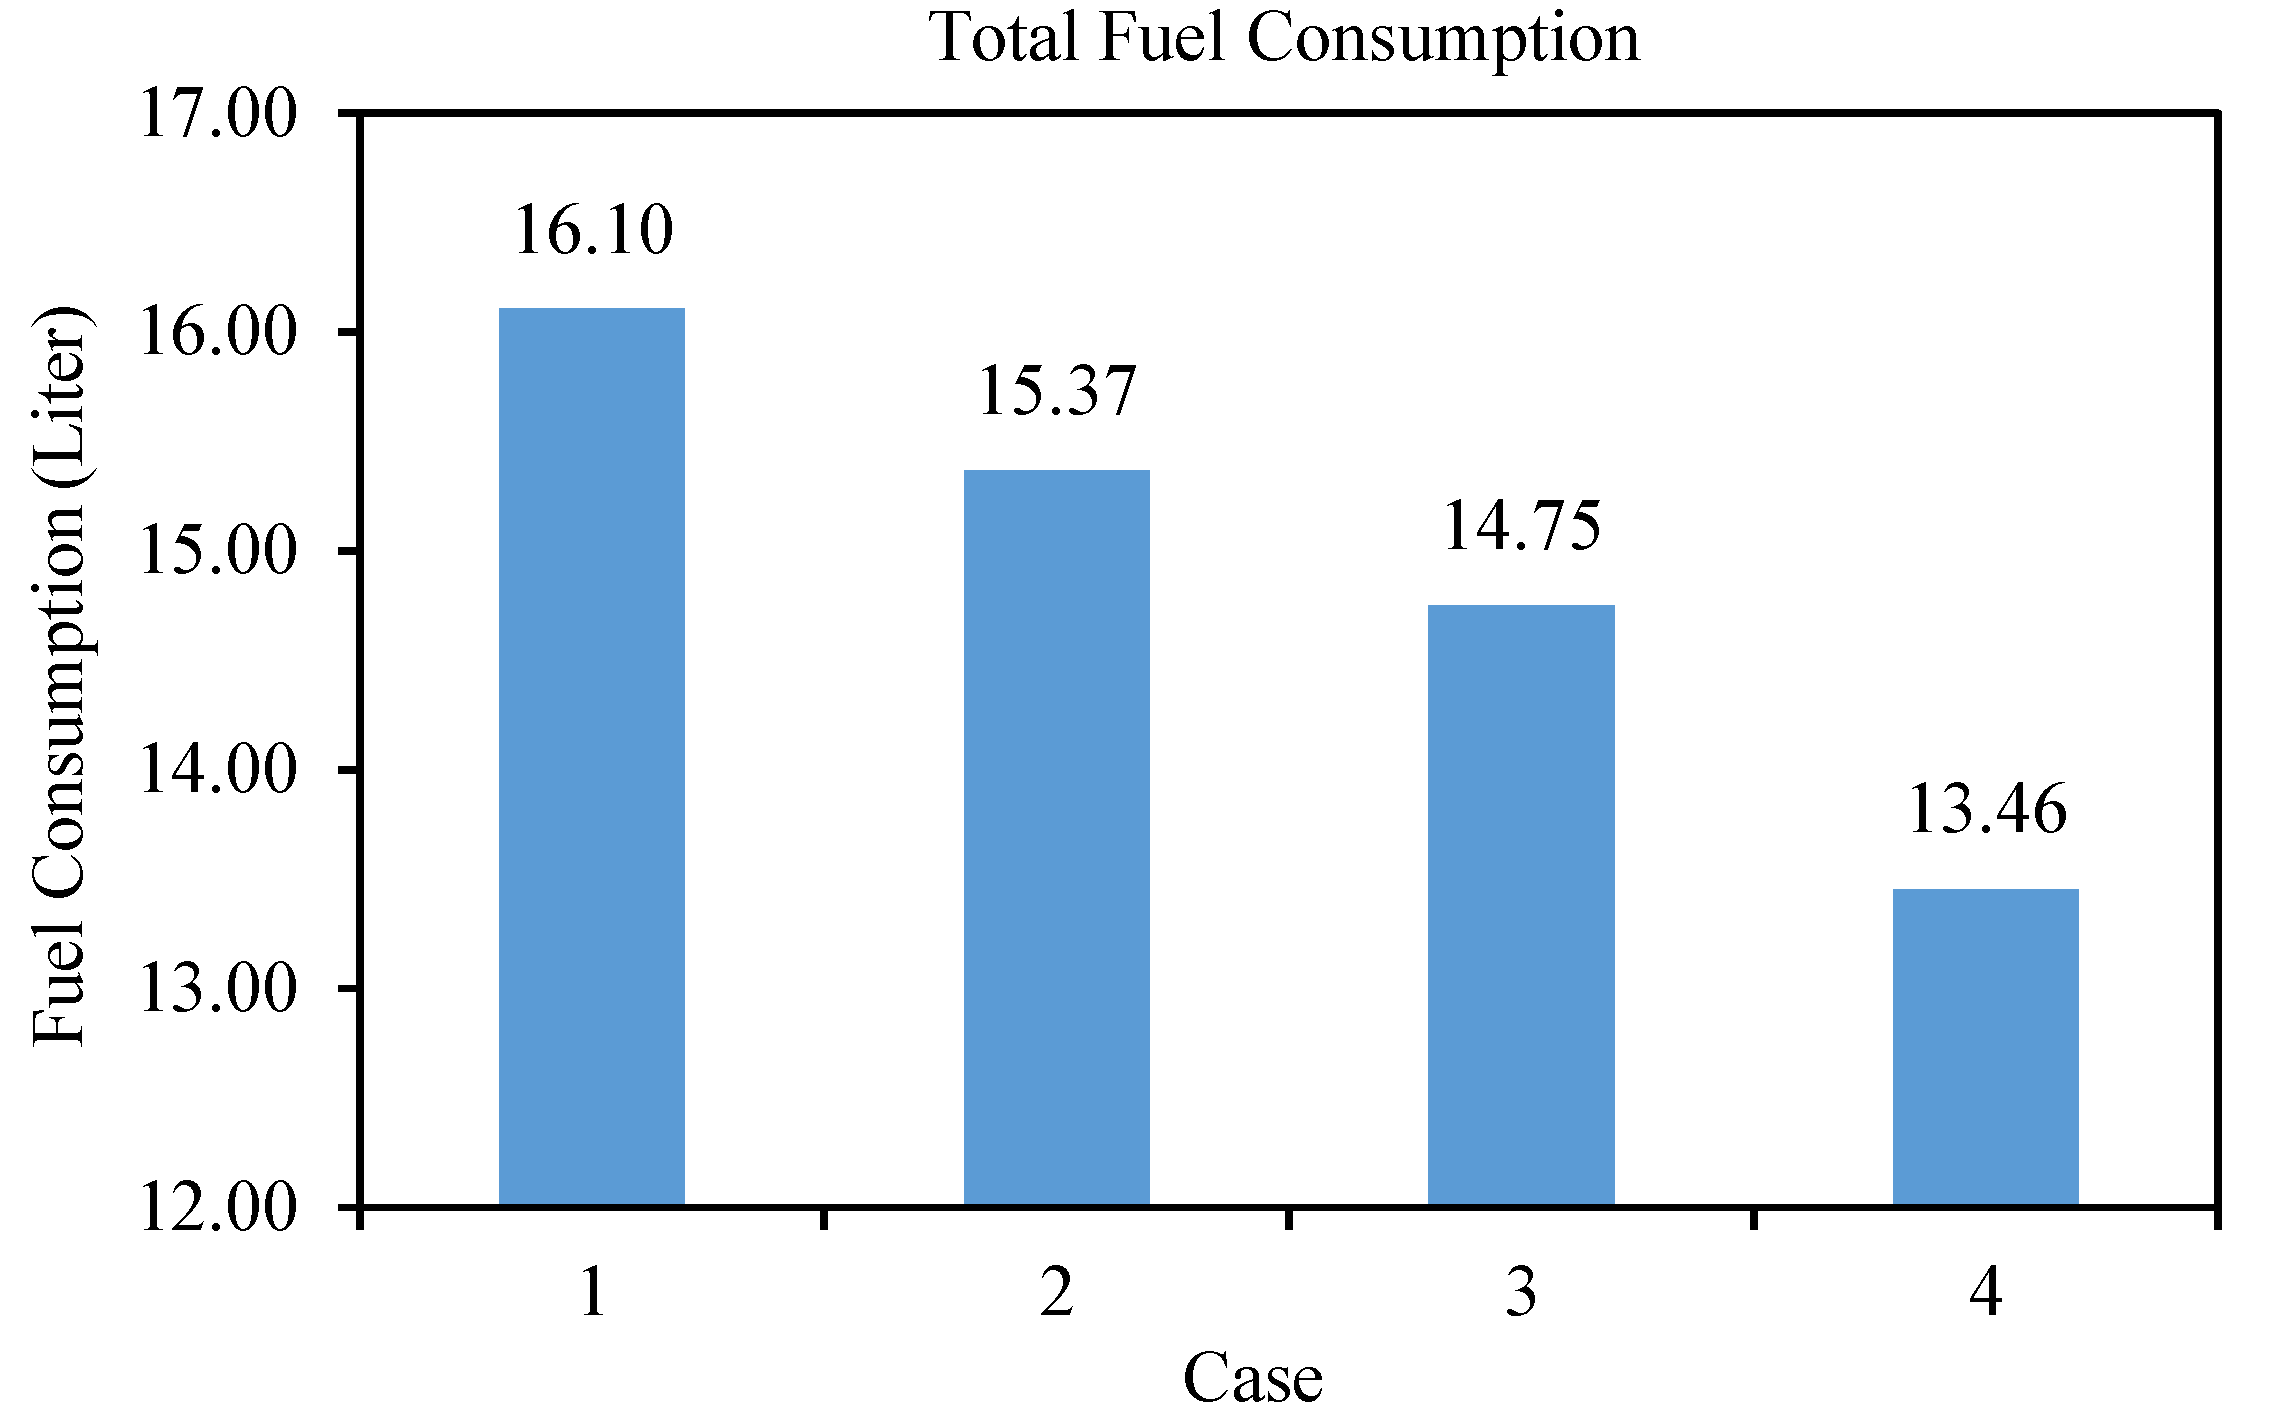
Figure 6 shows the simulation results of total fuel consumption of passenger cars in four different cases. It is found that the total fuel consumption of the traditional transportation system without ride-sharing (case 1) is 16.10 L, which is the maximum, and the consumption reduces significantly when the percentage of passengers using the ride-sharing system increases. The total fuel consumption of the ride-sharing system for case 2, case 3, and case 4 with varying percentage of drivers and riders are obtained as 15.37 L, 14.75 L, and 13.46 L, respectively. Hence, in case 2, the total fuel consumption is reduced by 4.53% when only 2.5% riders out of 20% ride-sharing users are using the ride-sharing service, whereas in case 3, the fuel consumption is reduced by 8.38% when 5% riders are using the ride-sharing service. In the best case (case 4) when 10% riders (out of 20% users) are using the ride-sharing system, the total fuel consumption is reduced by 16.40% compared to the traditional transportation system without ride-sharing.
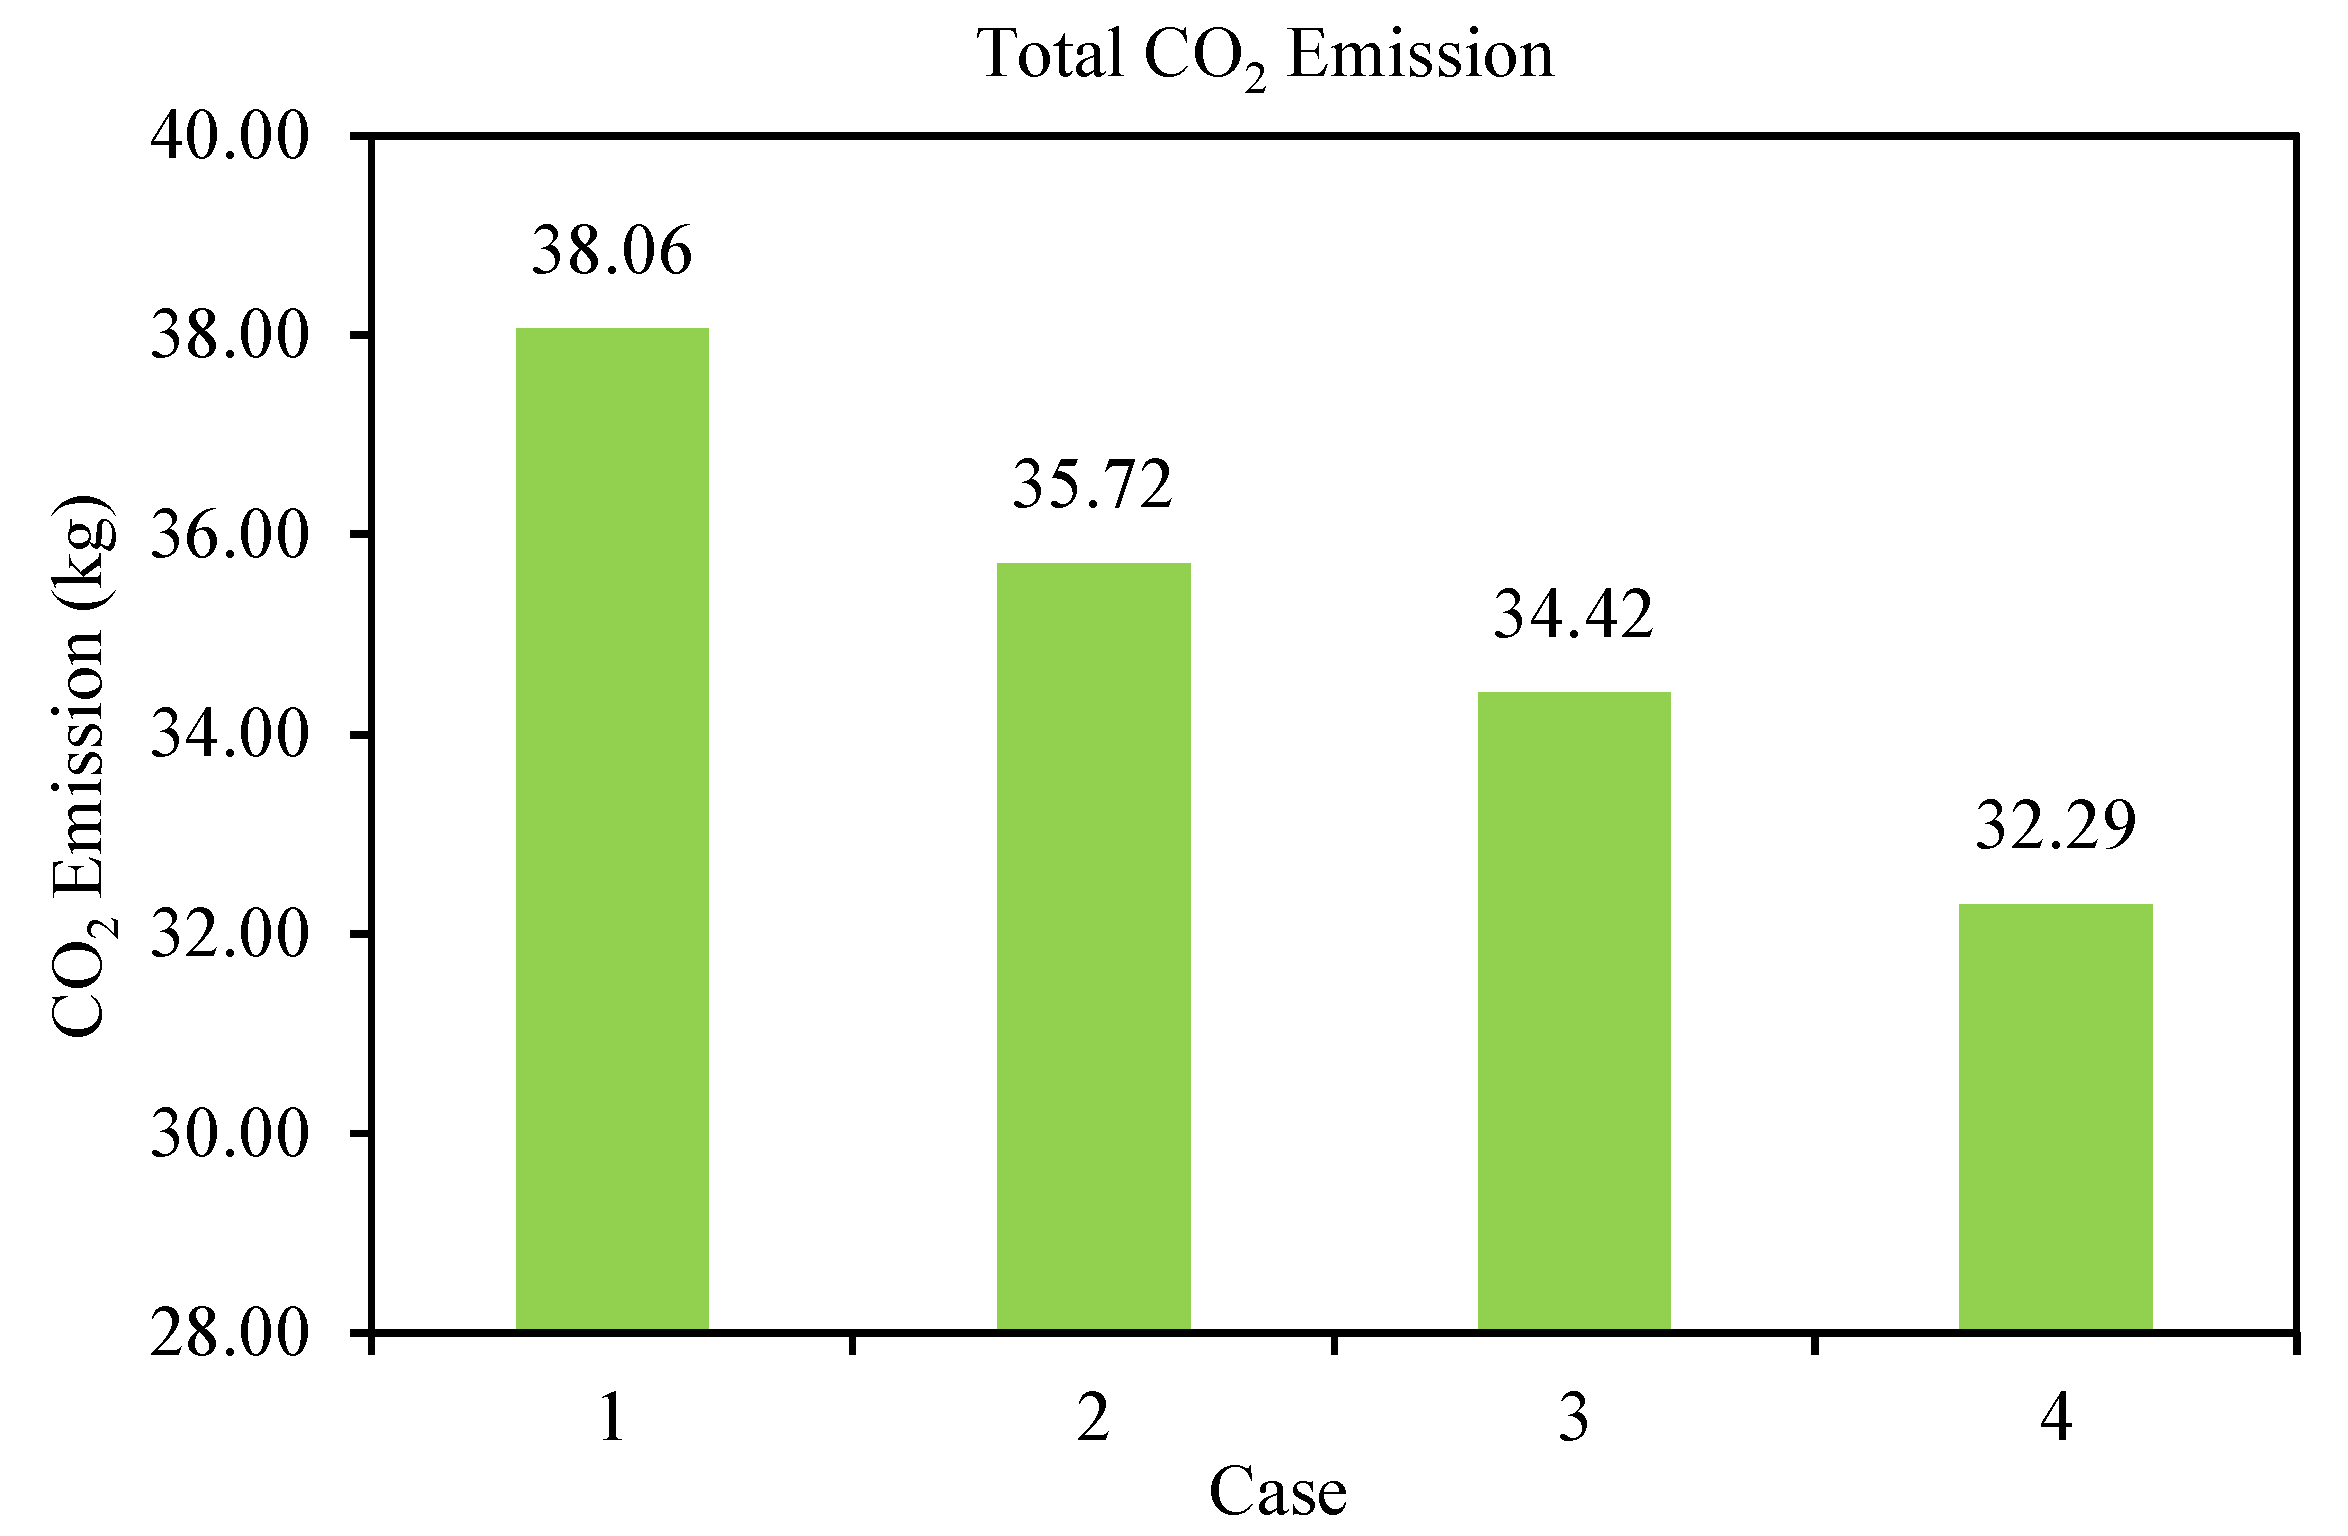
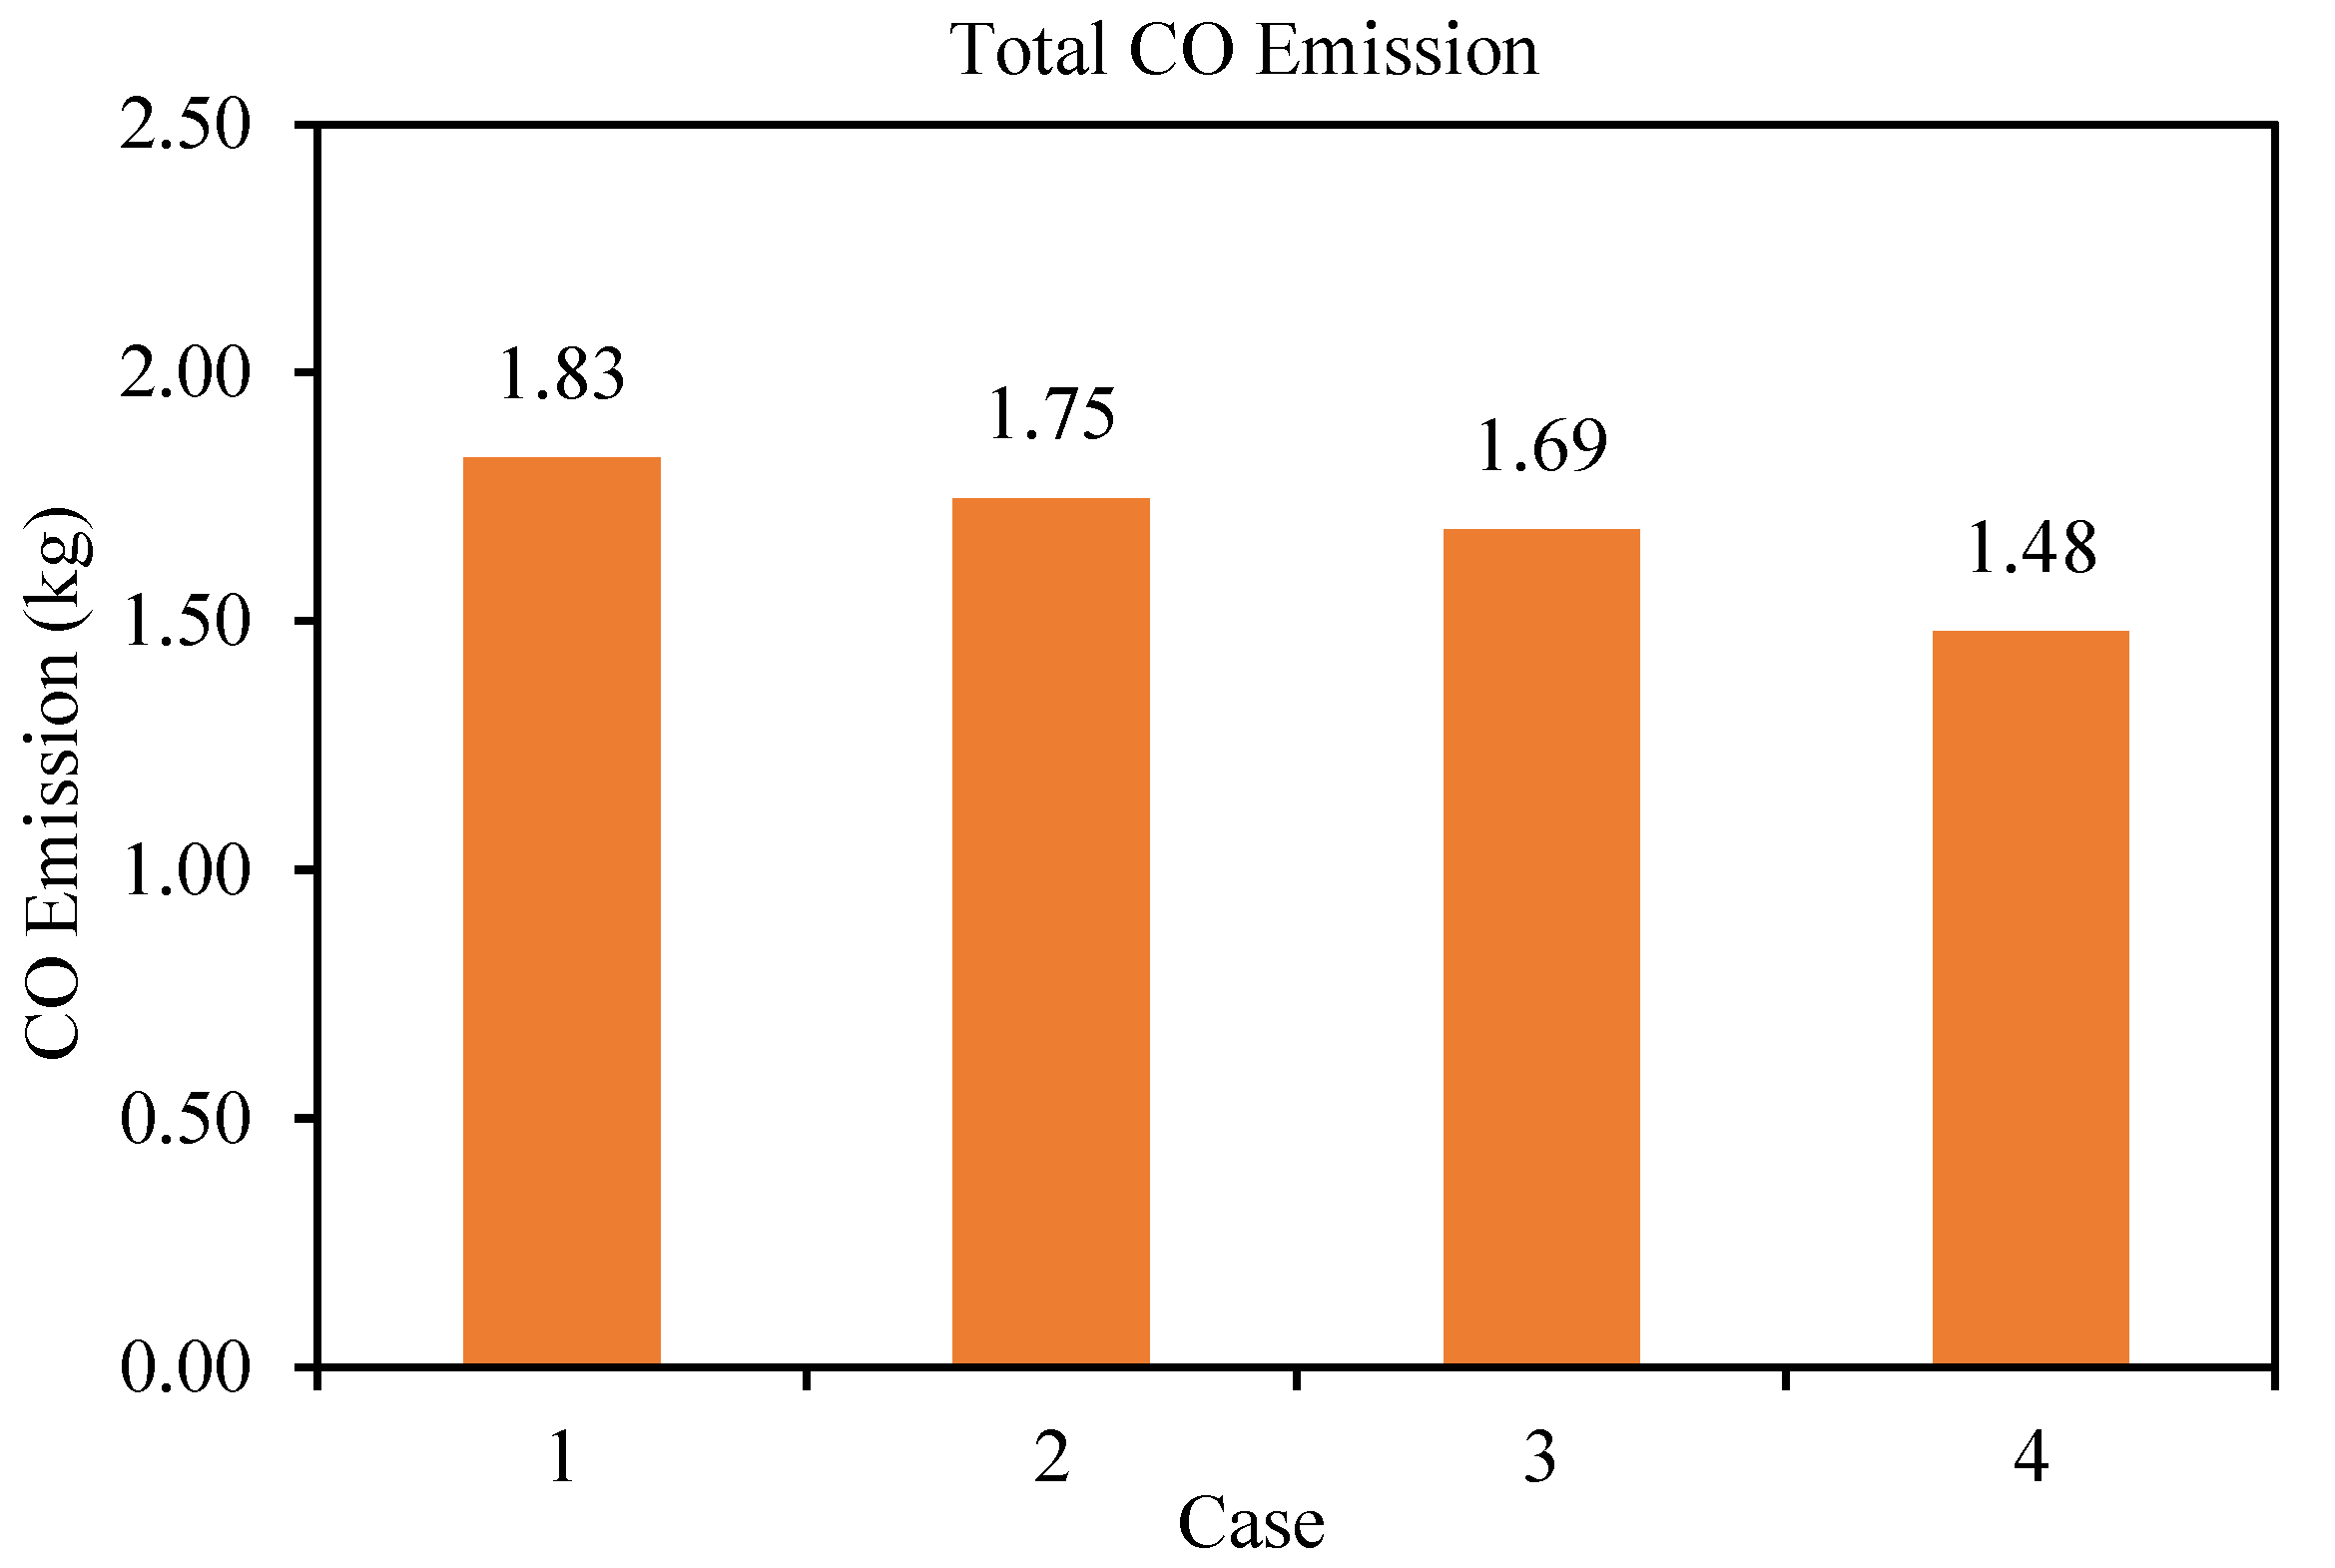
Figure 7 and Figure 8, respectively, illustrate the total CO and CO emissions of the cars in four different cases. We find that the total CO emission of the traditional transportation system without ride-sharing (case 1) is 38.06 kg, whereas the total CO emission of the ride-sharing system for case 2, case 3, and case 4 are 35.72 kg, 34.42 kg, and 32.29 kg, respectively. Hence, the proposed ride-sharing system reduces the CO emission by 6.15%, 9.56%, and 15.16% for case 2, case 3, and case 4, respectively. On the other hand, the total CO emission for case 1, case 2, case 3, and case 4 are 1.83 kg, 1.75 kg, 1.69 kg, and 1.48 kg, which, respectively, resulted in the reduction of total CO emissions by 4.37%, 7.65%, and 19.13%. Thus, the results show significant economical and environmental benefits of the proposed dynamic ride-sharing system. The summary of the simulation results of fuel consumption, CO and CO emissions for four different cases are given in Table 3.
Furthermore, we evaluate the average speed and average waiting time of cars for each case in the ride-sharing network. It is found that the average speed of cars for case 1, case 2, case 3, and case 4 are 21.13 km/h, 22.03 km/h, 2.60 km/h, and 23.61 km/h, which resulted in the improvement of average speed by 4.26%, 6.96%, and 11.74%, respectively, compared to case 1. The average waiting time of cars for case 1, case 2, case 3, and case 4 are obtained as 23.56 s, 23.30 s, 23.41 s, and 22.94 s. Note that we achieve notable improvement in the average speed due to reduction of traffic congestion by the proposed ride-sharing system. However, there is no significant difference in the average waiting time between the ride-sharing system (case 4) and the traditional transportation system (case 1) because the same timing sequence of traffic signals is considered, i.e., the waiting time of most of the vehicles is almost the same at different intersections.
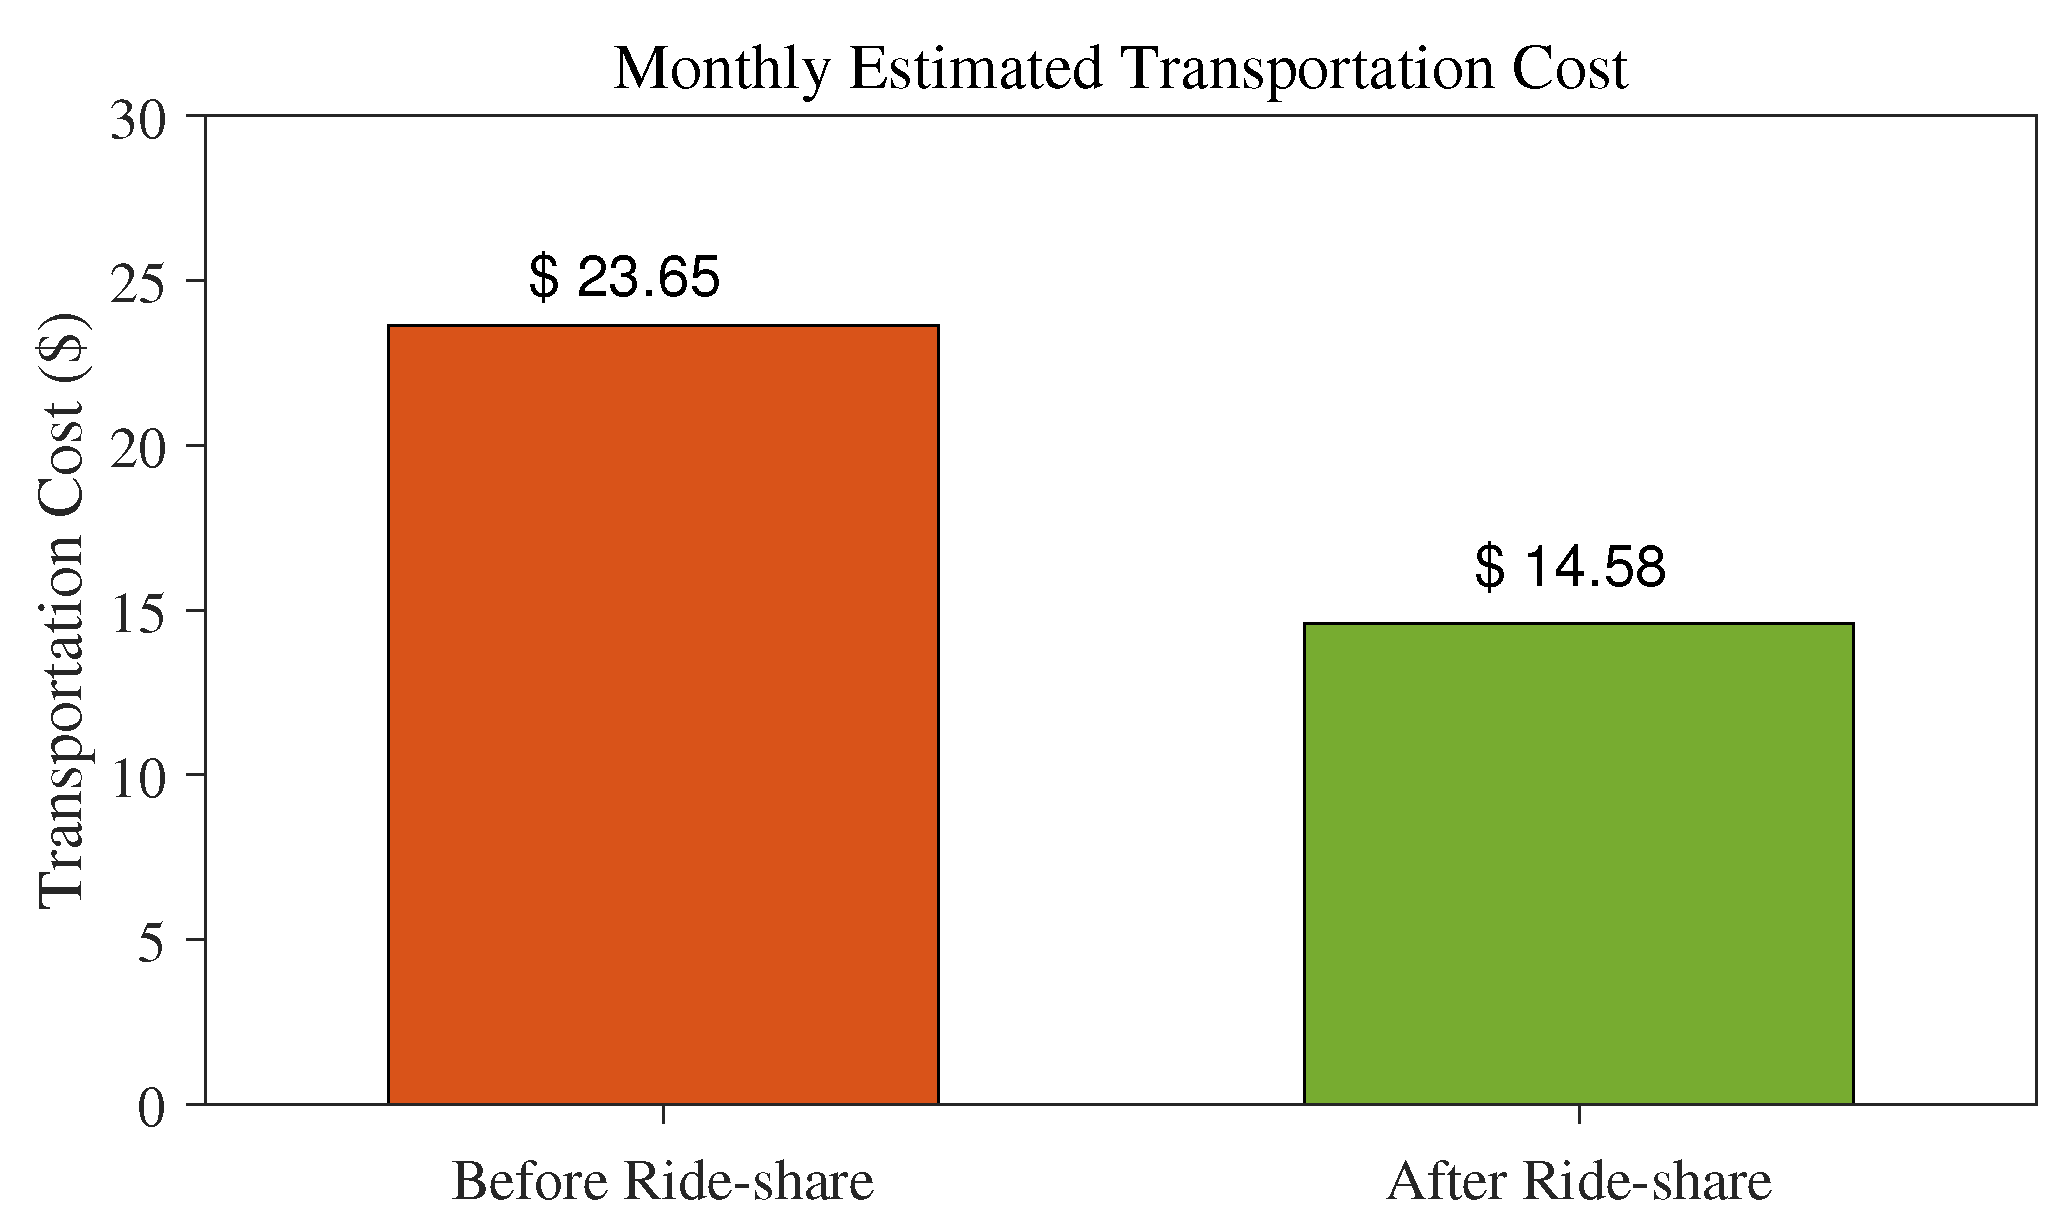
Now, the question arises if an individual might be interested to use the incentive (point rewards) based ride-sharing system. Hence, we have evaluated the potential savings from the proposed system for a single user, who resides in a city and regularly travels to work using their private car. As an example, the comparison of monthly estimated transportation cost before and after using the ride-sharing system is illustrated in Figure 9 and the detail calculation is provided in the Appendix A.
5. Ride-Sharing Experimental Prototype
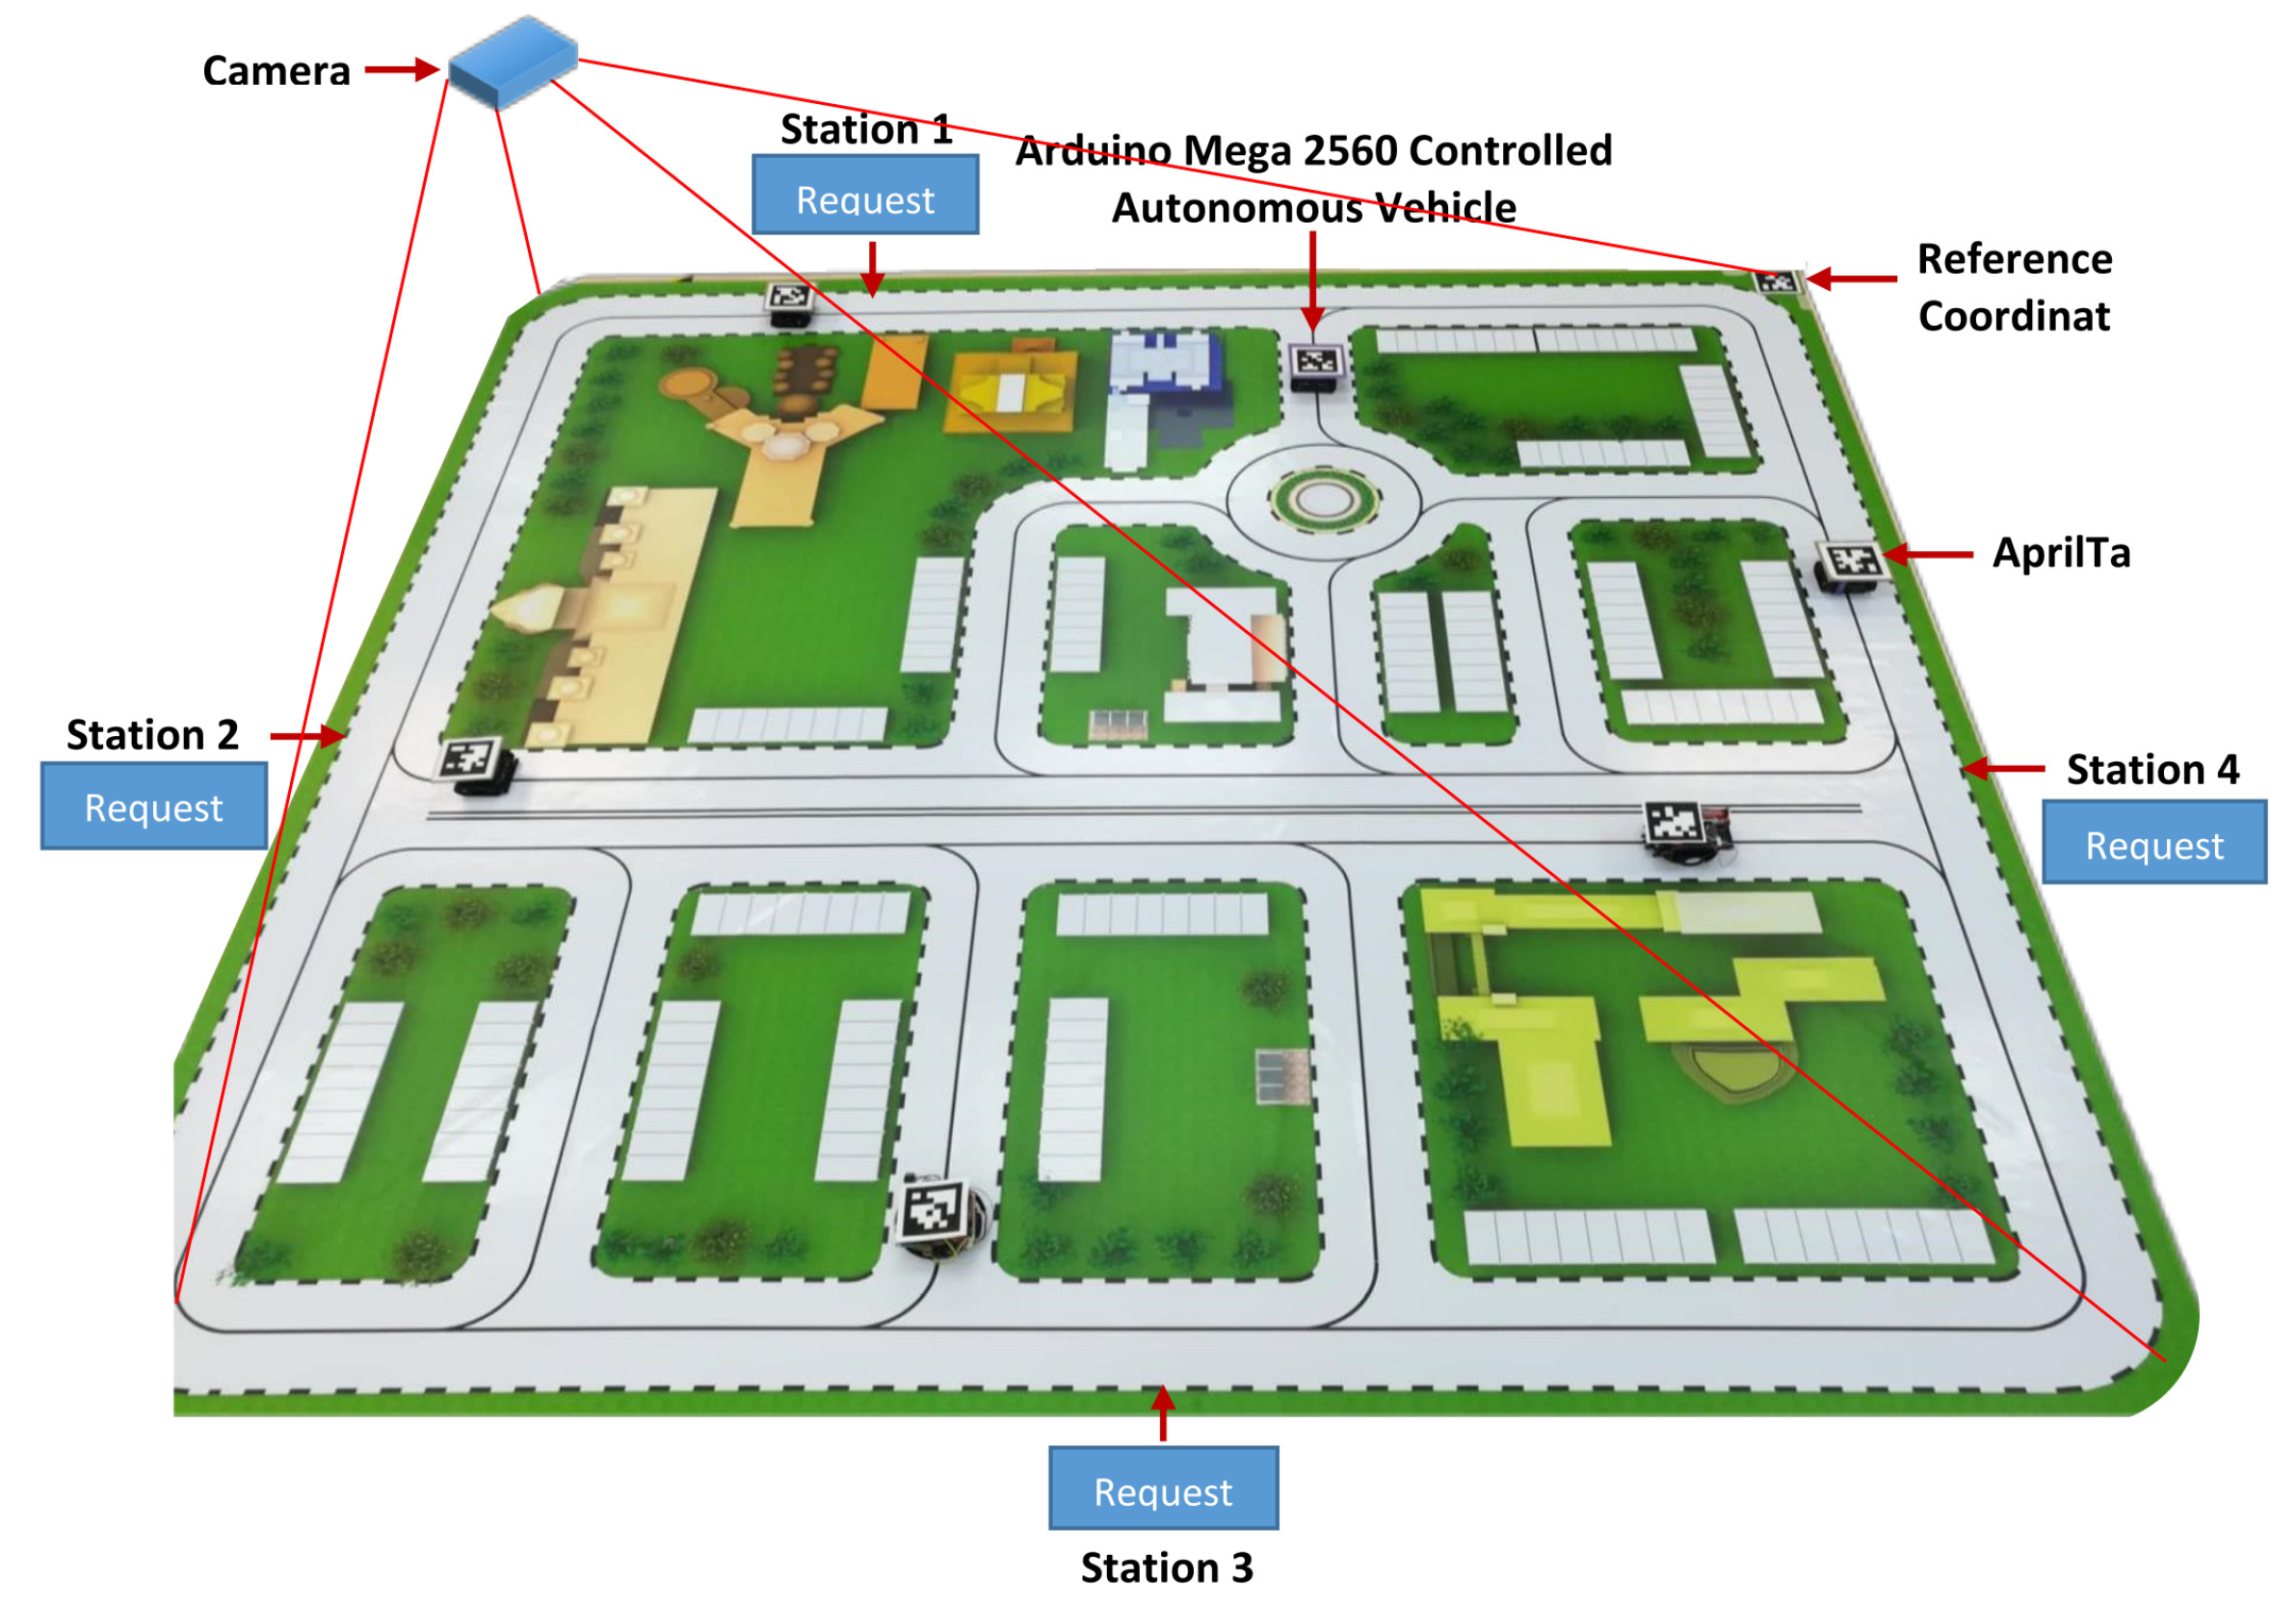
We have developed a lab-scale prototype to test the algorithm and validate the operation of the proposed cooperative dynamic ride-sharing system for a smart city as shown in Figure 10. For simplicity, a single lane road network model of the city is considered with signalized intersections and a four-leg roundabout that allows merging of vehicles. The city map is constructed using a 3D modeling software called SketchUp Pro. The traveling direction of vehicles is set counter-clockwise in the map. The Arduino Mega 2560 controlled small-scale connected autonomous vehicles (AVs) are used that drive through the city network to pick-up passengers when they request for rides and drop-off to their desired destinations. The vehicle will stop by to pick-up passengers only if it is traveling along the same route.
Since, the Internet of Things (IoT) plays a major role in realizing a smart city, thus, the prototype is developed based on wireless communication system. The central control system (cloud) process inputs from the users via mobile phones and gives instruction to control the vehicles accordingly. For wireless communication, we used a DSL router and a few NodeMCUs. NodeMCU is basically an open source IoT platform runs on ESP8266 CPU allowing devices to communicate with each other through a protocol known as MQTT. MQTT on the other hand, refers to an ISO standard publish-subscribe based messaging protocol, which generally requires a message broker to transfer the data. ESP8266 can operate in three different modes: Wi-Fi station, Wi-Fi access point, and both at the same time. We have installed NodeMCU in every vehicle and connected to Arduino to act as data transmitter and receiver. Communication between NodeMCU and Arduino is done through inter-integrated circuit (I2C) protocol. On top of each vehicle, an AprilTag (developed by April Robotics Laboratory) is used for localization. The AprilTag is a 2-D bar code used for different tasks such as camera calibration, robotics, augmented reality, and localization with high accuracy.
In addition, a reference coordinate is set using an AprilTag in the top right corner of the city map. The reference point facilitates the calculation of location and distance of vehicles as well as preventing any change of the coordinate of any vehicle. To capture the tag images, a camera is installed directly on top of the city model. The captured images are then processed to track the position of the vehicles. For each autonomous vehicle, a unique tag is used with a unique ID. The pick-up station is equipped with an LCD powered by another NodeMCU displaying the ride-sharing status including the approaching ride-share vehicle and the passenger status. The dynamic behavior of vehicles is implemented using the microscopic car-following model. The overall process flow of prototype implementation is illustrated in Figure 11.
Note that the motivation of developing the lab-scale experimental prototype is to demonstrate how our proposed system works in practice. However, in real-world implementation the setup will be different, which is out of the scope of our paper.
6. Discussion
Ride-sharing has emerged as a popular and flexible solution to the individual mobility problem. Many scientists have offered various business and technological models of ride-sharing. Most ride-sharing models offer taxi-like service, where some individual deploy their cars flexibly to the other users. Nevertheless, individual users can escape the hassles of finding a parking space in their city and enjoy comfortable trips while traveling without driving. Despite these facts, the overall benefits of ride-sharing are limited or can worsen, particularly when traffic congestion and environmental impacts are taken into account. Furthermore, in current road-traffic situations, the use of autonomous fleet vehicles for ride-sharing is minimal.
In contrast, the proposed incentive-based (point reward) dynamic ride-sharing differs from most existing ones in various aspects. Firstly, it attempts to increase car occupancy rates and reduce the number of cars on roads, since members share their empty seats on the ongoing trips. Secondly, point-based incentive balances the individual’s economic benefits mutually and restricts offering excessive rides similar to any taxi-like services. Therefore, the reduction of congestion or environmental impacts is easily comprehensible. Finally, the microscopic simulation in SUMO and a lab-scale experimental prototype demonstrate how the proposed system works in practice. However, to be an effective solution, at least a certain percentage of users must join the system to reduce the chance of failed ride requests on any route. Furthermore, privacy and security issues need to be overcome to motivate and attract many users. Such issues are kept out of this work scope, which should be studied extensively in the future.
Note that the performance improvement observed in our research is the result of a simulation run as a proof of concept in a simple realistic scenario. The result is expected to differ in complex road-traffic scenarios and further validation using a large-scale implementation/simulation is desired. In a congested situation, if 2–10% of vehicles are reduced through ride-sharing, performance improvement would be evident in any traffic context. Our proposed incentive-based ride-sharing scheme exemplifies how to accomplish this goal.
7. Conclusions
In this paper, we have developed an incentive based (point reward) dynamic ride-sharing transportation system for a smart city that utilizes empty seats in privately owned vehicles. The proposed system thus offers a solution to the serious problem of traffic congestion (that regularly happens in many urban areas) by reducing the number of private cars on road networks. The dynamic ride-sharing operates on a mobile-cloud based system that matches drivers and rides in real-time. We have developed a simulation framework in SUMO considering traffic flow patterns of a real smart city and evaluate the performance of the proposed system. The simulation results show that the proposed system significantly improves the total fuel consumption, total CO and CO emissions, and average speed of vehicles compared to the existing traditional transportation system without ride-sharing. The system also reduces the average waiting time of vehicles. Specifically, we have found that if only 10% riders use ride-sharing service, the total fuel can be saved by 16.40%, and the total CO and CO emissions can be reduced by 15.16% and 19.13%, respectively.
We have built a lab-scale prototype in the form of Internet of Things (IoT) network to test and validate the proposed system. The experiment is performed using small-scale automated vehicles including a central control system, vehicle pick-up and drop-off stations, and wireless communication system. Camera and AprilTag systems are used to track the vehicles accurately. The position tracking is accomplished through an image processing technique that allows successful merging of vehicles at the intersections. It was not feasible to implement global positioning system (GPS) for localization as the prototype is built in the indoor laboratory on a small-scale design. In the future, the proposed cooperative dynamic ride-sharing system can be optimized based on traffic conditions. Moreover, connected and automated vehicles, and advanced traffic signal control systems, can be integrated with the ride-sharing system to discover a congestion free smart city.
Author Contributions
Conceptualization, A.S.M.B. and M.A.S.K.; data curation, Y.F.P.; funding acquisition, M.A.S.K.; methodology, A.S.M.B. and Y.F.P.; project administration, M.A.S.K.; software, A.S.M.B. and Y.F.P.; validation, S.S. and C.P.T.; writing—original draft, A.S.M.B.; writing—review & editing, M.A.S.K., S.S. and C.P.T. All authors have read and agreed to the published version of the manuscript.
Funding
This research was funded by Advanced Engineering Platform of Monash University, Sustainable and SMART Living Lab (S2L) AEP-17-019.
Institutional Review Board Statement
Not applicable.
Informed Consent Statement
Not applicable.
Data Availability Statement
Not applicable.
Acknowledgments
This research is partly supported by Japan Society of the Promotion of Science (JSPS) Grant-in-Aid for Scientific Research (C) 20K04531.
Conflicts of Interest
The authors declare no conflict of interest. The funders had no role in the design of the study; in the collection, analyses, or interpretation of data; in the writing of the manuscript, or in the decision to publish the results.
Appendix A. Evaluation of the Incentive Based Ride-Sharing System
Here we have demonstrated an example of the calculation of estimated monthly transportation cost for a single user before and after using the incentive based ride-sharing system. Note that all calculations are performed using Malaysian Ringgit (RM), which is equivalent to 0.24 United States Dollar ($), and final results are shown in $. Let a single user called X and we consider the followings:
- Fuel price/liter = RM 1.60
- Fuel consumption rate = 5 km/L (under congested traffic condition)
- No. of working days (for X) per month = 22
- Total traveling distance (by X) per day = 14 km (to and fro)
- X can offer maximum ride-share service per month = 22 times
- X offers ride-share service for 50% of the working days and takes the service for remaining 50% days
- The monetary value of 100 reward points ≡ RM 1.0
- The traffic is heavily congested during the travel of X (usually occurs in cities during office hours), which results in 23 min of traveling time
Cost before ride-sharing:
The total fuel consumption (in liter) is
Then, the total fuel cost per month is given as
Cost after ride-sharing:
When X drives 50% of the working days, the total fuel consumption (in liter) is calculated as
Hence, the total fuel cost is
At the same time, X offers ride-share service. Now consider a passenger Y, who is traveling to the same destination as X and located 4 km away from the destination (taking 13 min of traveling time), requests for a ride. By accepting the request, X will earn certain points upon completion of the trip. Hence, the monthly earning (to and fro) of X is calculated using (2) as
On the other hand, X takes ride-share service for remaining 50% working days. For that X will be charged certain points, which is calculated using (1) as
Then, the total transportation cost per month is given as
Therefore, it is found that using the incentive based ride-sharing service X can save approximately $9.07 per month.
References
- European Environment Agency. Occupancy Rates of Passenger Vehicles; Report, 1050; European Environment Agency: Copenhagen, Denmark, 2010. [Google Scholar]
- McGuckin, N.; Fucci, A. Summary of Travel Trends: 2017 National Household Travel Survey; Report; U.S. Department of Transportation, Federal Highway Administration: Washington, DC, USA, 2018.
- Schrank, D.; Eisele, B.; Lomax, T.; Bak, J. 2015 Urban Mobility Scorecard; Report; Texas A&M Transportation Institute and INRIX, Operations and Traffic Management: College Station, TX, USA, 2015. [Google Scholar]
- EPA, U.S. Inventory of U.S. Greenhouse Gas Emissions and Sinks: 1990–2017; Report; National Emissions: Washington, DC, USA, 2019. [Google Scholar]
- Kallas, S. Roadmap to a Single European Transport Area—Towards a Competitive and Resource Efficient Transport System; White Paper; European Commission: Brussels, Belgium, 2011. [Google Scholar]
- Carbon Trust. Dewan Bandaraya Kuala Lumpur Carbon Management Plan 2017–2022; Report; Carbon Trust: Kuala Lumpur, Malaysia, 2017. [Google Scholar]
- Kumar, V.; Bhat, C.R.; Pendyala, R.M.; You, D.; Ben-Elia, E.; Ettema, D. Impacts of incentive-based intervention on peak period traffic: Experience from the Netherlands. Transp. Res. Rec. 2016, 2543, 166–175. [Google Scholar] [CrossRef] [Green Version]
- Hu, X.; Chiu, Y.C.; Zhu, L. Behavior insights for an incentive-based active demand management platform. Int. J. Transp. Sci. Technol. 2015, 4, 119–133. [Google Scholar] [CrossRef] [Green Version]
- Rey, D.; Dixit, V.V.; Ygnace, J.L.; Waller, S.T. An endogenous lottery-based incentive mechanism to promote off-peak usage in congested transit systems. Transp. Policy 2016, 46, 46–55. [Google Scholar] [CrossRef]
- Chan, N.D.; Shaheen, S.A. Ride-sharing in North America: Past, present, and future. Transp. Rev. 2012, 32, 93–112. [Google Scholar] [CrossRef]
- Sovacool, B.K. Solving the Oil independence problem: Is it possible? Energy Policy 2007, 35, 5505–5514. [Google Scholar] [CrossRef]
- Jacobson, S.H.; King, D.M. Fuel saving and ride-sharing in the US: Motivations, limitations, and opportunities. Transp. Res. Part D Transp. Environ. 2009, 14, 14–21. [Google Scholar] [CrossRef]
- International Energy Agency. Saving Oil in a Hurry: Measures for Rapid Demand Restraint in Transport; Report; International Energy Agency: Paris, France, 2005. [Google Scholar]
- Ungemah, D.; Goodin, G.; Dusza, C. Examining incentives and preferential treatment of carpools on managed lane facilities. J. Public Transp. 2007, 10, 151–169. [Google Scholar] [CrossRef] [Green Version]
- Agatz, N.; Erera, A.; Savelsbergh, M.; Wang, X. Optimization for dynamic ride-sharing: A review. Eur. J. Oper. Res. 2012, 223, 295–303. [Google Scholar] [CrossRef]
- Casey, R.F.; Labell, L.N.; Moniz, L.; Royal, J.W.; Sheehan, M.; Sheehan, T.; Brown, A.; Foy, M.; Zirker, M.E.; Schweiger, C.L.; et al. Advanced Public Transportation Systems: The State of the Art Update 2000; Report; Volpe National Transportation Systems Center: Cambridge, UK, 2000. [Google Scholar]
- Agatz, N.; Erera, A.L.; Savelsbergh, M.W.; Wang, X. Dynamic ride-sharing: A simulation study in metro Atlanta. Procedia Soc. Behav. Sci. 2011, 17, 532–550. [Google Scholar] [CrossRef] [Green Version]
- An, S.; Nam, D.; Jayakrishnan, R. Impacts of integrating shared autonomous vehicles into a peer-to-peer ride-sharing system. Procedia Comput. Sci. 2019, 151, 511–518. [Google Scholar] [CrossRef]
- Turoń, K.; Kubik, A. Economic aspects of driving various types of vehicles in intelligent urban transport systems, including car-sharing services and autonomous vehicles. Appl. Sci. 2020, 10, 5580. [Google Scholar] [CrossRef]
- Li, Z.; Hong, Y.; Zhang, Z. An empirical analysis of on-demand ride sharing and traffic congestion. In Proceedings of the International Conference on Information Systems, Dublin, Ireland, 11–14 December 2016; pp. 152–167. [Google Scholar]
- Behrisch, M.; Bieker, L.; Erdmann, J.; Krajzewicz, D. Sumo-simulation of urban mobility: An overview. In Proceedings of the Third International Conference on Advances in System Simulation, Barcelona, Spain, 23–28 October 2011; pp. 63–68. [Google Scholar]
- Song, J.; Wu, Y.; Xu, Z.; Lin, X. Research on car-following model based on SUMO. In Proceedings of the 7th IEEE/International Conference on Advanced Infocomm Technology, Fuzhou, China, 14–16 November 2014; pp. 47–55. [Google Scholar]
Figure 1.
Overall concept of the proposed incentive based dynamic ride-sharing system for a smart city. The ride requests from mobile phones are processed in the cloud in real-time, and the available vehicles are assigned to the passengers.
Figure 1.
Overall concept of the proposed incentive based dynamic ride-sharing system for a smart city. The ride requests from mobile phones are processed in the cloud in real-time, and the available vehicles are assigned to the passengers.

Figure 2.
Structure of the proposed dynamic ride-sharing system. The operation flow is indicated by blue arrows.
Figure 2.
Structure of the proposed dynamic ride-sharing system. The operation flow is indicated by blue arrows.

Figure 3.
Reward points based incentive system for drivers and riders.

Figure 4.
Simulation model of the traffic network of Sunway City developed in SUMO with a zoom-in view showing the traffic flow, signalized intersections, and ride-share pick-up location (point B).
Figure 4.
Simulation model of the traffic network of Sunway City developed in SUMO with a zoom-in view showing the traffic flow, signalized intersections, and ride-share pick-up location (point B).

Figure 5.
Flow-chart of the proposed ride-sharing system.

Figure 6.
Comparison of total fuel used by the passenger cars in four different cases with and without the ride-sharing system.
Figure 6.
Comparison of total fuel used by the passenger cars in four different cases with and without the ride-sharing system.

Figure 7.
Total CO emission by the passenger cars in four different cases with and without the ride-sharing system.
Figure 7.
Total CO emission by the passenger cars in four different cases with and without the ride-sharing system.

Figure 8.
Total CO emission by the passenger cars in four different cases with and without the ride-sharing system.
Figure 8.
Total CO emission by the passenger cars in four different cases with and without the ride-sharing system.

Figure 9.
Comparison of monthly estimated transportation cost before and after using the ride-sharing system.
Figure 9.
Comparison of monthly estimated transportation cost before and after using the ride-sharing system.

Figure 10.
Lab-scale prototype to demonstrate the dynamic ride-sharing system for a smart city.

Figure 11.
Process flow of the ride-sharing prototype using wireless communication system.


Table 1.
Traffic and passenger scaling factors.
| Traffic Condition | |||
|---|---|---|---|
| Average traffic | 1.0 | 1 | 1.0 |
| Slightly congested | 0.80 | 2 | 0.65 |
| Heavily congested | 0.65 | 3 | 0.45 |
| Severely congested | 0.50 | 4 or more | 0.30 |
Table 2.
Ride-sharing users percentage.
| Case | Total User | Riders | Drivers |
|---|---|---|---|
| 1 | 0.0% | 0.0% | 0.0% |
| 2 | 20.0% | 2.5% | 17.5% |
| 3 | 20.0% | 5.0% | 15.0% |
| 4 | 20.0% | 10.0% | 10.0% |
Table 3.
Summary of the ride-sharing system performance.
| Performance Parameters | Case 1 | Case 2 | Case 3 | Case 4 |
|---|---|---|---|---|
| Fuel | ||||
| Average fuel rate/car | 4.48 km/L | 4.67 km/L | 4.71 km/L | 4.89 km/L |
| Average fuel used/car/km | 0.22 L/km | 0.21 L/km | 0.21 L/km | 0.20 L/km |
| Fuel used/car (Point A) | 0.22 L | 0.22 L | 0.21 L | 0.20 L |
| Fuel used/car (Point B) | 0.16 L | 0.16 L | 0.16 L | 0.15 L |
| CO emission | ||||
| Average CO emission/h | 10.96 kg/h | 10.98 kg/h | 11.14 kg/h | 11.22 kg/h |
| Average CO emission/Car/km | 0.52 kg/km | 0.50 kg/km | 0.49 kg/km | 0.48 kg/km |
| CO emission/car (Point A) | 0.53 kg | 0.51 kg | 0.50 kg | 0.49 kg |
| CO emission/car (Point B) | 0.38 kg | 0.37 kg | 0.36 kg | 0.36 kg |
| CO emission | ||||
| Average CO emission/h | 0.54 kg/h | 0.54 kg/h | 0.53 kg/h | 0.53 kg/h |
| Average CO emission/Car/km | 0.025 kg/km | 0.024 kg/km | 0.024 kg/km | 0.022 kg/km |
| CO emission/car (Point A) | 0.026 kg | 0.025 kg | 0.024 kg | 0.022 kg |
| CO emission/car (Point B) | 0.019 kg | 0.018 kg | 0.018 kg | 0.016 kg |
Publisher’s Note: MDPI stays neutral with regard to jurisdictional claims in published maps and institutional affiliations. |
© 2021 by the authors. Licensee MDPI, Basel, Switzerland. This article is an open access article distributed under the terms and conditions of the Creative Commons Attribution (CC BY) license (https://creativecommons.org/licenses/by/4.0/).
Share and Cite
MDPI and ACS Style
Bakibillah, A.S.M.; Paw, Y.F.; Kamal, M.A.S.; Susilawati, S.; Tan, C.P. An Incentive Based Dynamic Ride-Sharing System for Smart Cities. Smart Cities 2021, 4, 532-547. https://0-doi-org.brum.beds.ac.uk/10.3390/smartcities4020028
AMA Style
Bakibillah ASM, Paw YF, Kamal MAS, Susilawati S, Tan CP. An Incentive Based Dynamic Ride-Sharing System for Smart Cities. Smart Cities. 2021; 4(2):532-547. https://0-doi-org.brum.beds.ac.uk/10.3390/smartcities4020028
Chicago/Turabian StyleBakibillah, Abu Saleh Md, Yi Feng Paw, Md Abdus Samad Kamal, Susilawati Susilawati, and Chee Pin Tan. 2021. "An Incentive Based Dynamic Ride-Sharing System for Smart Cities" Smart Cities 4, no. 2: 532-547. https://0-doi-org.brum.beds.ac.uk/10.3390/smartcities4020028