
Data-Driven Analytics Task Management Reasoning Mechanism in Edge Computing
by
 ,
,
Christos Anagnostopoulos
1,* ,
,
Tahani Aladwani
1,
Ibrahim Alghamdi
2 and
Konstantinos Kolomvatsos
3 1
School of Computing Science, University of Glasgow, Glasgow G12 8QQ, UK
2
Computer Science Department, Al-Baha University, Al Bahah 65731, Saudi Arabia
3
Department of Informatics and Telecommunications, University of Thessaly, 382 21 Volos, Greece
*
Author to whom correspondence should be addressed.
Smart Cities 2022, 5(2), 562-582; https://0-doi-org.brum.beds.ac.uk/10.3390/smartcities5020030
Submission received: 14 February 2022
/
Revised: 15 April 2022
/
Accepted: 20 April 2022
/
Published: 24 April 2022
(This article belongs to the Special Issue Intelligent Edge Computing for Smart Cities)
Abstract
:Internet of Things (IoT) applications have led to exploding contextual data for predictive analytics and exploration tasks. Consequently, computationally data-driven tasks at the network edge, such as machine learning models’ training and inference, have become more prevalent. Such tasks require data and resources to be executed at the network edge, while transferring data to Cloud servers negatively affects expected response times and quality of service (QoS). In this paper, we study certain computational offloading techniques in autonomous computing nodes (ANs) at the edge. ANs are distinguished by limited resources that are subject to a variety of constraints that can be violated when executing analytical tasks. In this context, we contribute a task-management mechanism based on approximate fuzzy inference over the popularity of tasks and the percentage of overlapping between the data required by a data-driven task and data available at each AN. Data-driven tasks’ popularity and data availability are fed into a novel two-stages Fuzzy Logic (FL) inference system that determines the probability of either executing tasks locally, offloading them to peer ANs or offloading to Cloud. We showcase that our mechanism efficiently derives such probability per each task, which consequently leads to efficient uncertainty management and optimal actions compared to benchmark models.
1. Introduction
Autonomous driving, smart cities services, and augmented reality (AR) are just a few of new computational-intensive and data-driven applications over the IoT infrastructure [1]. Many of these applications are delay-sensitive and necessitate predictive, analytics and machine learning processes that are thought to be beyond the capability of end-user devices [2]. Cloud computing has been considered as the main solution to reduce the burden of data-driven tasks on edge devices. On the one hand, cloud computing is not the ideal option for delay-sensitive applications because analytic tasks cannot be completed in a real-time manner. This is owing to the fact that cloud data centers are typically located in places far away from real data sources. As a result, data processing in the cloud will eventually require increased communication activities via wide-area networks (WANs). This increases traffic in the network, the probability of tasks failures, and evidently results in relatively high response times [3,4]. Mobile Edge Computing (MEC), on the other hand, has already been adopted as a middle layer between the Cloud layer and the Sensing device layer, since various resources (e.g., computation and storage) could be utilized through LAN (Local Area Network) in MEC architecture. Using MEC resources to execute data-driven tasks (such as predictive modeling and analytic applications built for Unmanned Vehicles on mobile computing nodes) has brought many benefits for the end-users, such as reducing the pressure on the cloud, traffic bottleneck reduction, increase bandwidth availability, and executing data-driven tasks in real-time [5,6,7]. Therefore, under MEC-Cloud computing paradigm, an entity called AN is introduced to provide both computation and transmission services in dynamic environments. However, in an MEC context, ANs have limited capacity and energy, making holistic task execution of all users’ requests by these nodes infeasible or very time consuming, especially when these tasks involve data processing and analytics (e.g., ML models training, outliers detection, data clustering, and classification tasks) [5,8]. Therefore, implementing a data-driven task management mechanism is critical for distributing tasks among ANs and the cloud according to specific criteria such as task urgency in terms of delay, task demand rate, task data accessibility, and the probability of re-using the same tasks in the future. All these factors could dramatically increase the utilization of MEC resources effectively [9], reduce the delivery delay, and improve QoS.
In this article, we propose a data-driven task-management mechanism based on the popularity of each task, which is derived from monitoring the most recent historical task demand rate within a sliding (time) window. According to task popularity, the mechanism can identify which tasks have been recently requested by many applications (end-users) and determine whether to locally execute or offload these tasks based on their statistical popularity. Notably, identifying low-popular tasks could help the mechanism avoid executing these tasks locally in ANs; instead, these tasks could be either sent to the cloud or to neighboring ANs (i.e., tasks have different popularity in different ANs), whereas highly popular tasks can be executed locally. However, most, not to mention all, analytic tasks require direct access to the distributed datasets stored locally on ANs. Hence, task offloading decisions should take into consideration the amount of data that need to be accessed by the tasks. In this context, our mechanism further introduces the data availability constraint in task-offloading decision making. The amount of data needed per task drives the decision making on whether to offload a task to neighboring ANs (peer ANs) based on their data availability or to the cloud.
What is noteworthy is that both of these factors (popularity of a task and amount of required data) significantly affect the offloading decision making for analytical tasks. However, in certain cases, these factors can possibly work in opposite directions, e.g., high task popularity and low data availability or vice versa. This requires the ability of the decision-making mechanism on an AN to swiftly balance between these factors by incorporating information from nearby ANs. This information includes the estimation of task popularity and the amount of data being available per task in an AN. In order to efficiently and effectively handle inherent uncertainties from these estimations (locally obtained from ANs), we propose the adoption of the Fuzzy Inference to represent decision-making rules based on the principles of Fuzzy Logic (FL). FL has been employed to determine the probability of offloading a task according to these factors. The main contribution of this work is summarized as follows:
- An architecture of collaboration between ANs and cloud computing is introduced. Furthermore, the design of ANs has been detailed.
- A novel offloading decision-making mechanism has been introduced based on tasks’ popularity, outliers, and data availability.
- A novel two-stages FL system has been developed to determine the probability of offloading for each task.
- A comprehensive comparative assessment of the proposed method against alternative mechanisms found in the literature showcase the applicability of our paradigm in edge computing environments.
The remainder of this paper is organized as follows. Section 2 elaborates on the related work in task offloading in EC environments, while Section 3 introduces an overview of the meaning of data-driven tasks, and the design of service architecture. Section 4 provides the problem formulation in our context and the task management factors. Section 5 explains task management reasoning and Section 6 reports on our experimental evolution. Section 7 concludes this paper with our future research agenda on this direction.
2. Related Work
2.1. Task Offloading
Due to resource, energy, and storage limitations in MEC, selecting the correct tasks management mechanism is a crucial issue, since MEC nodes deal with a huge volume of requests from end-users/applications [10]. Therefore, selecting the right tasks management mechanism can improve computing performance, execute the tasks in real-time, lower system costs, and maximize the use of available computing resources. With the deepening of research, several mechanisms have been developed to manage data-driven task offloading in MEC nodes.
Wang et al. [11] suggested a management mechanism for investing similarity between service requests. They have assumed similar tasks would require almost the same data from the same sensors. Therefore, they have suggested reorganizing the original tasks according to each related sensor in order to reduce the translation time and cost. However, in this study, the fog layer was viewed as a relay layer between the application layer and the cloud layer, despite this layer having some resources, and it can execute some tasks, particularly data-driven tasks, that require data to be passed through this layer before reaching the cloud. This work [12] suggests an offloading mechanism for computation-intensive applications either in Vehicle Edge Computing (VEC) or in Roadside Units (RSUs). While this work considers making offloading decisions for extensive computational applications (e.g., autonomous driving and vehicular video stream), data access in each node has not been considered. Nguyen et al. [13] focused on computation-intensive tasks that are generated by vehicles. Offloading decisions have been made based on priority, urgency, channel gain, and distance. However, the amount of data availability in each node has been overlooked in this study. Li et al. [1] developed a theoretical contract-based offloading paradigm from communication and computing perspectives. The paradigm focuses on compute-intensive and delay-sensitive tasks. The results have shown that the paradigm reduces system delay and energy consumption. However, tasks’ demands in each node was not taken into account during offloading decisions. Zhang et al. [14] proposed a theoretical contract approach to execution decisions. The goal of this study is to divide the road into various segments, each with its own set of RSUs to help with task processing.
Ning et al. [13] concentrated on computation-intensive tasks generated by vehicles. While offloading decisions are made based on the value of the utility function, which comprised four factors: priority, urgency, channel gain, and distance; each one has its own set of evaluation criteria. The results reveal that the suggested model outperforms the benchmark approaches in terms of execution time. However, the types of tasks that are dependent on a specific amount of data have been overlooked in this study.
Li et al. [1] developed a theoretical contract-based offloading paradigm. The proposed paradigm has investigated from the communication and computing perspectives, with a focus on compute-intensive and delay-sensitive tasks. The proposed model minimizes system latency and energy usage, according to the results. However, the amount of data required by each task has been ignored.
Zhang et al. [15] has built an efficient prediction model to make task processing decisions either locally on the vehicle or remotely based on tasks’ length. However, this model depends on the processing time, processing cost, and communication service providers. Despite this work having covered the type of tasks that require certain files to be executed, it has not discussed the amount of data in these files and how they could affect the offloading decision.
Sonmez et al. [16] demosntratedn a two-stage FL interference model. This model considers both application requirements and EC resource utilities. The first FL stage focuses on system utilities (e.g., CPU utilization), while the second stage focuses on application requirements (e.g., task length and sensitivity). The primary purpose of this research is to improve the response time and extend the battery life of end-user devices. However, this paper discussed the upload/download data rates for each task, but it has not studied the percentage of data availability in EC. Overall, most of these studies have mentioned compute-intensive tasks, but the nature of these tasks has rarely been considered, e.g., their popularity and tasks demands have been ignored, with the exception of [15]. As far as we know, this is one of the few studies that have considered the common factors between tasks and AN in the management mechanism design to fill the gaps left by the mentioned works.
2.2. FL Inference System
FL has been utilized in offloading decision making. It has been defined by Welstead in [17] as set of rules and regulations which defines boundaries and tells us what to do to be successful in solving problems within these boundaries ”. This type of logic tries to imitate human behavior in making decisions by avoiding the strict boundaries between categories in contrast to crisp logic. FL depends on studying the degree of membership and belonging. Therefore, FL is considered as an excellent option to manage real-world uncertainty due to the rapidly changing in different scenarios models [18]. Therefore, it has been employed for solving online and real-time problems. Take for illustration, the decision-making process for a heater according to the weather, defining a person relative to an age group, and the security level in shopping or trad online. In our context, it has been applied in many studies in order to make execution decisions in MEC Models. Nguyen et al. [19] adapted FL to reduce the number of failed tasks resulting from transmission collisions and support real-time applications. The proposed FL system aims to determine where each task should be executed either by its own resources, a local edge server, or the cloud. The proposed decision-making model is based on a two stages. The first stage focuses on where to place the incoming task, while the second stage determines the task processing place. However this study has focused primarily on the resources availability while data assessment and task popularity are ignored.
Almutairi et al. [20] used the FL system to make the processing decisions for tasks either in the edge or in cloud. This work has implemented an FL based on three parameters: CPU utilization, WAN bandwidth, and delay sensitivity. This model provides much better results in terms of the average unsuccessful tasks and resources utilization compared to benchmark algorithms. However, even though the tasks sensitivities has been considered, data accessing is excluded in this work. Generally, FL has been discussed in many studies in order to improve MEC QoS. However, to the best of our knowledge, using tasks popularity and data overlapping as inputs to FL systems to improve MEC performance has not been studied yet for this domain.
3. System Model
This section provides an overview of the definitions of data-driven tasks, including their applications and challenges. Then, the proposed architecture is presented.
3.1. Data-Driven Tasks
The concept of data-driven tasks has drawn increased attention in the last few years. This term refers to tasks that rely heavily on raw data (e.g., text, photos, videos, medical data, weather information, etc.) that is generated by smart devices such as sensors and smartphones. These data are used by MEC/Cloud servers for knowledge building and decision-making purposes. As mentioned in [21], the core of data-driven tasks is data analysis. Noteworthy, data-driven analytic holds unlimited potential for assisting various domains of real-world scenarios such as dealing with air pollution, climate change, oil spill management, moving target tracking, healthcare monitoring, hazard analysis, real-time monitoring of stochastic damage in aerospace structures, forest fire propagation prediction, volcanic ash propagation, and traffic jams prediction could be precisely predicted according to data that have been collected by edge devises. However, there are challenges related to data-driven tasks. The data-driven tasks are considered to be compute-intensive and very complicated for edge devices. Hence, offloading a task for unsuitable MEC nodes would negatively affect QoS [22]. Additionally, in such types of tasks, the value of a subset of sensors and data may vary quickly due to the dynamic nature of the environment. To overcome this issue, sampling rates methods should be considered. On the other side, sampling rates result in load imbalance and bottleneck problems. To address this challenge, we investigate data overlapping between tasks and nodes according to a query formulation, as we will elaborate later.
3.2. Service Architecture
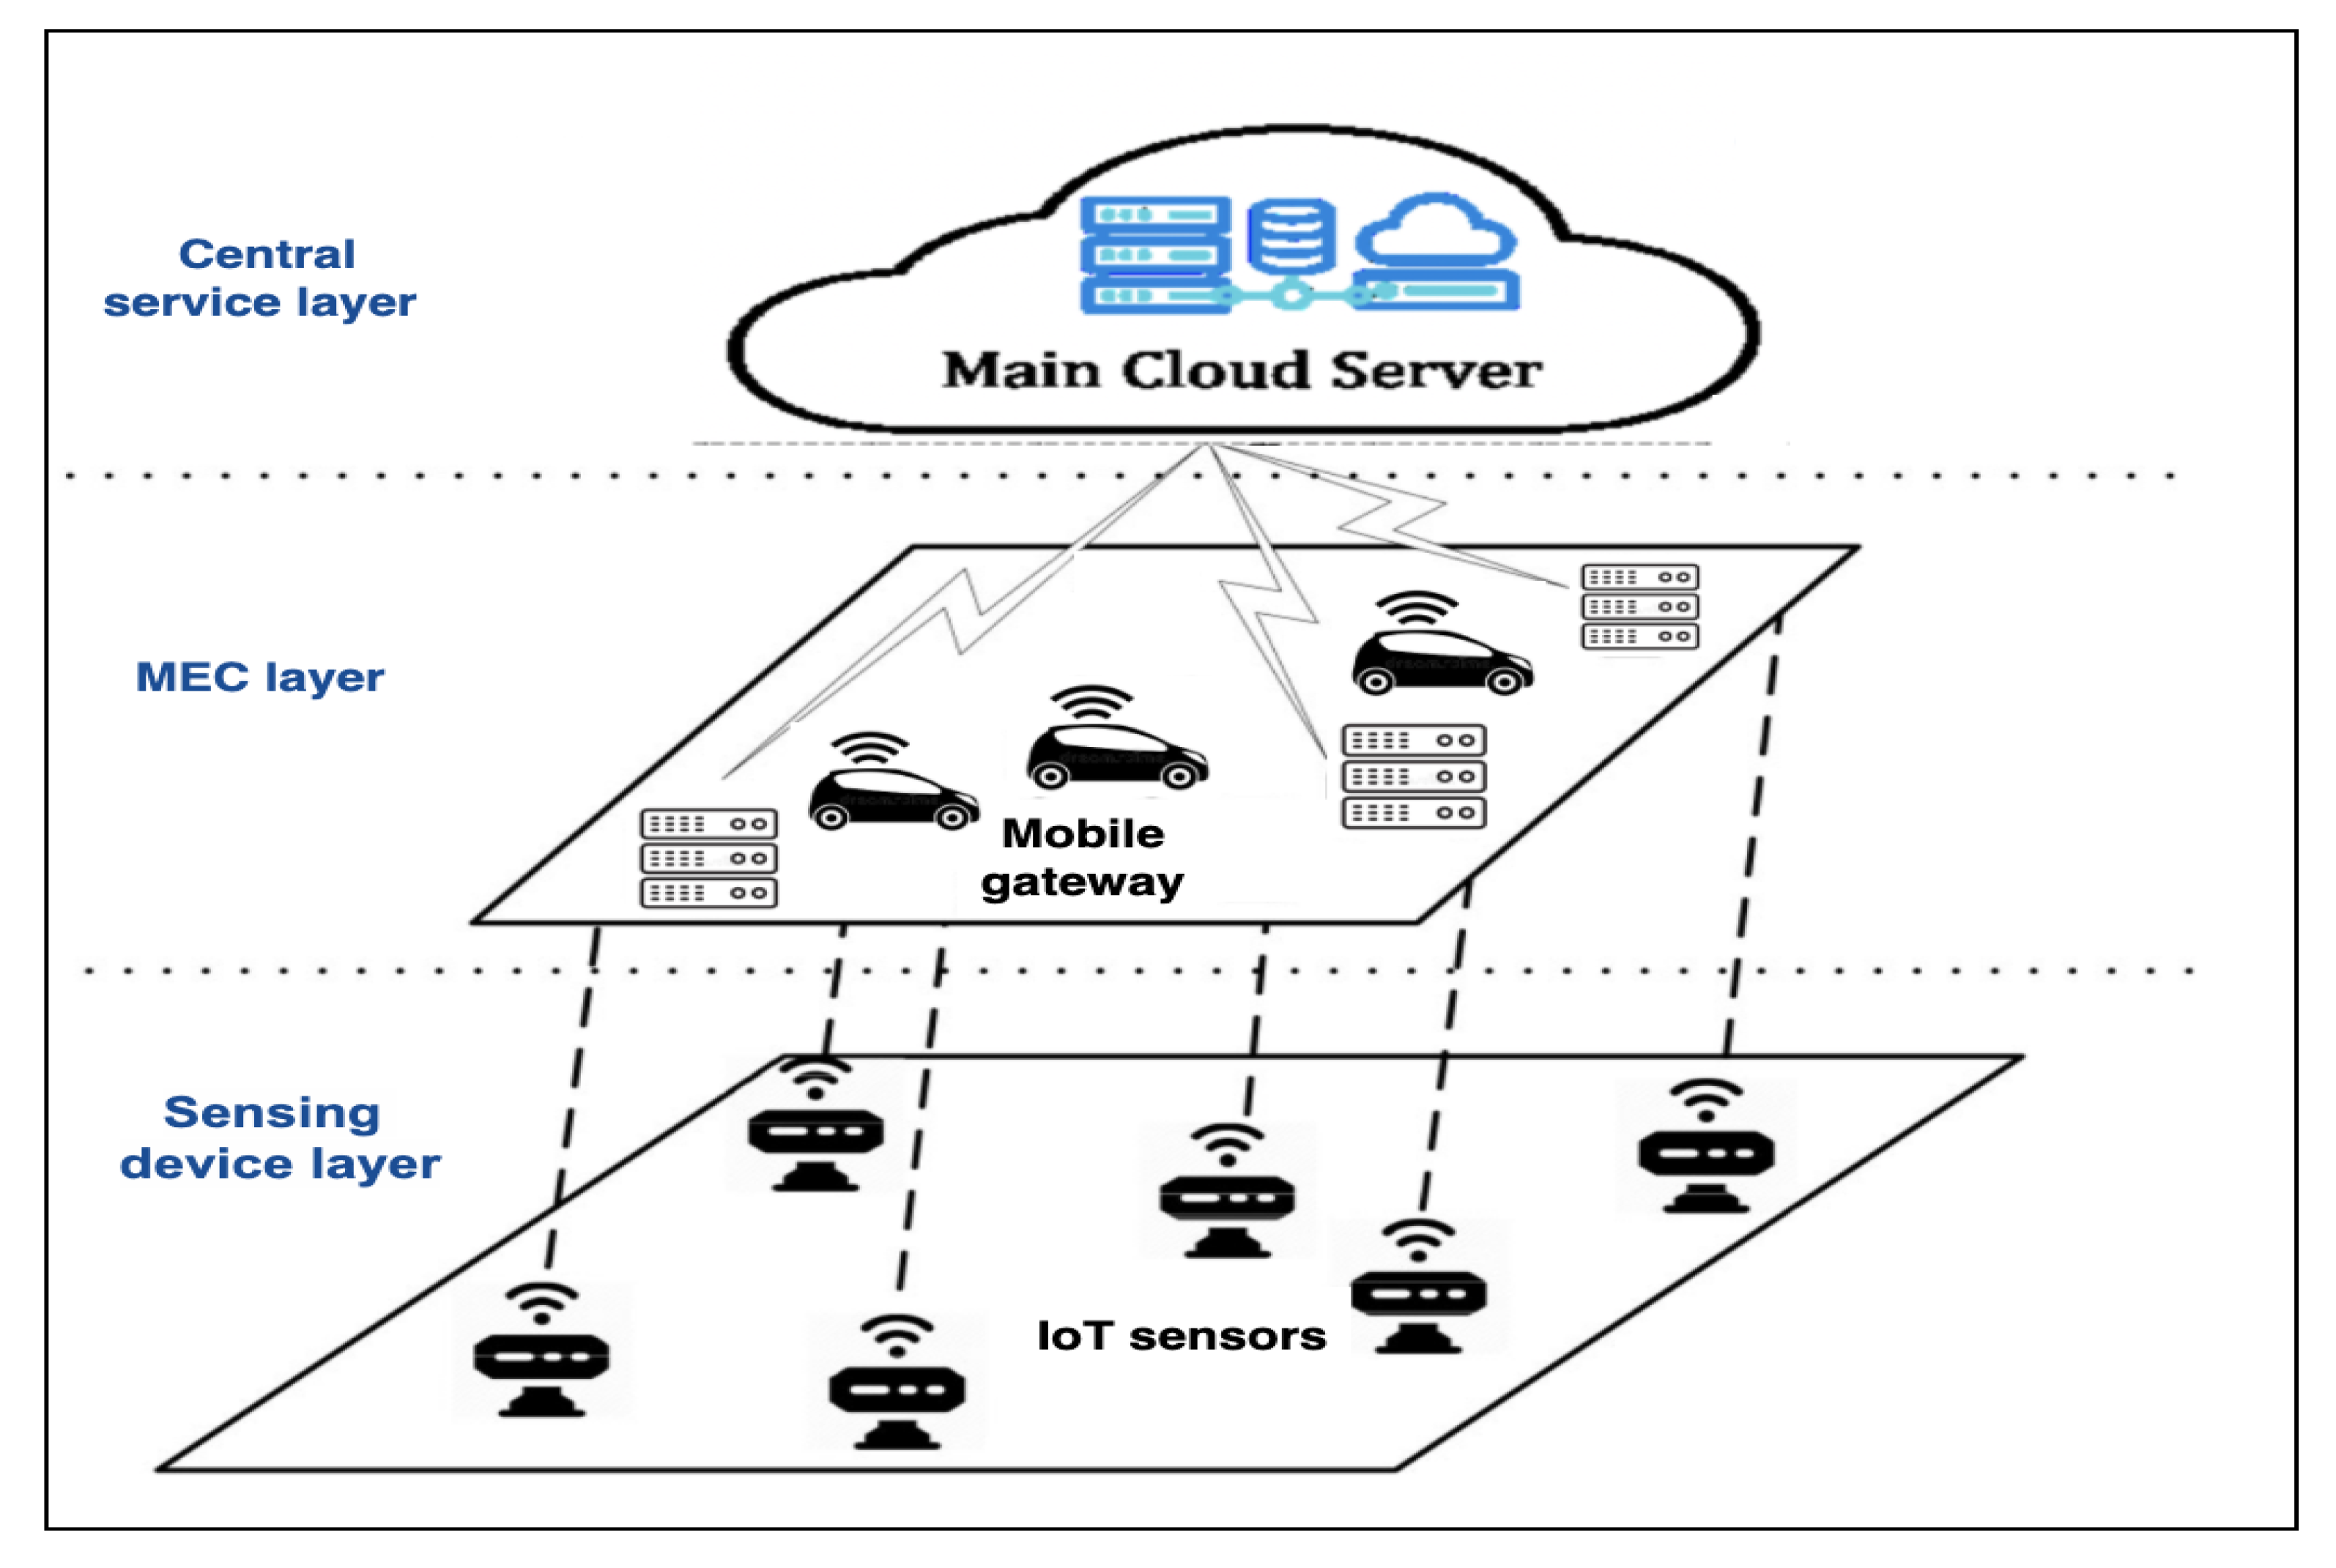
Our system under consideration consists of a three-layer service architecture for data-driven tasks as shown in Figure 1: the sensing device layer, MEC layer, and Cloud computing layer. In the Sensing/Device, data are generated by unlimited devices (e.g., sensors and smart devices). For example, sensors that are spreading around specific area to collect data and transmit it to the MEC layer [11]. The MEC layer is a computing layer that sits between the sensing device layer and the cloud layers, which includes a set of collaborative ANs, such as vehicles, which are used to support dynamic environments providing, e.g., computing services for pedestrians (mobile users), traffic congestion services in smart cities, and computationally intensive, real-time, and delay sensitive applications [16]. When ANs receive the data generated by the sensing device layer, they store them locally until data accessing pattern (data overlapping) is required. Meanwhile, ANs also could execute some data-driven tasks locally according to tasks’ size, time constraint, popularity, data accessing, and resources availability and make a decision for other tasks, either to execute them locally and offload them to another AN or the cloud [12]. The Cloud layer has unlimited computation resources and, thus, tasks can be offloaded through, e.g., Base Stations (BSs) from the MEC layers due to limited resources or failure in completing tasks. However, determining the best layer for each task execution depends on the adopted task management mechanism and certain analytic application criteria.
4. Problem Fundamentals
In this section, we present the problem statement as follows: how do we efficiently assign data-driven analytic tasks to MEC/Cloud to minimize the task execution delay and increase MEC resource utilization. Then, we introduce the tasks’ management factors that have been adopted in this study.
4.1. Problem Statement
We consider the ANs-enable MEC system with a set of ANs, denoted by . Each AN collects real-valued contextual data points denoted by , with d -dimensional points, where each dimension refers to a specific feature (e.g., temperature, humidity). The node stores them locally in dataset . Each node has a neighborhood of directly communicating nodes . Moreover, node communicates with the end-users/applications and the cloud. ANs can execute locally certain analytic tasks because they are equipped with specific computing resources. However, such resources might be limited for some tasks; thus, any decision of executing locally or offloading the tasks should be made carefully. Therefore, each node needs to obtain certain information regarding the analytic tasks based on the following essential factors. First, the rate of tasks requests: A node monitors the number of requests for each analytic task () coming with different request rate () from end-users (applications). Based on this request rate per task, node can assess which of the requested tasks is most popular. Evidently, popular tasks are preferred to be locally executed, hence avoiding further delays. This also helps to predict future tasks requests based on the current demands and their popularity. Moreover, node can store the popular tasks in order to re-use them in the future thus potentially reducing the response time and resource consumption for future requests, while less popular tasks could be offloaded to node’s neighborhood or to the cloud. Second, according to the task request rate , some tasks are either extremely popular (in comparison to other tasks) or extremely rare. These are referred to as outlier tasks. Each node can locally identify its own outlier tasks as it will be elaborated later. Generally, outlier tasks with high popularity (i.e., tasks are highly demanded) will be locally executed. On the other hand, outlier tasks with very low popularity can be offloaded to the available neighboring node or, if none are available, they are offloaded to the cloud. The non-outlier tasks have all three options (local execution, offloading to available neighbor(s), or to the cloud). Third, as previously stated, each node collects real-valued data and stores it locally in . It is worth noting that the type and amount of data in each node significantly impacts whether a task should be locally executed or offloaded. Since we primarily focus on analytical tasks (e.g., ML model training and inference), such tasks require a specified amount of data from to be executed. Specifically, consider a series of tasks arrive in node , which are treated in a queue until their execution or offloading decision is made. Such tasks have specific demands including the amount of data being accessed in order to be executed. Imagine for instance an analytic task as a series of value-range queries, which define a specific data subspace over the node ’s availability data in . In these cases, analytic task might need a huge amount of the available data (e.g., >90% of the data) found in node , while only few data (e.g., >10%) are available in another node . Consequently, offloading such data-driven task to node may demand extra time, resources, and the transmission of the required amount of data from to . Therefore, our mechanism considers the amount of accessible data required for a given task to make the offloading decision.
Hence, given an incoming task at node , the node locally estimates the probability of this tasks to be outlier (based on a recent history of demand rates) and the percentage of available data required. This information is used by node to come up with the first two decisions/actions: = ‘local tasks execution’ or = ‘task offloading’, and if action is selected, then node should swiftly make decisions in terms of in which neighboring node task should offload (action ) or whether to offload that to the cloud (action ).
4.2. Task Management Factors
In this section, we elaborate on the basic factors for the proposed task management mechanism to be used for inferring the right execution decision for each task on each node based on the factors introduced in the previous section, including the popularity of tasks and the corresponding data access availability.
4.2.1. Task Popularity
We first elaborate on a methodology that determines the popularity of a task in a specific node within a sliding time window of size W. Specifically, assume a discrete time domain . At each time instance t, node observes a number of demands from each task coming from end-users or applications. The demand of task is linked with a request rate as requested by end-users (applications) and monitored within the time window (horizon) W. Hence, given node , a series of tasks arrive with rate . The demands for each task in W recent time instances are recorded in the task requests vector , where element indicates the number of the incoming requests of task by end-users to node at time instance . The requests vector over time window W plays a significant role in storing the recent historical trends of each task ’s demands which will be used for estimating the popularity of task in a node .
To derive such popularity for , node groups the corresponding task demands within the time window adopting lightweight unsupervised clustering. The clustering algorithm divides the task demands of into groups (clusters). Each cluster contains a set of demands that have similarities between them according to the tasks’ arrivals within the time window. Specifically, we adopt the Subtractive Clustering [23] since the number of the clusters derived cannot be known beforehand neither is the same over different time windows. Subtractive clustering derives a set of clusters over the demands of task across the most recent W time instances. Each cluster is represented by a task demands clusterhead , . The clusterhead will help us in estimating the demands density for the arriving task during time window W and the amount of requests per cluster as will be elaborated below. Given these (recently historical) statistics, we can define the popularity of the task based in its demanding behavior within the time window. If the task is associated with relatively many clusters within the specific time horizon W, then it is (statistically) considered more popular than other tasks associated with less clusters. Moreover, the more clusters are derived from clustering, the higher the variability and amount of task demands with different rates occur during the time window.
Therefore, we define the cluster density, which indicates the amount of demands of the within a specific time duration. Specifically, consider the ℓ-th cluster , which maintains the demand values and is represented by the clusterhead demand . We then define cluster variance . Hence, in turn, we introduce the cluster density as the amount of the task demand values being within a squared distance of the cluster variance from the corresponding clusterhead (centroid).
Density depicts the number of task demands that are in a distance from the centroid less than the deviation. The deviation is adopted to define our strategy concerning whether we want to be very ‘strict’ and requires many demand values to be very close to the centroid in order to conclude a high density. Within a cluster, there are historical demand values for task observed recent W time instances. We pay significant attention on the clusters exhibiting a high density around the centroid. This density is strong evidence that multiple task demand values are realized around the centroid. For aggregating the demand information that clusters convey, we define a weighting scheme delivering a high weight for clusters with a high density. Specifically, based on the derived clusters, the popularity index for tasks is the linear combination of the derived clusters weighted by their normalized densities:
and, thus, the popularity demand index for task within recent W time instances across all the derived clusters is defined as follows.
4.2.2. Outlier Tasks
We introduce the concept of task outlier, which will support the decision-making process in our mechanism. The classification of a task as an outlier is used to determine the statistical extreme (non usual) demands of this task within recent W time instances. Such mechanism undertakes the responsibility of annotating some of the tasks as outliers according to the popularity compared with the other tasks on a node.
The outlier tasks are divided into two classes: outliers that have relatively very high popularity than the usual trend and outliers that have relatively very low popularity. Classify them into these two classes based on adapting a lightweight process and using the Median Absolute Deviation (MAD) around the Median (MAD) across the popularity indices of the tasks in requested in node in the least W time instances.
The median of the popularity indices is used as a separating point between the high and low popularity tasks. Based on the popularity median over the popularity values , we can then calculate the MAD of the tasks .
Given this statistic, we define the outlier indicator for task based on its popularity as follows.
Task is an outlier, if is greater than the empirically derived threshold , i.e., the outlier indicator is described as follows.
Based on the outlier tasks identification and the associated popularity indices of these tasks, node can obtain more certain decisions, either locally executing a very popular (outlier) task or offloading a very low popular (outlier) task. Nonetheless, the amount of data required for those outlier tasks (and of course of all the tasks) will further help the node to proceed with a right offloading decision as it will be elaborated later. As an informal guideline, the outliers filter selects those tasks with high popularity while having high data overlap with nodes can select action . In contrast, very low popular tasks with low data overlapping will select action .
4.2.3. Task’s Data Overlapping
Given an analytic task on a node , we introduce the concept of the data overlapping, which indicates an estimation of the percentage of data (out of the entire dataset ) required for executing analytic task . We concentrate on analytics tasks such as training machine learning models for applications such as federated learning, which has become increasingly popular and helpful in recent years. In this context, for instance, data points x in a node represent real-values, e.g., sensed data that have been collected from IoT devises. These data are the basis to determine how much is suitable for a task to be executed locally in node . Meanwhile, the availability of data that each task requires varies from node to node. Therefore, if a task offloaded to has only of data that it needs to be executed, this means we need to bring of data in order to execute this task locally. This could lead to increases in resource consumption and the response time growing up. Given the representation of an analytic task via a (range) selection query over a data sub-space defined be the dataset , we define data overlapping as the ratio of the data points satisfying task query out of the data points stored in node’s dataset. That is, a data point satisfies the range query if the following statement holds true.
Hence, the degree of data overlapping of task represented via query is defined as follows.
5. Task Management Reasoning
5.1. Fuzzy Linguistic Modeling
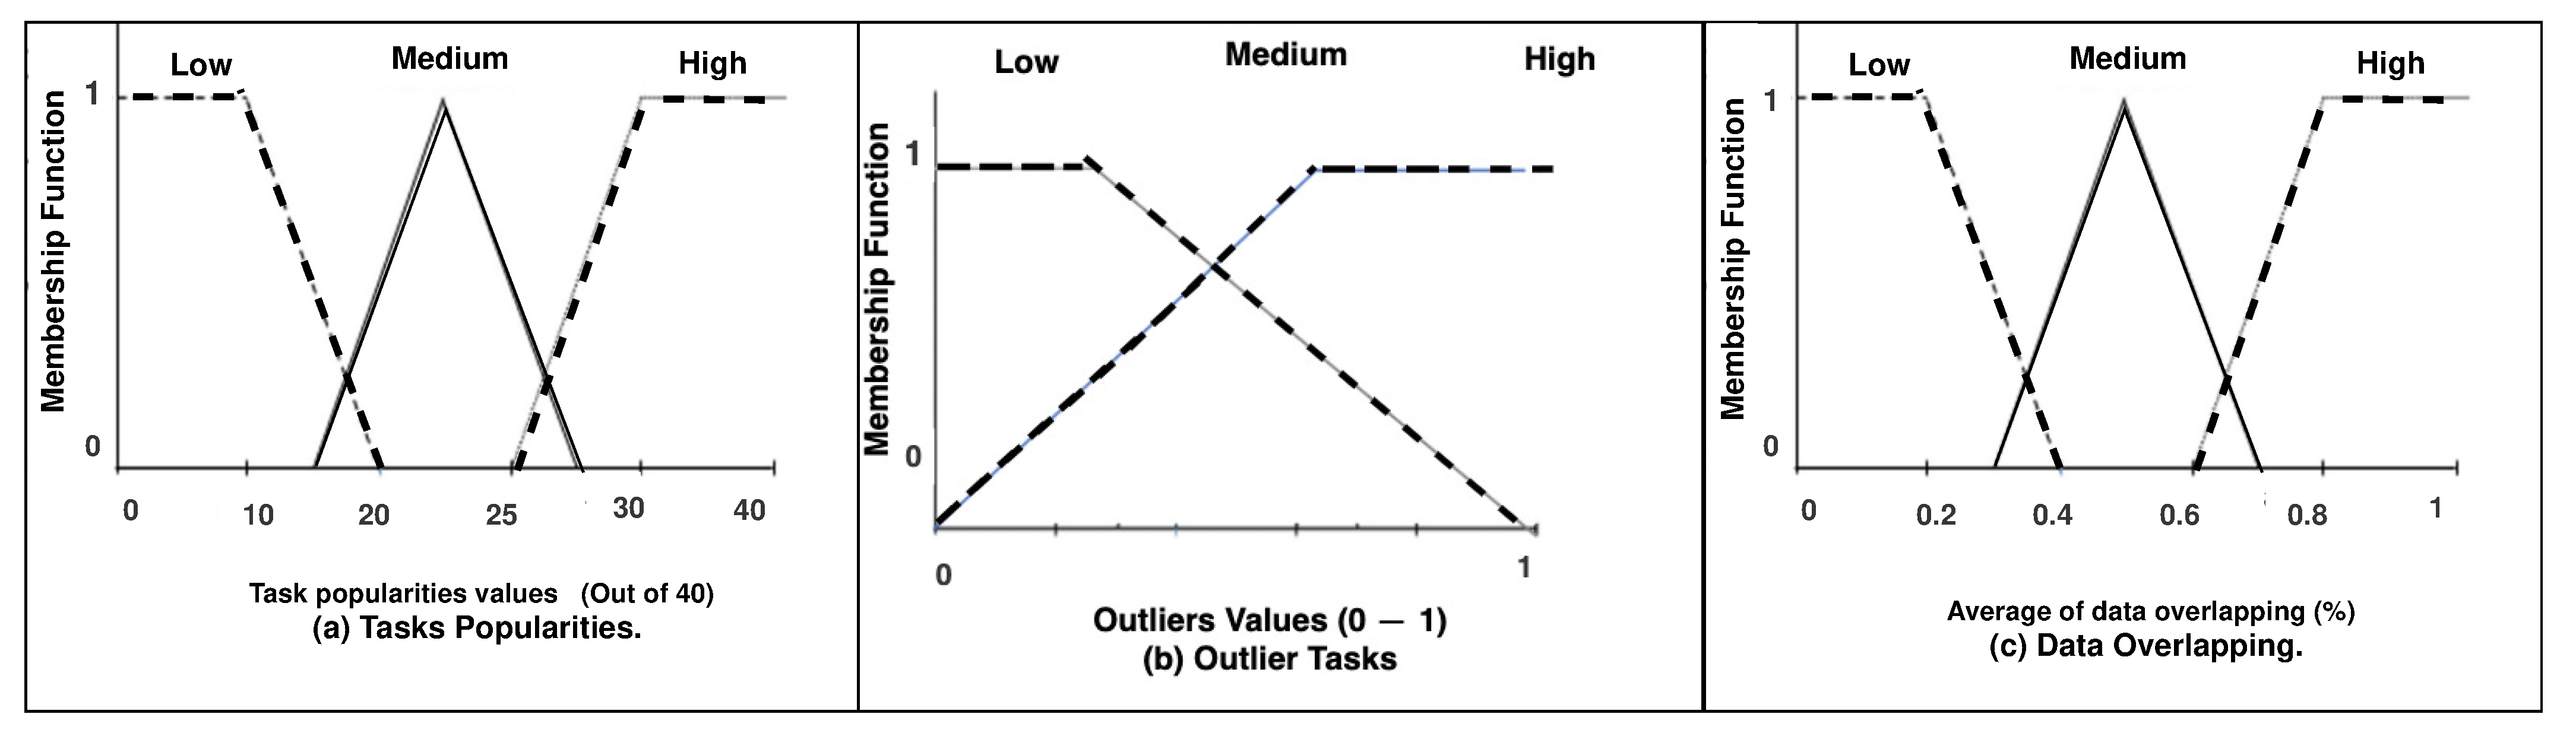
Given a node receiving demands for the analytics task over the node’s dataset , we obtain the corresponding popularity , outlier and data overlapping . In this section, we are introducing a reasoning mechanism that takes into consideration the above-mentioned factors to proceed with task offloading decisions by balancing between the task demands, nodes’ capability, and nodes’ data availability. In order to deal with decision making reasoning, FL inference has been adapted to handle the inherent uncertainty and approximation of these factors in dynamic environments. Since it is the most prevalent strategy for dealing with rapid change in uncertain systems [24]. This is achieved by adapted fuzzy inference rules over linguistic variables that can model this type of uncertainty. There are many advantages for such inference performed locally on a node. First, it can easily cope with multi-criteria decision-making models by incorporating multiple factors in the same model. Second, it is capable of dealing with uncertainty in a dynamic context without complex mathematical models. Third, its lightweight computational complexity provides an explainable decision-making methodology [16]. This explainability is based on linguistic variables that reflect the uncertainty derived from the values of the factors , , and . In this context, popularity (fuzzy variable) is associated with three linguistic fuzzy values reflecting a high, medium, and low value of popularity for a specific task. Similarly, data overlapping (fuzzy variable) is associated with the linguistic values reflecting a high, medium, and low values of data overlapping derived from the task’s query data subspace over node’s data space. The outlier indicator (as a fuzzy variable) takes two linguistic values reflecting whether is an outlier or not, as depicted in Figure 2. Given a linguistic value linked to a fuzzy variable, a membership function is defined in order to indicate the possibility that a value of the variable belongs, at certain degree, to the linguistic value. Specifically, given a data overlapping value , we associate this value with the linguistic value high via membership function . For instance, if the data overlapping for task , then this can possibly be considered as high data overlapping with possibility . We similarly define these membership functions for the rest of the linguistic values for all factors.
There are different membership functions forms that can be adapted for fuzzy based reasoning, such as trapezoidal, piecewise linear, singleton, triangular, and Gaussian [25]. In our context, we consider the triangular form to represent membership functions, which is considered as the most common form according to [19]. To summarize, we obtain the next sets of membership functions of the fuzzy linguistic values for task popularity , data overlapping degree , and outlier indicator , respectively.
5.2. Two-Stage Fuzzy Logic-Based Reasoning
Given the set of membership functions, we introduce a novel two-stage FL reasoning engine that makes the decision of task execution locally (actions ), offloading to another node (action ) or offloading to the cloud (action ), as in Algorithm 1. Handling all these decisions in a single-stage FL is a complicated operation [16]. Therefore, we have adapted a two-stage FL system in order to reduce the system’s complexity The first inference stage S1 deals with the decisions (actions) = ‘local task execution’ and = ‘task offloading’. The output of S1 is the offloading probability for a task given input , , and , as will be elaborated later in this section. The second inference stage S2 is based on S1’s output. In particular, if action is selected (having the highest probability), then node swiftly decides in which neighboring node task should be offloaded (action ), or it offloads to the cloud (action ).
The proposed tow-stage reasoning mechanism runs on a specific node , which plays the role of the ‘leader’ in neighborhood . This role is periodically assigned to nodes from the neighborhood when certain criteria are met, e.g., remaining energy, computational capacity, and communication availability. This assignment is achieved via certain leader election mechanisms. We do not elaborate on these mechanisms, since it is beyond of the scope of this paper. In the remainder, for the simplicity of notation, we assume that node is assigned with this leadership role to execute the two-stage reasoning engine, where all neighboring nodes directly communicate with their leader . Both FL system stages essentially follow the same steps, with the number of tasks varying. In particular, the first stage deals with all tasks, while the second stage only works with the set of tasks that could not be executed locally.
| Algorithm 1: Two-stage FL inference system pseudocode |
Input: with their parameters Output: Select the right Computational Resources (locally , , The cloud )
|
5.2.1. First Stage Reasoning S)
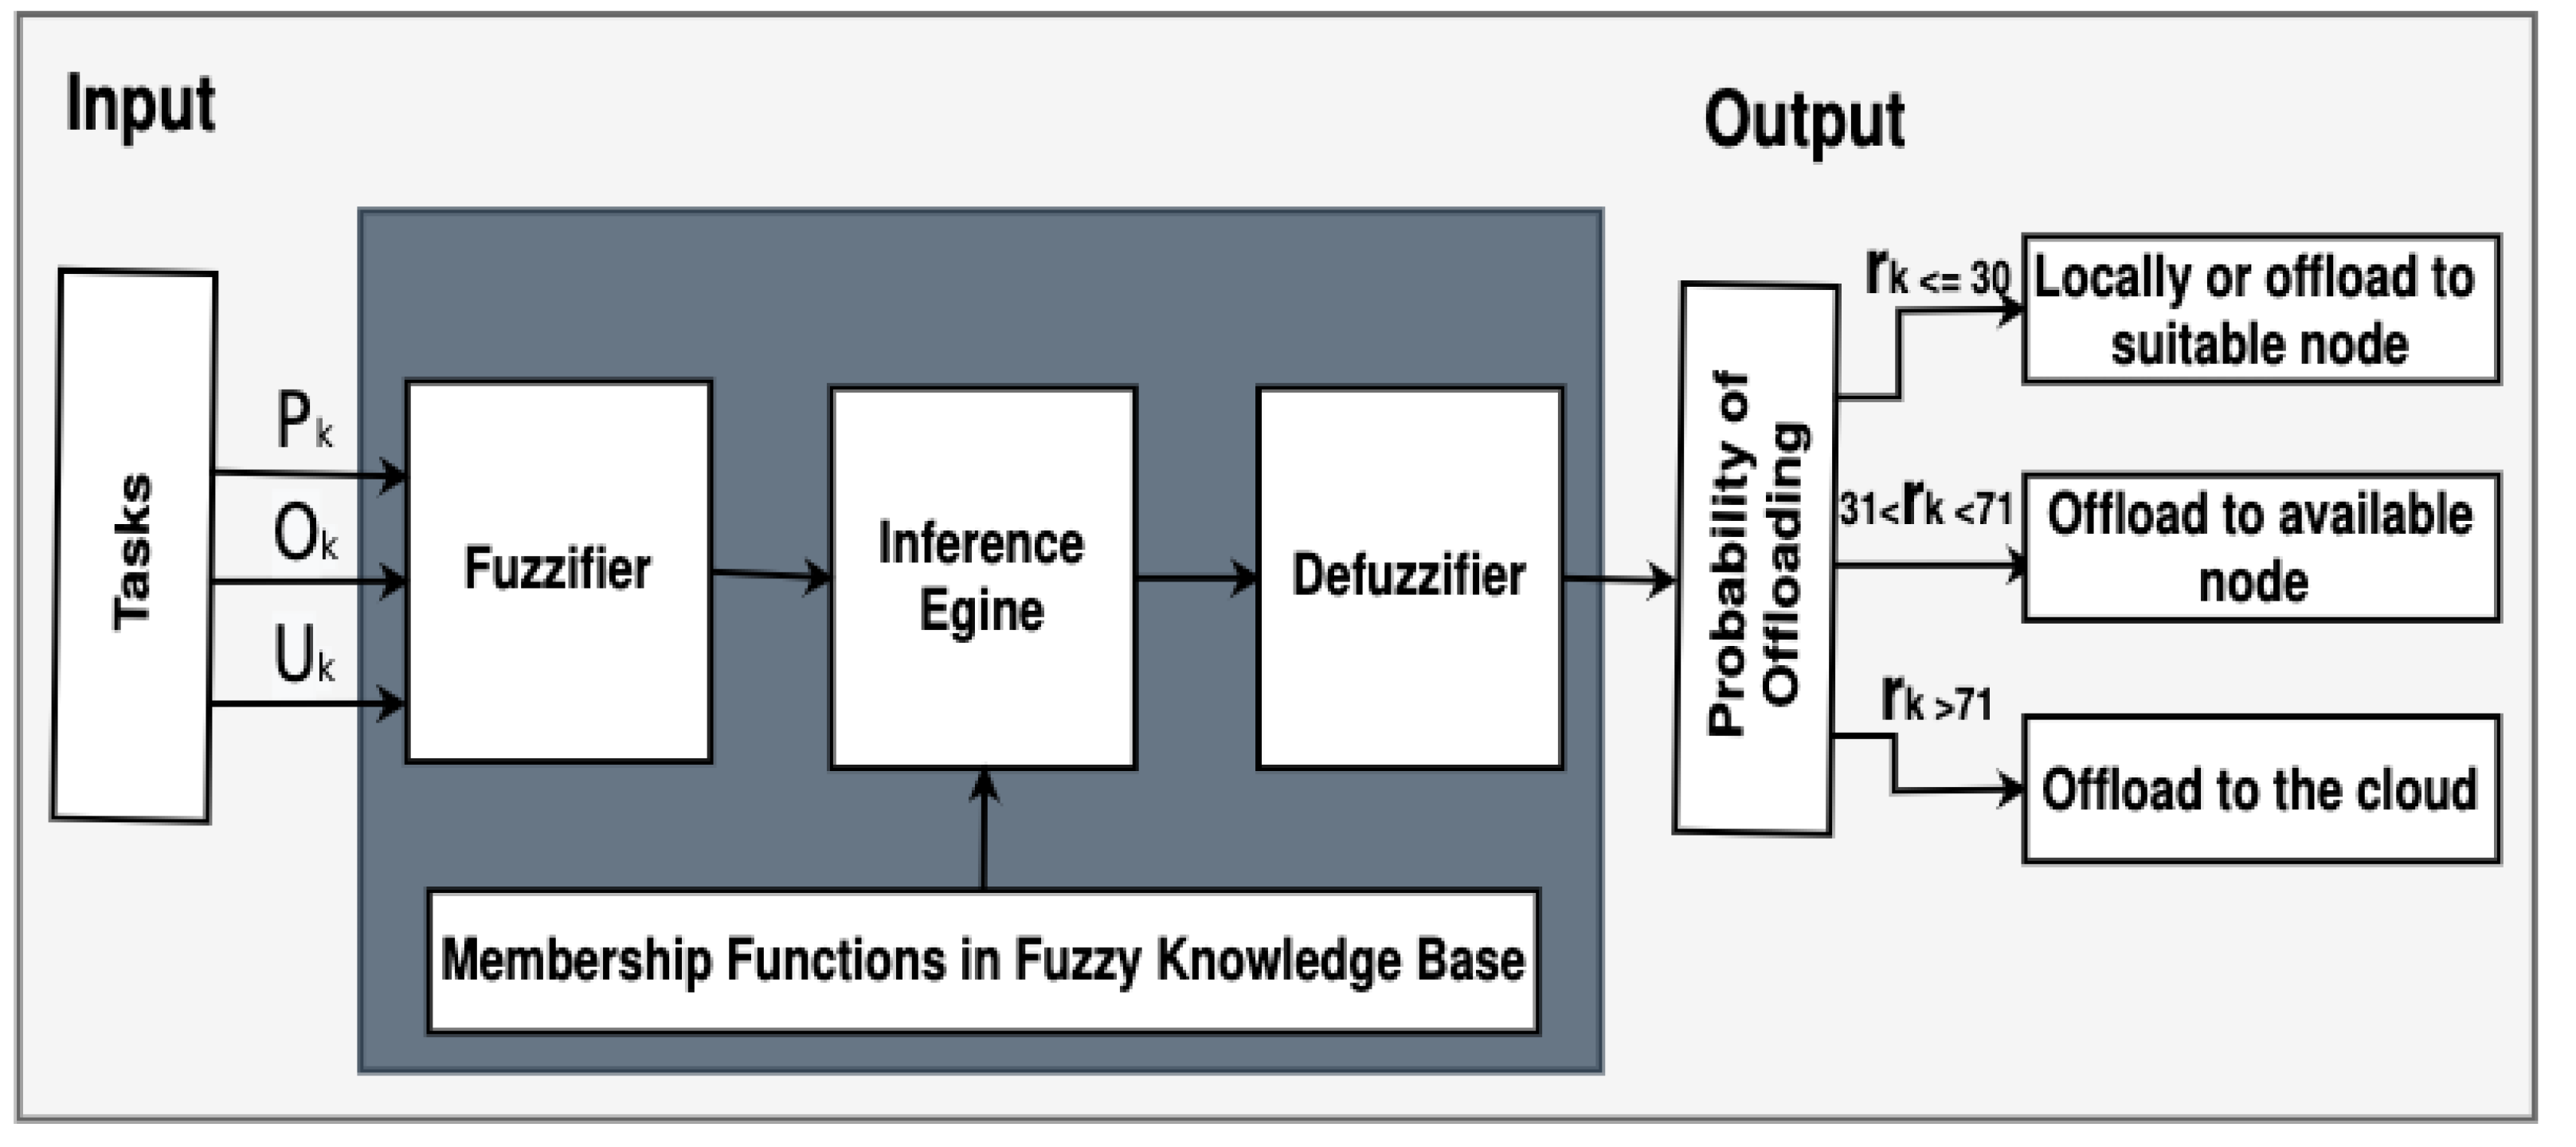
The S1 reasoning engine on for each task goes through the following steps: The first step of FL is fuzzification of the inputs () into their fuzzy linguistic terms via the membership functions as in Figure 3. It takes all these factors as numerical values (crisp values), then it assigns each value to the corresponding fuzzy values (e.g., Low, Medium, High) [19,20]. The second step is the activation of the Fuzzy Inference Rules (FIRs), which interpret the logic behind the decision making for the offloading probability. The obtained fuzzy values are then used to activate a set of FIRs, a.k.a., fuzzy knowledge base. Each FIR is represented via an IF-THEN statement [16]. The antecedent part (‘IF’ part) is a set of logical conjunctions over fuzzy linguistic variables. The consequent part (‘THEN’ part) of FIR is a fuzzy term from the set of linguistic terms {Low, Medium, High} that expresses offloading probability . The generic format of FIR statements used in our S1 engine is as follows:
where the linguistic terms are {Low, Medium, High} and {No, Yes}. For instance, the following FIR is described.
This rule expresses the decision of task to be offloaded with low probability, i.e., action is preferred more than action , due to the fact that this task has very high popularity (thus being also an outlier) and the data required by this tasks can be fully available to node (high degree of overlapping). Hence, in this case, can be locally executed on node and not be offloaded (i.e., low offloading probability). Our S1 engine requires 18 FIRs in the fuzzy knowledge base in order to cover the entire decision space; there are 3 × 2 × 3 = 18 membership functions involved in three fuzzy variables: popularity, outlier, and data overlapping. The FIRs of S1 engine are provided in Table 1, which reflects the reasoning behind the decision on actions or represented via the offloading probability.
The last step of S1 is the defuzzification of all the offloading probability values of the activated FIRs ([16,19]), which results in a scalar probability for the task . There are certain defuzzification operators for deriving scalar output over activated FIRs. We adapt the centroid defuzzifier, which not only is considered as the most common operator but also the defuzzified value that directly represents probability, which is aligned with the notion of and calculated as follows:
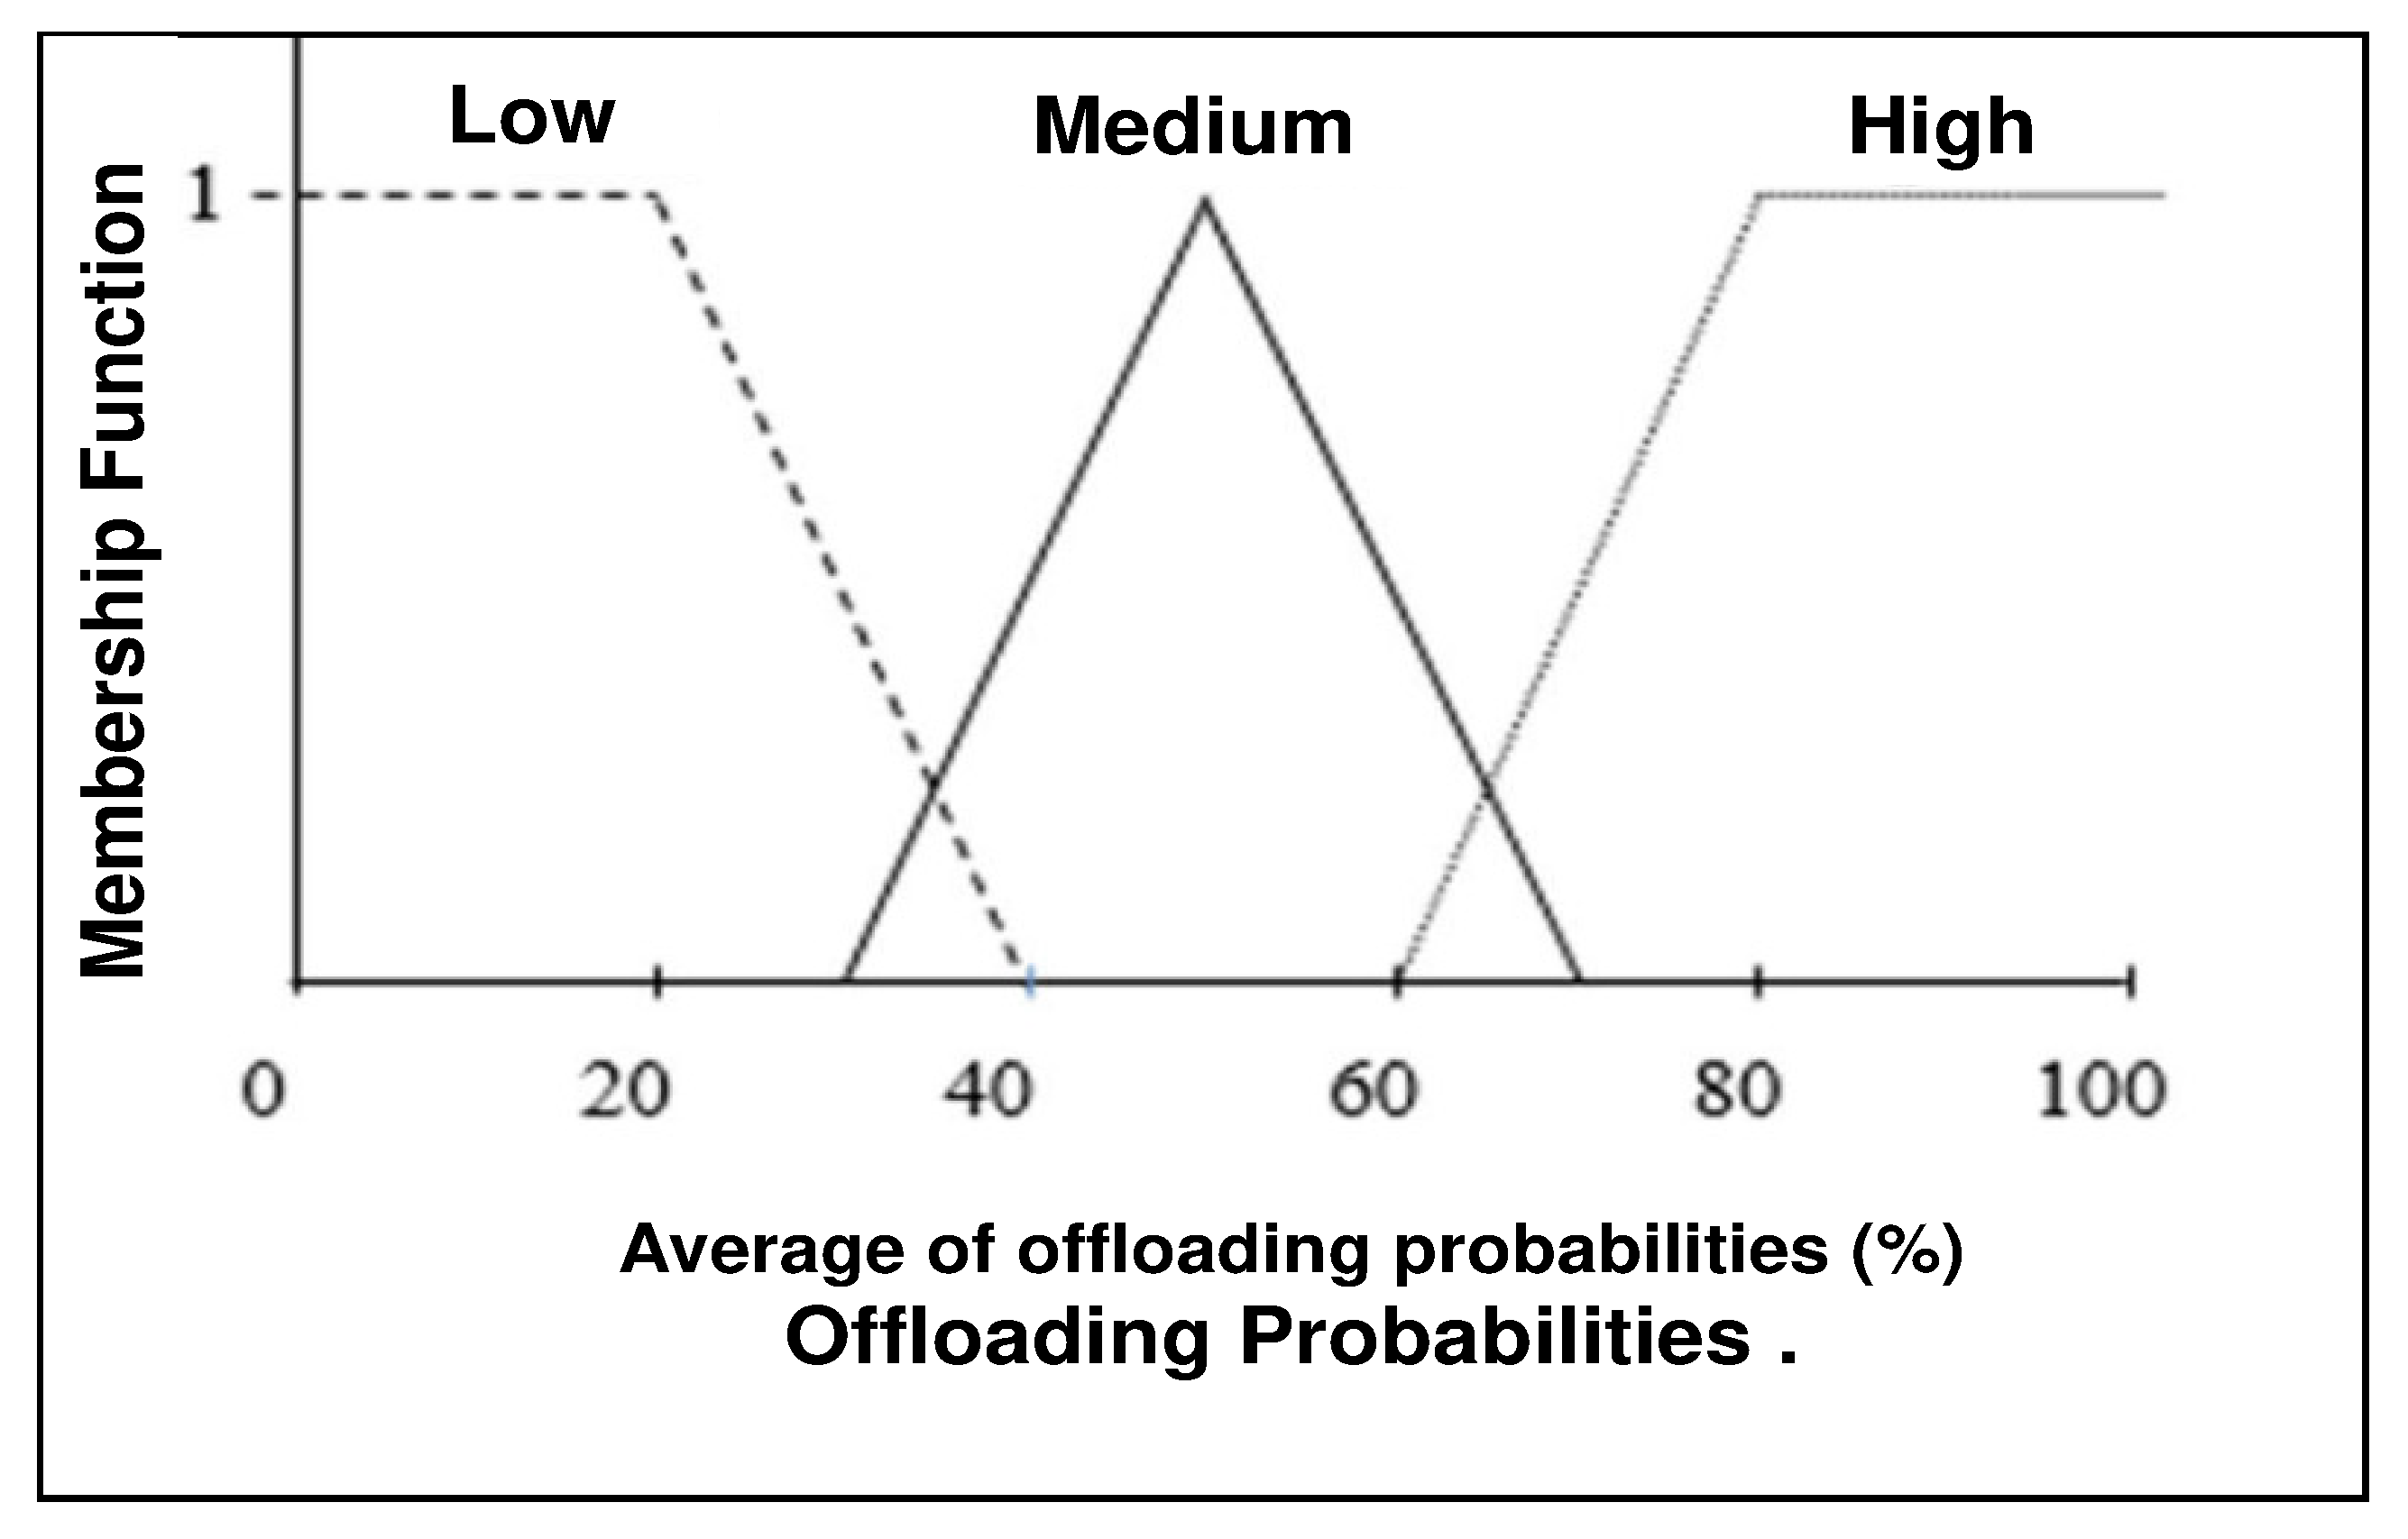
where represents the {Low, Medium, High} linguistic terms of the offloading probability. The defuzzified offloading probability ranges between 0% and 100%. In order to transform this probability to a decision, as Figure 4 depicts, we define the decision threshold to be 30%; that is, if (i.e., ), then node locally executes task . This means will be processed locally by leader .
5.2.2. Second Stage Reasoning S2
The second stage of inference is introduced to deal with decision making on those tasks which have been determined to be offloaded as suggested by the S1 inference engine, i.e., their probability of offloading . After finishing S1, leader node has two types of tasks: those that should be locally executed belonging to the set (associated with the action ), and tasks belong to set (associated with the offloading action ). The aim of the S2 inference engine is to proceed with decisions over the tasks in under the following actions: (offload to another node) or (offload to the cloud). Hence, S2 passes through two steps: tasks information updating and determine offloading probability. If leader node has not had enough resources for inference, then another node can be elected as a leader according to specific leader election mechanisms. In this case, the old leader just sends only the tasks to the new leader in order to make offload decisions. Tasks information updating:
Leader node collaborates with its neighbors to update the information regarding tasks in based on the S2 engine. For each task, a neighboring available and suitable node can be assigned based on the following reasoning. Firstly, leader considers the task contextual information () for each task from each neighboring . The goal is to determine how popular a task is and how much data access it requires in node . Once receives the request from leader , it sends over () for each task in according to its dataset . In turn, makes comparisons between tasks information and neighbor’s tasks information. When receives information from , it then has two tables: the main table that it obtains from S1 and a new one that it receives from . It then updates the tasks information from based on the following rule given a task .
The rule states that task ’s information () in the leader node will be updated if the corresponding values from the neighbouring are greater; otherwise, the task’s information will not be updated. The rationale behind updating tasks information is based on achieving lower . Therefore, if and are not greater than the ones in the leader node, this means that will increase, and this leads to an increase in the probability of offloading the task to an unsuitable node or to the cloud. In order to avoid this, they will not be updated. This process will be repeated for all tasks obtaining information form each neighboring node sequentially. Hence, with each received task information from the next node , if the rule is fired, the leader’s task information keeps updating. By the end of this process, leader will have updated all the required information as shown in Table 2 according to the most suitable node.
Determine offloading probability: Even though the leader has updated with the most suitable node for each task, there is still a need to execute the fuzzy inference engine for those tasks in , since this updating process only determines the best place for a task across neighboring nodes regardless of . Meanwhile, is applied in order to obtain a specific for each task in . If is low, (action ) is decided, otherwise, (action ) is preferred.
Finally, the updated task information will be treated as input for S2, and it will pass through the same steps as in S1, i.e., fuzzification, the activation of FIR and defuzzification.
By introducing S2, it helps leader to decide clearly where each task should be executed according to the corresponding comparing with S1 inference engine.
6. Experimental Evaluation
In this section, we used synthetic datases to simulate tasks’ popularities, while the data overlapping experiment has been carried out on real datasets using analytics queries. Finally, the CloudSim Plus simulator has been used to measure the impact of our mechanism on upload/download data rate for each task and resource utilization.
6.1. Tasks’ Popularities and Data Overlapping Experimental Setup
In this context, we deal with two types of datasets: real datasets and synthetic datases. The real datasets are collected by four Unmanned Surface Vehicles (USVs) working as nodes to collect data from sensors in a coastal area (http://www.dcs.gla.ac.uk/essence/funding.html#GNFUV, accessed on 20 October 2020). Each USV node has a neighborhood of directly communicating nodes . Moreover, node communicates end-users/applications in order to collect data and store them locally in their datasets for predictive analytic tasks. These data includes two features: sea surface temperature and humidity, i.e., . There is one node acting as the leader that receives a set of analytic tasks and follows a specific mechanism in order to decide the following: whether should execute locally (action ) or offload (action ). We have assumed that leader has received ten analytic tasks and is investigating three factors (, , and ) for each task . Regarding popularity (), we have generated a synthetic dataset of task demands for each task according to different rates () during a time window of size by using Poisson distribution. Poisson distribution is considered as common tool to generate set of requests according to specific rate. After constructing the requests vector for each task , we have adapted the Subtractive clustering algorithm over tasks demands in order to group the demands according to the similarity between them. Then, the cluster density for each cluster C has been calculated according to Equation (1). The leader obtains ’s popularity, as shown in the second column Table 3.
Regarding the outliers indicators , we use the statistical threshold , where can generate the two sets of outliers and not outliers, as shown in the third column in Table 3. In order to obtain the task’s data overlapping , we have defined for each local dataset , the feature boundaries max and min values: . Then, we generated queries uniformly at random ten tasks such that for each task in order to obtain the data subspace needed for the execution of analytic task , as shown in Table 4.
Evidently, there are some tasks with high data overlapping (e.g., ); reaches 98%, while there are tasks with low , such as and . Therefore, by executing tasks with high such as locally, it is expected to reduce the percentages of data offloading from 100% to 2%. In contrast, by executing tasks with low locally such as , it is expected to increase data offloading percentages to almost 95%, which is obviously inefficient.
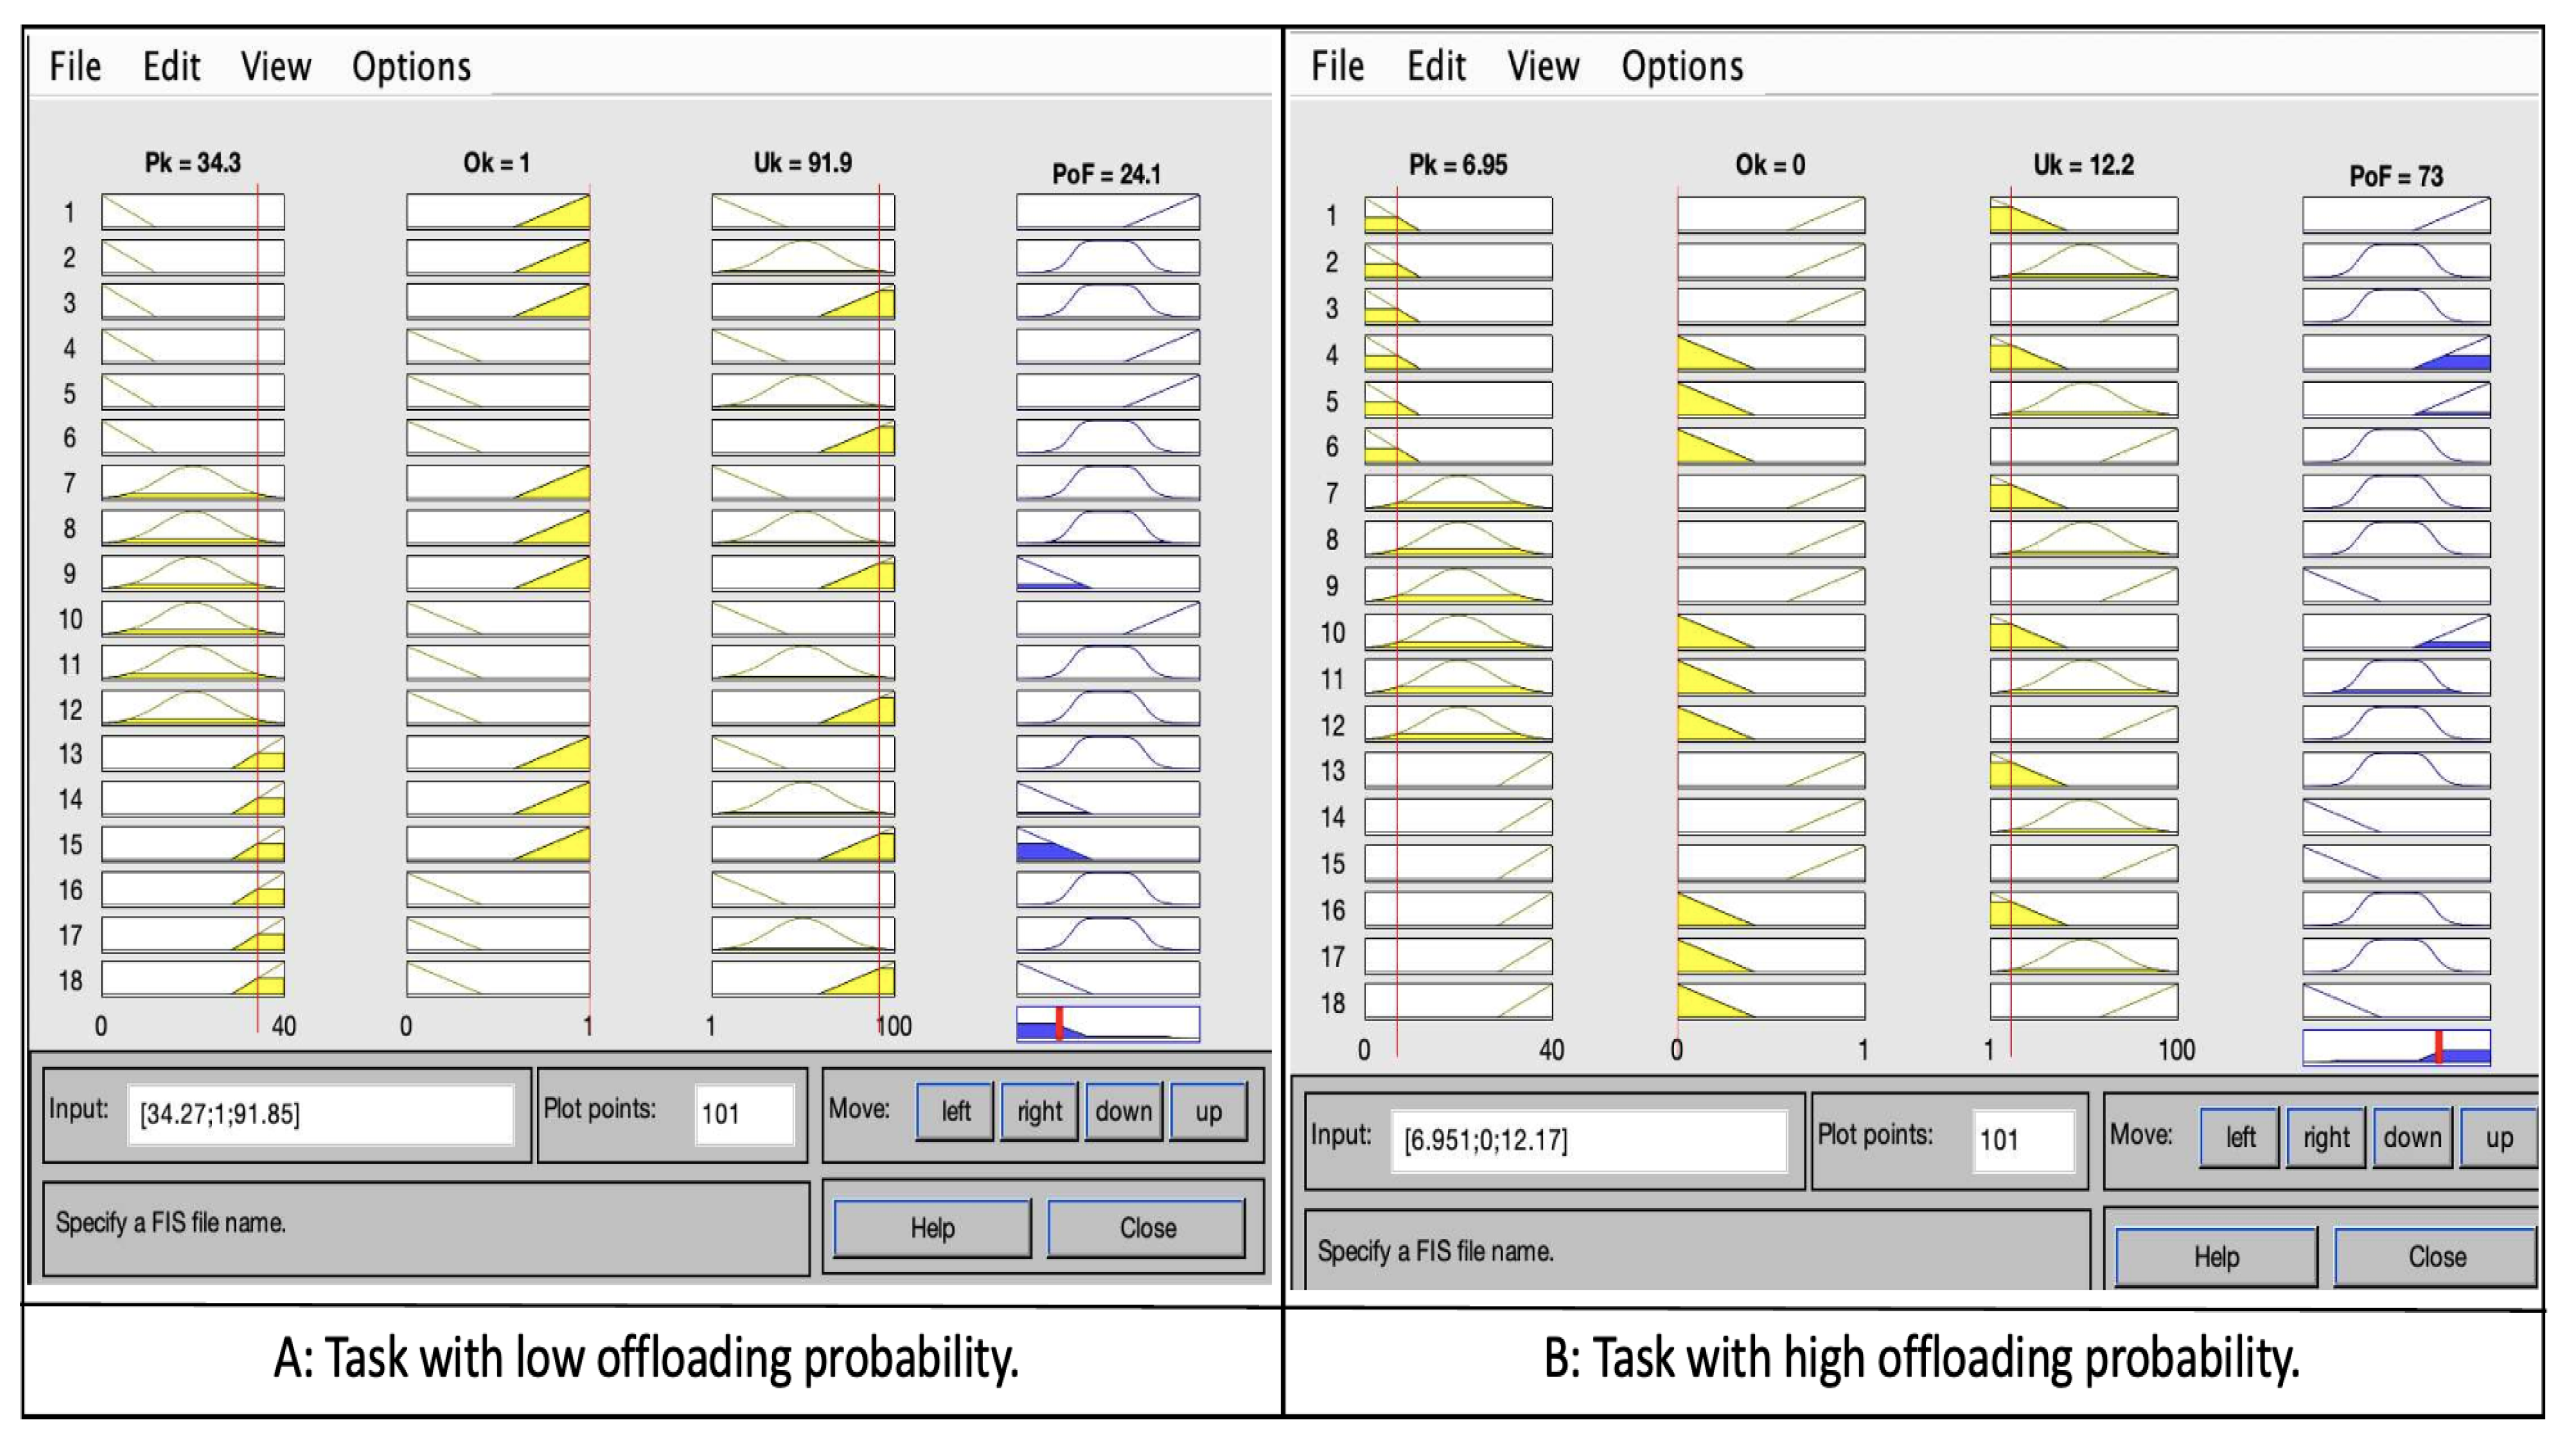
The FL engine has been developed in MATLAB considering the popularity of tasks between [1, 40] and outlier either 0 or 1, while the percentages of data overlapping are between [0%, 100%]. All these are inputs to the FL system, while the probability of offloading is the output in [0%, 100%]. As shown in Figure 5A, increasing and for task leads to a decrease in the probability of offloading . This implies an increase in the probability of executing this locally (action ). On the other hand, in Figure 5B, decreasing and for task leads to increasing the probability of offloading . This means that increasing the probability of offloading either to another node (action ) or to the cloud (action ).
For task information update, we deal with ten tasks , six of them should be offloaded (action ) according to Table 5. In order to determine the most suitable node for each task , information (, , and ) is updated.
During , leader will have the task information as shown in Table 5. The output of S2 is for each task in . is applied with the same steps as in . According to the results, , , , and will offload to (action ), while will offload to (action ), if there are available resources. However, task and have almost very high offloading probability; therefore, they will be offloaded to the cloud (action ).
6.2. Simulation Setup
CloudSim Plus has been utilized to create the considered scenarios and to evaluate the performance of our mechanism. In this experiment, two types of parameters have been considered: data-driven task characteristics and MEC/cloud parameters. Data-driven tasks characteristics vary according to the nature of tasks. Some tasks are affected by delays, while others are not; some tasks could execute on MEC nodes, while others are beyond MEC node’s capabilities and should be offloaded to the cloud. To simulate real-life scenarios, ten different data-driven tasks (applications) have been used. To decide the application types, we looked at the most common data-driven tasks (weather prediction, air pollution prediction, traffic jam prediction, compute-intensive tasks, and health apps, etc.). Table 6 contains tasks information chosen based on [16]. The upload/download data size represents the type of data sent/received from EC/Cloud since it could increase or decrease according to data overlapping percent, and this is what distinguishes our mechanism against other task offloading mechanisms. For instance, (50,000 MB, 100 MB) denotes the size of uploaded data (humidity, temperature, wind, etc.) that will be used to build a ML model, and downloads depict the model that the application will receive as a result of data collection and training in EC/cloud computing. According to our mechanism, if the data overlapping percentage is high (e.g., 90% or more) the uploading data could be reduced from 50,000 MB to 10 MB. Task length determines the number of Million Instructions (MI) and the required CPU resource to complete a data-driven task. We considered ten tasks arriving at with specific features, which include task length and upload/download data. According to data overlapping, we made the range of this parameter fluctuate from low values with some tasks to high values with others, while resource consumption and task delay sensitivity have been set up according to the applications indicated in [16].
Other simulation parameters that reflect the computational capabilities of MEC/Cloud servers, such as bandwidth, the number of Virtual Machines(VM), and host MIPS, are listed in Table 7.
6.3. Comparative Assessment
In this section, we present two types of results that reflect our mechanism’s performance:
First, in terms of considering both factors (tasks polarities and data overlapping ), we compare the suggested mechanism’s efficiency to the effectiveness of two alternative mechanisms that deal with the same tasks and datasets. The first mechanism () takes only tasks popularity and outlier into consideration when it makes the offloading decision. The second mechanism () only takes the percentages of data overlapping between the tasks and nodes . The experimental results in Table 8 show the performance of the mechanism, coined here as (), which is the highest according to the optimal solution (OS) in the last column at the same table. As we can see, () focuses on investigating task popularity in each node, while data overlapping is completely ignored. That means mechanism will distribute tasks among regardless of whether task is offloaded to the suitable node that could reduce the response time and resource consumption or not. On the other hand, () only focuses on the percentages of data overlapping . () uses the node’s data in an efficient manner regardless of whether tasks are popular or not. As a consequence, the popular/urgent tasks could offload to the cloud (action 12) or could wait in the execution queue, because they have lower data overlapping with . () attempts to balance between the both sides of popularity and data overlapping . Based on the results, () can provide an accurate offloading probabilities close to according to boundaries, while () and () provide accuracies reaching and , respectively.
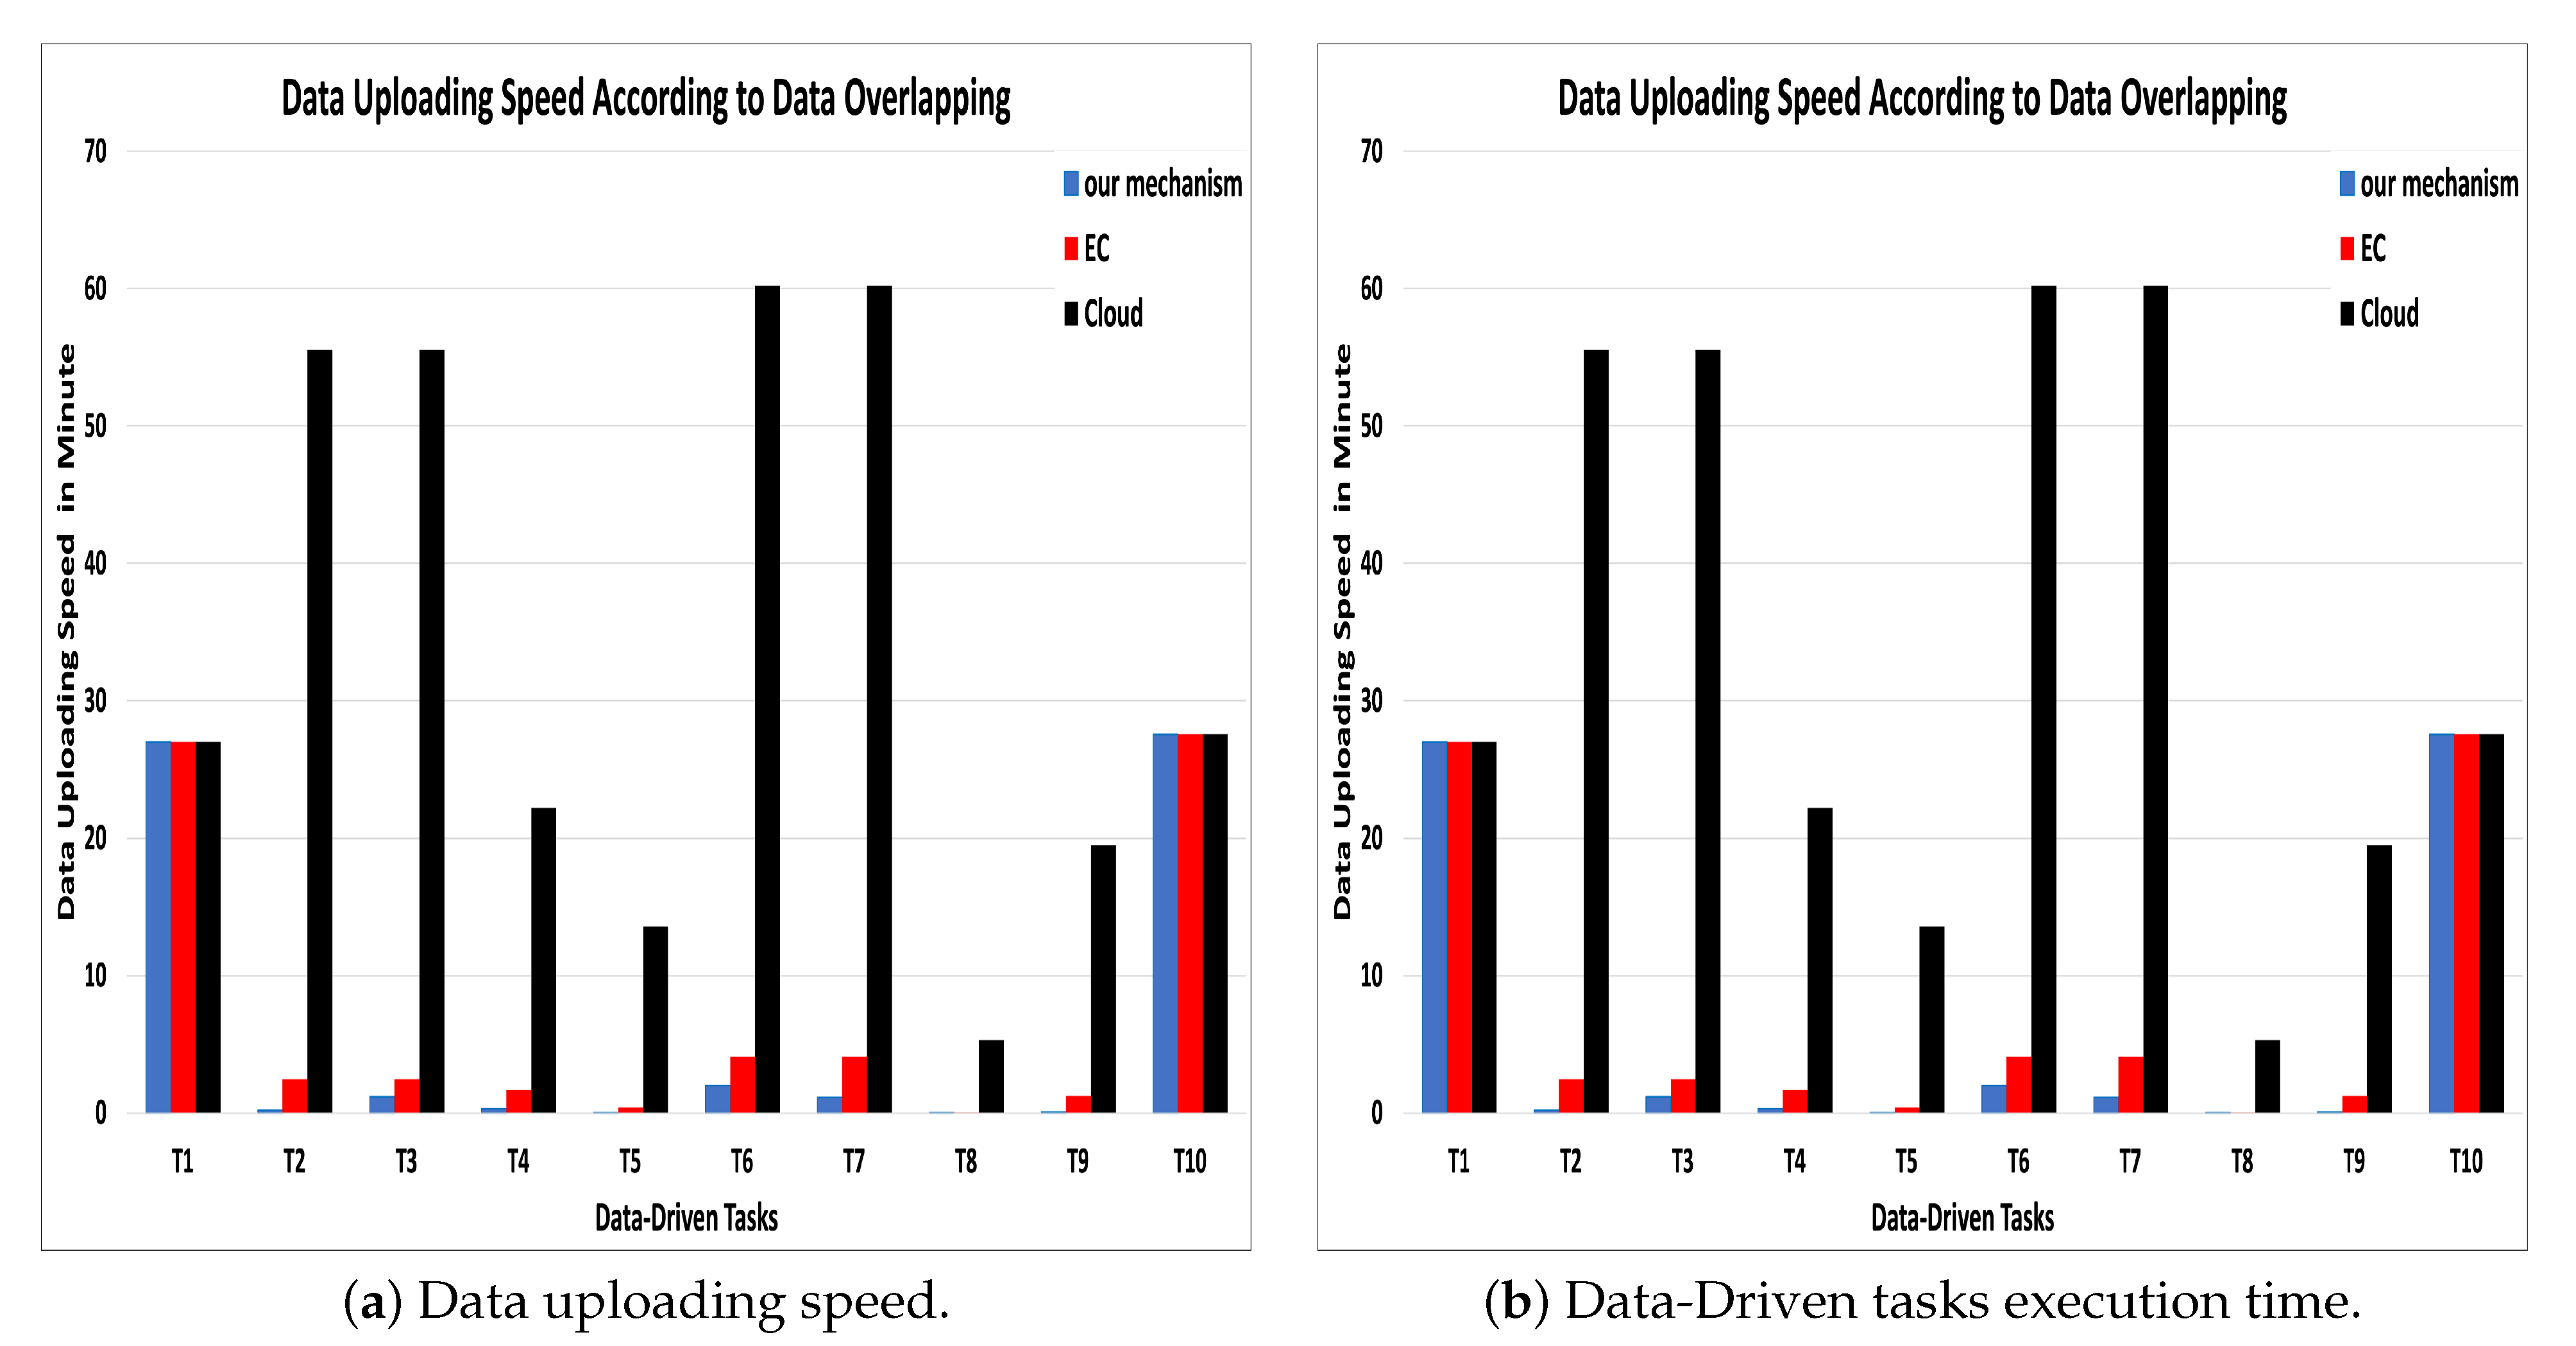
Second, in terms of resource utilization: We compare the effectiveness of our mechanism against two alternative mechanisms over the same task’s simulation conditions. The first one, cloud-based mechanism [11], where the MEC nodes have been used to collect sensors data and sent them to the cloud to reduce sensors’ energy consumption that would happen if data have been sent directly to the cloud. The second mechanism, a MEC-based mechanism, has been suggested in many studies, such as [16,20], where the tasks are sent to the MEC node that has the highest availability, bandwidth, and task delay sensitivity. Simulating our mechanism resulted in a high data uploading speed between one to ten minutes, while the uploading speed in the cloud-based model is between 28 to 60 min. whereas the uploading speed in MEC-based mechanisms, which has not considered data overlapping, is almost double the speed we obtained with our mechanism (see Figure 6a).
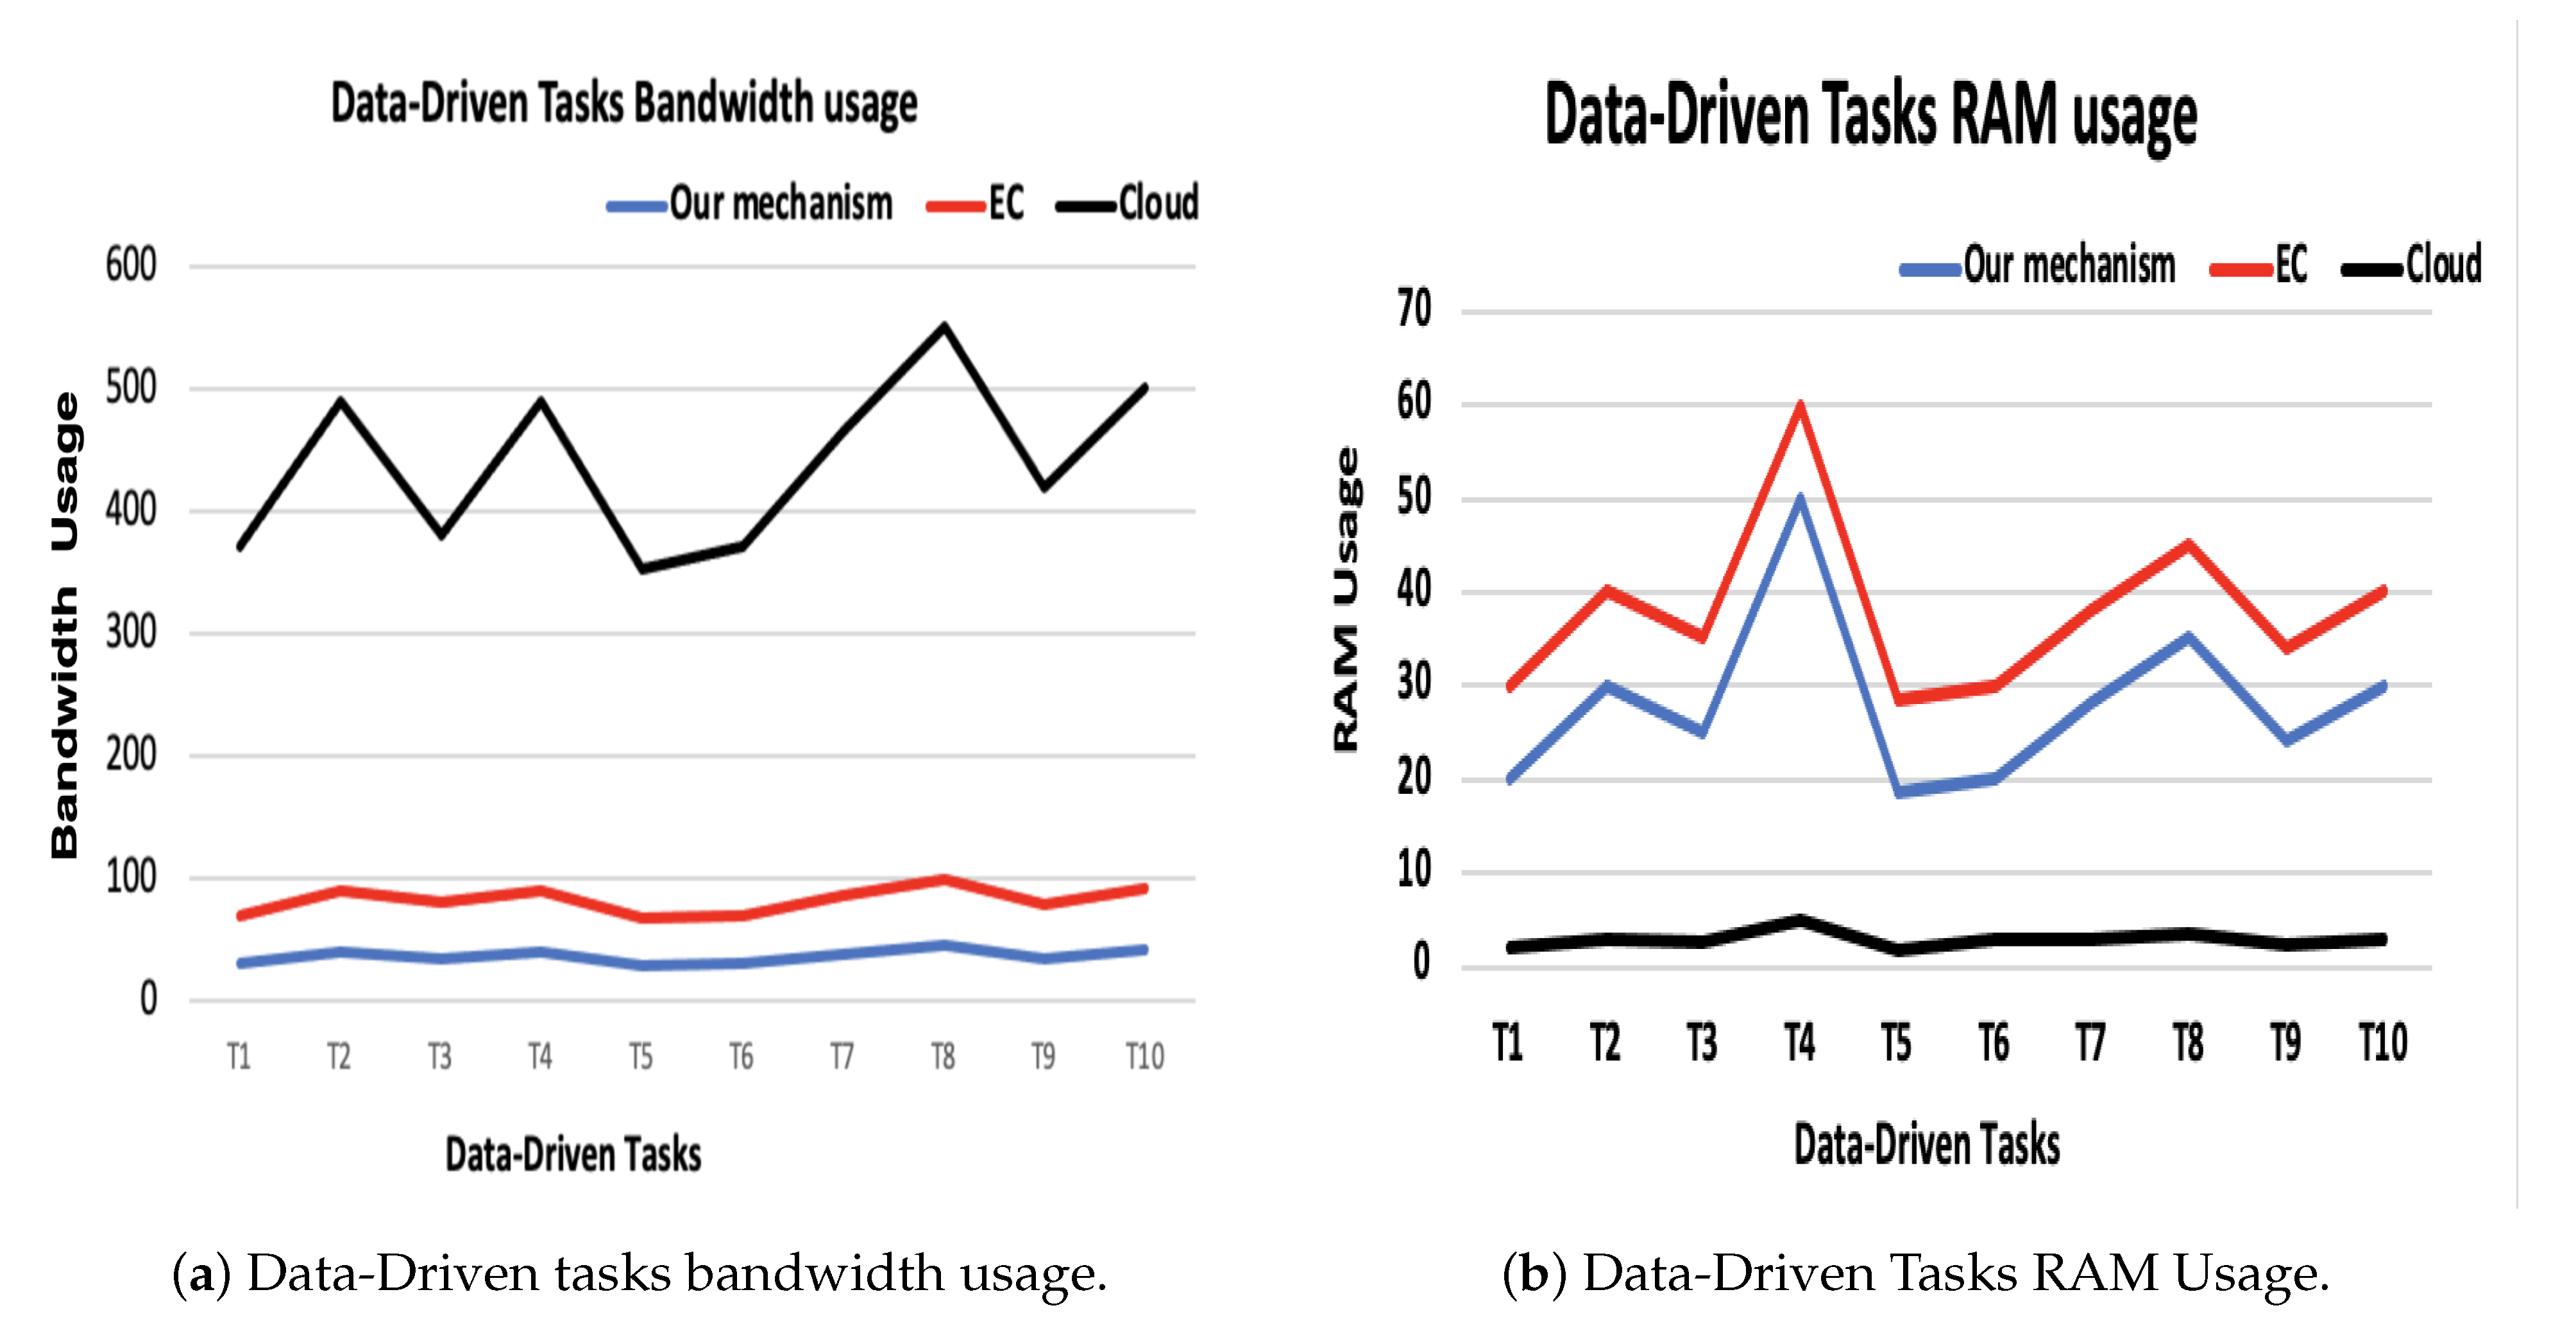
In terms of execution time, we have considered data offloading time in addition to the main execution time because, in the data-driven tasks, data are considered an integral part of the task execution. Figure 6b shows that the execution time is extremely minimized compered to the cloud-based model. Moreover, we can observe that the bandwidth is reduced as well. The results of cloud (WAN) and MEC (MAN) bandwidth measurements are shown in Figure 7. The blue line represents the bandwidth usage percent according to our mechanism, which is considered to be very low compared to the other mechanisms. The red line represents the bandwidth usage according to the MEC-based mechanism, which is considered almost double our mechanism usage. Meanwhile, the black line shows bandwidth usage in order to execute these ten tasks on the cloud, which is very high usage compared to ours and MEC-based (see Figure 7a).
According to resource usage, Cloud-based mechanism produced the best performance compared to our mechanism and EC-based mechanism as it has unlimited resources (Figure 7b).
7. Conclusions
In this work, we introduced a mechanism for data-driven analytics tasks in an AN-enabled MEC environment to exploit their resources efficiently and reduced the response time. In particular, the core of this mechanism focuses on three factors: task popularity, outlier, and data overlapping to make execution decisions for each task. Task popularity concentrates mainly on investigating each task’s demands, while the outlier determines the statistically extreme (non-usual) demands of tasks. Meanwhile, data overlapping studies the percentages of data overlapping between tasks and ANs. These three factors are treated as input to a two-stage FL interference system to make the final decision for each task. Our mechanism performance has been evaluated according to the probability of offloading data-driven analytics tasks to the right nodes according to the optimal solution and against two other mechanisms. As evidenced by the results, our mechanism significantly outperforms the benchmark mechanisms in terms of decision-making accuracy. Furthermore, this mechanism can reduce the probability of a task being offloaded to an unsuitable node by up to 90%. Then, our method has been evaluated in terms of resource utilization, showing that it provides higher data uploading speeds compared to EC-based and cloud-based methods. In addition, bandwidth usage has been reduced dramatically compared to benchmark mechanisms. As a consequence, data-driven analytic task execution times have been minimized. Our future agenda include methods that are expected to improve our mechanism by considering the tasks’ delay sensitivity, energy consumption, and nodes’ mobility.
Author Contributions
Conceptualization, T.A., K.K., C.A.; investigation, T.A., I.A., C.A.; writing—original draft preparation, T.A., C.A., I.A.; writing—review and editing, T.A., C.A. All authors have read and agreed to the published version of the manuscript.
Funding
This research received no external funding.
Institutional Review Board Statement
Not applicable.
Informed Consent Statement
Not applicable.
Data Availability Statement
Data can be accessed at, http://www.dcs.gla.ac.uk/essence/funding.html#GNFUV.
Conflicts of Interest
The authors declare no conflict of interest.
Abbreviations
The following abbreviations are used in this manuscript:
| Set of analytic tasks; | |
| t | Time instance; |
| The task requests vector; | |
| Historical demand observations vector, ; | |
| W | Time window of size; |
| C | Cluster; |
| Clusterhead; | |
| Task demands rate; | |
| The demand values; | |
| The deviation; | |
| The cluster density; | |
| Densities normalization; | |
| Popularity; | |
| The median of the popularity; | |
| MAD | Mean absolute deviation; |
| The outlier indicator; | |
| An empirically derived threshold; | |
| Outliers; | |
| The degrees of popularity; | |
| Linguistic terms of the offloading probability; | |
| Set of task will execute locally; | |
| Set of task will offload; | |
| Data overlapping; | |
| D | Dataset in each AN; |
| x | Data point; |
| FL | Fuzzy logic; |
| Selection query; | |
| Maximum and minimum value for the temperature in a D; | |
| Maximum and minimum value for the humidity in a D; | |
| Data overlapping; | |
| Outlier. |
References
- Li, S.; Hu, X.; Du, Y. Deep Reinforcement Learning for Computation Offloading and Resource Allocation in Unmanned-Aerial-Vehicle Assisted Edge Computing. Sensors 2021, 21, 6499. [Google Scholar] [CrossRef] [PubMed]
- Budhiraja, I.; Kumar, N.; Tyagi, S.; Tanwar, S. Energy Consumption Minimization Scheme for NOMA-Based Mobile Edge Computation Networks Underlaying UAV. IEEE Syst. J. 2021, 15, 5724–5733. [Google Scholar] [CrossRef]
- Cheng, J.; Guan, D. Research on task-offloading decision mechanism in mobile edge computing-based Internet of Vehicle. EURASIP J. Wirel. Commun. Netw. 2021, 2021, 101. [Google Scholar] [CrossRef]
- Jodelka, O.; Anagnostopoulos, C.; Kolomvatsos, K. Adaptive Novelty Detection over Contextual Data Streams at the Edge using One-class Classification. In Proceedings of the 2021 12th International Conference on Information and Communication Systems (ICICS), Valencia, Spain, 24–26 May 2021; pp. 213–219. [Google Scholar] [CrossRef]
- Cui, K.; Lin, B.; Sun, W.; Sun, W. Learning-based task offloading for marine fog-cloud computing networks of USV cluster. Electronics 2019, 8, 1287. [Google Scholar] [CrossRef] [Green Version]
- Anagnostopoulos, C. Edge-centric inferential modeling & analytics. J. Netw. Comput. Appl. 2020, 164, 102696. [Google Scholar] [CrossRef]
- Kolomvatsos, K.; Anagnostopoulos, C.; Koziri, M.; Loukopoulos, T. Proactive amp; Time-Optimized Data Synopsis Management at the Edge. IEEE Trans. Knowl. Data Eng. 2020. [Google Scholar] [CrossRef]
- Kolomvatsos, K.; Anagnostopoulos, C. A deep learning model for demand-driven, proactive tasks management in pervasive computing. IoT 2020, 1, 240–258. [Google Scholar] [CrossRef]
- Kong, F.; Li, J.; Jiang, B.; Zhang, T.; Song, H. Big data-driven machine learning-enabled traffic flow prediction. Trans. Emerg. Telecommun. Technol. 2019, 30, e3482. [Google Scholar] [CrossRef]
- Kolomvatsos, K.; Anagnostopoulos, C. Proactive, uncertainty-driven queries management at the edge. Future Gener. Comput. Syst. 2021, 118, 75–93. [Google Scholar] [CrossRef]
- Wang, P.; Yu, R.; Gao, N.; Lin, C.; Liu, Y. Task-driven data offloading for fog-enabled urban IoT services. IEEE Internet Things J. 2020, 8, 7562–7574. [Google Scholar] [CrossRef]
- Nguyen, V.; Khanh, T.T.; Tran, N.H.; Huh, E.N.; Hong, C.S. Joint offloading and IEEE 802.11 p-based contention control in vehicular edge computing. IEEE Wirel. Commun. Lett. 2020, 9, 1014–1018. [Google Scholar]
- Ning, Z.; Dong, P.; Wang, X.; Rodrigues, J.J.; Xia, F. Deep reinforcement learning for vehicular edge computing: An intelligent offloading system. ACM Trans. Intell. Syst. Technol. (TIST) 2019, 10, 1–24. [Google Scholar] [CrossRef] [Green Version]
- Zhang, K.; Mao, Y.; Leng, S.; Vinel, A.; Zhang, Y. Delay constrained offloading for mobile edge computing in cloud-enabled vehicular networks. In Proceedings of the 2016 8th International Workshop on Resilient Networks Design and Modeling (RNDM), Halmstad, Sweden, 13–15 September 2016; pp. 288–294. [Google Scholar]
- Zhang, K.; Mao, Y.; Leng, S.; He, Y.; Zhang, Y. Mobile-edge computing for vehicular networks: A promising network paradigm with predictive off-loading. IEEE Veh. Technol. Mag. 2017, 12, 36–44. [Google Scholar] [CrossRef]
- Sonmez, C.; Ozgovde, A.; Ersoy, C. Fuzzy workload orchestration for edge computing. IEEE Trans. Netw. Serv. Manag. 2019, 16, 769–782. [Google Scholar] [CrossRef]
- Welstead, S.T. Neural Network and Fuzzy Logic Applications in C/C++; John Wiley & Sons, Inc.: Hoboken, NJ, USA, 1994. [Google Scholar]
- Khoshkholgh, M.G.; Navaie, K.; Yanikomeroglu, H.; Leung, V.C.; Shin, K.G. Randomized caching in cooperative UAV-enabled fog-RAN. In Proceedings of the 2019 IEEE Wireless Communications and Networking Conference (WCNC), Marrakesh, Morocco, 15–18 April 2019; pp. 1–6. [Google Scholar]
- Nguyen, V.; Khanh, T.T.; Nguyen, T.D.; Hong, C.S.; Huh, E.N. Flexible computation offloading in a fuzzy-based mobile edge orchestrator for IoT applications. J. Cloud Comput. 2020, 9, 66. [Google Scholar] [CrossRef]
- Almutairi, J.; Aldossary, M. A novel approach for IoT tasks offloading in edge-cloud environments. J. Cloud Comput. 2021, 10, 28. [Google Scholar] [CrossRef]
- Samea, F.; Azam, F.; Rashid, M.; Anwar, M.W.; Haider Butt, W.; Muzaffar, A.W. A model-driven framework for data-driven applications in serverless cloud computing. PLoS ONE 2020, 15, e0237317. [Google Scholar] [CrossRef]
- Chen, Q.; Zheng, Z.; Hu, C.; Wang, D.; Liu, F. On-edge multi-task transfer learning: Model and practice with data-driven task allocation. IEEE Trans. Parallel Distrib. Syst. 2019, 31, 1357–1371. [Google Scholar] [CrossRef]
- Rao, U.M.; Sood, Y.; Jarial, R. Subtractive clustering fuzzy expert system for engineering applications. Procedia Comput. Sci. 2015, 48, 77–83. [Google Scholar] [CrossRef] [Green Version]
- Sharma, N.; Magarini, M.; Jayakody, D.N.K.; Sharma, V.; Li, J. On-demand ultra-dense cloud drone networks: Opportunities, challenges and benefits. IEEE Commun. Mag. 2018, 56, 85–91. [Google Scholar] [CrossRef]
- Chen, Z.; Xiao, N.; Han, D. Multilevel task offloading and resource optimization of edge computing networks considering UAV relay and green energy. Appl. Sci. 2020, 10, 2592. [Google Scholar] [CrossRef] [Green Version]
Figure 1.
A three-layer architecture of EC ecosystem [11].
Figure 1.
A three-layer architecture of EC ecosystem [11].

Figure 2.
Implementation of FL on our three factors.

Figure 3.
Fuzzy logic system working mechanism.

Figure 4.
The probability of offloading.

Figure 5.
The effect of (, , ) on the probability of offloading ().

Figure 6.
Data uploading speed and tasks execution Time.

Figure 7.
Data-Driven tasks bandwidth and RAM usage.


Table 1.
FL rules inputs and the expected outputs.
| 1 | Low | Yes | Low | High |
| 2 | Low | Yes | Medium | Medium |
| 3 | Low | Yes | High | Medium |
| 4 | Low | No | Low | High |
| 5 | Low | No | Medium | High |
| 6 | Low | No | High | Medium |
| 7 | Medium | Yes | Low | Medium |
| 8 | Medium | Yes | Medium | Medium |
| 9 | Medium | Yes | High | Low |
| 10 | Medium | No | Low | High |
| 11 | Medium | No | Medium | Medium |
| 12 | Medium | No | High | Medium |
| 13 | High | Yes | Low | Medium |
| 14 | High | Yes | Medium | Low |
| 15 | High | Yes | High | Low |
| 16 | High | No | Low | Medium |
| 17 | High | No | Medium | Low |
| 18 | High | No | High | Low |
Table 2.
Information updating according to suitable node.
| Task | Old Information | Update to | New Information |
|---|---|---|---|
| T1 | 8.37, Yes, 15% | n2 | 9.64, No, 31.5% |
| T3 | 2.69, Yes, 45.5% | n4 | 2.01, Yes, 85.4% |
| T4 | 14.8, Yes, 67.8% | n2 | 13.71, No, 52.89% |
| T6 | 7.563,Yes, 31.8% | n3 | 5.88, No, 52.88 % |
| T7 | 14.848, Yes, 15.67% | n2 | 26.45, No, 70% |
| T10 | 8.5, Yes, 21.3% | n4 | 7.25, No, 66.2% |
Table 3.
Tasks information.
| 8.37 | No | 67.8% | |
| 28.31 | No | 15.67% | |
| 2.69 | Yes | 15.46% | |
| 14.848 | No | 22.88% | |
| 29.977 | No | 81% | |
| 7.563 | Yes | 6.8% | |
| 26.848 | No | 31.8% | |
| 39.49 | Yes | 21.3% | |
| 34.399 | Yes | 69% | |
| 8.5 | No | 45.5% |
Table 4.
Queries generation and percentages of data overlapping.
| Task | Points Including | Percentage | ||||
|---|---|---|---|---|---|---|
| 19 | 32 | 49 | 57 | 130/899 | 14.46% | |
| 19 | 29 | 44 | 46 | 164/899 | 18.24% | |
| 26 | 28 | 43 | 58 | 75/899 | 8.3% | |
| 22 | 32 | 42 | 53 | 160/899 | 17.79% | |
| 20 | 32 | 38 | 58 | 885/899 | 98.44% | |
| 20 | 29 | 41 | 55 | 310/899 | 34.48% | |
| 21 | 25 | 48 | 53 | 48/899 | 5.33% | |
| 22 | 33 | 38 | 55 | 600/899 | 66.74% | |
| 20 | 32 | 50 | 57 | 470/899 | 52.28% | |
| 19 | 28 | 36 | 50 | 251/899 | 27.91% |
Table 5.
decision making based on three factors.
| Task | Node | Rule | ||||
|---|---|---|---|---|---|---|
| T1 | Low | No | Low | , High | rule 4. | |
| T3 | Low | Yes | High | , Medium | rule 3. | |
| T4 | Medium | No | medium | , Medium | rule 11. | |
| T6 | Low | No | Medium | , High | rule 5 | |
| T7 | High | No | Medium | , Medium | rule 11. | |
| T10 | Low | No | Medium | , Medium | rule 5. |
Table 6.
Application types used in the simulation.
| Upload/Download Data | |||
|---|---|---|---|
| T1 | Deep learning | 10,000 | 50,000/100 |
| T2 | Traffic jam prediction | 20,000 | 200,000/300 |
| T3 | Air pollution prediction | 15,000 | 200,000/400 |
| T4 | Healthcare diagnosis | 30,000 | 80,000/100 |
| T5 | Weather prediction | 8500 | 50,000/50 |
| T6 | Compute-intensive task | 20,000 | 300,000/500 |
| T7 | Fraud detection | 18,000 | 300,000/250 |
| T8 | Virtual assistants | 25,000 | 20,000/50 |
| T9 | Alerting And Monitoring | 14,000 | 100,000/300 |
| T10 | Social Media Analysis | 21,000 | 60,000/80 |
Table 7.
Simulation parameters.
| Parameters | EC | Cloud |
|---|---|---|
| Bandwidth | WAN 500 MB/s | LAN 10 GB/s |
| Number of VM | 2 | 8 |
| Number of cores | 2 | 8 |
| VM CPU speed | 10 MB | 100 MB |
| HOST MIPS | 1000 | 10,000 |
Table 8.
The probability of offloading for each task according to our mechanism compared to the other two mechanism.
Table 8.
The probability of offloading for each task according to our mechanism compared to the other two mechanism.
| T1 | Low | Yes | Low | High | |||
| T2 | Med | No | High | Med | |||
| T3 | Low | No | Low | High | |||
| T4 | Med | No | med | Med | |||
| T5 | High | No | High | Low | |||
| T6 | Low | Yes | Low | 85% | 86.5% | 72.7% | High |
| T7 | Med | No | Med | Med | |||
| T8 | High | Yes | High | Low | |||
| T9 | High | Yes | High | Low | |||
| T10 | Low | Yes | Low | 83% | 85% | 67.2% | High |
| - | - | - | - | - |
Publisher’s Note: MDPI stays neutral with regard to jurisdictional claims in published maps and institutional affiliations. |
© 2022 by the authors. Licensee MDPI, Basel, Switzerland. This article is an open access article distributed under the terms and conditions of the Creative Commons Attribution (CC BY) license (https://creativecommons.org/licenses/by/4.0/).
Share and Cite
MDPI and ACS Style
Anagnostopoulos, C.; Aladwani, T.; Alghamdi, I.; Kolomvatsos, K. Data-Driven Analytics Task Management Reasoning Mechanism in Edge Computing. Smart Cities 2022, 5, 562-582. https://0-doi-org.brum.beds.ac.uk/10.3390/smartcities5020030
AMA Style
Anagnostopoulos C, Aladwani T, Alghamdi I, Kolomvatsos K. Data-Driven Analytics Task Management Reasoning Mechanism in Edge Computing. Smart Cities. 2022; 5(2):562-582. https://0-doi-org.brum.beds.ac.uk/10.3390/smartcities5020030
Chicago/Turabian StyleAnagnostopoulos, Christos, Tahani Aladwani, Ibrahim Alghamdi, and Konstantinos Kolomvatsos. 2022. "Data-Driven Analytics Task Management Reasoning Mechanism in Edge Computing" Smart Cities 5, no. 2: 562-582. https://0-doi-org.brum.beds.ac.uk/10.3390/smartcities5020030