Article

An Adaptive Machine Learning Methodology Applied to Neuromarketing Analysis: Prediction of Consumer Behaviour Regarding the Key Elements of the Packaging Design of an Educational Toy

by
David Juárez-Varón
1,*,
Victoria Tur-Viñes
2,
Alejandro Rabasa-Dolado
3 and
Kristina Polotskaya
3
1
Department of Mechanical and Materials Engineering, Universitat Politècnica de València, Camino de Vera, s/n, 46022 Valencia, Spain
2
Department of Communication and Social Psychology, Universidad de Alicante, Carretera de San Vicente del Raspeig s/n, 03690 San Vicente del Raspeig, Spain
3
Department of Statistics, Mathematics and Informatics, Miguel Hernández University, Avenida de la Universidad, s/n, 03202 Elche, Spain
*
Author to whom correspondence should be addressed.
Submission received: 13 August 2020 / Revised: 4 September 2020 / Accepted: 9 September 2020 / Published: 19 September 2020
(This article belongs to the Special Issue Big Data and Social Sciences)

Abstract

:
This research is in response to the question of which aspects of package design are more relevant to consumers, when purchasing educational toys. Neuromarketing techniques are used, and we propose a methodology for predicting which areas attract the attention of potential customers. The aim of the present study was to propose a model that optimizes the communication design of educational toys’ packaging. The data extracted from the experiments was studied using new analytical models, based on machine learning techniques, to predict which area of packaging is observed in the first instance and which areas are never the focus of attention of potential customers. The results suggest that the most important elements are the graphic details of the packaging and the methodology fully analyzes and segments these areas, according to social circumstance and which consumer type is observing the packaging.

1. Introduction

A toy is a creation designed to stimulate and accompany a game (Espinosa 2018). It can be artisanal or industrial and it stimulates childrens’ imagination, language, memory, creativity, movement, etc., according to their age and needs. Consequently, a toy turns children into protagonists (AIJU 2019), improving the expression of their feelings, promoting positive aspects of their personality, providing learning, and helping them to grow (Peris-Ortiz et al. 2018). A game offers children the possibility of representing the world around them and their social values, by imitating or copying what they see and live in their daily lives. The child interrelates a game with their environment and previous experiences (Martínez-Sanz 2012), which allows the child to reinforce their self-image, express feelings, fears, and concerns, as well as use the game as a way to resolve conflicts (Espinosa 2018).
Design is a creative act (T. B. Lawrence and Phillips 2002) that defines objects (Bloch 1995), by working with the intangible to create meaning at different cultural levels (AEFJ 2019; Starks 2014). There is a risk of standardization (Lučić et al. 2019), an aspect that allows the designer to operate without compromising sensitivity and creativity.
A toy is considered to be a cultural product (Jones et al. 2015) which reinforces real-life concepts. (AIJU 2019). Signs used in the design of a toy have significant meaning, which promote the interpretation of a toy and, in this way, children represent images, characters, and scenes from the real world, as well as interact with their fantasies or other children. In turn, a toy promotes physical and social competence; additionally, the child better understands their world by exploring the properties of the toy. A toy also promotes physical and mental exercise, since it stimulates the imagination.
The selection of toys by adults sets the trend in consumption. Packaging is a fundamental part of a product that produces communication and sales, in addition to ensuring a product arrives in optimal condition. (AMA 2013). Packaging, as an element, is designed and has become a useful means to protect the product. In addition, it has a visual function (Nancarrow et al. 1998), it communicates silently (Tur-Viñes et al. 2014), and mainly fulfils the following three functions (Lamb 2008): product protection (breakage, light, temperature, etc.); product promotion (differentiation from competitors and association with the brand by design, colors, shapes, and materials); and ease of product management (storage, use, and disposal). Packaging uses visual grammar as a way of organizing signifiers and meanings, and form as a basic visual element, which become important when used together (Vilchis 2008).
The toy sector has become increasingly concerned about the packaging that surrounds toys (Soluciones-Packaging 2016), since it plays a fundamental role in the toys. In addition to protecting products (many of them delicate and with small parts), packaging plays a fundamental role in communicating its value and philosophy to parents and children (K. Lawrence et al. 2015). Toy packaging must be efficient, cost-effective, and should facilitate, as much as possible, both protection of a product and attraction to a product on shelves.
The choice of the game or toy must consider the transmission of social values, to promote social relationships (Espinosa 2018). An educational toy stimulates intellectual development through reasoning, attention, imagination and creativity, and mastery of language. It is an attractive resource to reinforce children’s formal content learning, such as numbers and letters, and it helps children acquire values such as respect and tolerance towards people, norms and rules, and the promotion of socialization (Luévano Torres 2013). A game is a tool through which many questions can be explained and answered (AIJU 2019). Examples of educational games include simple scientific experiments; puzzles; creative games; games that help you learn geography, history, science, etc.; as well as interactive games on electronic devices (book games, math and reading games, music games, memory and logic games, pattern recognition, games that work on social and emotional skills, applications that help you learn geography, history, science, etc., and the electronic version of creative puzzles or games).
An educational toy has a different utility approach than other toys, where the different variables are work, in addition to leisure, and therefore it is interesting to know the information processing in making purchasing decisions. The analysis of consumer behavior in relation to products whose purchase decisions involve emotional aspects, requires using neuromarketing techniques and generating a large amount of data for analysis that, until now, is processed using software for each technology and basic statistics (Juarez et al. 2020; Mañas-Viniegra et al. 2020). However, when it comes to tackling complex analytical problems, the scientific community is openly committed to the data-driven approach, which generates predictive models, solely from the data itself, especially suitable to be integrated into decision support systems (DSS) (Provost and Fawcett 2013).
The application of machine learning techniques in the field of eye tracking studies where there is a very high dispersion of the data, produced by the heterogeneity of the users under study, with apparently arbitrary behaviours, and therefore more difficult to predict, leads to a specific preprocessing of experimental data, in order to subsequently be able to apply discrete predictive techniques with greater tolerance to prediction error.

2. Results

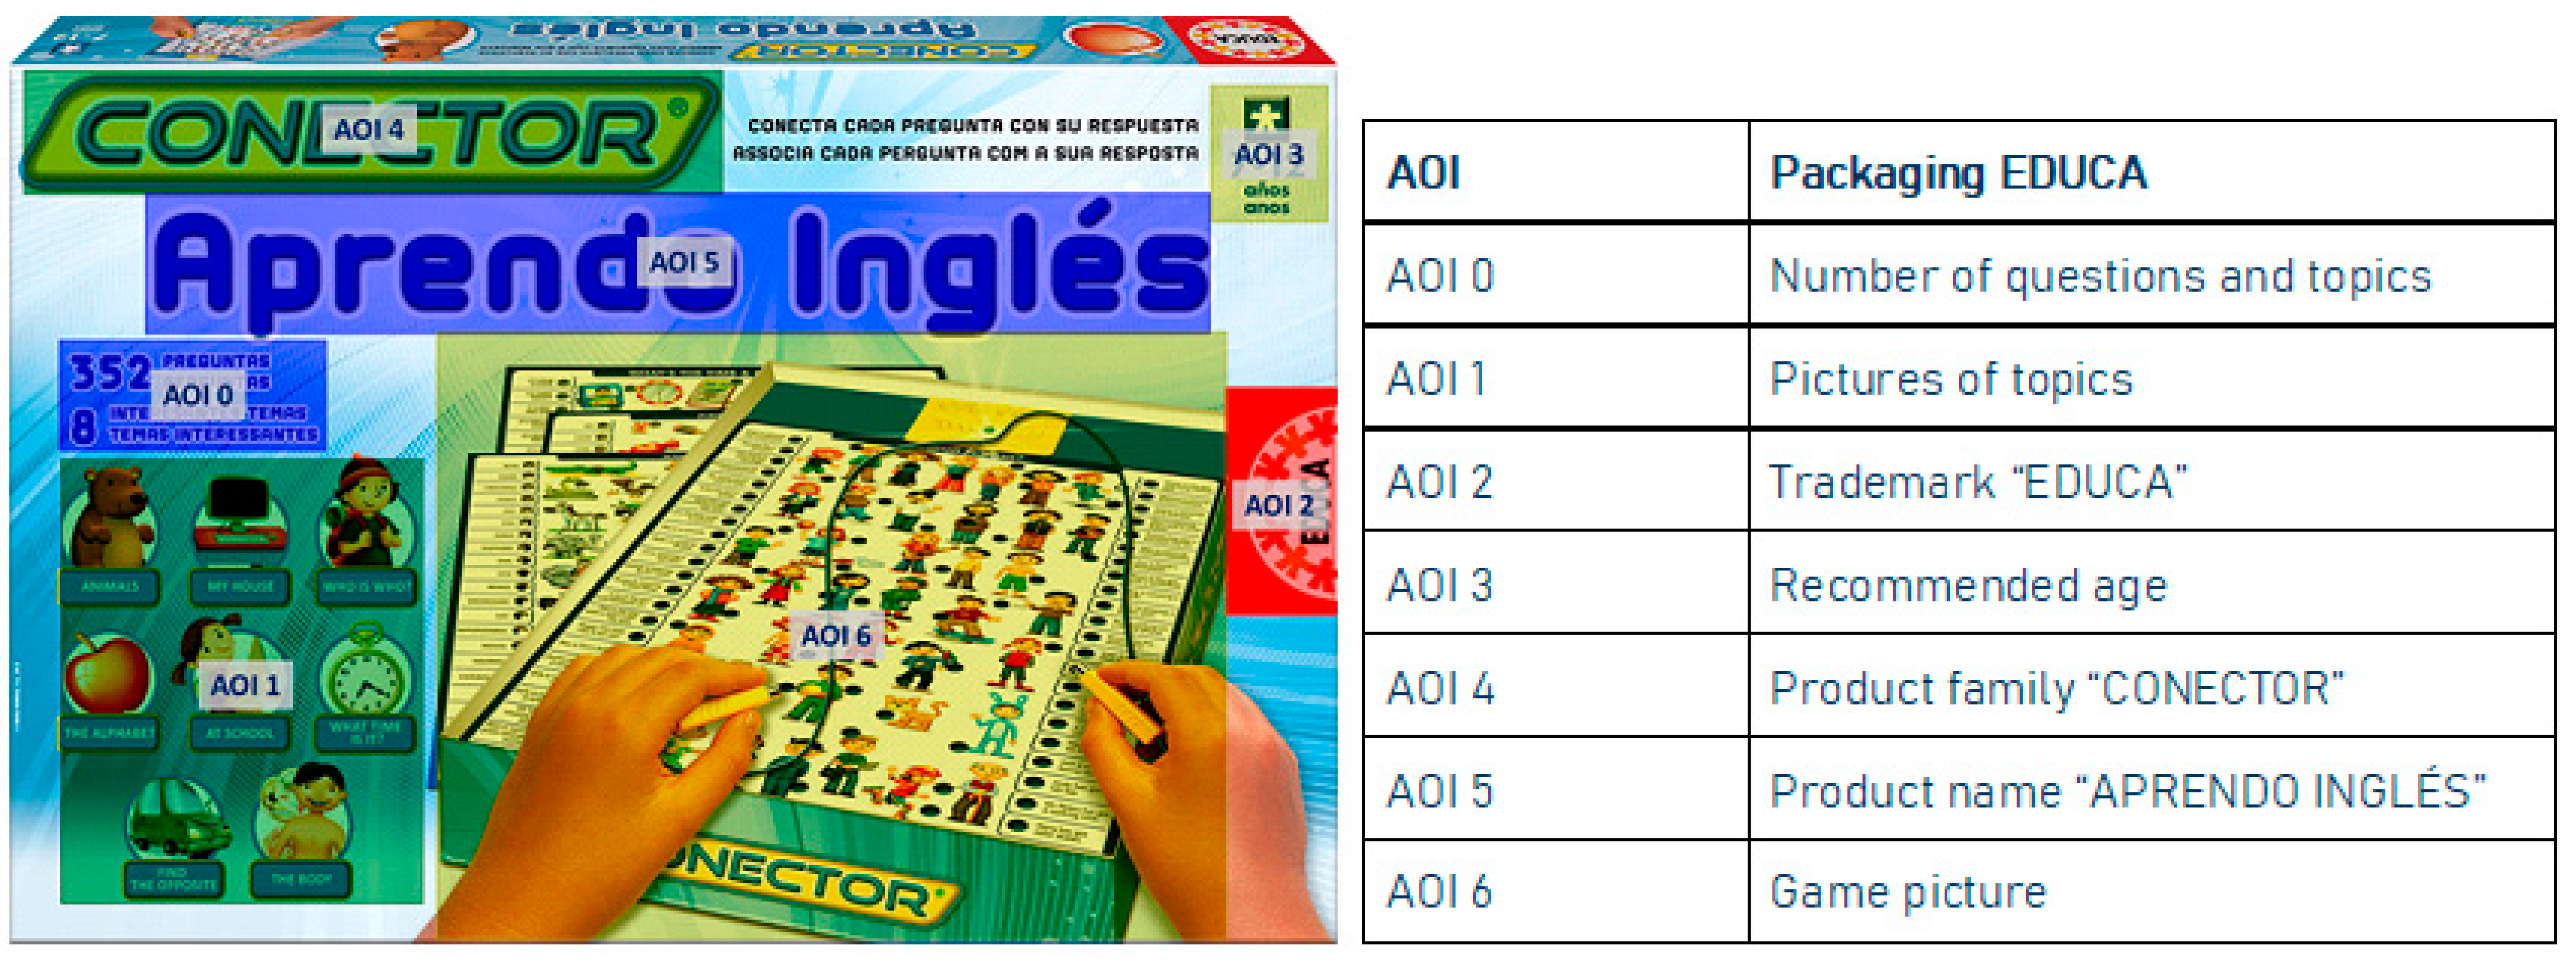
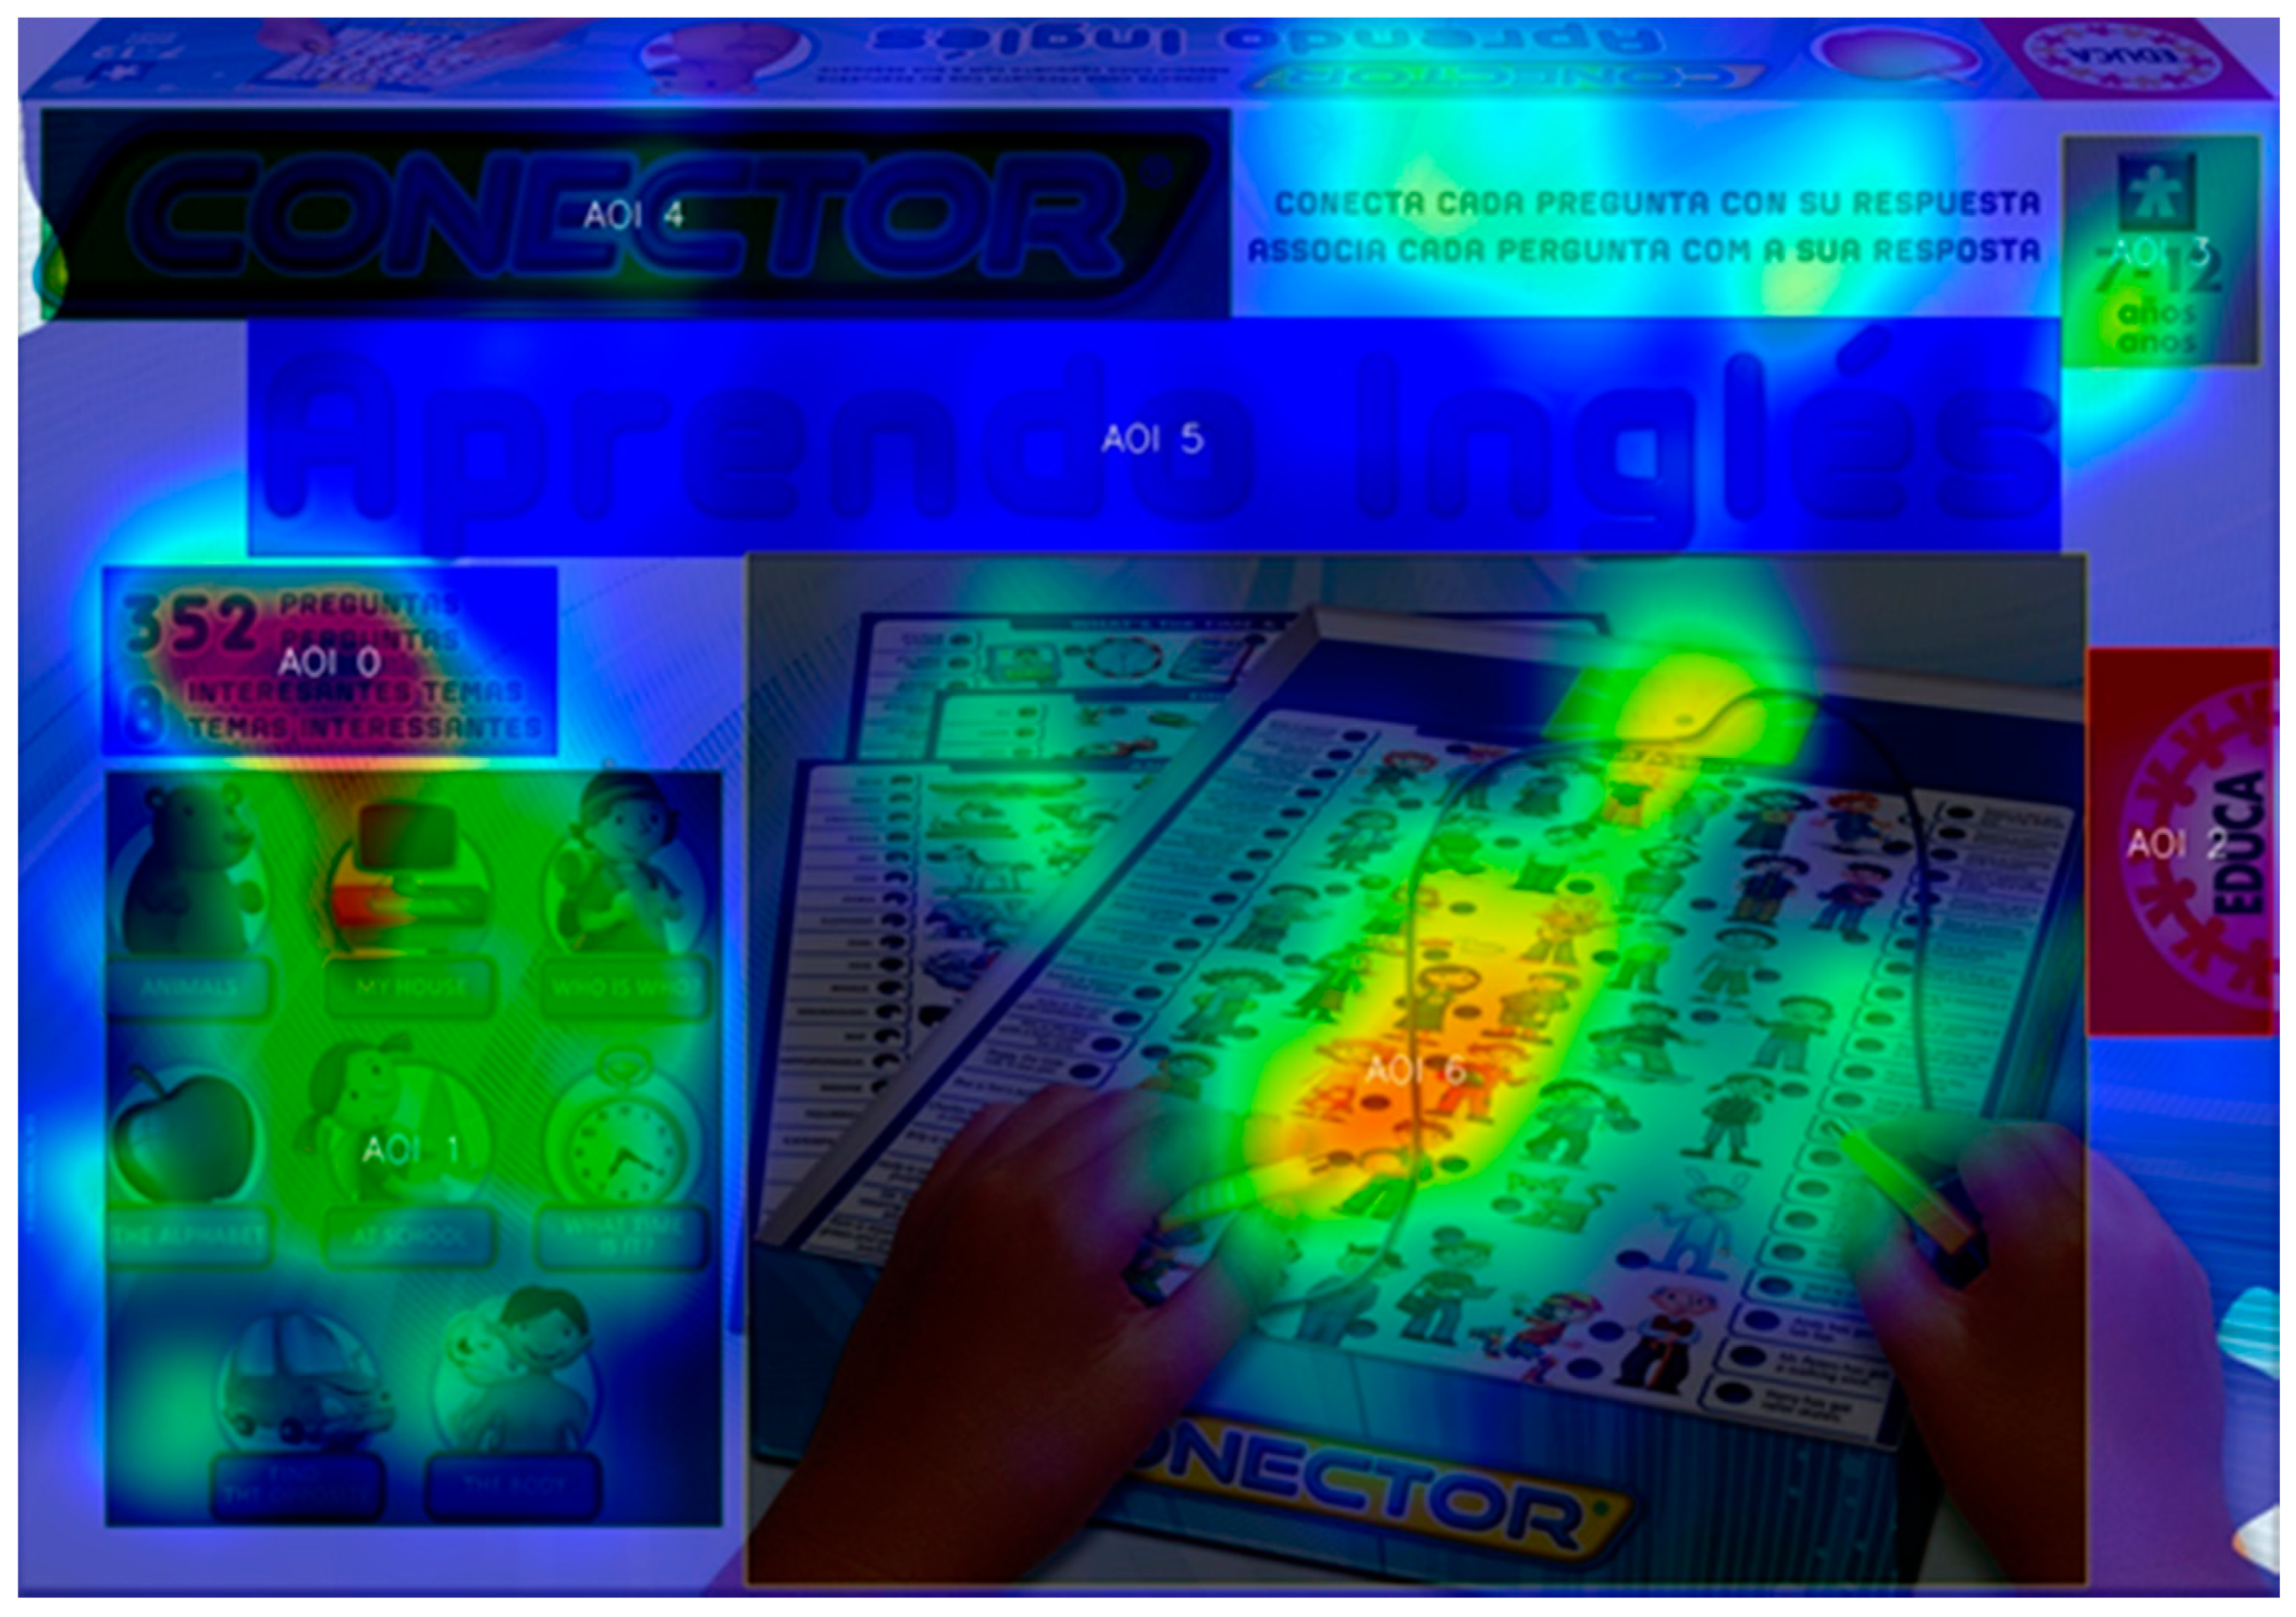
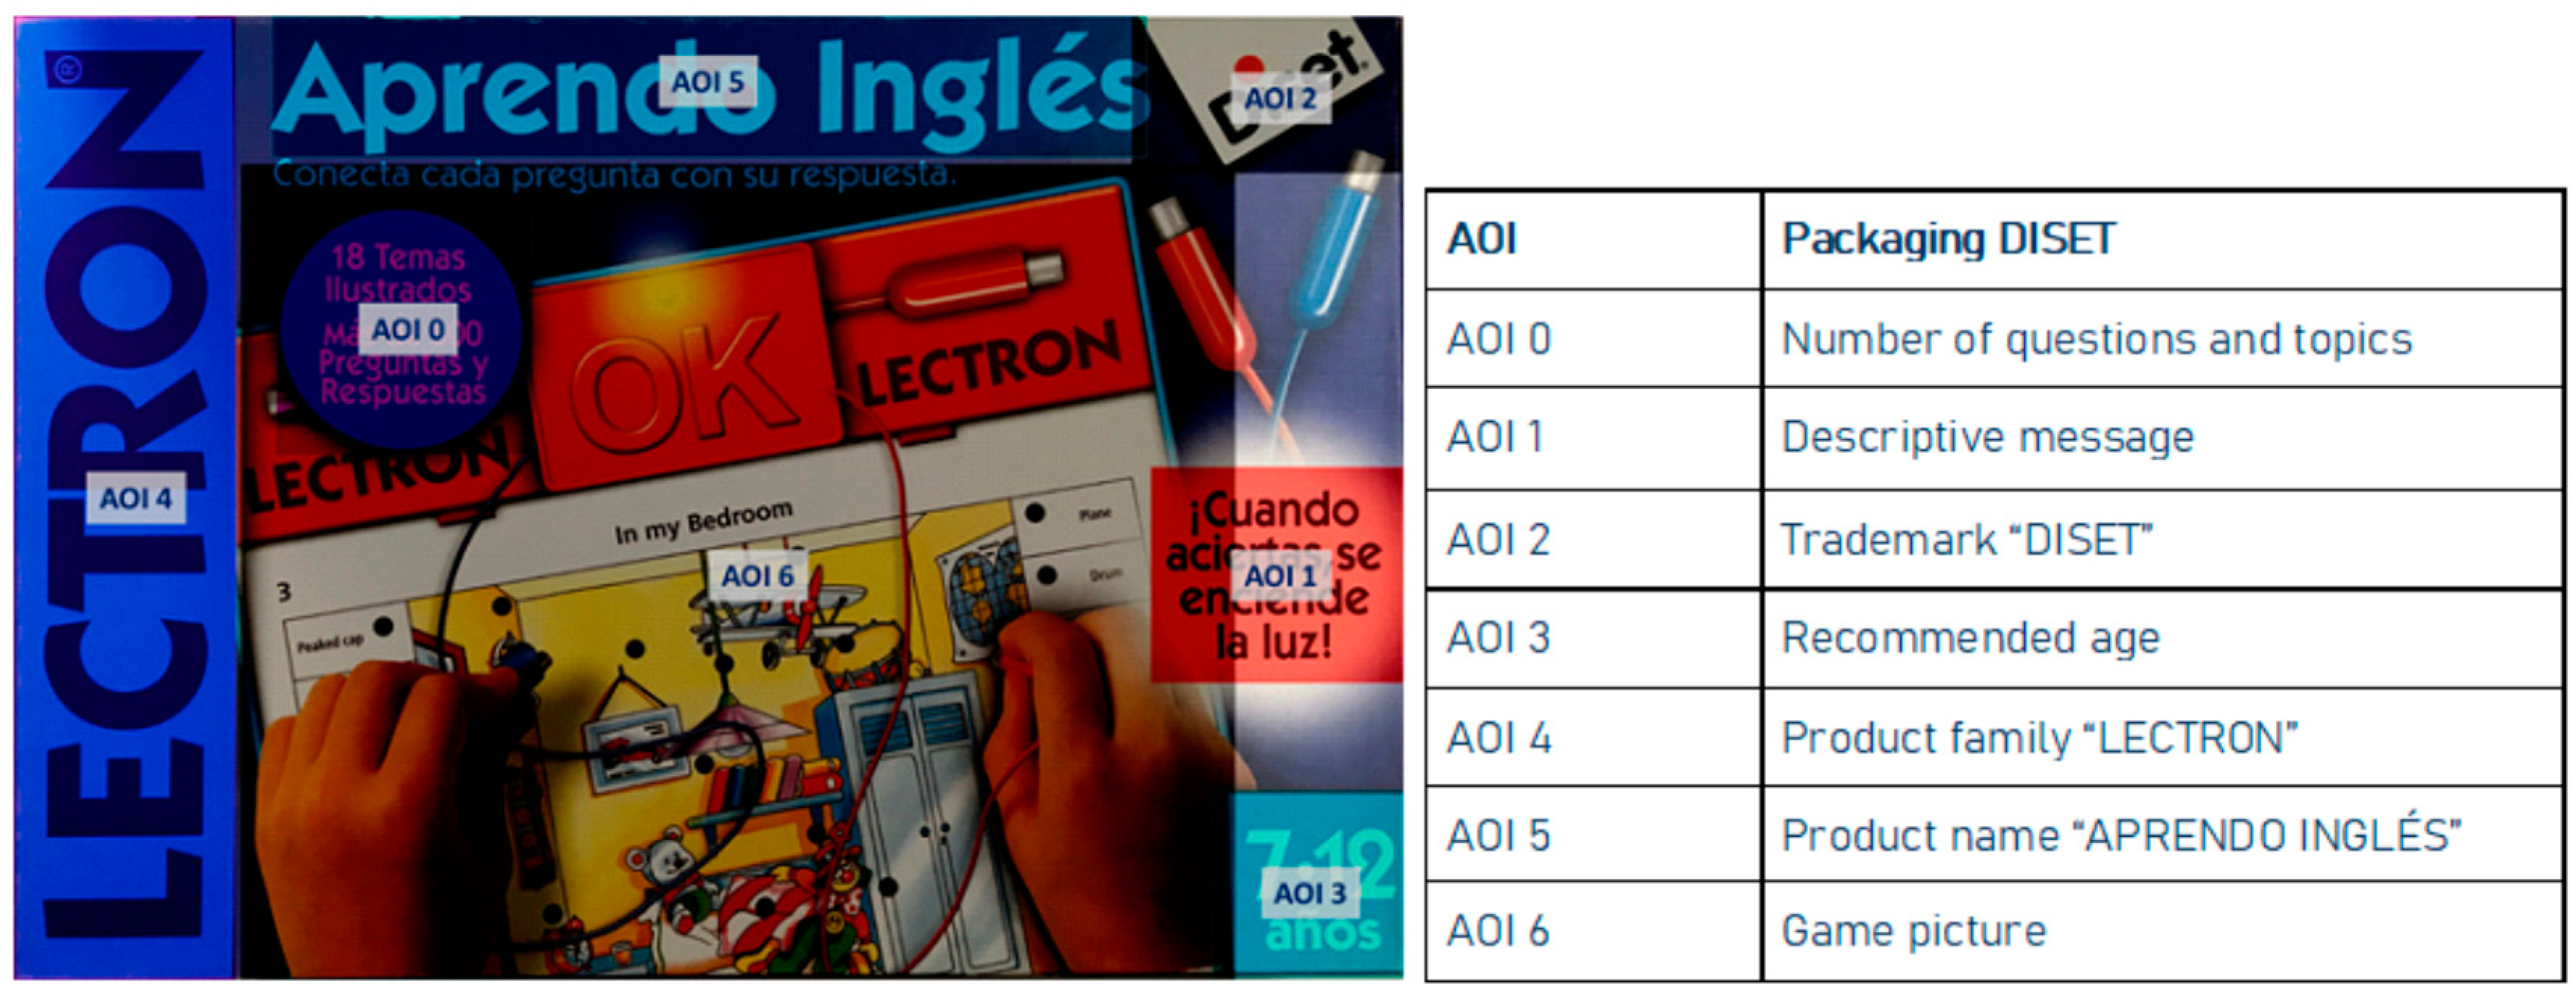
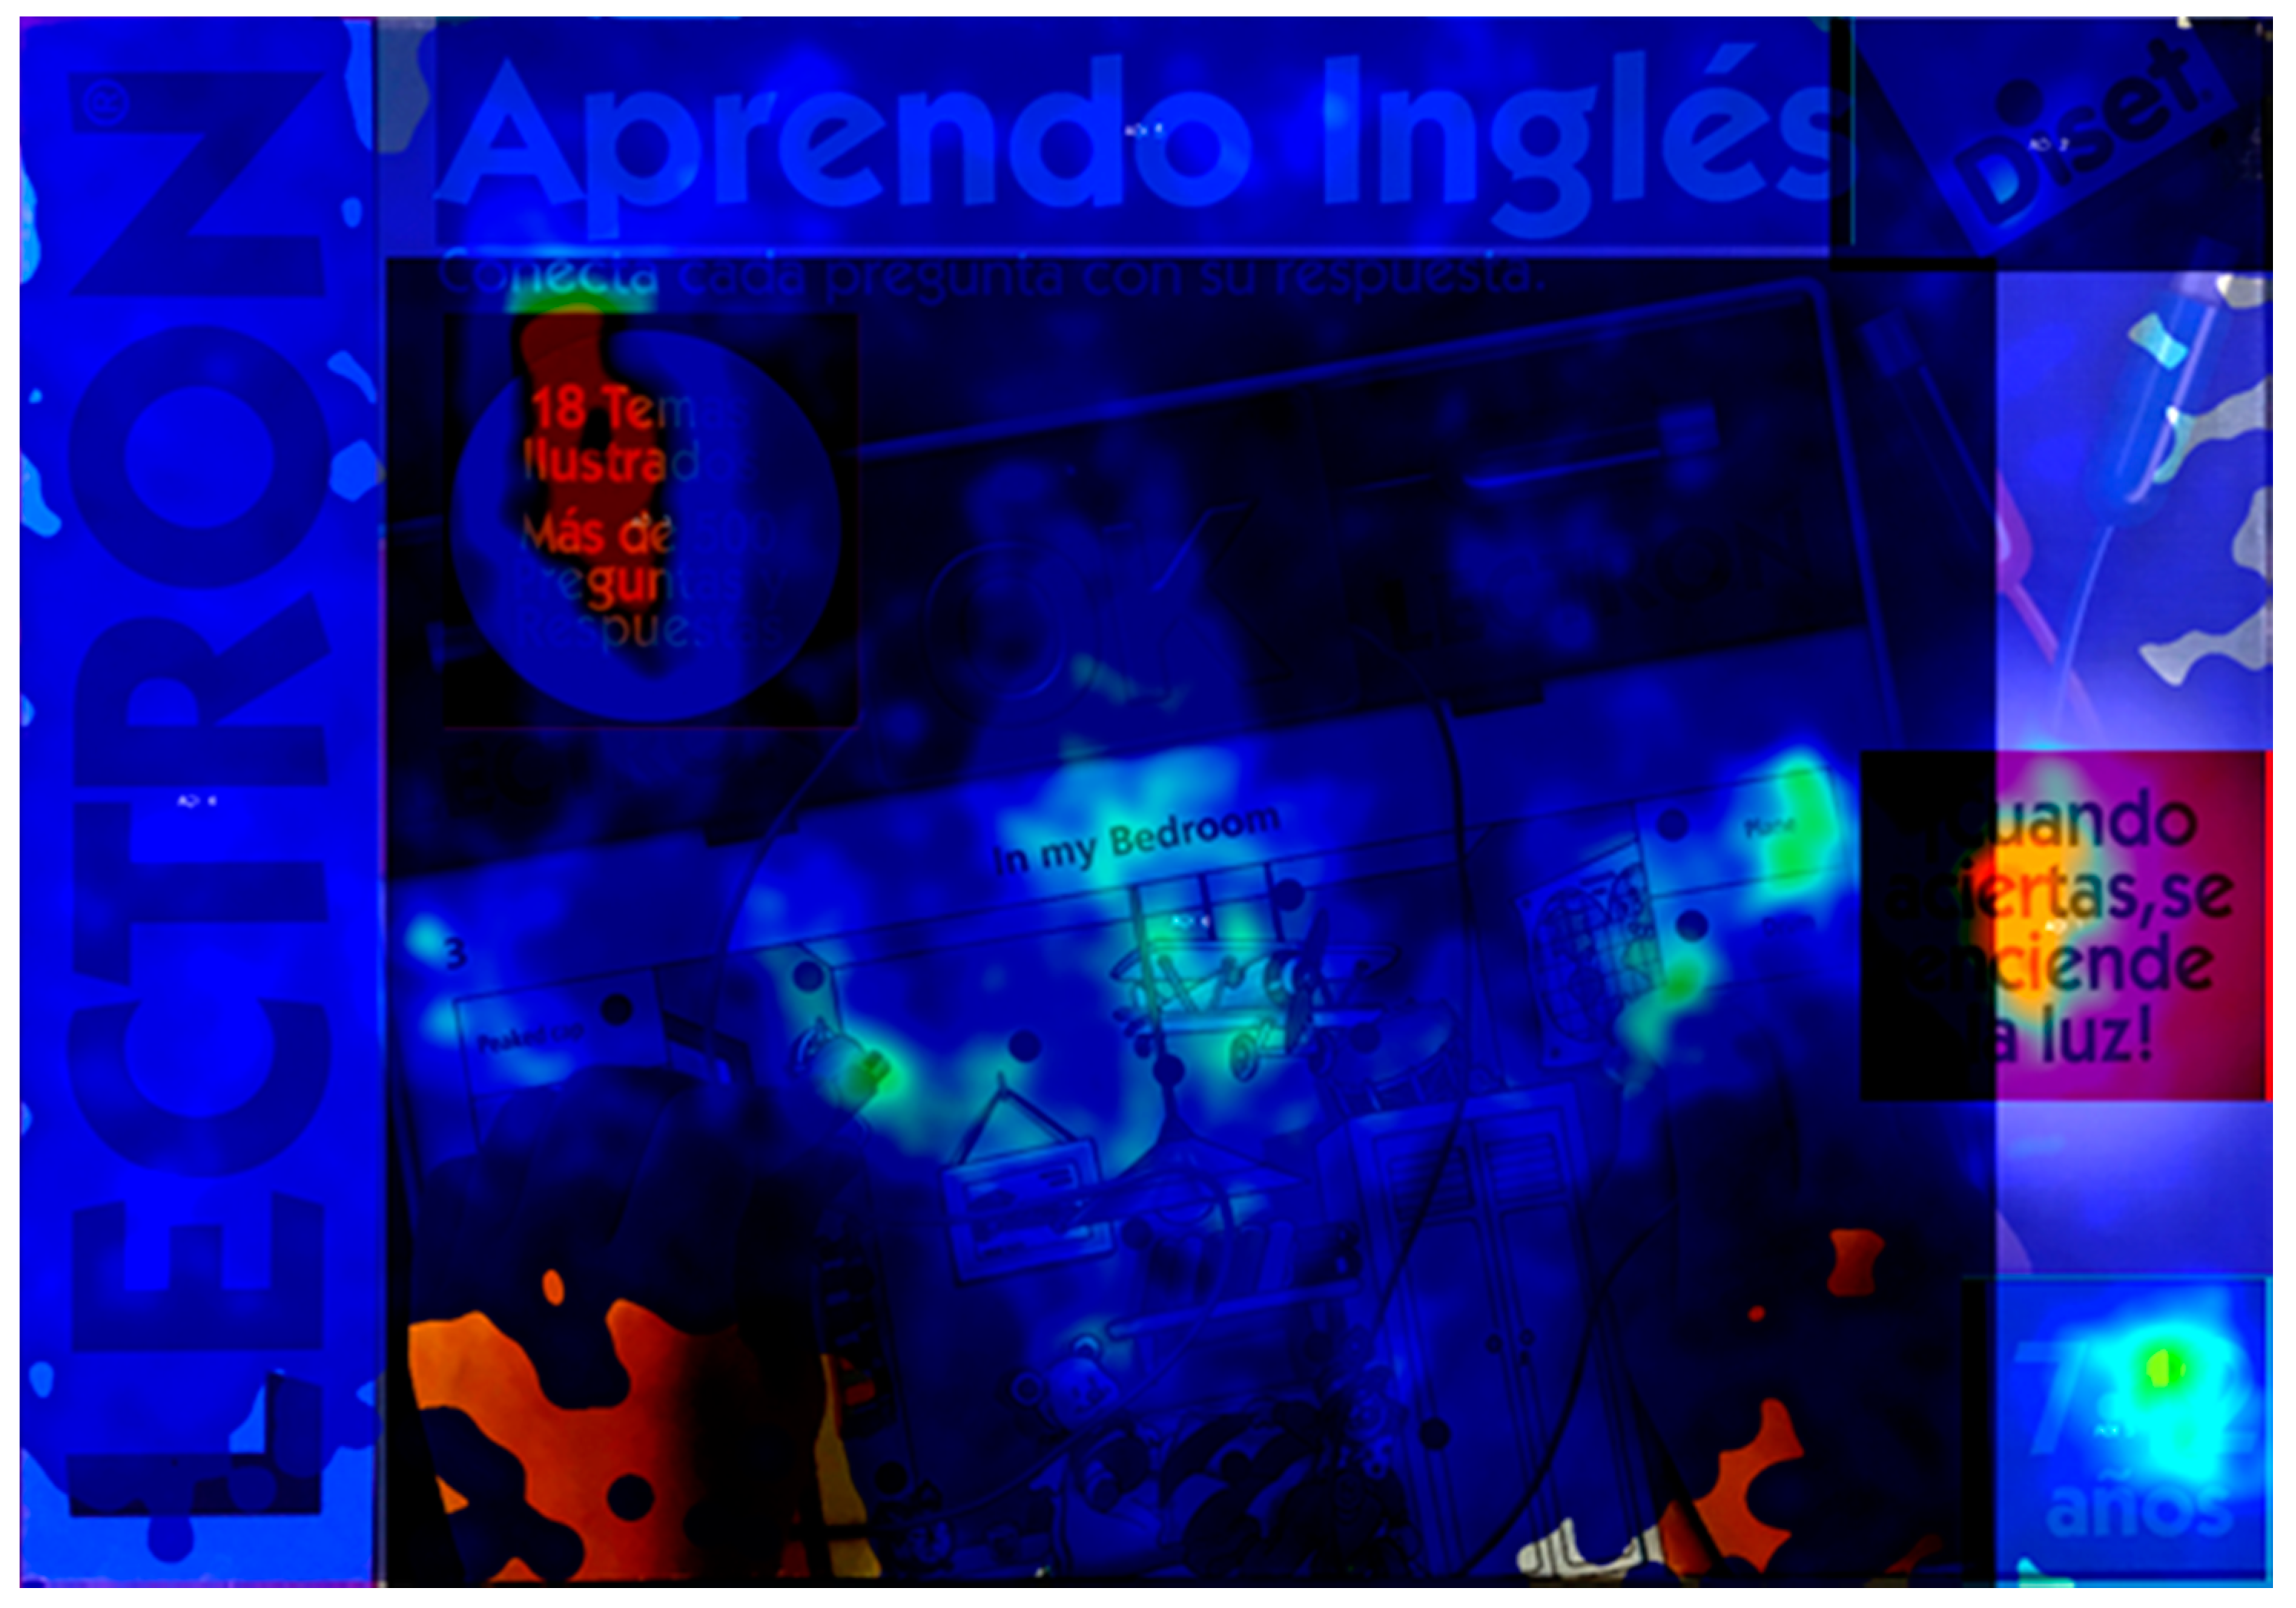
2.1. Results Interpretation from Neuromarketing Approach

After showing each product (image) separately on a screen for 30 s (estimated time so the details of interest can be seen, as it is not possible to open the toy), biometric eye tracking was used, with the aim of simulating a consumer’s experience when taking product 1 or 2 from store shelves. Figure 1 shows areas of interest (AOI) of the Educa packaging design.
Figure 2 shows a heat map of the distribution of the different fixings on the packaging, for all users with the following parameters:
  • Gaze (accumulated time displayed), 30 s;
  • Size (focus representation size), 35%;
  • Transparency (level of transparency of the representation), 40%.
Once the areas of interest (AOI) were identified, which in this case corresponded to the Educa brand packaging (a total of seven areas of interest), the software allowed us to draw conclusions drawn regarding the attention of users (Table 1).
The following conclusions can be drawn from this summary:
In the Educa packaging, the specification of the themes on the cover (AOI 1) draws much attention. In addition, viewers look at the recommended age (AOI 3). Not much attention is paid to the brand or the name of the game (AOI 2 and 5). Product image stands out (AOI 6). A priori, the concepts that attract the most attention are the child’s hands and the play setting (background image) on the cover of the Educa packaging, together with the specification of the themes. The first thing observed by users is the product (AOI 6), with a time of 1.05 s, shown by almost 100% of users, and a number of fixations of 25.5. The number of times the user looks at that area again is 6.4 and the most revisited by the user is area AOI 5, with 7.0 revisits.
Figure 3 shows areas of interest (AOI) of the Diset packaging design.
Some of the conclusions that can be drawn in this case are that the data is shown without differentiating the gender, overlapping the information of each individual heat map (Figure 4) corresponding to each user, and using the team’s own software (sum of dedication times to each region of the image, generating a new added heat map). The parameters configured for this type of representation, for all analysis work, were the following:
  • Gaze (accumulated time displayed), 30 s;
  • Size (focus representation size), 35%;
  • Transparency (level of transparency of the representation), 40%.
Once the areas of interest (AOI) were identified, which in this case corresponded to the Diset brand packaging (a total of seven areas of interest), the software allowed us to draw conclusions regarding the attention of users (Table 2):
The following conclusions can be drawn from this summary:
In the Diset packaging, the specification of the number of topics and questions/answers on the cover (AOI 0) is very striking. In addition, users looked at the message “when you hit...” (AOI 1) and the product reference (AOI 5). Not much attention is paid to the brand, the recommended age, or the name of the game (AOI 2, 3, and 4). What is most striking, with more than 50% of the observation time, is the image of the product (AOI 6). A priori, the concepts that attract the most attention are the game setting (background image) of the Diset cover, along with the specification of the number of topics and questions. The first thing that users see is the image of the product (AOI 6), with a time of 0.42 s, shown by 100% of users and a number of fixations of 54.1. The number of times the user looks at the area again is 10.2, and it is the most revisited. These data are far superior to the Educa equivalents.

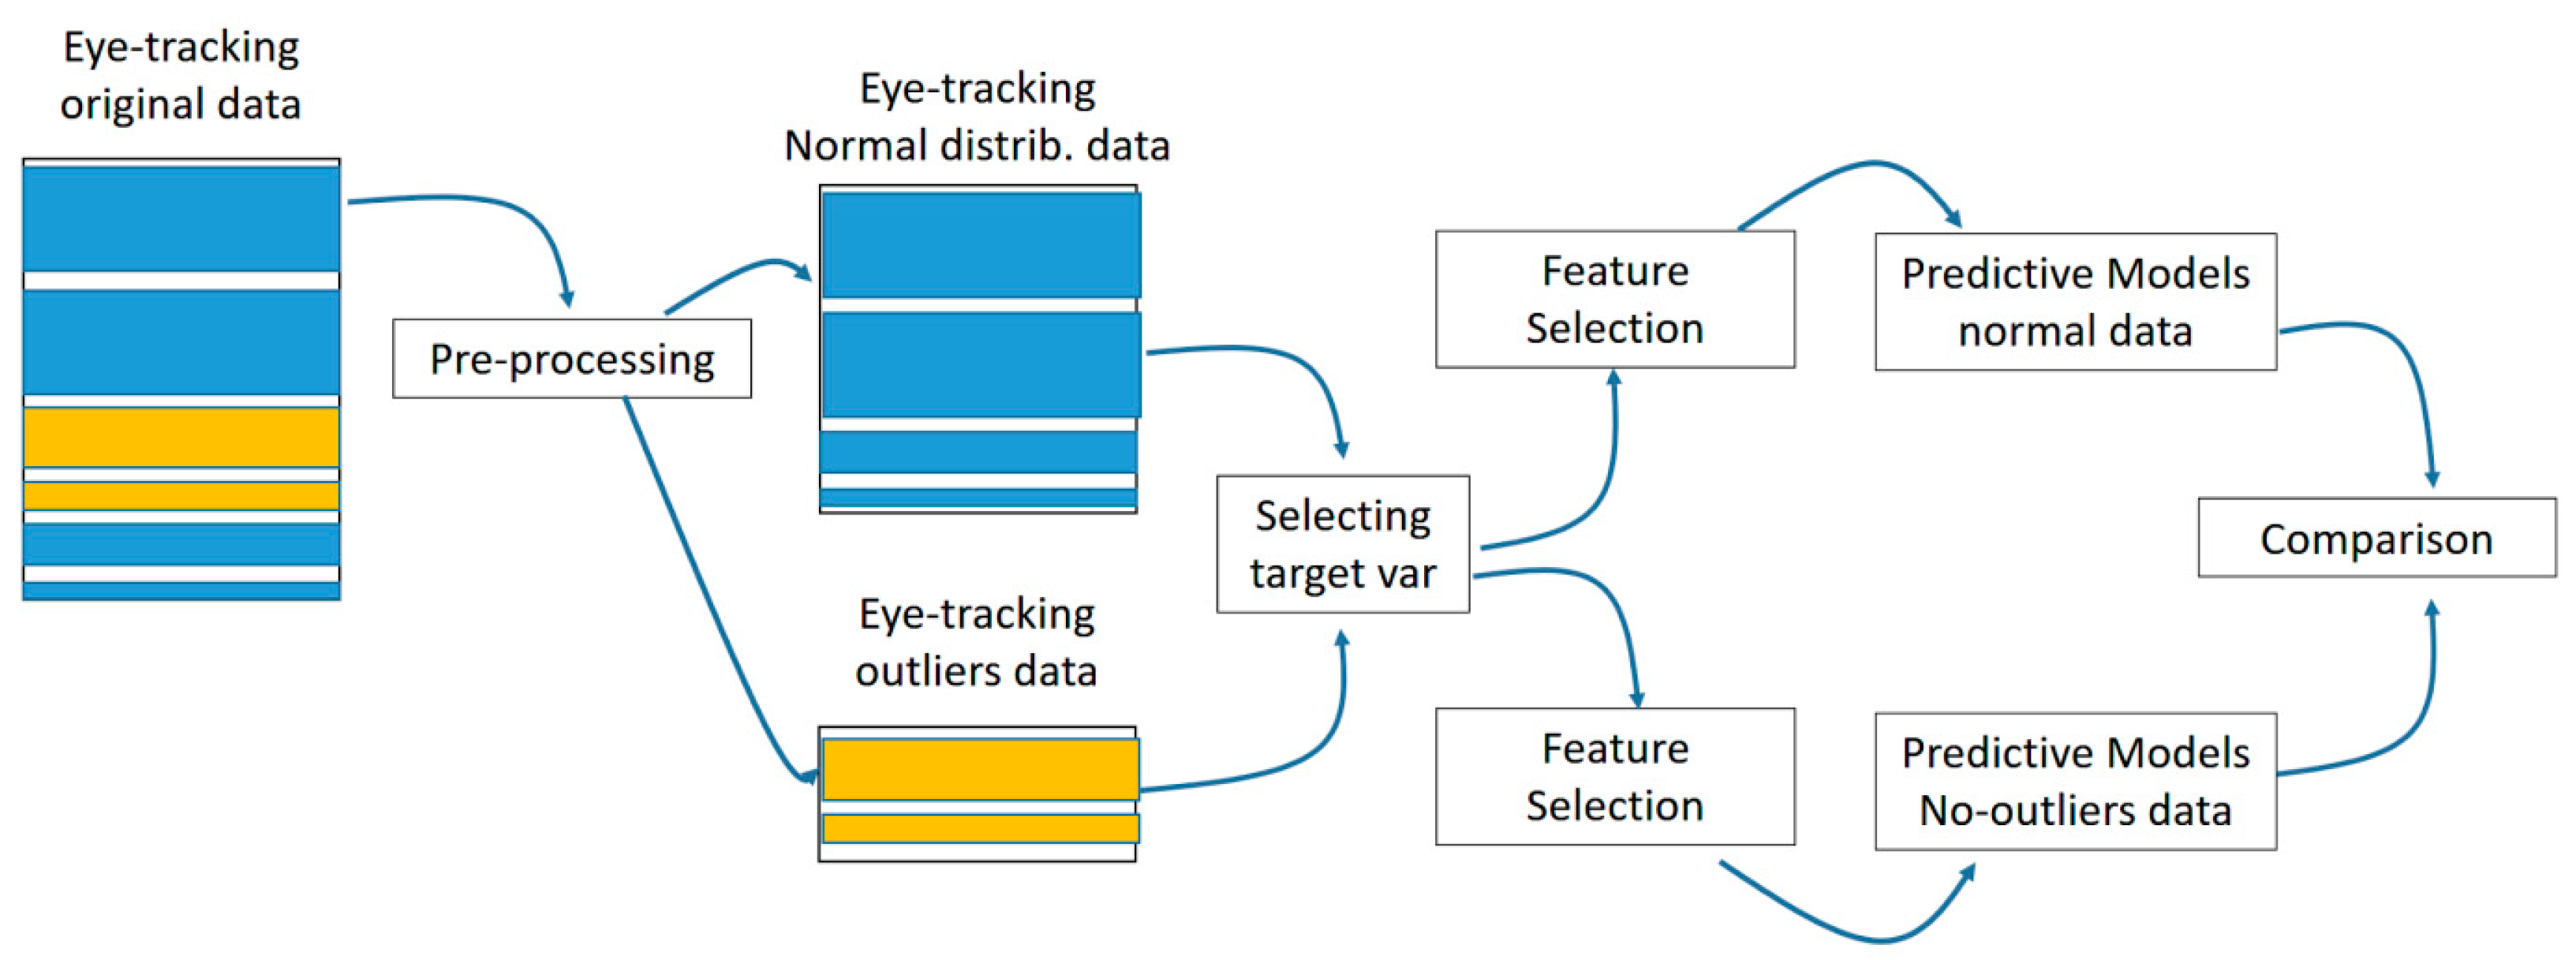
2.2. Computational Experiment in the Educational Toy Industry

Preprocessing Procedure

If we assume that the variable Time to 1st View (sec) explains when a certain area catches our attention, we could say that Area 6 (game image) captures the attention of most users from second 0, while Area 2 (game brand) can be visualized up to the 30th second of the observation (Figure 5).
Observing the values that the variable Time to 1st View (sec) takes according to the user (Figure 6), we can see that these are very dispersed, although they have similar averages. That is, in the study, there are people who took very little time to see all the areas and others who needed more seconds to visualize one in particular, or several of them. Outliers for each user mostly come from Area 2 and some from Area 3 (child’s age).
Comparing the values that the variable takes according to the brand of the game (Figure 7), it can be seen that the time it takes 75% of users to see the areas of the Diset brand is less than that of Educa, which may mean a more easily seen design or more interest in certain areas, although it takes very little time to move from one area to another. In order to draw conclusions, a systematic study of the Time Viewed (sec) variable is required.
Carrying out a similar analysis of the variable, to see the differences in the values according to gender (Figure 8), personal situation (Figure 9), and the number of children (Figure 10), no significant differences were seen between them, taking into account the sample bias (in the sample we have only 42 values from individuals who live as a “couple” as compared with 280 instances of “married”.
Finally, Figure 11 shows the distribution of the variable is studied without considering other factors. In this case, it is observed that the outliers come, for the most part, from Area 2 and also from the Educa brand. It is known that these data can negatively affect the subsequent study. Therefore, the initial sample and the sample without outliers are analysed in parallel.
In the same way, other variables of interest, i.e., time viewed (sec), fixations (#), and revisits (#) are analysed.
For the subsequent classification study, as this type of method requires, the already discretized objective variables must be available. The discretize function and the “frequency” method are used to separate the data into intervals according to the frequency of the values that belong to it. The number of sections (breaks) used for the discretization of each variable has been achieved by progressively increasing the number of sections. Then, the chosen number of breaks is the one that achieves a greater agreement between the model and the probability of being correct if a fully “random” distribution was followed.

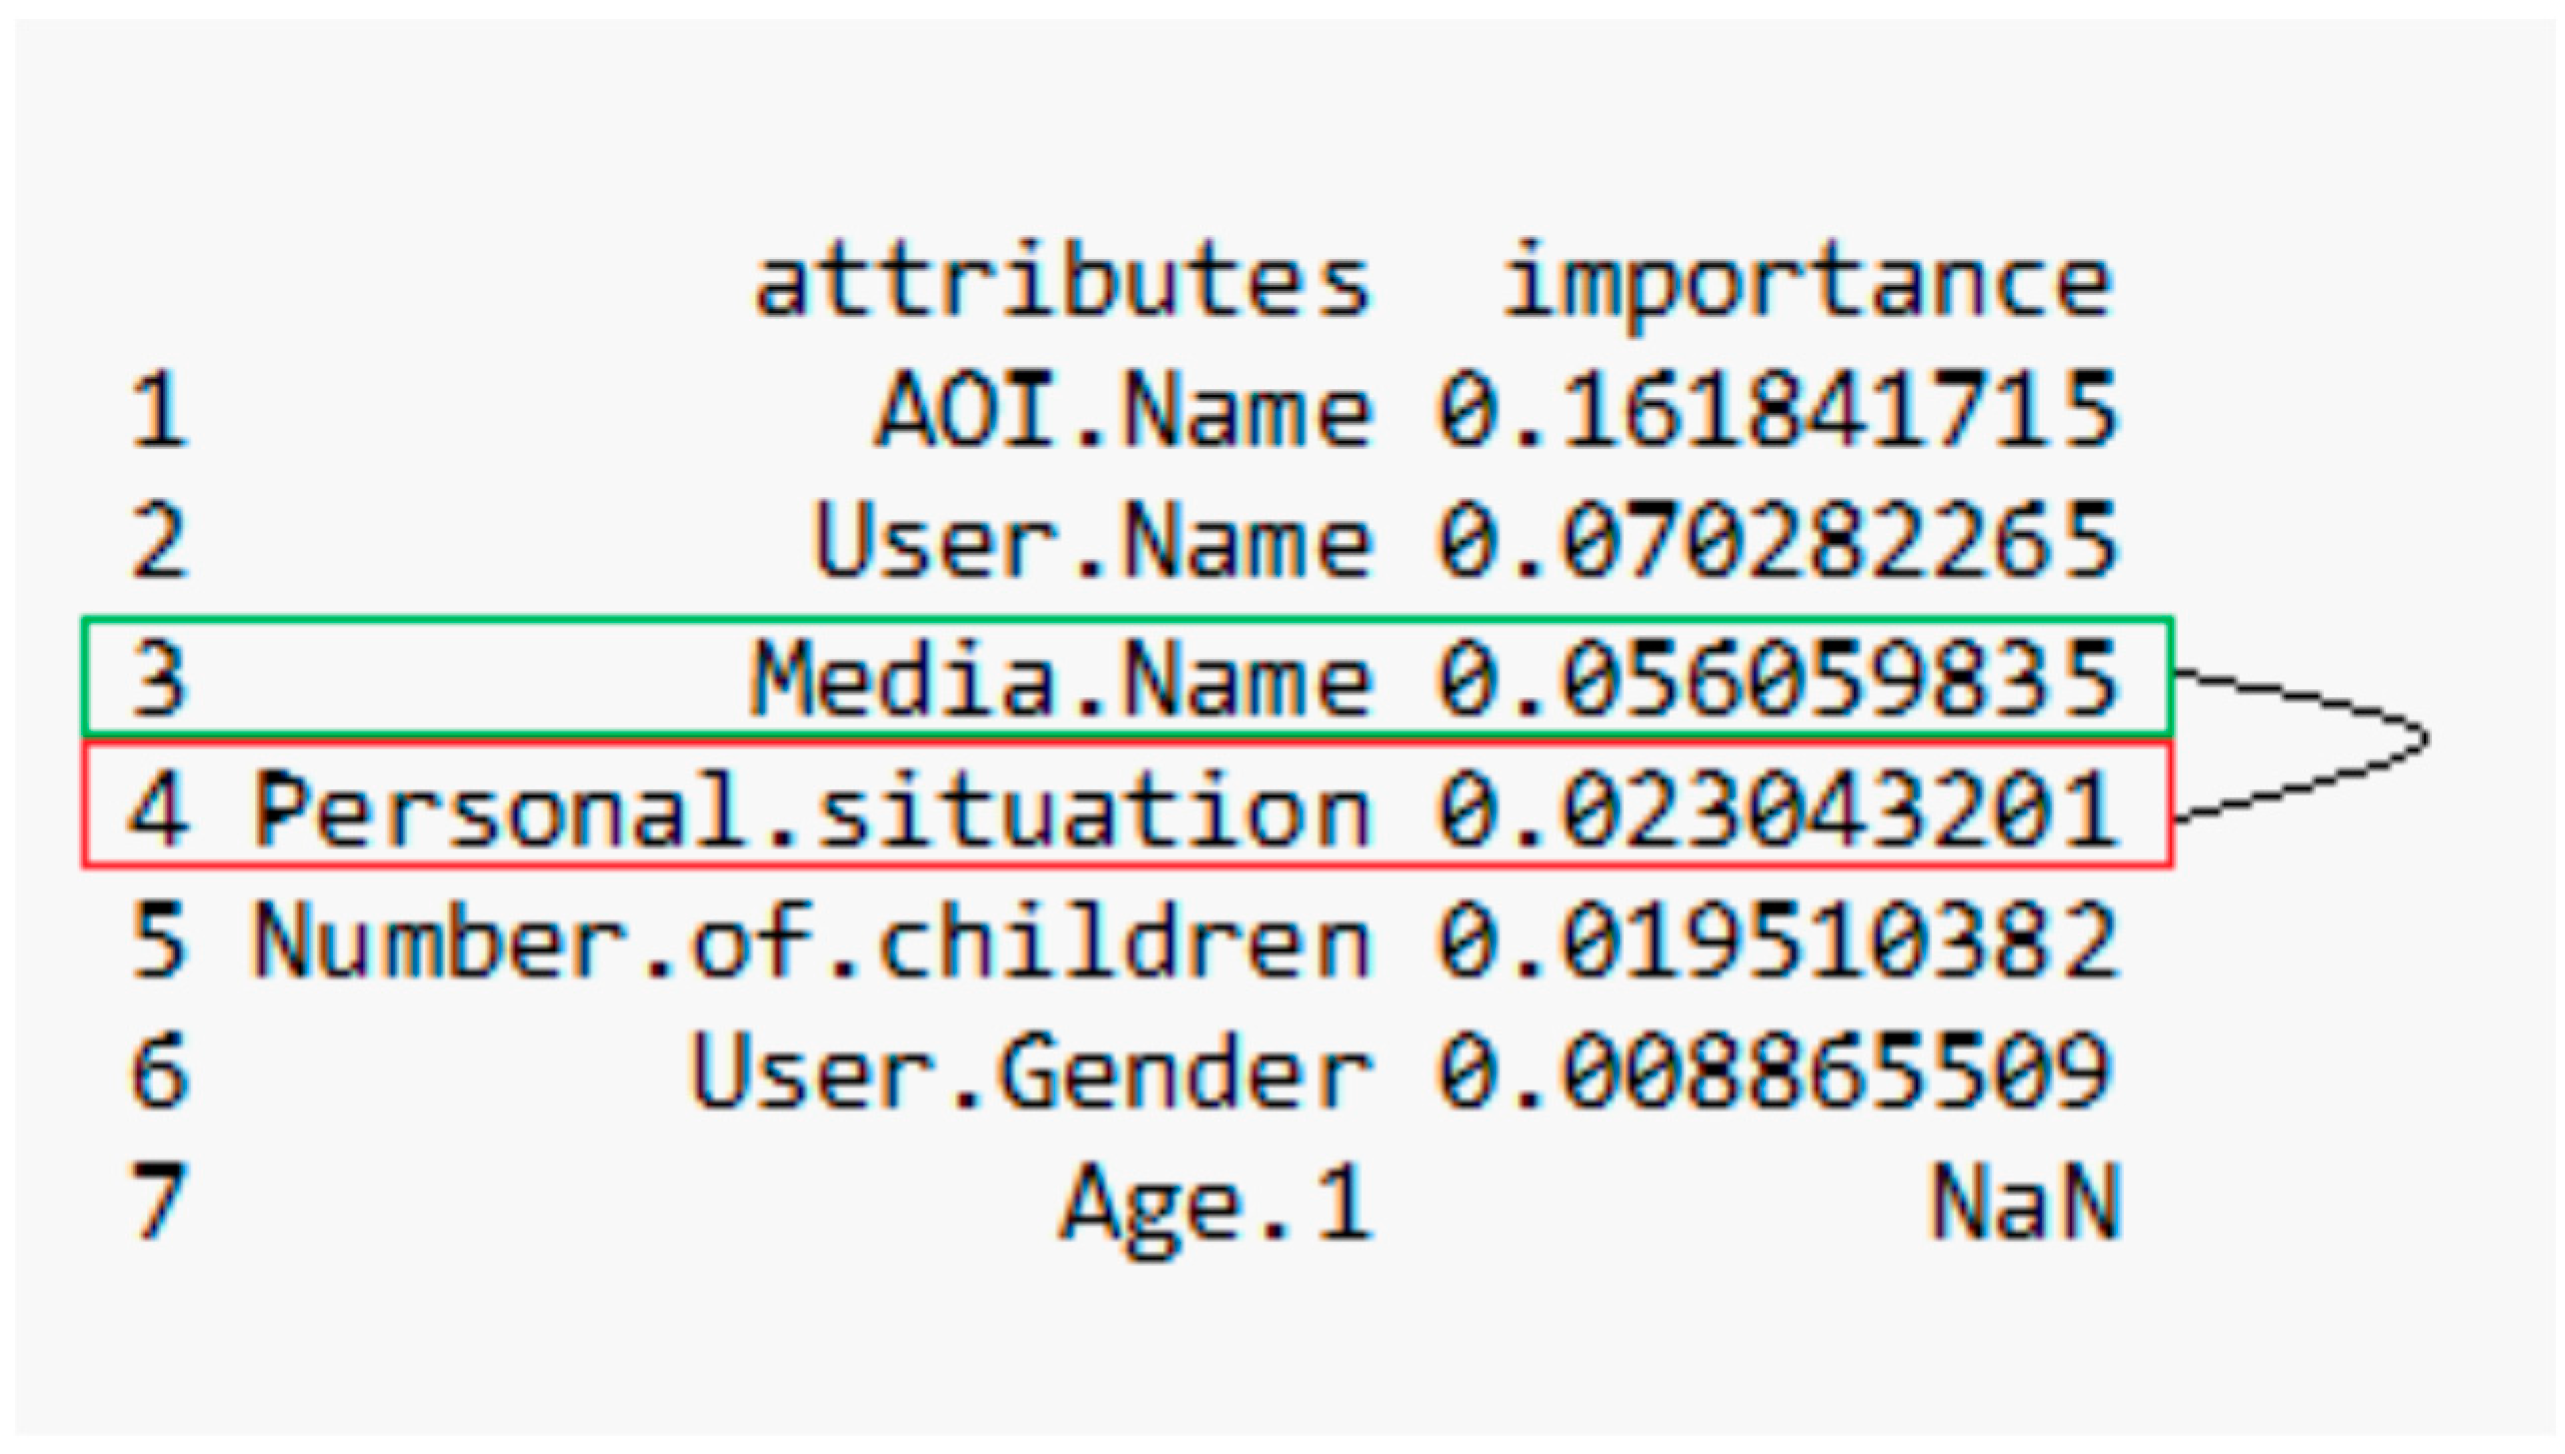
2.3. Feature Selection Depending on Target Variable

The selection of variables to incorporate in the predictive models is a process of key importance in the proposed methodology, since not all explanatory variables are highly correlated with the variable to be predicted (nor are they to the same extent).
In addition, the automatic feature selection process becomes especially relevant in problems where there is a sample with few records, compared to the number of variables measured in each record, as is the case at hand, as confirmed in (Dernoncourt et al. 2014). To approach this task, there are different methods to carry out the selection of relevant characteristics. One of the most widely used is the support vector machine (SVM) (Chapelle et al. 2002). Another is the principal component analysis (PCA) method, which has also undergone interesting updates from the applied point of view (Peres-Neto et al. 2005).
In this study, the variable ranking method (Repository 2020) is used to select the most relevant variables, on each of the possible target variables.
Below is the variable ranking for the target variable fixations. The rest of the rankings can be consulted in the Appendix A (before the References section), where it can be seen that the set of significant variables is not always the same, nor do they occupy the same positions in the different rankings.
If the variables that most influence the objective variable fixations are analyzed, the results shown in Figure 12 are obtained.
This data shows that the number of fixations in a given area is mainly conditioned by the area in question, thus, it depends on the user, his personal situation, and later the brand of the game.
Eliminating the outliers of the variable the results shown in Figure 13 are obtained.
This figure shows that the Media.Name (framed in green) variable is now more important than Personal.situation (framed in red).

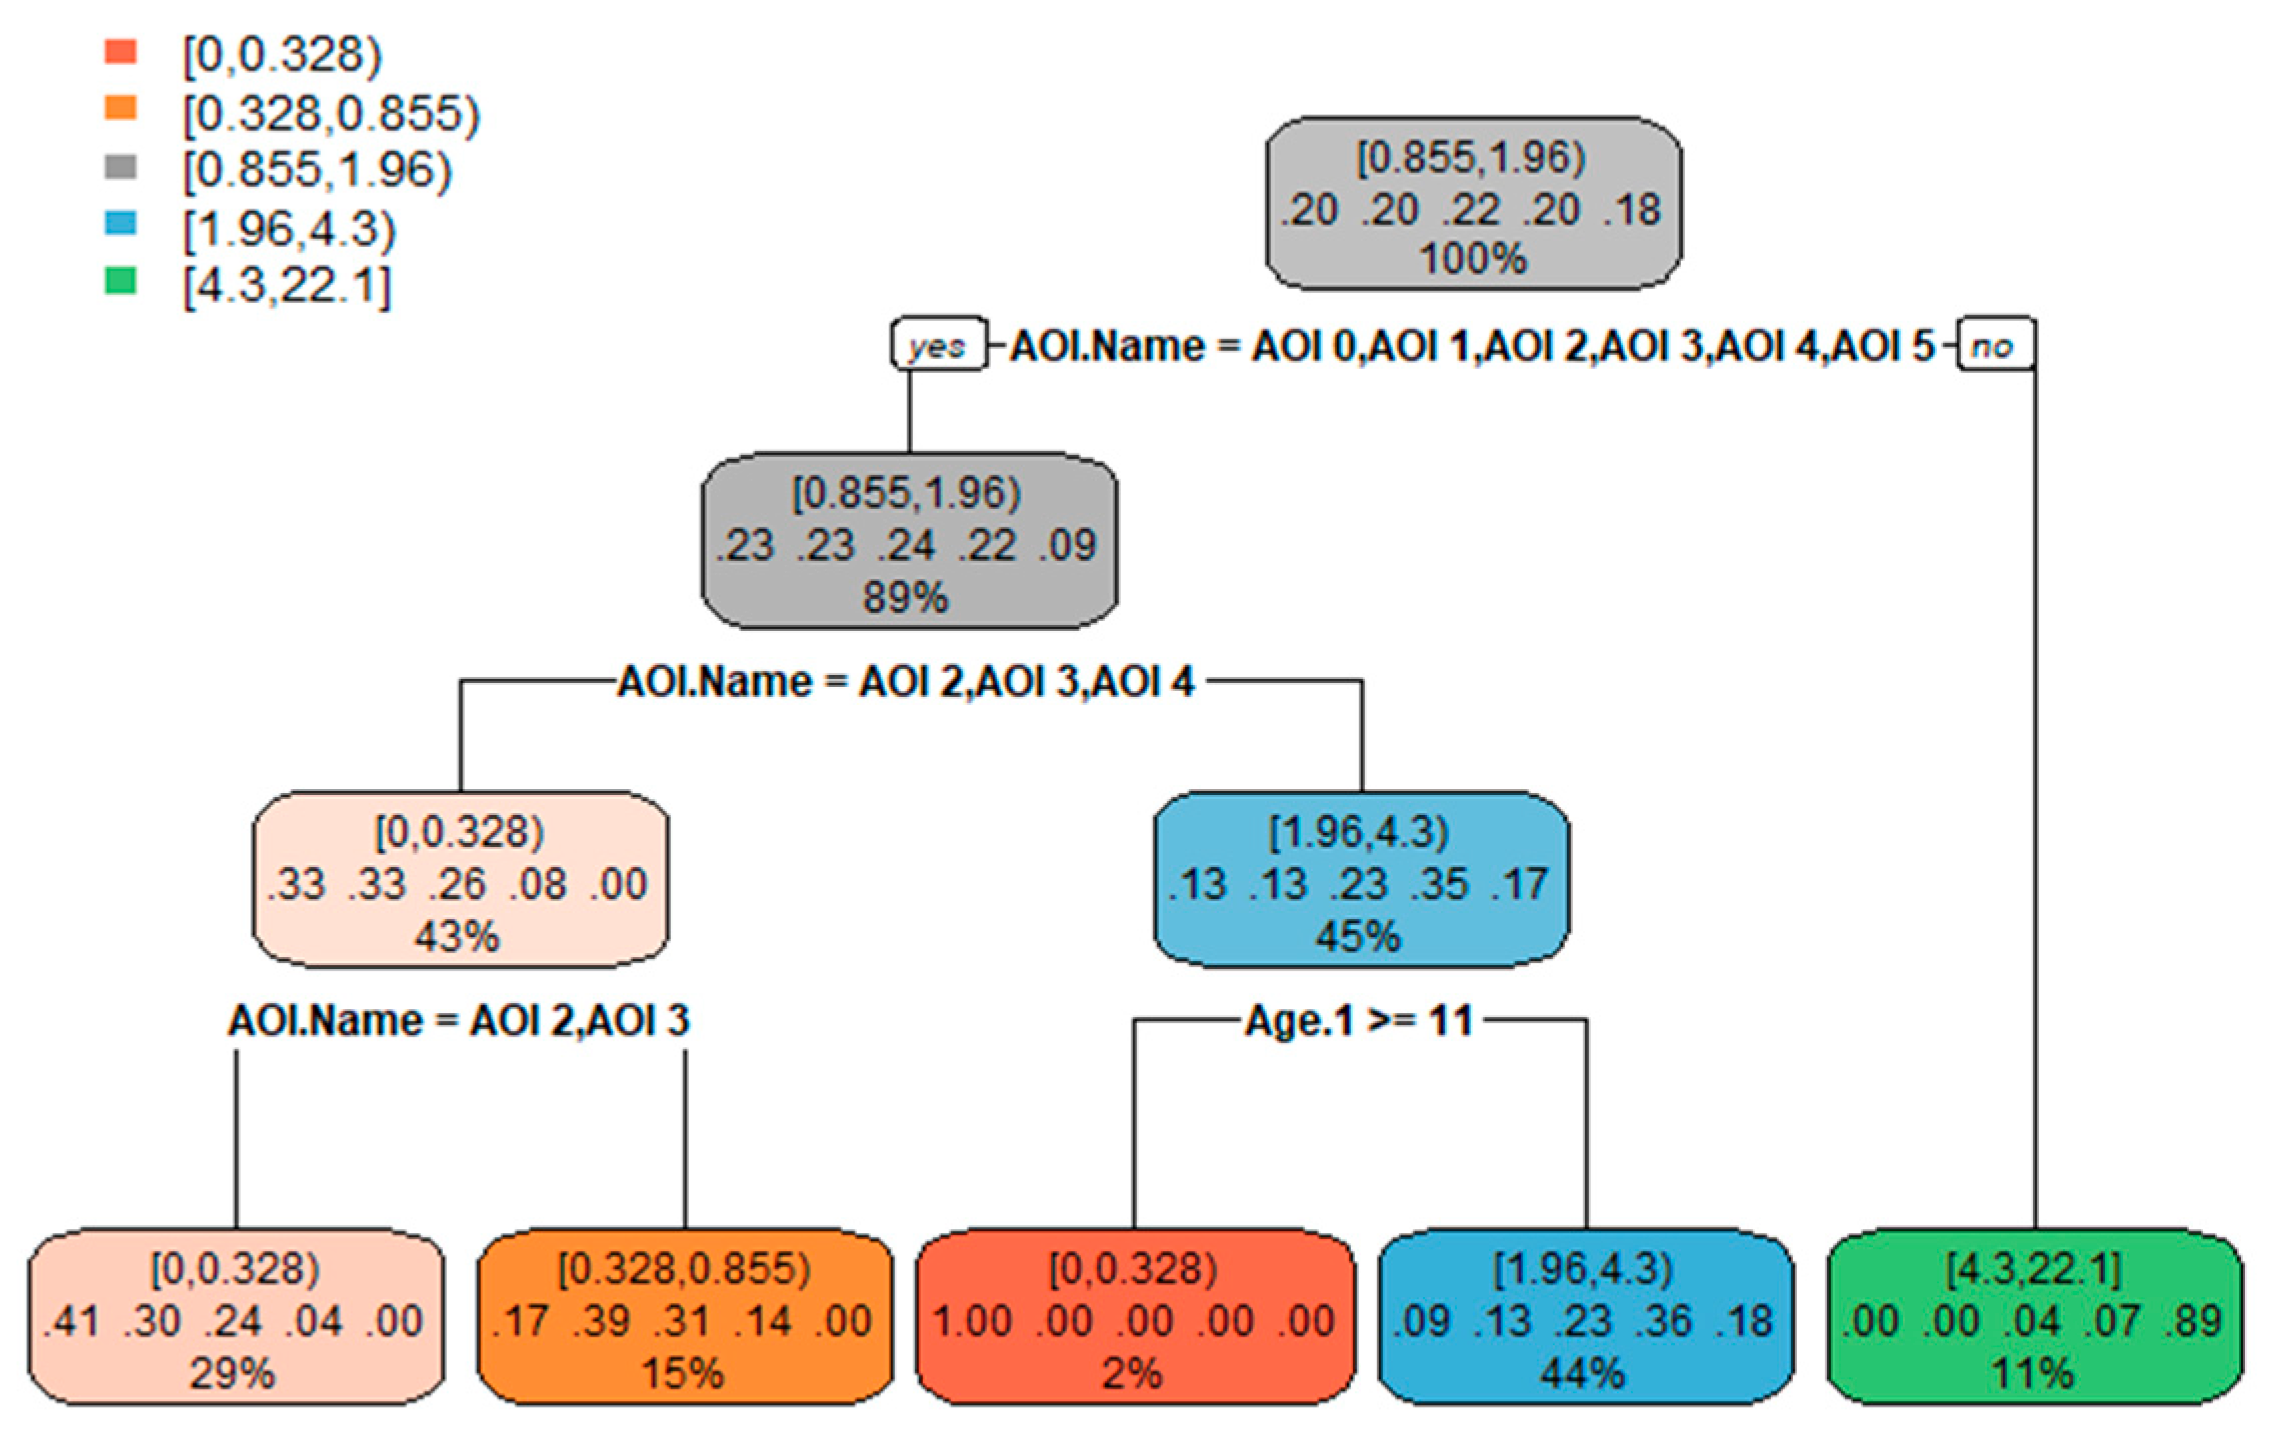
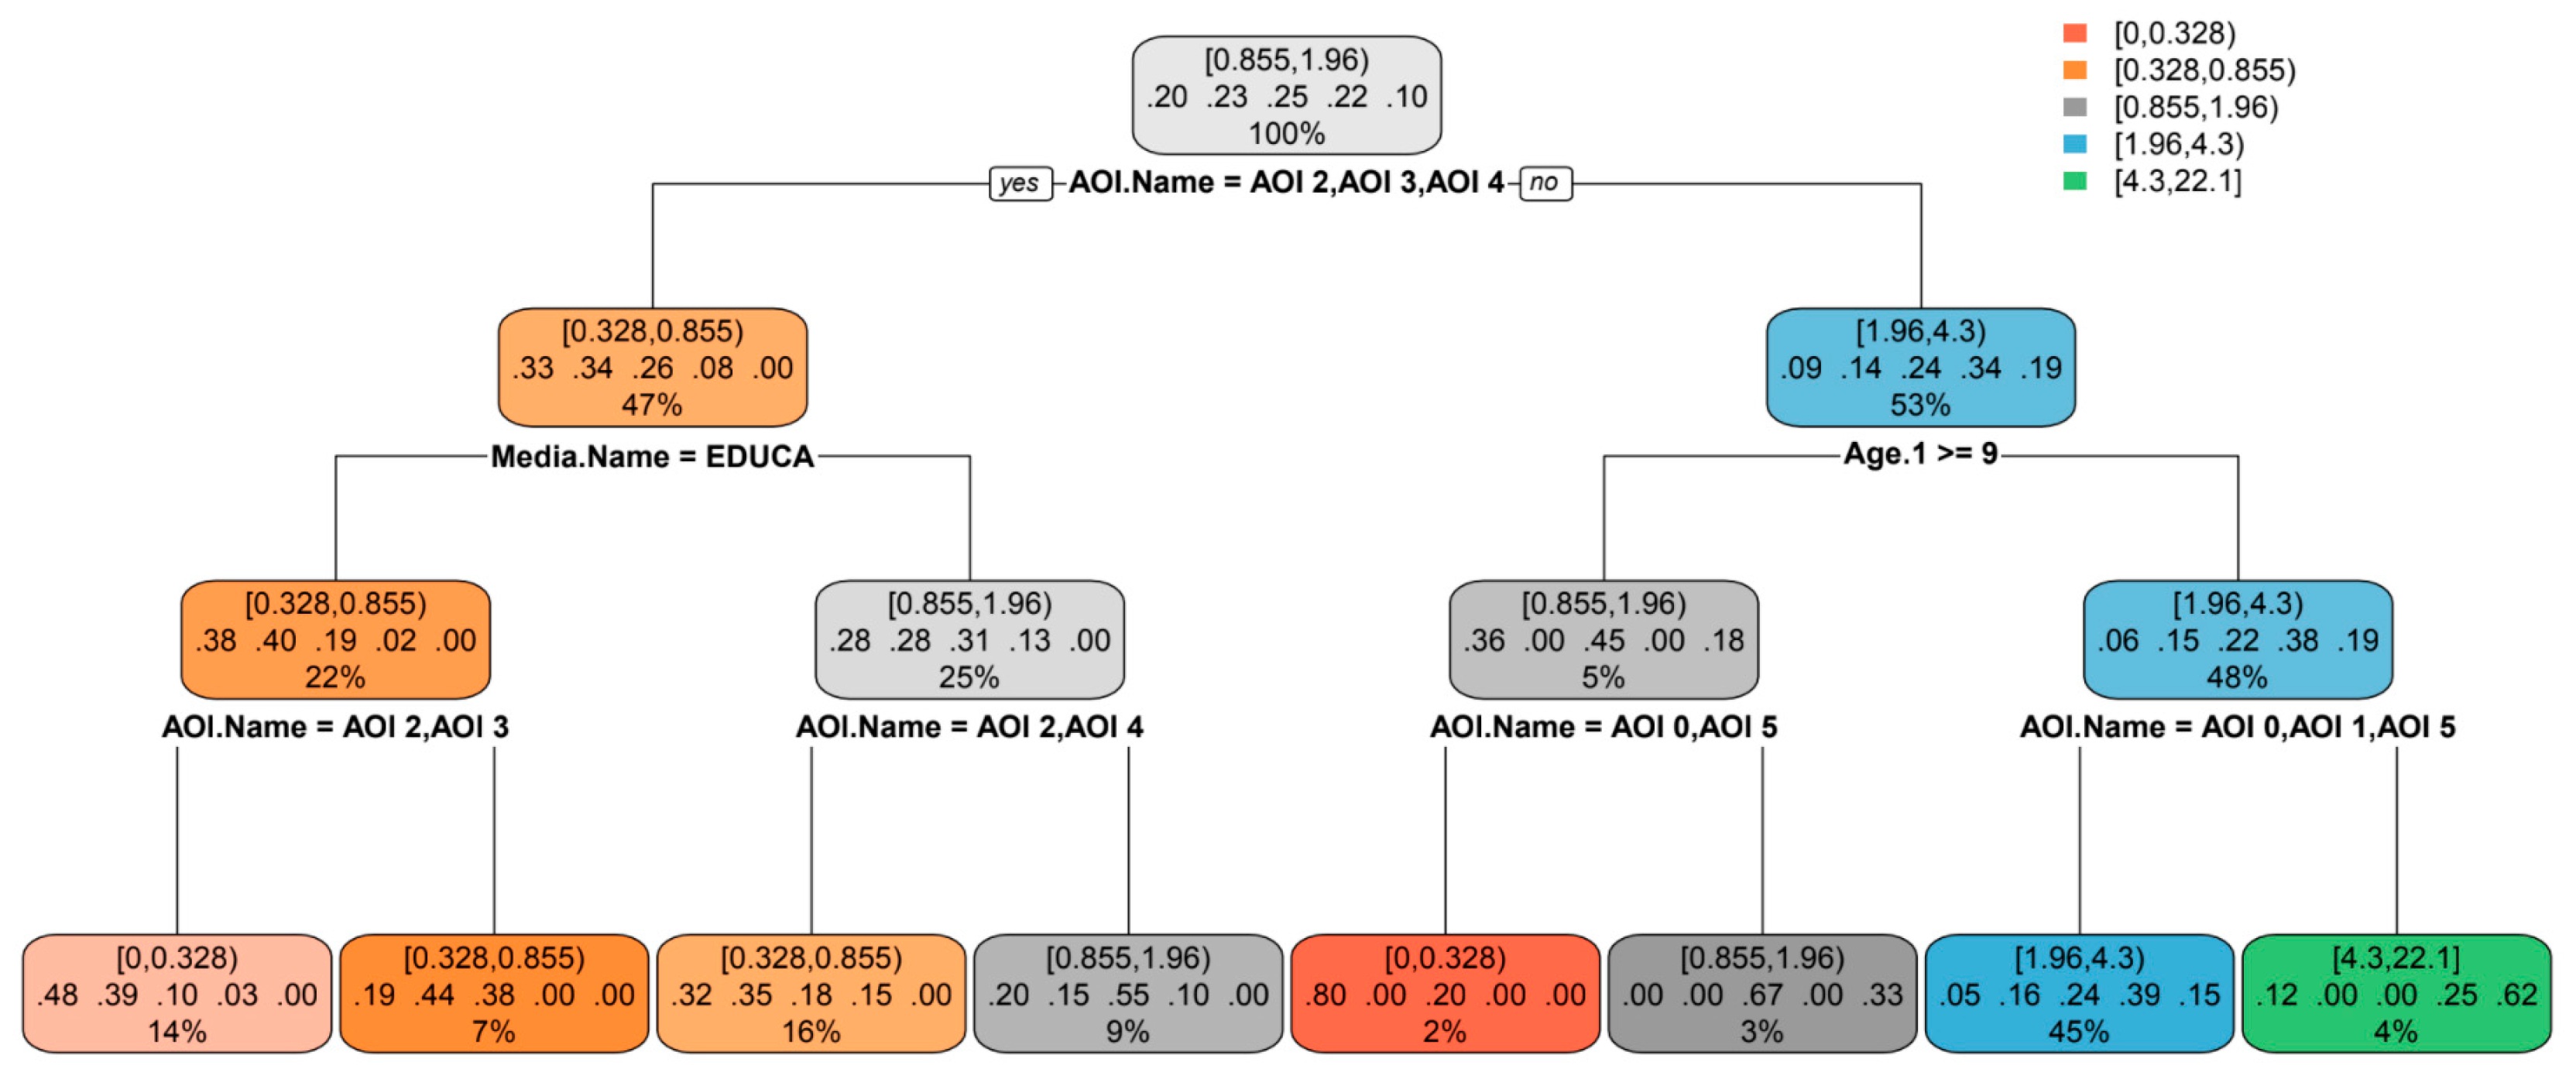
2.4. Generating Predictive Classification Models

There are different techniques for modeling or predicting categorical variables (variables that are either originally discrete in nature or are discretized). The most used technique is Classification Trees, where the main references are the ID3 algorithm (J. R. M. l. Quinlan 1986) and its different evolutions, such as C4.5 (J. R. Quinlan 2014), which incorporates a series of improvements, such as, for example, the possibility of dealing with numerical values among the explanatory variables. Another reference in the literature is the CART algorithm (Breiman et al. 1984), which is capable of carrying out both classification (on a categorical objective variable) and regression (on a numerical objective variable) tasks. In the case at hand, and after trying different classifiers, the authors have opted for RPart (an implementation of CART) from the R “rpart” library, which provides accurate predictive models and fairly easy interpretation.
Taking the Time Viewed objective variable as an example, and using the complete sample of the data, a tree has been obtained with an accuracy of 60.95% versus 54.84% of the model generated from the sample without outliers. In other words, the elimination of outliers does not improve precision, due to the small sample size.
Figure 14 shows that the relevant variable when predicting the viewing time of an area is the area itself, due to its very different natures and sizes. If the area is AOI 6, then the maximum possible time is displayed with the probability of 89%. If the area is AOI 0, AOI 1, or AOI 5, then, the viewing time depends on the age of the child. In the case that the child is 11 years old or older, the areas with the probability of 100% is not displayed. In the case that the child is less than 11 years old, the areas are displayed during an interval of 1.96 to 4.3 s.
Each node contains the following information: in the first row, the range of the target variable; in the second row, the probability of occurrence of each value of the objective variable (.41 means 41%); and the third row contains the total percentage of the sample that accumulates in that node.
Similarly, the decision tree using the sample can be interpreted, eliminating from it the outliers of the Time Viewed variable. In this case, it is observed that a new factor comes into play, which is the brand of the game and that the age of the child changes from 11 to 9 years of age, as shown in Figure 15 below.
The same analysis was carried out on the remaining target variables and an improvement in the prediction of the values of the Time to 1st View (sec) variable by 1% was obtained, using the sample without outliers. Again, it is verified that inclusion or not of the outliers does not cause great changes in the precision achieved.

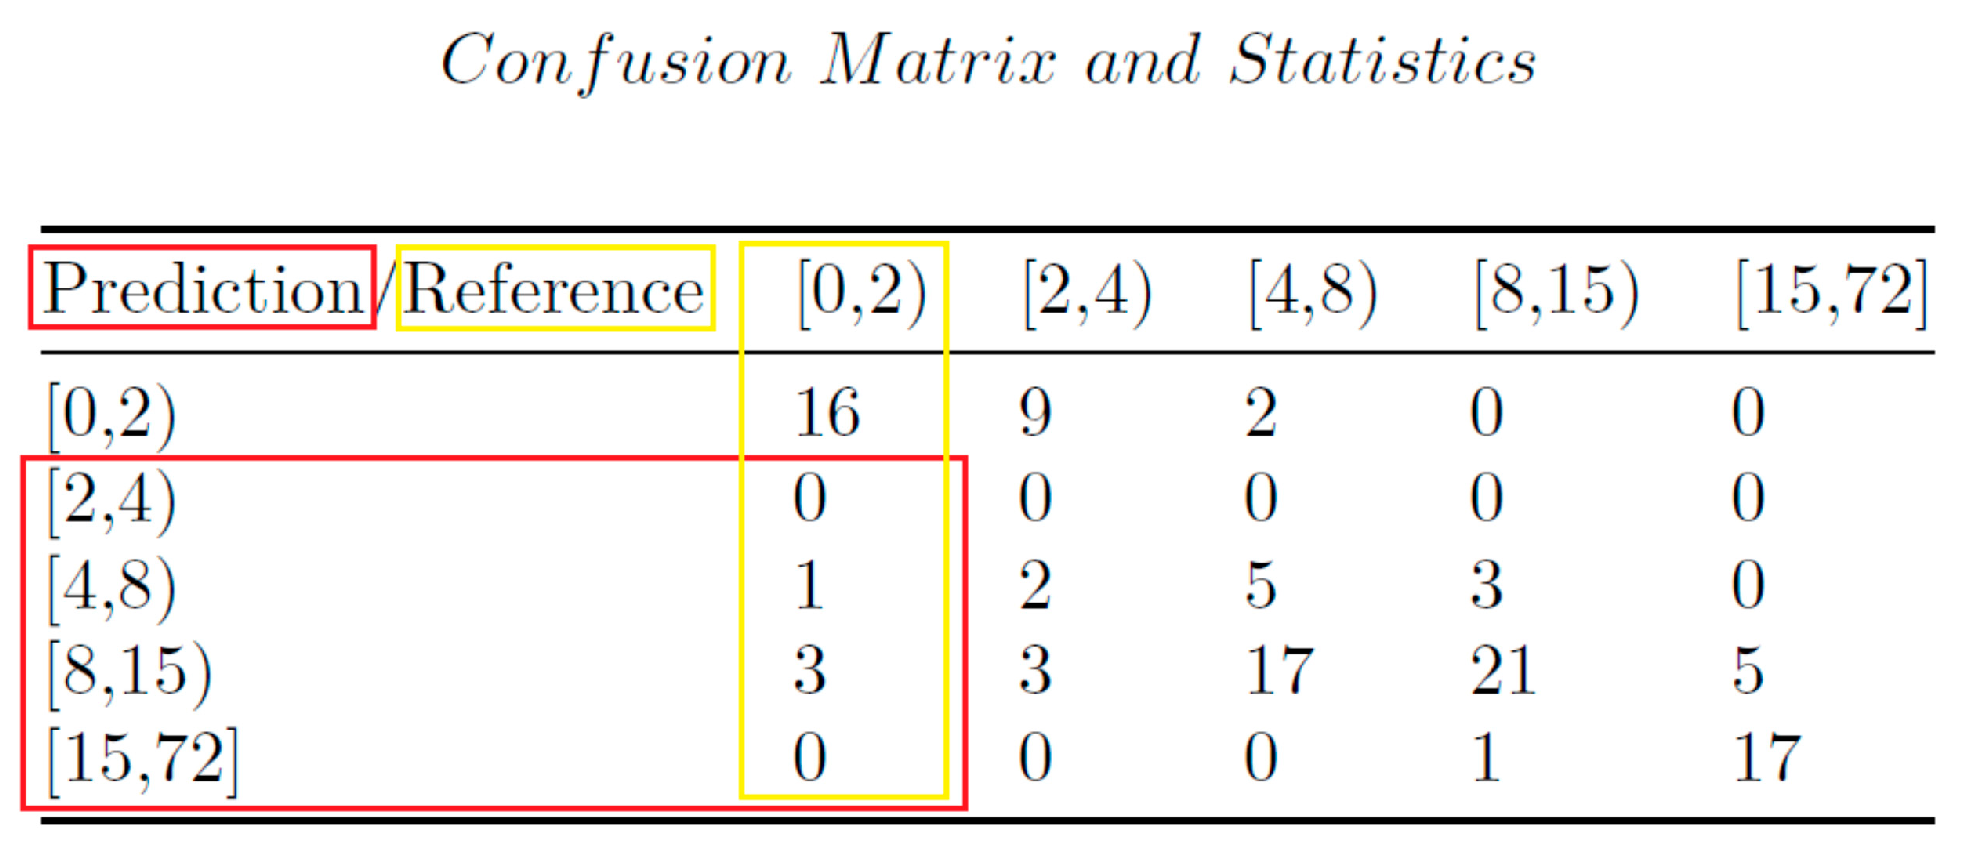
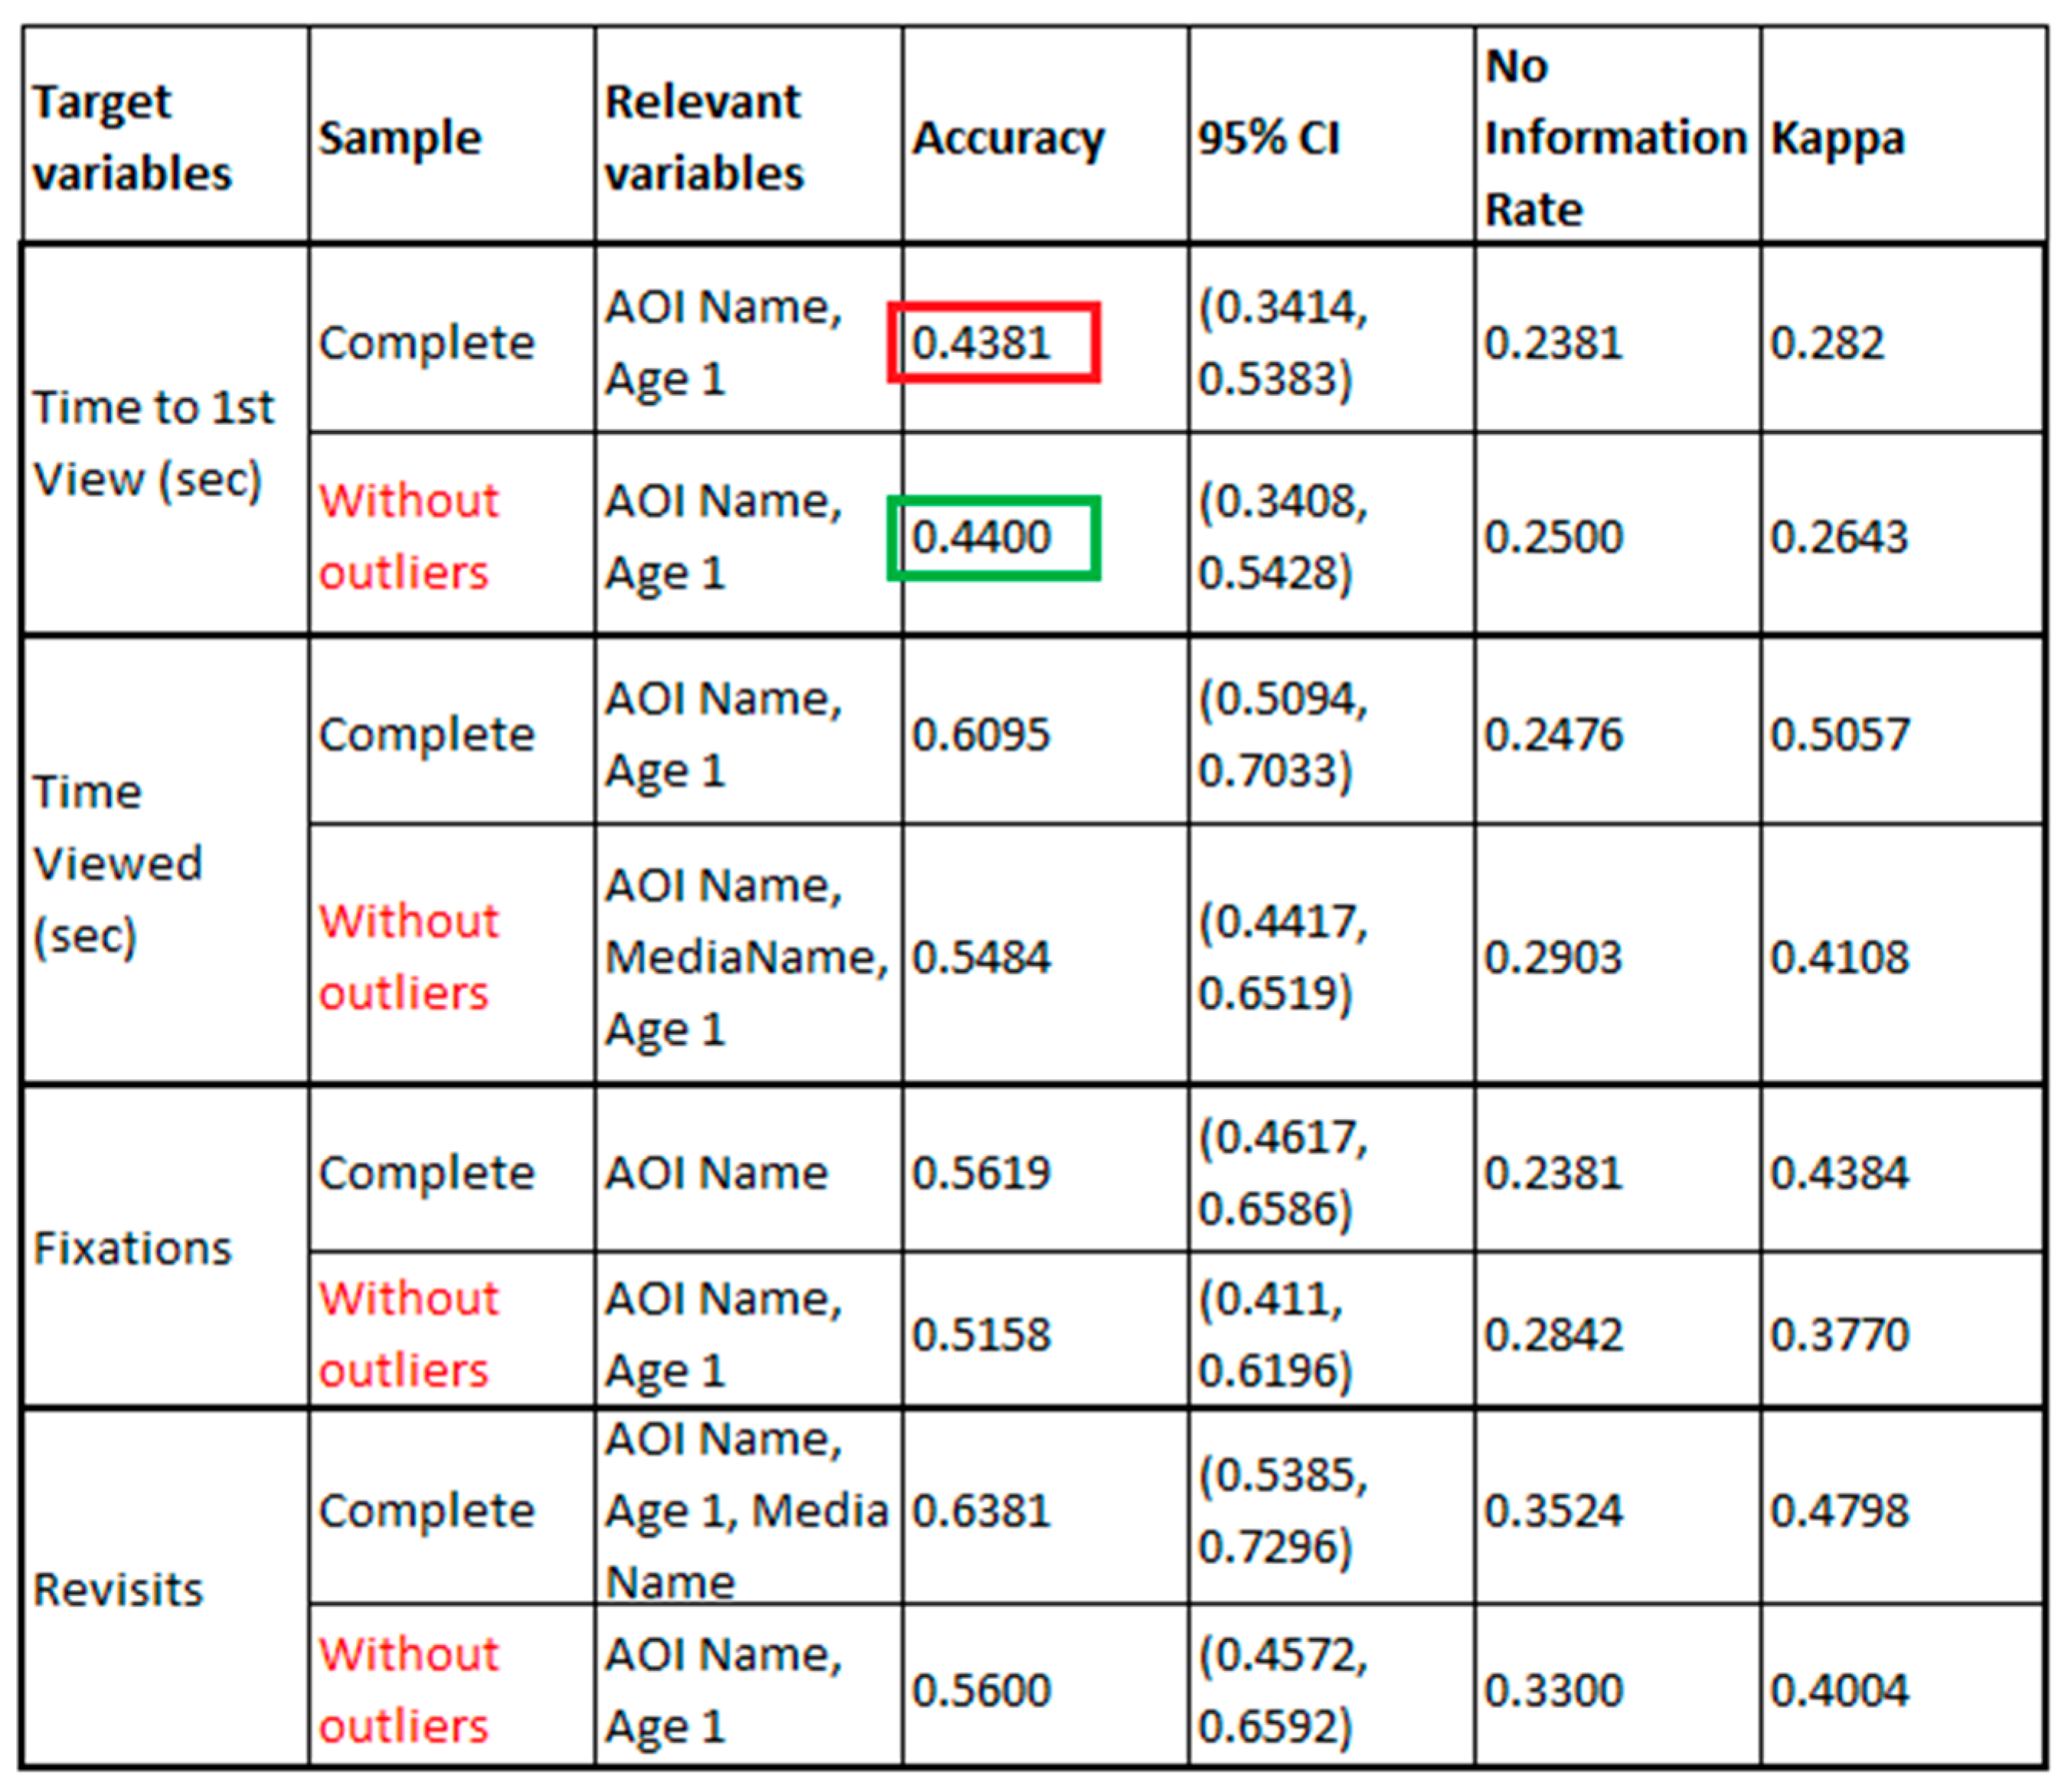
2.5. Comparison of Classification Models

The variables of interest that appear the most in each experiment are AOI (logically) and also Age 1 (the age of the oldest son). The ages of the other children are not relevant in any of the experiments. In addition, depending on the variable to be predicted, other explanatory variables could come into play, such as Media Name, which is relevant for predicting Time Viewed (without outliers) and Revisits (from full sample).
In general, the accuracies achieved in each model are high enough, taking into account that the target variables were discretized in several sections. This is reflected in the kappa index. However, considering outliers in the sample sometimes improves precision and sometimes does not. It follows that it is necessary to carry out both models (with and without outliers) in each case.
Of all the target variables in the problem, the one that can be predicted with greater precision is Revisits with an average precision close to 64%.
However, although accuracy is the one most frequently referred to, it is not the only metric of predictive models. In formal terms, accuracy is the percentage of correctly classified instances out of all instances and kappa or Cohen’s kappa is better thought of as classification accuracy, except that it is normalized at the baseline of random chance on the dataset. The confidence interval (95% CI) represents the precision segment in which there is a 95% probability of predicting correctly. Finally, information rate is the precision that can be achieved by always predicting the one with the highest probability type, or the interval in this case.
Furthermore, from a qualitative point of view, the models must be interpreted with their corresponding confusion matrices, which accumulate the well-classified instances on the diagonal and, outside of this, we can see how and where the errors of each predictive model accumulate.
Returning to the previous example of a prediction model for the fixations variable, the following confusion matrix is obtained (Figure 16). The cells on the diagonal of the matrix show the number of results that were classified correctly, while the cells that are outside the diagonal are those that were classified incorrectly.
The confusion matrix in the previous figure (Figure 16) shows that 11 instances of the interval [0.2] were correctly classified and the following were incorrectly classified (framed in red): 7 of the interval [0.2] as if they were of the interval [2.4]; 0 as [4.8], 1 as [8.15] and 1 as [15.72]. Thus, the diagonal represents the prediction success of each type, and outside the diagonal the corresponding prediction errors are represented. It can be seen that the largest error is made by predicting the interval from 4 to 8 s, when it is classified as the interval from 8 to 15. However, this interval is the one with the most errors and the least hits (16 instances classified incorrectly versus 5 correct ones).
Figure 17 shows a comparative summary of the results of the computational experiment carried out (results models for each target variable and for each type of sample collected).

3. Discussion

The first part of this study analyzes the intersection between consumer behaviour and packaging design for an educational toy (Svanes et al. 2010), analyzing the efficiency of actual packaging for two educational toys which are competence.
From the neuromarketing point of view, the application of biometrics (neuromarketing analysis) (Ohme et al. 2011), it is worth highlighting that Diset’s packaging stands out at the level of attraction and interest as compared with Educa, but with few significant differences, due to the similarity of the design. By gender, male consumers (33%) focus on the game itself (the template shown on the cover of the package) and the word “English” (game reference). Women also focus attention on the name of the game (from Diset) and the brand (Educa).
The packaging of the Educa game leads, in general, to the fixation on the image of the game (the template shown and the child’s hands), on the themes (shown graphically) and the recommended age. By gender, men also look at the number of questions, compared to women, who look at the game reference (“English”). The recommended age and theme are key in choosing an educational toy, in that order (Rundh 2009). This makes educational toys a concern for the development of the child, both their own, and those of family and friends. In general, the designs are similar and convey similar levels, but Diset’s seems more complete at the level of detail aimed at the child and Educa’s at a higher level of knowledge and focus on learning. The greater number of topics and questions in Diset leads the consumer to be willing to pay more, in addition to a higher quality perception (Velasco et al. 2014).
From the analytics and application of machine learning models (Vellido et al. 2012), the conclusions reached indicate that the classification models provide quite good precision (Alm et al. 2005) when predicting variables that, although being numerical in nature, the context of the problem suggests that they be treated by segments to facilitate strategic decision making in packaging (Calver 2004). In a relatively small sample, where the percentage of outliers does not exceed 10%, the inclusion or not of these for the generation of the predictive model, has a variable incidence, and therefore it is necessary to evaluate the possibility of including them or not in the study of each objective variable.
During the eye tracking experiment (Ungureanu et al. 2017), the set of variables (and their relative weights) that help to predict the target variables, can change significantly, depending on the target variable chosen in each case. Some of the experiment times can be predicted more accurately than others.
The need to evaluate the inclusion or not of outliers (John 1995), the convenience of discretizing the numerical variables in order to obtain classification models from which to make decisions, together with the fact that the relative weights of the explanatory variables cannot be established a priori for each objective variable, confirm that the data-driven approach is perfectly suited to predictive neuromarketing contexts where the samples have a high dispersion in their values, depending on each specific sample to be analysed.
This methodology could be extrapolated to other types of products (with an emotional component, to apply neuromarketing biometrics) and even to other types of activities.

4. Materials and Methods

The aim of this research was to determine, through neuromarketing techniques, the cognitive perception that Spanish parents, between 35 and 45 years old, with children between 4 and 8 years old, have regarding the elements contemplated in the design of toy packaging that is educational and age appropriate for your children. To do this, we used neuromarketing techniques that allowed us to analyse the attention of the subjects to the stimuli (eye tracking). Additionally, the data extracted from these experiments was studied using new analytical models based on machine learning techniques, capable of adapting to the context and establishing behavioural patterns that allowed the researcher to more efficiently identify the key aspects, because not all variables in the eye tracking experiment intervene with the same importance in the different target variables, helping to make decisions in the design of packaging toys.

4.1. Objectives

This research work aimed to help answer the question of which aspects are more relevant for consumers in purchasing educational toys, which will obviously be quite different from products more focused simply on leisure. This empirical research focused on an educational toy distributed in Spain by Educa brand (Conector family, reference “I learn English”), which was the brand’s best seller in this market area, and analysed how consumers made decisions regarding their choice in relation to other products designed by competitors. The study looked at customer reactions when looking at the products, generated by different aspects of product design and its influence on choice.
The main objective of the research was to analyse the attention of parents towards the projection of images of the packaging of educational toys aimed at children between 4 and 8 years old, and proposed a methodology to predict which area of an advertisement was going to be observed in the first instance and which areas were never the focus of attention of potential customers. The methodology fully analysed and segmented these areas, according to social circumstance and which family member was observing.
The specific objectives are as follows:
  • Analyze the attention generated by the different elements of the packaging of an educational toy (comparison with 2 similar products of competing brands) between parents;
  • Analyze and segment the areas, according to social circumstance and which family member is observing;
  • Determine what differences there are between parents, according to gender;
  • Analyze the attention of the different elements generated in the parents, according to the purchase intention.

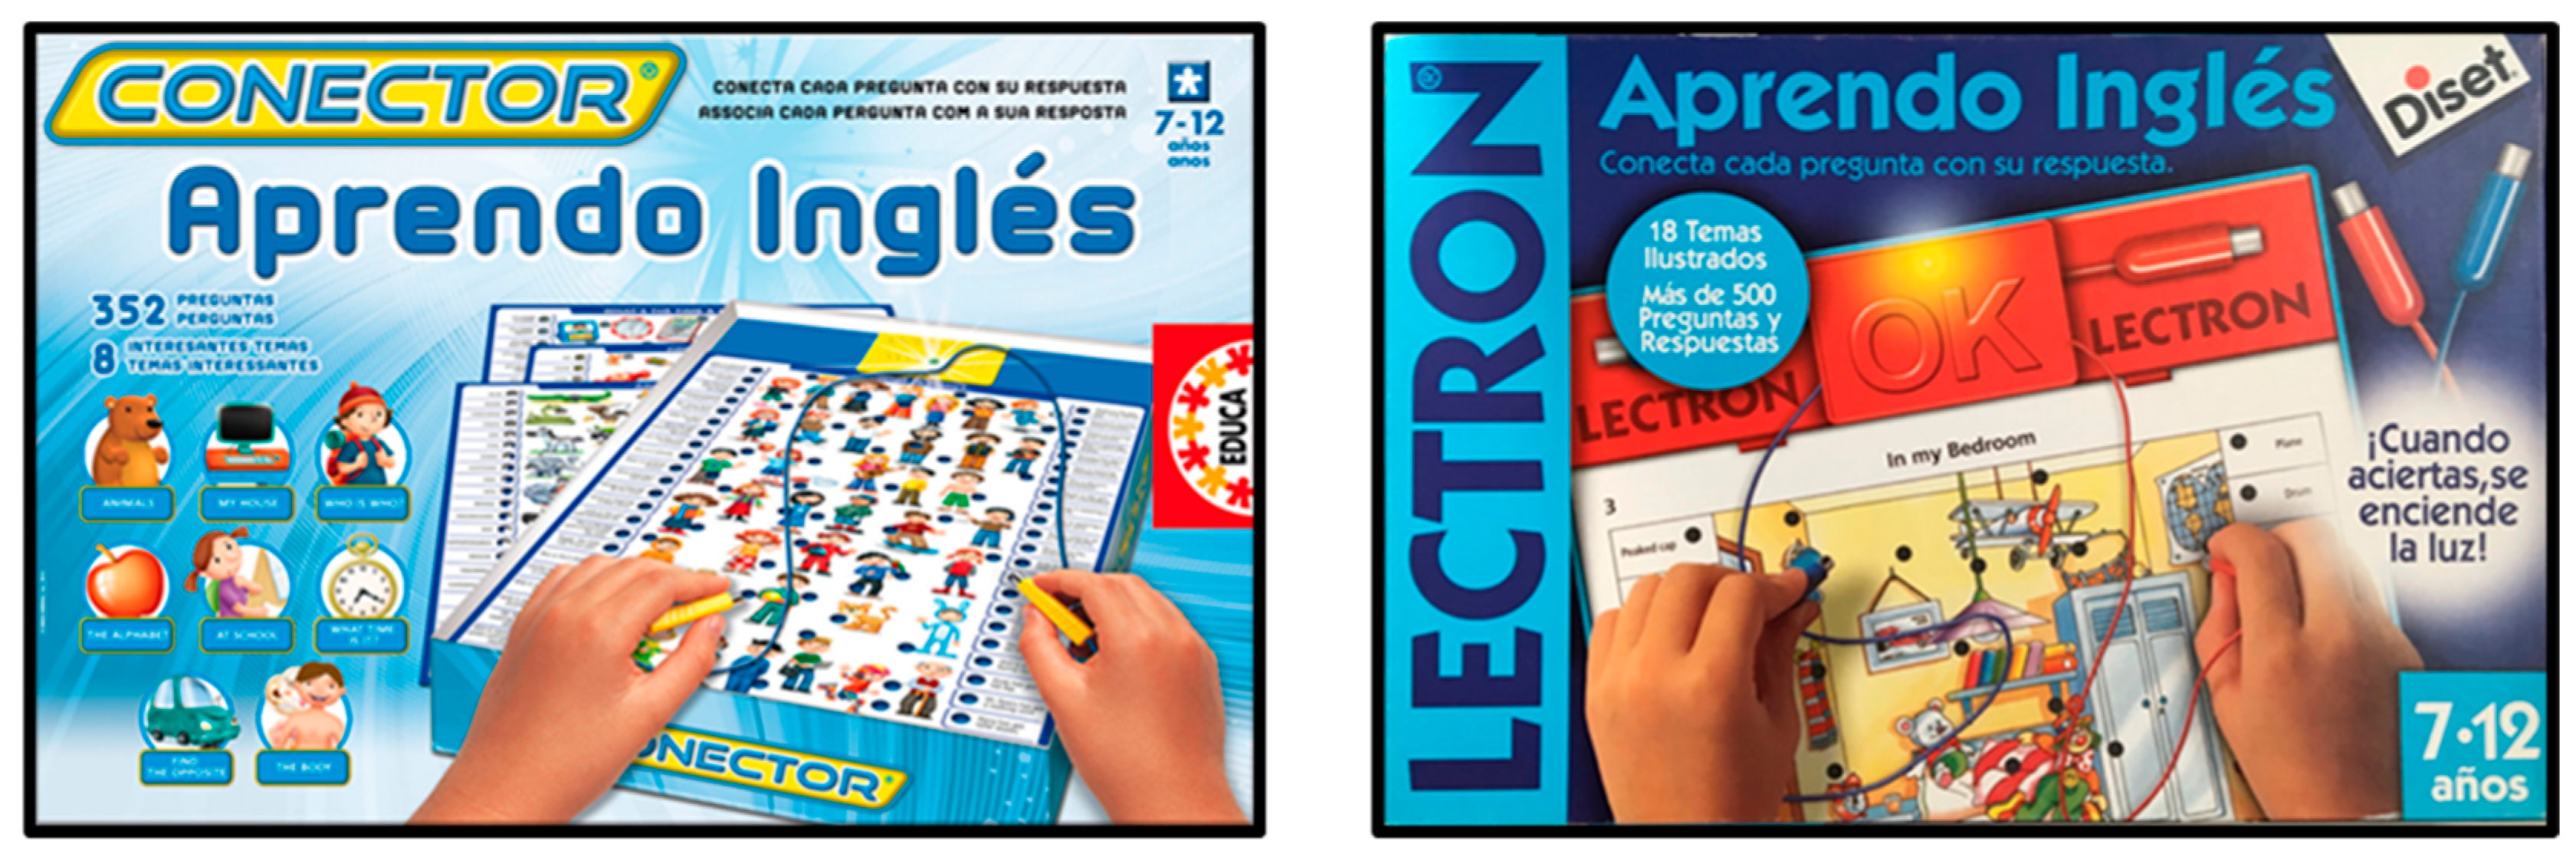
4.2. Research Instrument

Advances in neuroscience applied to traditional marketing have allowed the creation of a new discipline (neuromarketing) based on a deeper understanding of human behaviour as a consumer. Reimann (Reimann et al. 2011) formally defined consumer neuroscience as the study of neural conditions and the processes underlying consumption, their psychological significance, and their consequences for behaviour. As a result of combining neuroscience with marketing, neuromarketing emerges as a relatively new research discipline. Leveraging advances in technology, this new field goes beyond traditional quantitative and qualitative research tools and focuses on consumers’ brain reactions to marketing stimuli.
Ariely (Ariely and Berns 2010) stated that the main objective of marketing was to help link products and people. Neuromarketing research aims to connect activity in the neural system with consumer behaviour, and has a wide variety of applications for brands, products, packaging, advertising, and marketing, such that retailers are able to determine the intention to buy, the level of novelty, and awareness or triggered emotions. Butler (Butler 2008) proposed a neuromarketing research model which interconnected marketing researchers, practitioners, and other stakeholders, and stated that more research was needed to establish its academic relevance.
It is possible to consider that neuromarketing is the conjunction of neuroscience and marketing, with the aim of evaluating the conscious and unconscious mental states of consumers. This in turn allows marketing strategies to be designed which are more guaranteed to succeed, since these are addressed from a real and deep knowledge of how different stimuli act on the brain and how they influence behaviour and decision making.
Consequently, neuromarketing is the marketing of the 21st century. Marketing concepts have not become obsolete, but rather that we have to work with the concepts that both disciplines provide in a holistic way and learn to apply them according to the context, objectives, and market strategies proposed.
According to classic assumption, consumers in their decision-making process consider all the possible alternatives in the market and select the one that maximizes «marginal profit». This assumption is no longer valid, according to Daniel Kahneman (Kahneman 2002), psychologist and Nobel Prize winner in Economics in 2002. Neurosciences have shown that 97% of our decisions are unconscious.
According to ESOMAR (ESOMAR 2017), International Association for Market Research and Opinion Studies, and Innerscope (Innerscope 2017), the 10 most used techniques in market research from neuroscience can be classified into the following 3 categories:
Psychometric IAT (Implicit Association Tests);
Biometrics FACS (facial coding), ET (eye tracking), HR (heartbeat), EDA-SCR or GSR (galvanic skin response), respiration patterns (motion, respiratory rate, and (VPA) voice pitch analyses);
Neurometric EEG/SST (electroencephalography/steady state tomography) and fMRI (functional magnetic resonance imaging).
These technologies developed from neuroscience are known under the name of psychometric, biometric, or neurometric tools depending on the applied technology. They allow the unconscious processes of the consumer’s mind to be identified and measured through the development of experiments (mostly in the laboratory).
Regarding the different “approaches” to tackle complex analytical problems, for some time now, the scientific community has openly opted for the “data-driven” approach, which generates predictive models, solely from the data itself. This approach is fundamentally different from the model-driven approach, which is based on mathematical, physical, or economic equations that explain and define in advance the behaviour of the system. The data-driven approach has proven particularly well suited to be integrated into decision support systems (DSS) (Provost and Fawcett 2013).
Furthermore, regarding the case study presented in this paper, the industrial field is a clear example of how the data-driven approach offers (by itself, or in combination with model-driven techniques) ideal solutions to analytical problems in any of the aspects of industrial processes, and is able to find data-based solutions for problems as different as anticipating mechanical (Li et al. 2019) or electronic (Li et al. 2019) failures in production, in simulation processes for remanufacturing (Goodall et al. 2019), in complex assembly tasks in automobile plants (Wang et al. 2011), or even to predict retailer/wholesaler behaviour (Radac and Precup 2015).
In neuromarketing, the true importance of data analysis using brain metrics (EEGs) has already been confirmed in (Hakim and Levy 2019). The literature offers examples of very different analytical techniques. It is common to find classical statistical techniques such as component analysis from ANOVA for the prediction of consumption preferences (Goto et al. 2019), or the use of Naive Bayes to predict the acquisition of products (Taqwa et al. 2015). Since 2016, it has become increasingly frequent that studies on EEG data on neuromarketing (in general) and on advertisement scoring (in particular) have begun to incorporate predictive machine learning techniques, such as SVM in combination with random forest classifiers (Libert and Van Hulle 2019), C4.5 classifier together with ANN (Morillo et al. 2016) or SVM (Wei et al. 2018).
Regarding the data from eye tracking experiments, there are a range of studies (Stark et al. 1962) that have shown the importance of being able to predict where and how the human eye will focus attention. From 2016, the literature offers some examples where the use of predictive machine learning techniques is verified, such as the case of ANN together with time series analysis on patterns in online advertisements or the use of hidden Markov models on AOIs in cases of prediction of attention in augmented reality contexts (Pierdicca et al. 2018).
Big data has revolutionized decision making in many fields. The handling of a large amount of data, to analyze certain behaviours, is improving processes (Marín-Marín et al. 2019). Big-data analytics is gaining substantial attention, due to its contribution to the business strategy determination process and providing valuable information for the design and development of service innovation (Thuethongchai et al. 2020). Technology has allowed online sellers to make real-time price changes of high magnitude and proximity (Victor et al. 2018).
The incorporation of information and communication technologies to education allows us to collect information on the teaching and learning process (Ruiz-Palmero et al. 2020), showing the importance of being able to forecast consumer trends, and then present an evaluation of prognosis (Silva et al. 2019).
This article addresses the application of machine learning techniques in the eye tracking field, where there is a very high dispersion of data, produced by the heterogeneity of the users under study, with apparently arbitrary behaviour, which is difficult to predict. This leads to specific preprocessing of the experimental data, before applying discrete predictive techniques with greater tolerance to prediction error. Using confusion matrices, it is possible to measure where the hits and misses of our predictive model converge.

4.3. Sample

In the present research, the sample consisted of men and women, according to the indications of the manufacturer Educa, from current consumer data. A total of 30 people (33% men and 66% women) participated randomly and voluntarily as study subjects after meeting the requirements of being parents, aged between 35 and 45 with children of ages between 4 and 8 years old. Alicante (Spain) was chosen for the sample due to its status as a provincial capital. The sample size (consisting of 10 men and 20 women) was adequate for a neuromarketing study (Cuesta-Cambra et al. 2017; Juarez et al. 2020; Mañas-Viniegra et al. 2020; Mengual-Recuerda et al. 2020). After carrying out the empirical study, 5 users (all belonging to the female gender) were discarded, leaving 25 users (10 men and 15 women). The sample size was sufficient to be able to proceed to the study due to its representativeness, with unbiased and accurate standard errors (Maas and Hox 2005).

4.4. Data Collection and Analysis
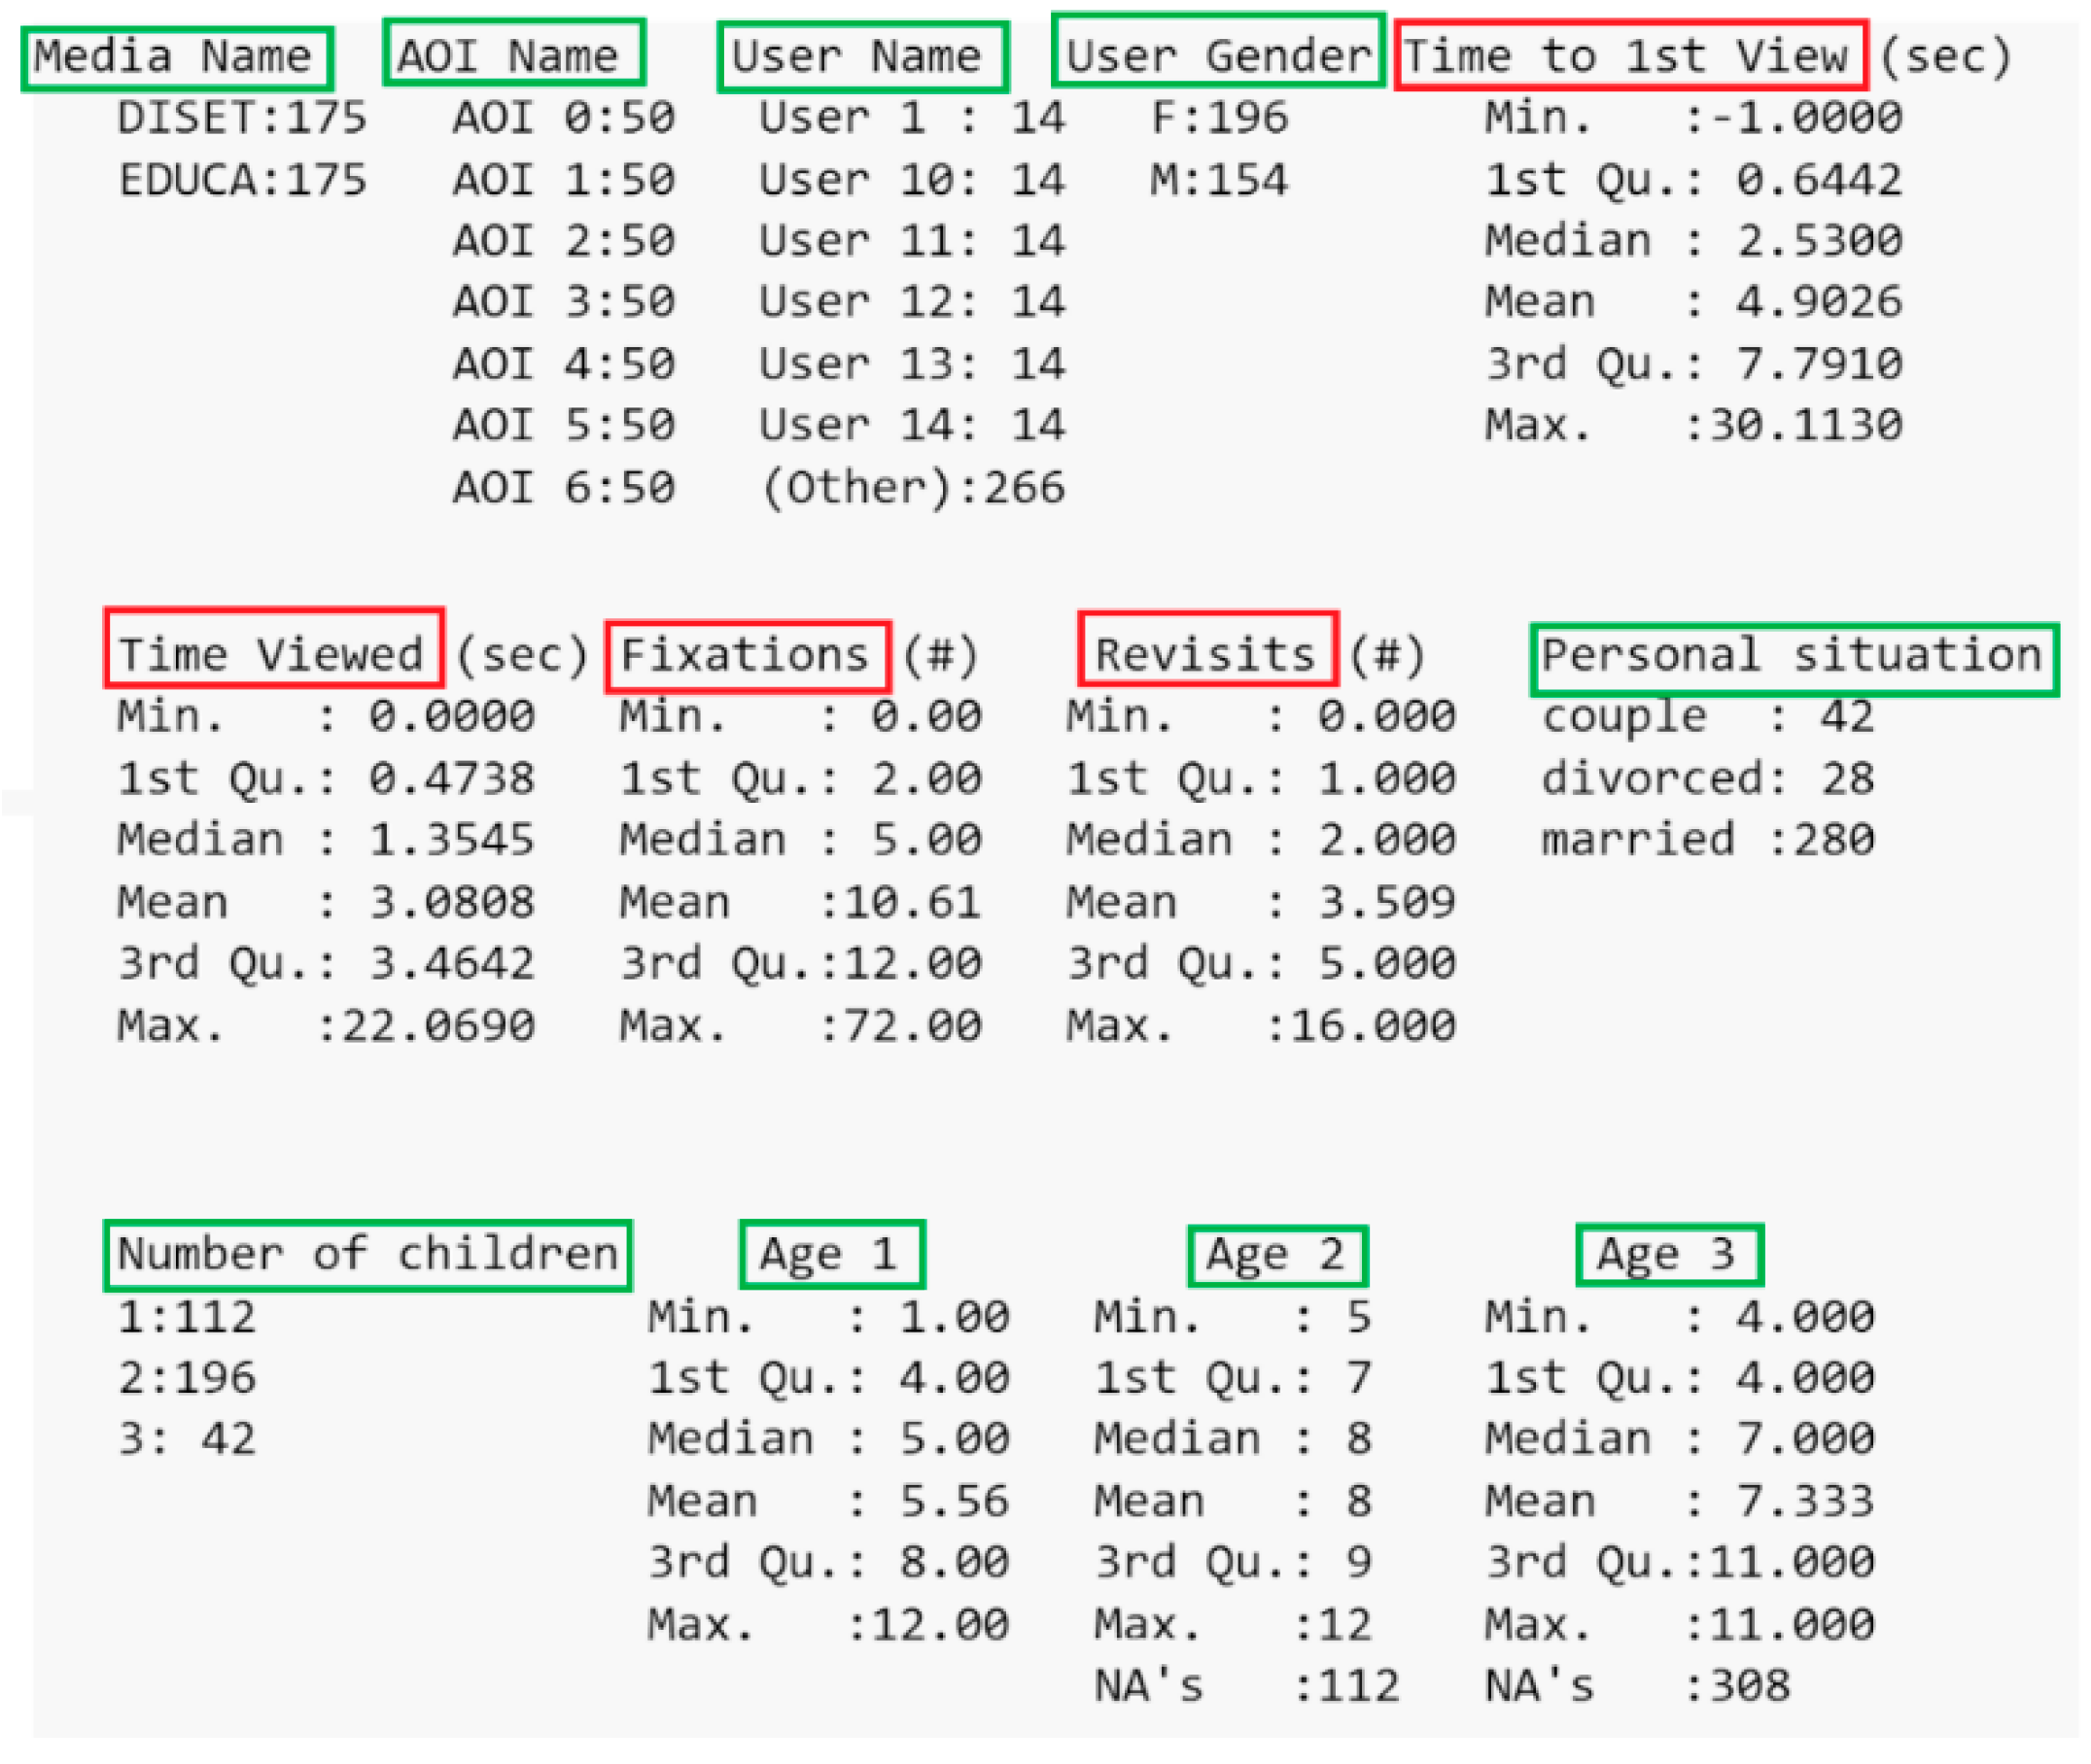
The research phase with packaging was performed using the eye tracker model Gazepoint GP3HD, with a 150 Hz sampling rate. For data collection, Gazepoint Analysis UX Edition v.5.3.0 software was used.
The statistical analysis of the data was performed with the R software, v.3.6.3. The common elements (stimuli) between both packages were defined (Figure 18). Subjects were exposed to 2 packages containing 7 stimuli each, comparable to each other. The stimulus 02 of each brand is free (not equivalent). Each package had a maximum time limit of 30 s, with 3 s of separation between stimuli, to prioritize the areas of interest that captured the most attention (Añaños-Carrasco 2015).

4.5. Dataset

This study begins with two data sources. The first is the data obtained in eye tracking and consists of 350 records and the following 16 columns (variables): Media ID, Media Name, Media Duration (sec—U = UserControlled), AOI ID, AOI Name, AOI Start, AOI Duration (sec—U = UserControlled), User ID, User Name, User Gender, User Age, Time to 1st View (sec), Time Viewed (sec), Time Viewed (%), Fixations (#) and Revisits (#).
The second data source refers to the users who participated in the study and consists of 25 records and 8 columns that show their social situation (sex, personal situation, number of children, age, etc.).
These tables were cross-referenced in order to explain the data obtained by eye tracking, together with the characteristics of each individual.
After eliminating the redundant, empty, and repeated variables, and after assigning a suitable format to the remainder, a dataset of 13 columns and 350 rows was obtained.
In the Figure 19 we can see the result of the reduction of columns (the type of each variable and its basic descriptive statistics.
Subsequently, an exhaustive study was carried out on this data, in which it was important to look at the distribution of the following variables that we were interested in predicting (target or class variables, framed in red): Time to 1st View (sec), Time Viewed (sec), Fixations (#), Revisits (#) and their behaviour according to the antecedent or explanatory variables (framed in green): Media Name, AOI Name, User Name, User Gender, Personal situation, Number of children, Age 1, Age 2, Age 3.

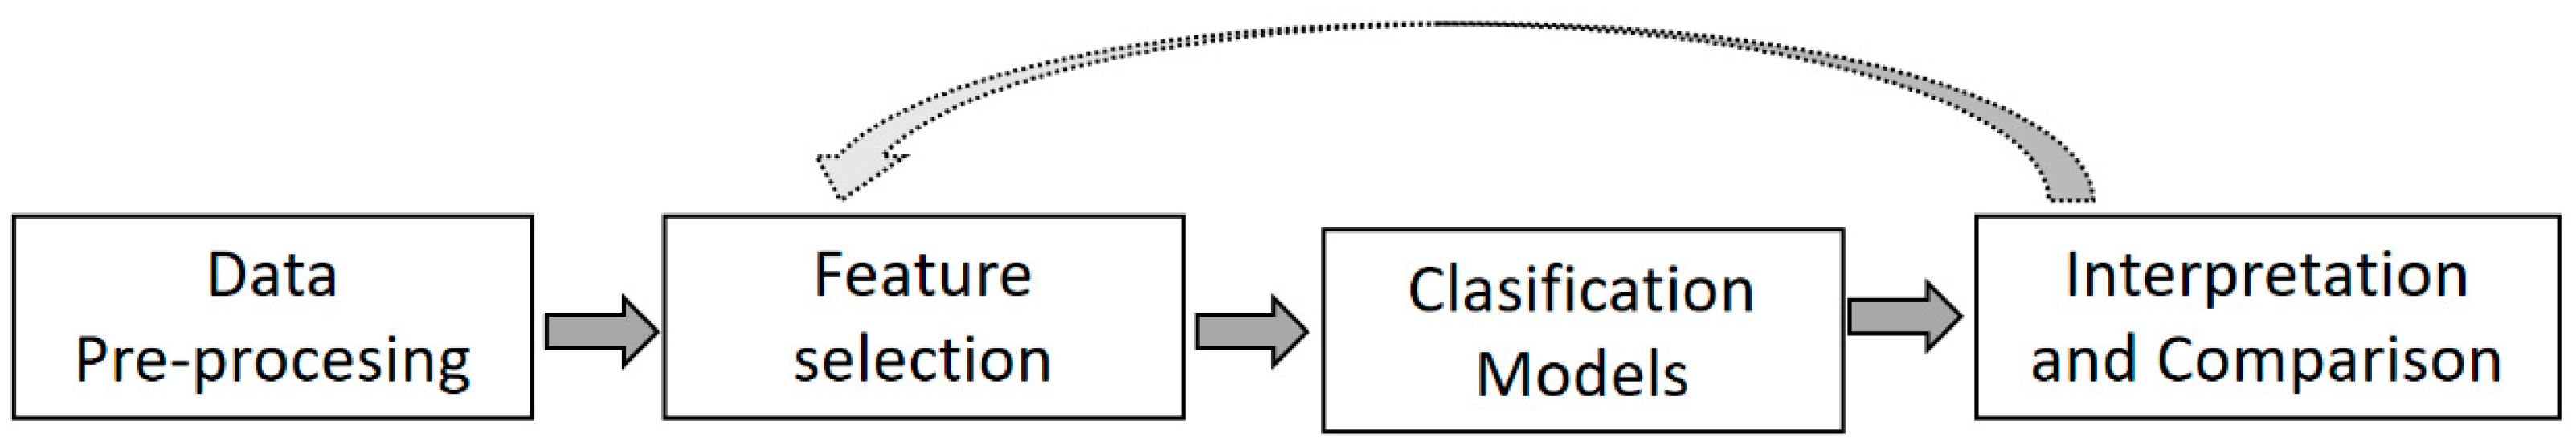
4.6. Analysis Methodology

The data collected by observations on 25 users were subjected to preprocessing, detecting anomalous values (outliers), which allowed different subsamples of data to be generated based on their distributions. The original sample and each of the subsamples was subjected to the same process, which consisted of the following:
  • selection of the target variable (variable to be predicted);
  • detection of the most relevant variables on the chosen target variable;
  • generation of predictive models for classifying the target variable with the most influential variables in each case.
The different predictive models were compared with each other, in order to conclude which variables were the ones that best predicted certain objectives and what degree of precision could be obtained in predicting one or the other.
In the field of classification problems (predictions of discrete variables), the data science methodology is often based on CRISP-DM model (Chapman and Clinton 1999), that includes preprocessing phases (for cleaning and suitability of the dataset), selection of the most relevant attributes (for the construction of the model), and generation of classification models (with their corresponding details). After evaluating the models, it is common to allow a return to the attribute selection phase. This scheme has been applied in several studies, with slight variations (Liu and Han 2002; Rabasa and Heavin 2020), An outline of such a methodology, assumed on this paper, is shown in Figure 20.
Figure 21 shows such a general methodology adapted to this specific problem.
Due to the breadth of the study, motivated by the existence of multiple objective variables to be modeled, and the great variety of descriptive statistics on the explanatory variables, the article focused on the most significant cases of each stage, leaving all the others appropriately described in the Appendix A, before the References section.

5. Conclusions

This study has revealed the packaging design most observed aspects in the consumption of educational toys, the perception of the value of the brand and product through packaging, and the projection on the children’s entertainment based on packaging design. It has also allowed the authors to compare the perception/coding of each container by men and women, identify the level of visual attraction (time spent) towards the product and the brand, and the levels of educational value of each container, perceived by the customer objective (Enax et al. 2015). The application of machine learning models provides a tight approximation in the prediction of the variables and, even though they are numerical in nature, the context of the problem suggests that they be treated using segments to facilitate strategic decision making in the design of the packaging.
This research has contributed to the change taking place in the scientific literature on the design of educational toy packaging and the models used to analyze consumer behaviour (Enax et al. 2015), based on the data extracted from the neuromarketing analysis. The recommendations drawn from research on the design of educational toy packaging aim to improve graphically those elements that really attract consumer attention. The analysis draws several conclusions that would help improve the perception of the toy. The need to evaluate the inclusion or not of outliers (Hawkins 1980), the convenience of discretizing the numerical variables in order to obtain classification models from which to make decisions, together with the fact that the relative weights of the explanatory variables cannot be established a priori for each objective variable, confirms that the data-driven approach is perfectly suited to predictive neuromarketing contexts where the samples have a high dispersion in their values, depending on each specific sample to be analyzed. It is important to focus attention and explain the skills improved by the child’s play, the age at which it is recommended to use, and eliminate the remaining texts used.
Finally, this study revealed that the knowledge of consumers’ conscious and unconscious mental states allows the packaging design of educational toys to be much more efficient. By taking into account that consumer habits change, organizations must design proposals for each contact they make with their consumers, through all the aspects that accompany the brand, to achieve a greater perception of these creative products.
From the data science approach, the proposed methodology (originally based on CRISP-DM) has been successfully adapted to the specific problem of user’s preferences classification on a short life data sample. The classification techniques are absolutely dependent on the numeric target variables discretization (on the preprocessing phase), and therefore this process must be specially adjusted in every case.
As supervised learning methods are involved, classification techniques such as the one proposed in this research achieve better precision ratios with larger training samples. In this sense, the authors have begun to launch other neuromarketing experiments in haute cuisine presentation, footwear packaging (and store decoration), food distribution in supermarkets, and football team store decoration, where the experiments report perfectly analyzable samples with slight adaptations of this data science methodology.

Author Contributions

Conceptualization, D.J.-V. and A.R.-D.; methodology, V.T.-V.; software, D.J.-V., A.R.-D. and K.P.; validation, D.J.-V., V.T.-V. and A.R.-D.; formal analysis, D.J.-V. and K.P.; investigation, D.J.-V.; resources, D.J.-V.; data curation, A.R.-D. and K.P.; writing—original draft preparation, D.J.-V. and A.R.-D.; writing—review and editing, V.T.-V. and D.J.-V.; visualization, D.J.-V.; supervision, D.J.-V.; project administration, D.J.-V. and A.R.-D. All authors have read and agreed to the published version of the manuscript.

Funding

This research received no external funding.

Conflicts of Interest

The authors declare no conflict of interest.

Appendix A

1. Descriptive statistics
1.2. Study of the variable Time Viewed (sec)
1.3. Study of the variable Fixations (#)
1.4. Study of the variable Revisits (#)
2. Feature selection
2.1. Study of the variable Time to 1st View (sec)
2.2. Study of the variable Time Viewed (sec)
2.3. Study of the variable Fixations (#)
2.4. Study of the variable Revisits (#)
3. Classification models
3.1. Study of the variable Time to 1st View (sec)
3.2. Study of the variable Time Viewed (sec)
3.3. Study of the variable Fixations (#)
3.4. Study of the variable Revisits (#)

References

  1. AEFJ. 2019. Toy Image. Imagen del Juguete. Available online: https://www.aefj.es/paginas/carta-de-imagen-del-juguete (accessed on 15 November 2019).
  2. AIJU. 2019. AIJU 3.0 Guide: (Juego y Juguete. Guía AIJU 3.0). AIJU Instituto Tecnológico de Producto Infantil y de Ocio. Available online: www.guiaaiju.com (accessed on 15 November 2019).
  3. Alm, Cecilia Ovesdotter, Dan Roth, and Richard Sproat. 2005. Emotions from text: Machine learning for text-based emotion prediction. Paper presented at Human Language Technology Conference and Conference on Empirical Methods in Natural Language Processing, Vancouver, BC, Canada, October 6–8. [Google Scholar]
  4. American Marketing Asociation. 2013. Packaging. Available online: https://www.ama.org/ (accessed on 15 November 2019).
  5. Añaños-Carrasco, Elena J. C. 2015. Eyetracker technology in elderly people: How integrated television content is paid attention to and processed. Comunicar 23: 75–83. [Google Scholar] [CrossRef] [Green Version]
  6. Ariely, Dan, and Gregory S. Berns. 2010. Neuromarketing: The hope and hype of neuroimaging in business. Nature Reviews Neuroscience 11: 284–92. [Google Scholar] [CrossRef] [PubMed] [Green Version]
  7. Bloch, Peter H. 1995. Seeking the ideal form: Product design and consumer response. Journal of Marketing 59: 16–29. [Google Scholar] [CrossRef] [Green Version]
  8. Breiman, Leo, Jerome H. Friedman, Charles J. Stone, and Richard A. Olshen. 1984. Classification and Regression Trees. Boca Raton: CRC Press. [Google Scholar]
  9. Butler, Michael J. R. 2008. Neuromarketing and the perception of knowledge. Journal of Consumer Behaviour 7: 415–19. [Google Scholar] [CrossRef]
  10. Calver, G. 2004. What is Packaging Design. Mies: Rotovision. [Google Scholar]
  11. Chapelle, Olivier, Vladimir Vapnik, Olivier Bousquet, and Sayan Mukherjee. 2002. Choosing multiple parameters for support vector machines. Machine Learning 46: 131–59. [Google Scholar] [CrossRef]
  12. Chapman, Pete, and Julian Clinton. 1999. Julian Clinton (SPSS), Randy Kerber (NCR), Thomas Khabaza (SPSS), Thomas Reinartz (Daimler Chrysler), Colin Shearer (SPSS) and Rüdiger Wirth (Daimler Chrysler). Available online: https://www.coursehero.com/file/14884931/CRISP-DM-Process-Model-User-Guide/ (accessed on 15 November 2019).
  13. Cuesta-Cambra, Ubaldo, Nino-Gonzalez José Ignacio, and José Rodriguez-Terceno. 2017. The Cognitive Processing of an Educational App with Electroencephalogram and “Eye Tracking”. Comunicar 52: 41–50. [Google Scholar] [CrossRef] [Green Version]
  14. Dernoncourt, David, Blaise Hanczar, and Jean-Daniel Zucker. 2014. Analysis of feature selection stability on high dimension and small sample data. Computational Statistics & Data Analysis 71: 681–93. [Google Scholar]
  15. Enax, Laura, Bernd Weber, Maren Ahlers, Ulrike Kaiser, Katharina Diethelm, Dominik Holtkamp, Ulya Faupel, Hartmut H. Holzműller, and Mathilde Kersting. 2015. Food packaging cues influence taste perception and increase effort provision for a recommended snack product in children. Frontiers in Psychology 6: 882. [Google Scholar] [CrossRef]
  16. ESOMAR. 2017. ESOMAR. Available online: https://www.esomar.org/ (accessed on 15 November 2019).
  17. Espinosa, Cruz R. J. Y. G. 2018. The Educational Toy Guide (Guía El Juguete Educativo), 2nd ed. Cruz Roja Juventud. Available online: https://www.cruzrojajuventud.org/ (accessed on 15 November 2019).
  18. Goodall, Paul, Richard Sharpe, and Andrew West. 2019. A data-driven simulation to support remanufacturing operations. Computers in Industry 105: 48–60. [Google Scholar] [CrossRef]
  19. Goto, Nobuhiko, Xue Li Lim, Dexter Shee, Aya Hatano, Kok Wei Khong, Luciano Grüdtner Buratto, Motoki Watabe, and Alexandre Schaefer. 2019. Can brain waves really tell if a product will be purchased? Inferring consumer preferences from single-item brain potentials. Frontiers in Integrative Neuroscience 13: 19. [Google Scholar] [CrossRef] [Green Version]
  20. Hakim, Adam, and Dino Levy. 2019. A gateway to consumers’ minds: Achievements, caveats, and prospects of electroencephalography-based prediction in neuromarketing. Wiley Interdisciplinary Reviews Cognitive Science 10: e1485. [Google Scholar] [CrossRef] [PubMed]
  21. Hawkins, Douglas M. 1980. Identification of Outliers. Berlin: Springer, vol. 11. [Google Scholar]
  22. Innerscope. 2017. Innerscope. Available online: http://www.nielsen.com/us/en/solutions/capabilities/consumer-neuroscience.html (accessed on 15 November 2019).
  23. John, George H. 1995. Robust Decision Trees: Removing Outliers from Databases. Available online: https://www.aaai.org/Papers/KDD/1995/KDD95-044.pdf (accessed on 15 November 2019).
  24. Jones, Candace, Mark Lorenzen, and Jonathan Sapsed. 2015. Creative Industries. In The Oxford Handbook of Creative Industries. New York: Oxford University Press, p. 1. [Google Scholar]
  25. Juarez, David, Victoria Tur-Viñes, and Ana Mengual. 2020. Neuromarketing Applied to Educational Toy Packaging. Frontiers in Psychology 11: 2077. [Google Scholar] [CrossRef]
  26. Kahneman, Daniel. 2002. Daniel Kahneman. Available online: https://kahneman.socialpsychology.org/ (accessed on 15 November 2019).
  27. Lamb, Charles W. 2008. Marketing, 9th ed. Boston: Thomsom Learning Inc. [Google Scholar]
  28. Lawrence, Thomas B., and Nelson Phillips. 2002. Understanding cultural industries. Journal of Management Inquiry 11: 430–41. [Google Scholar] [CrossRef]
  29. Lawrence, Kate, Ruth Campbell, and David Skuse. 2015. Age, gender, and puberty influence the development of facial emotion recognition. Frontiers in Psychology 6: 761. [Google Scholar] [CrossRef] [PubMed] [Green Version]
  30. Li, Zhe, Yi Wang, and Kesheng Wang. 2019. A deep learning driven method for fault classification and degradation assessment in mechanical equipment. Computers in Industry 104: 1–10. [Google Scholar] [CrossRef]
  31. Libert, Arno, and Marc Van Hulle. 2019. Predicting Premature Video Skipping and Viewer Interest from EEG Recordings. Entropy 21: 1014. [Google Scholar] [CrossRef] [Green Version]
  32. Liu, Jiang B., and Jun Han. 2002. A Practical Knowledge Discovery Process for Distributed Data Mining. Paper presented at ISCA Conference on Intelligent Systems, Boston, MA, USA, July 18–20. [Google Scholar]
  33. Lučić, Andrea, Marina Dabić, and John Finley. 2019. Lučić, Andrea, Marina Dabić, and John Finley. 2019. Marketing innovation and up-and-coming product and process innovation. International Journal of Entrepreneurship and Small Business 37: 434–48. [Google Scholar] [CrossRef]
  34. Luévano Torres, Hector A. 2013. Toy packaging design and its relationship to gender stereotypes (El diseño de empaque del juguete y su relación con los estereotipos de género). UNAM Revista Digital Universitaria 14: 7. [Google Scholar]
  35. Maas, Cora J.M., and Joop Hox. 2005. Sufficient sample sizes for multilevel modeling. Methodology European Journal of Research Methods for the Behavioral and Social Sciences 1: 86–92. [Google Scholar] [CrossRef] [Green Version]
  36. Mañas-Viniegra, Luis, Patricia Núñez-Gómez, and Victoria Tur-Viñes. 2020. Neuromarketing as a strategic tool for predicting how Instagramers have an influence on the personal identity of adolescents and young people in Spain. Heliyon 6: e03578. [Google Scholar] [CrossRef]
  37. Marín-Marín, José Antonio, Jesús López-Belmonte, Juan-Miguel Fernández-Campoy, and José-María Romero-Rodríguez. 2019. Big data in education. A bibliometric review. Social Sciences 8: 223. [Google Scholar] [CrossRef] [Green Version]
  38. Martínez-Sanz, Raquel. 2012. Estrategia comunicativa digital en el museo. El Profesional de la Información 21: 391–95. [Google Scholar] [CrossRef]
  39. Mengual-Recuerda, Ana, Victoria Tur-Viñes, and David Juárez-Varón. 2020. Neuromarketing in Haute Cuisine Gastronomic Experiences. Frontiers in Psychology 11: 1772. [Google Scholar] [CrossRef] [PubMed]
  40. Morillo, Luis M. S., Juan Antonio Alvarez-Garcia, Luis Gonzalez-Abril, and Juan A. Ortega. 2016. Discrete classification technique applied to TV advertisements liking recognition system based on low-cost EEG headsets. BioMedical Engineering 15: 75. [Google Scholar] [CrossRef] [PubMed] [Green Version]
  41. Nancarrow, Clive, Len Tiu Wright, and Ian Brace. 1998. Gaining competitive advantage from packaging and labelling in marketing communications. British Food Journal, 100. Available online: https://0-www-emerald-com.brum.beds.ac.uk/insight/content/doi/10.1108/00070709810204101/full/html (accessed on 15 November 2019).
  42. Ohme, Rafal, Michal Matukin, and Beata Pacula-Lesniak. 2011. Biometric measures for interactive advertising research. Journal of Interactive Advertising 11: 60–72. [Google Scholar] [CrossRef]
  43. Peres-Neto, Pedro R., Donald A. Jackson, and Keith M. Somers. 2005. How many principal components? Stopping rules for determining the number of non-trivial axes revisited. Computational Statistics & Data Analysis 49: 974–97. [Google Scholar]
  44. Peris-Ortiz, Marta, Mayer Rainiero Cabrera-Flores, and Arturo Serrano-Santoyo. 2018. Cultural and Creative Industries: A Path to Entrepreneurship and Innovation. Berlin: Springer. [Google Scholar]
  45. Pierdicca, Roberto, Marina Paolanti, Simona Naspetti, and Serena Mandolesi. 2018. User-centered predictive model for improving cultural heritage augmented reality applications: An HMM-based approach for eye-tracking data. Journal of Imaging 4: 101. [Google Scholar] [CrossRef] [Green Version]
  46. Provost, Foster, and Tom Fawcett. 2013. Data science and its relationship to big data and data-driven decision making. Data Science for Business 1: 51–59. [Google Scholar] [CrossRef]
  47. Quinlan, J. Ross. 1986. Induction of decision trees. Machine Learning 1: S1–106. [Google Scholar] [CrossRef] [Green Version]
  48. Quinlan, J. R. 2014. C4.5: Programs for Machine Learning. Amsterdam: Elsevier. [Google Scholar]
  49. Rabasa, Alex, and Ciara Heavin. 2020. An Introduction to Data Science and Its Applications. In Data Science and Productivity Analytics. Berlin: Springer, pp. 57–81. [Google Scholar]
  50. Radac, Mircea-Bogdan, and Radu-Emil Precup. 2015. Optimal behaviour prediction using a primitive-based data-driven model-free iterative learning control approach. Computers in Industry 74: 95–109. [Google Scholar] [CrossRef]
  51. Reimann, Martin, Oliver Schilke, Bernd Weber, Carolin Neuhaus, and Judith Zaichkowsky. 2011. Functional magnetic resonance imaging in consumer research: A review and application. Psychology & Marketing 28: 608–37. [Google Scholar]
  52. Repository, C. 2020. Package ‘MachineLearning’. Available online: https://cran.r-project.org/ (accessed on 15 November 2019).
  53. Ruiz-Palmero, Julio Ruiz, Ernesto Colomo-Magaña, José Manuel Ríos-Ariza, and Melchor Gómez-García. 2020. Big data in education: Perception of training advisors on its use in the educational system. Social Sciences 9: 53. [Google Scholar] [CrossRef] [Green Version]
  54. Rundh, Bo. 2009. Packaging design: Creating competitive advantage with product packaging. British Food Journal 111: 988–1002. [Google Scholar] [CrossRef]
  55. Silva, Emmanuel Sirimal, Hossein Hassani, Dag Øivind Madsen, and Liz Gee. 2019. Googling fashion: Forecasting fashion consumer behaviour using Google Trends. Social Sciences 8: 111. [Google Scholar] [CrossRef] [Green Version]
  56. Soluciones-Packaging. 2016. El Packaging En Los Juguetes. Available online: http://solucionespackaging.com/author/soluciones-packaging/ (accessed on 15 November 2019).
  57. Stark, Lawrence, Gerhard Vossius, and Laurence R. Young. 1962. Predictive control of eye tracking movements. IRE Transactions on Human Factors in Electronics 2: 52–57. [Google Scholar] [CrossRef]
  58. Starks, Katryna. 2014. Cognitive behavioral game design: A unified model for designing serious games. Frontiers in Psychology 5: 28. [Google Scholar] [CrossRef] [Green Version]
  59. Svanes, Erik, Mie Vold, Hanne Møller, and Marit Kvalvåg Pettersen. 2010. Sustainable packaging design: A holistic methodology for packaging design. Packaging Technology and Science 23: 161–75. [Google Scholar] [CrossRef]
  60. Taqwa, Tryono, Adang Suhendra, Matrissya Hermita, and Astie Darmayantie. 2015. Implementation of Naïve Bayes method for product purchasing decision using neural impulse actuator in neuromarketing. Paper presented by 2015 International Conference on Information & Communication Technology and Systems (ICTS), Surabaya, Indonesia, September 16. [Google Scholar]
  61. Thuethongchai, Nopsaran, Tatri Taiphapoon, Achara Chandrachai, and Sipat Triukose. 2020. Adopt big-data analytics to explore and exploit the new value for service innovation. Social Sciences 9: 29. [Google Scholar] [CrossRef] [Green Version]
  62. Tur-Viñes, Victoria, Irene Ramos-Soler, and María Costa Ferrer. 2014. Comunicación Silenciosa: Estudio Comparativo Internacional de Envases de Juguetes. Questiones Publicitarias 19: 35–50. [Google Scholar] [CrossRef] [Green Version]
  63. Ungureanu, Florina, Robert Gabriel Lupu, Adrian Cadar, and Adrian Prodan. 2017. Neuromarketing and Visual Attention Study Using Eye Tracking Techniques. Paper presented at 2017 21st International Conference on System Theory,Control and Computing, Sinaia, Romania, October 19–21; pp. 553–57. [Google Scholar]
  64. Velasco, Carlos, Alejandro Salgado-Montejo, Fernando Marmolejo-Ramos, and Charles Spence. 2014. Predictive packaging design: Tasting shapes, typefaces, names, and sounds. Food Quality and Preference 34: 88–95. [Google Scholar] [CrossRef]
  65. Vellido, Alfredo, José David Martín-Guerrero, and Paulo J. Lisboa. 2012. Making Machine Learning Models Interpretable. Paper presented at ESANN, 20th European Symposium on Artificial Neural Networks, Bruges, Belgium, April 25–27. [Google Scholar]
  66. Victor, Vijay, Jose Thoppan, Robert Jeyakumar Nathan, and Fekete Farkas Maria. 2018. Factors influencing consumer behavior and prospective purchase decisions in a dynamic pricing environment-an exploratory factor analysis approach. Social Sciences 7: 153. [Google Scholar] [CrossRef] [Green Version]
  67. Vilchis, Luz del Carmen. 2008. Metodología del Diseño: Fundamentos Teóricos, 4th ed. Mexico: Claves Latinoamericanas. [Google Scholar]
  68. Wang, Junfeng, Qing Chang, Guoxian Xiao, Nan Wang, and Shiqi Li. 2011. Data driven production modeling and simulation of complex automobile general assembly plant. Computers in Industry 62: 765–75. [Google Scholar] [CrossRef]
  69. Wei, Zhen, Chao Wu, Xiaoyi Wang, Akara Supratak, Pan Wang, and Yike Guo. 2018. Using Support Vector Machine on EEG for Advertisement Impact Assessment. Frontiers in Neuroscience 12: 76. [Google Scholar] [CrossRef] [PubMed]
Figure 1. Product 01. Image of the Educa packaging with its areas of interest (AOI). Source: Prepared by the authors.
Socsci 09 00162 g001
Figure 2. Heat map of Educa packaging for all consumers. Source: Prepared by the authors.
Socsci 09 00162 g002
Figure 3. Product 02. Image of the Diset packaging with its areas of interest (AOI). Source: Prepared by the authors.
Socsci 09 00162 g003
Figure 4. Heat map of Diset packaging for all consumers. Source: Prepared by the authors.
Socsci 09 00162 g004
Figure 5. Box plot of Time to 1st View by the area of interest. Source: Prepared by the authors.
Socsci 09 00162 g005
Figure 6. Box plot of Time to 1st View by the user. Source: Prepared by the authors.
Socsci 09 00162 g006
Figure 7. Box plot of Time to 1st View by the product. Source: Prepared by the authors.
Socsci 09 00162 g007
Figure 8. Box plot of Time to 1st View by gender. Source: Prepared by the authors.
Socsci 09 00162 g008
Figure 9. Box plot of Time to 1st View by personal situation. Source: Prepared by the authors.
Socsci 09 00162 g009
Figure 10. Box plot of Time to 1st View by number of children. Source: Prepared by the authors.
Socsci 09 00162 g010
Figure 11. Box plot of Time to 1st View. Source: Prepared by the authors.
Socsci 09 00162 g011
Figure 12. Feature selection output for fixations on the full sample. Source: Prepared by the authors.
Socsci 09 00162 g012
Figure 13. Feature selection output for fixations on the sample without outliers. Source: Prepared by the authors.
Socsci 09 00162 g013
Figure 14. Tree on the complete sample, to predict Time Viewed. Source: Prepared by the authors.
Socsci 09 00162 g014
Figure 15. Tree on the sample without outliers, to predict Time Viewed. Source: Prepared by the authors.
Socsci 09 00162 g015
Figure 16. Confusion matrix and statistics for fixations variable on the sample without outliers. Source: Prepared by the authors.
Socsci 09 00162 g016
Figure 17. Comparative table of classification model with improved results in the sample without outliers framed in green. Source: Prepared by the authors.
Socsci 09 00162 g017
Figure 18. Packaging design for educational toys selected. Source: Prepared by the authors.
Socsci 09 00162 g018
Figure 19. Input data set statistics. Summary of the data. Source: Prepared by the authors.
Socsci 09 00162 g019
Figure 20. Methodology. General schema. Source: Prepared by the authors.
Socsci 09 00162 g020
Figure 21. General diagram of the analytical methodology. Source: Prepared by the authors.
Socsci 09 00162 g021
Table 1. Information from the set of users, about areas of interest of the Educa toy, using eye tracking. Source: Prepared by the authors.
AOI NameAOI Start (s)AOI Duration (sec—U = User Controlled)Viewers (#)Total Viewers (#)Ave Time to 1st View (s)Ave Time Viewed (s)Ave Time Viewed (%)Ave Fixations (#)Revisitors (#)
AOI 003022257.631.795.976.0920
AOI 103024255.675.0416.8015.1724
AOI 2030222512.820.441.472.189
AOI 303014259.300.682.262.789
AOI 403023255.490.732.454.3918
AOI 503023252.681.996.6610.4823
AOI 603024251.057.8526.1725.5424
Table 2. Information from the set of users, about areas of interest of the Diset toy, using eye tracking. Source: Prepared by the authors.
AOI NameAOI Start (sec)AOI Duration (sec—U = User Controlled)Viewers (#)Total Viewers (#)Ave Time to 1st View (s)Ave Time Viewed (s)Ave Time Viewed (%)Ave Fixations (#)Revisitors (#)
AOI 003023253.223.8212.7511.6923
AOI 103025256.502.086.946.0422
AOI 203018259.040.591.962.9414
AOI 303022259.681.244.123.7715
AOI 403023256.381.244.146.0420
AOI 503023252.421.565.207.6923
AOI 603025250.4216.2154.0352.0825

