Organo-Mineral Interactions Are More Important for Organic Matter Retention in Subsoil Than Topsoil

 , ,
, ,
Abstract
:1. Introduction
2. Materials and Methods
2.1. Soils and Incubation
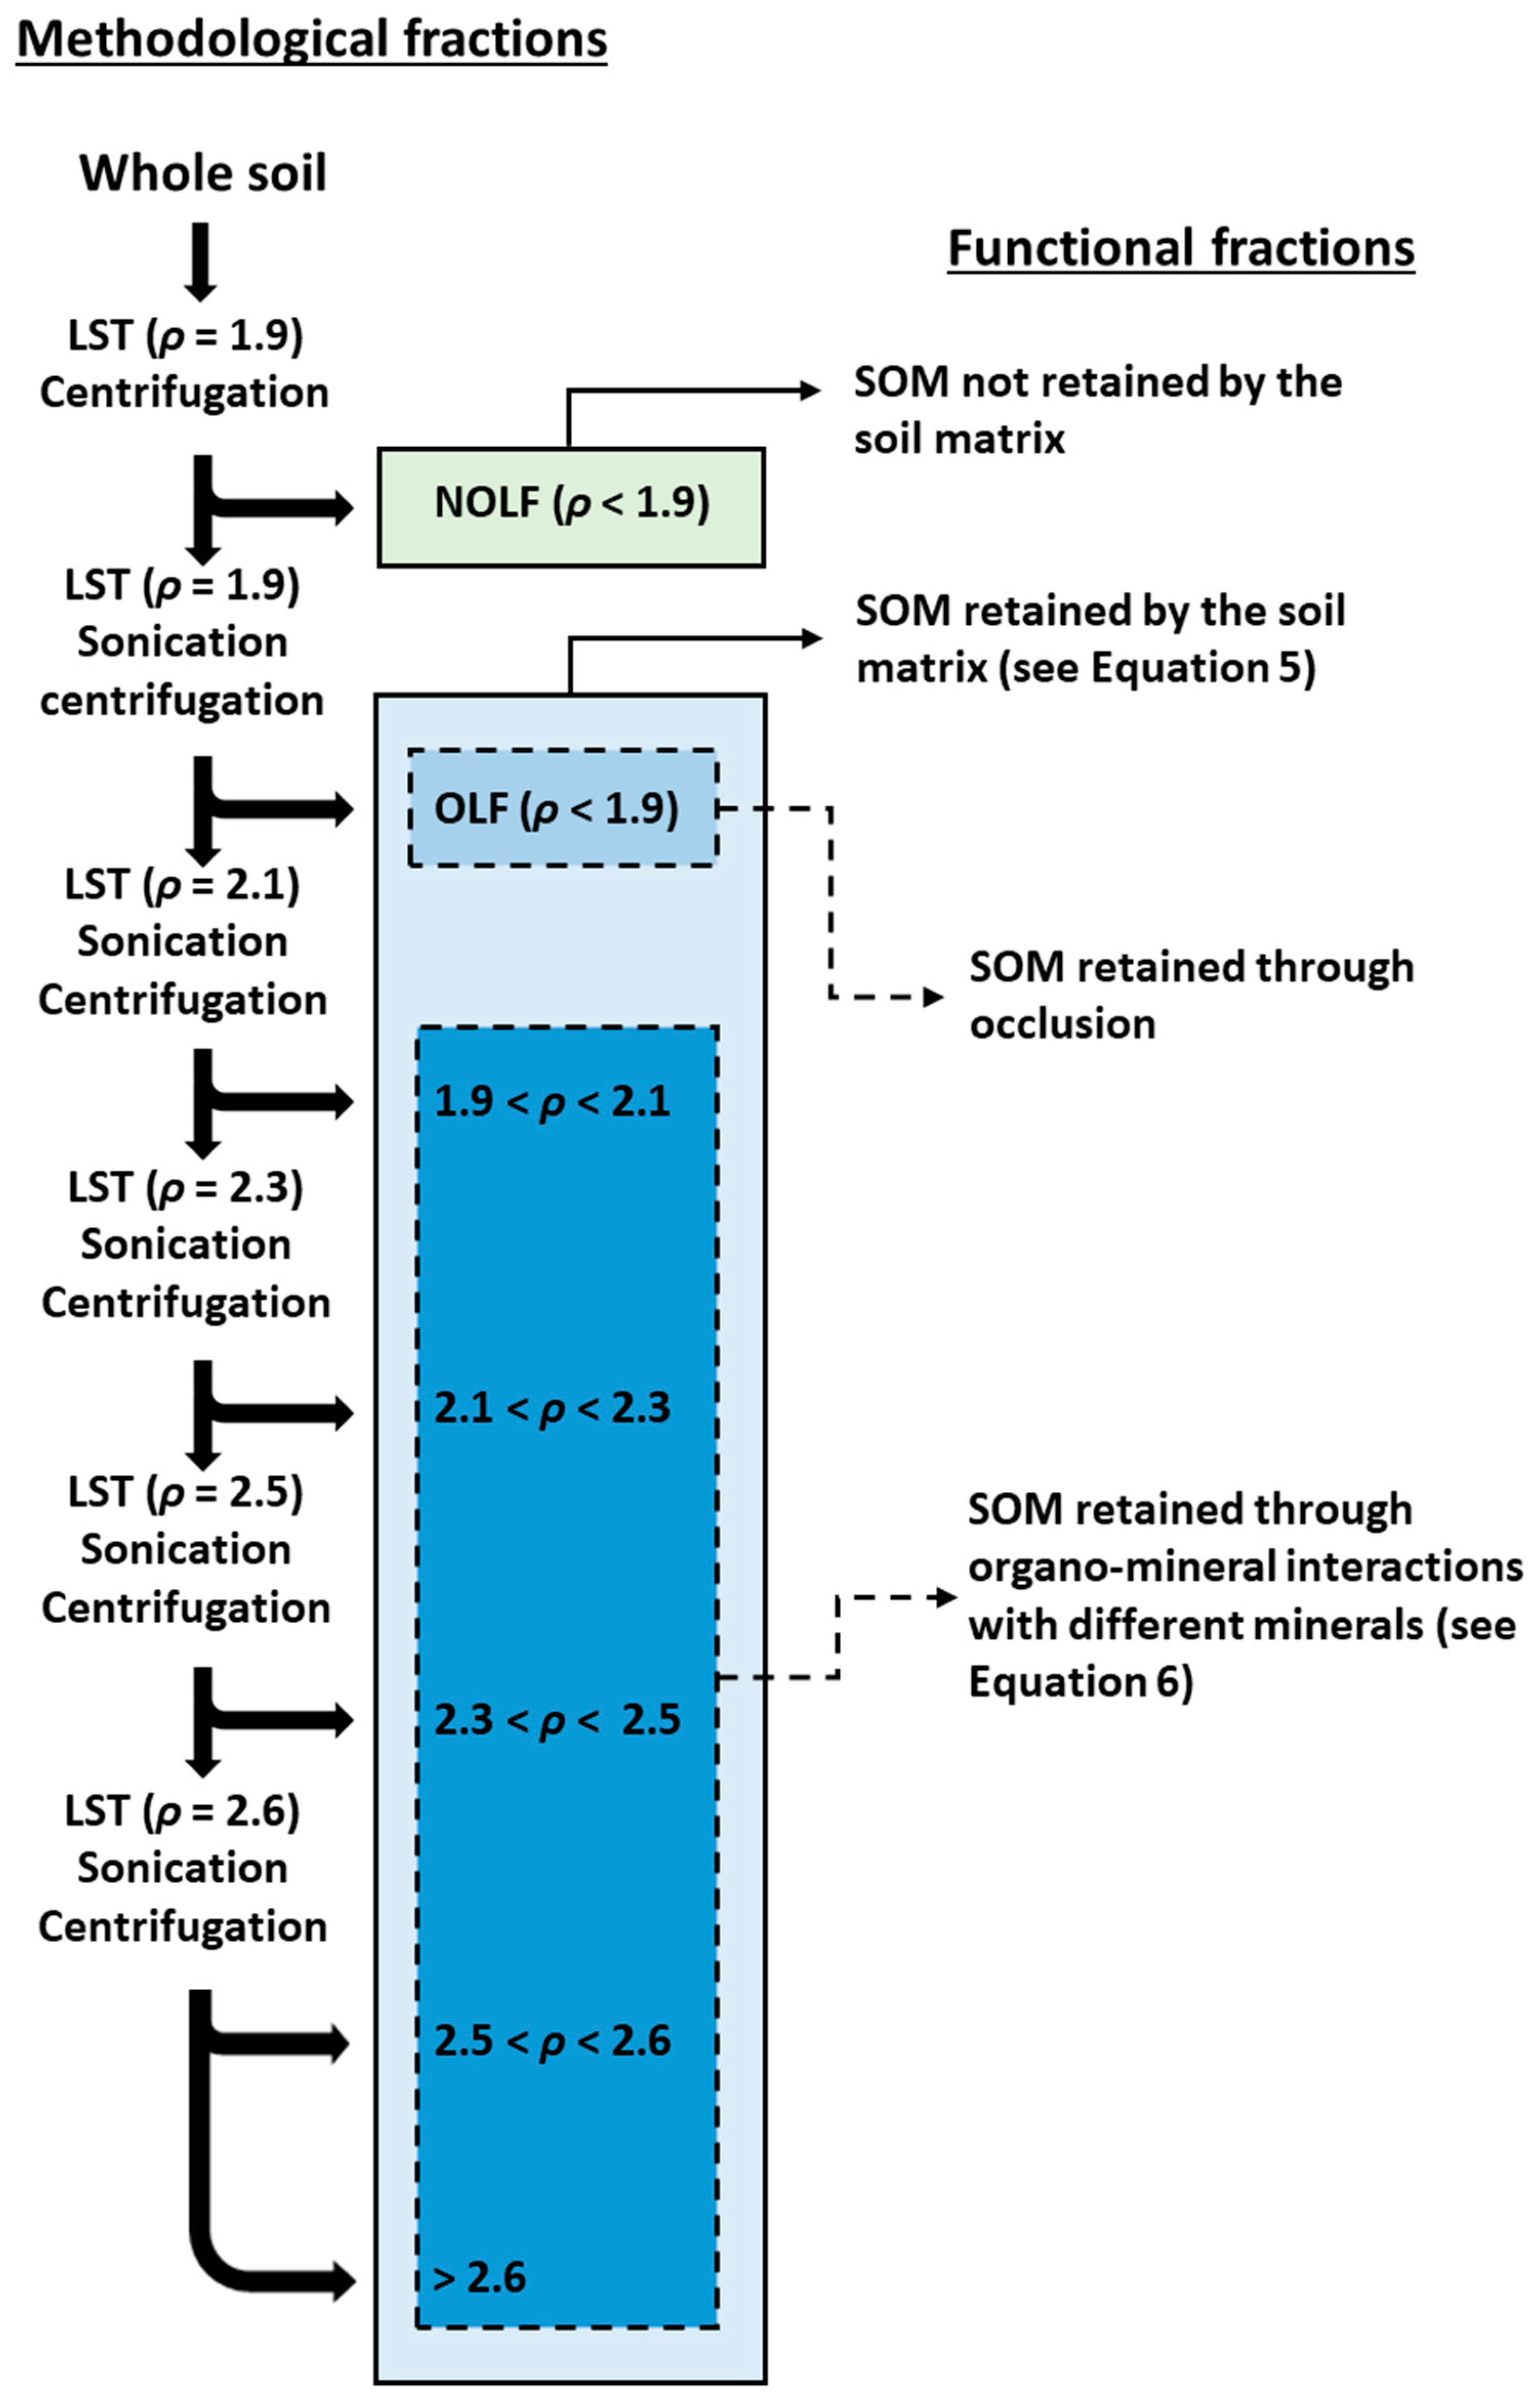
2.2. Sequential Density Separation
2.3. Mineralogical Analysis
2.4. Carbon and Nitrogen Analyses
2.5. Relationships between Methodological and Functional Fractions of SOM
2.6. Statistical Analysis
3. Results
3.1. Mass Distribution and Recovery
3.2. Mineralogical Analysis of Soil Density Fractions
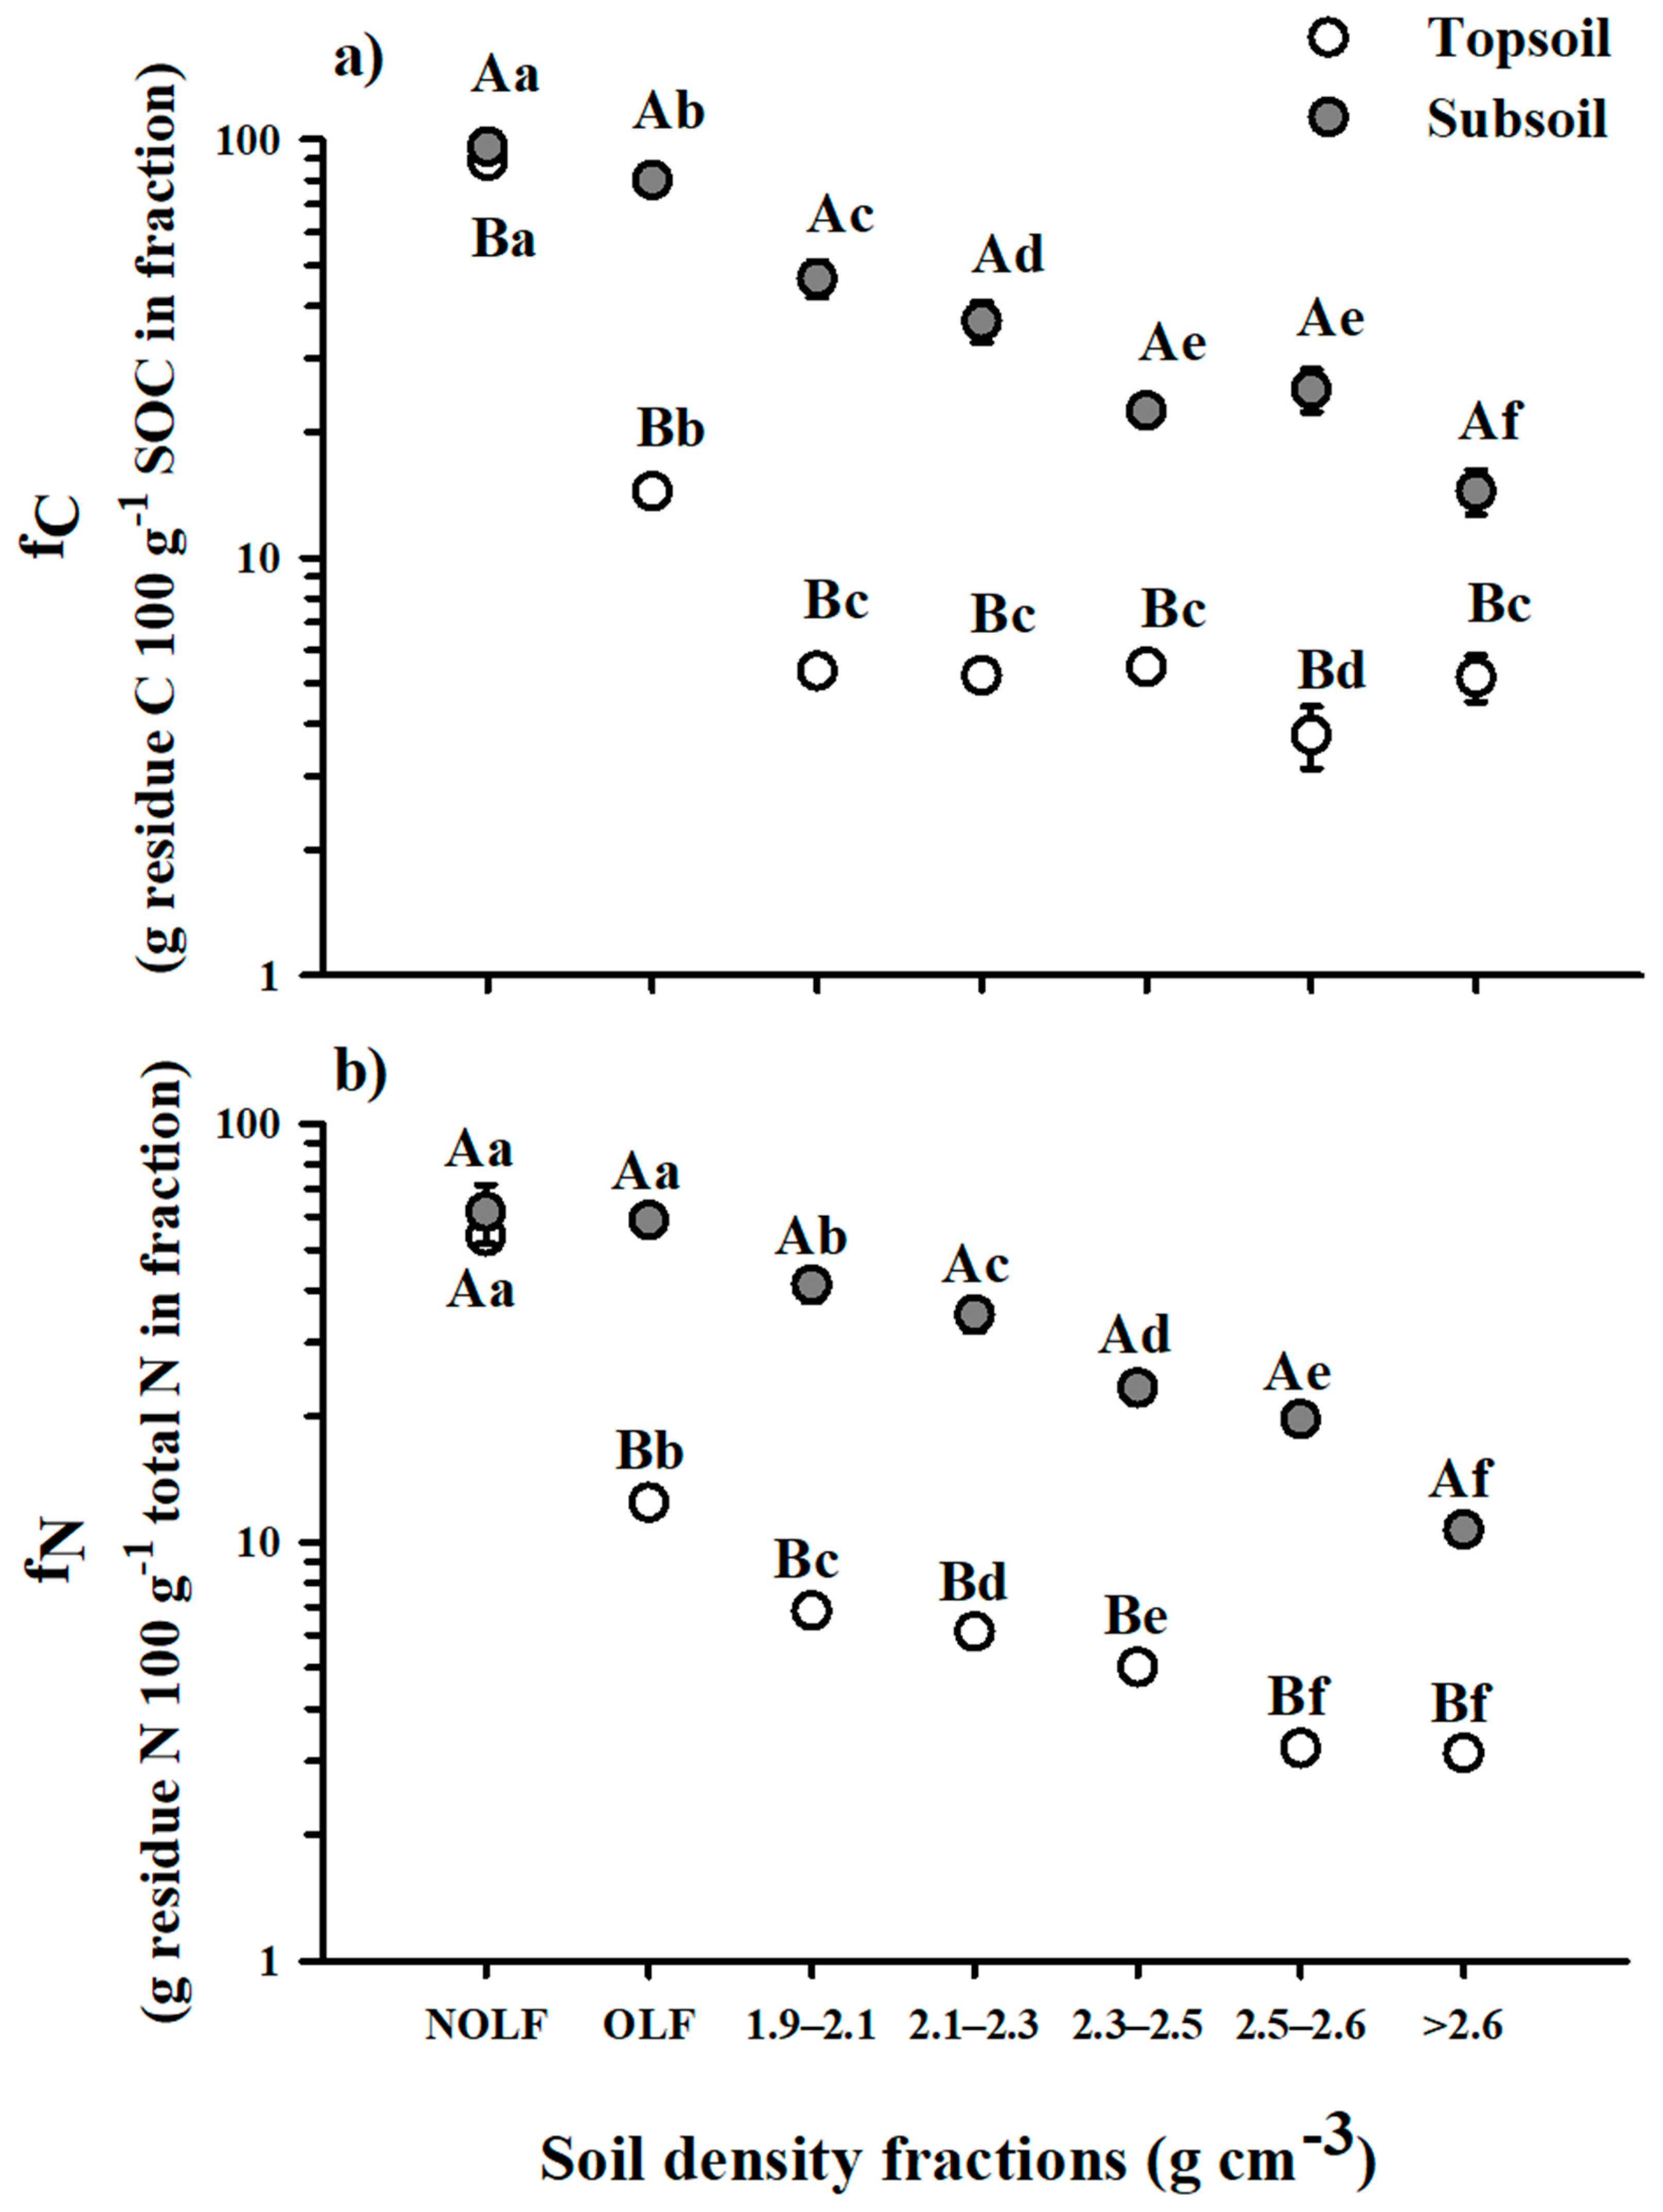
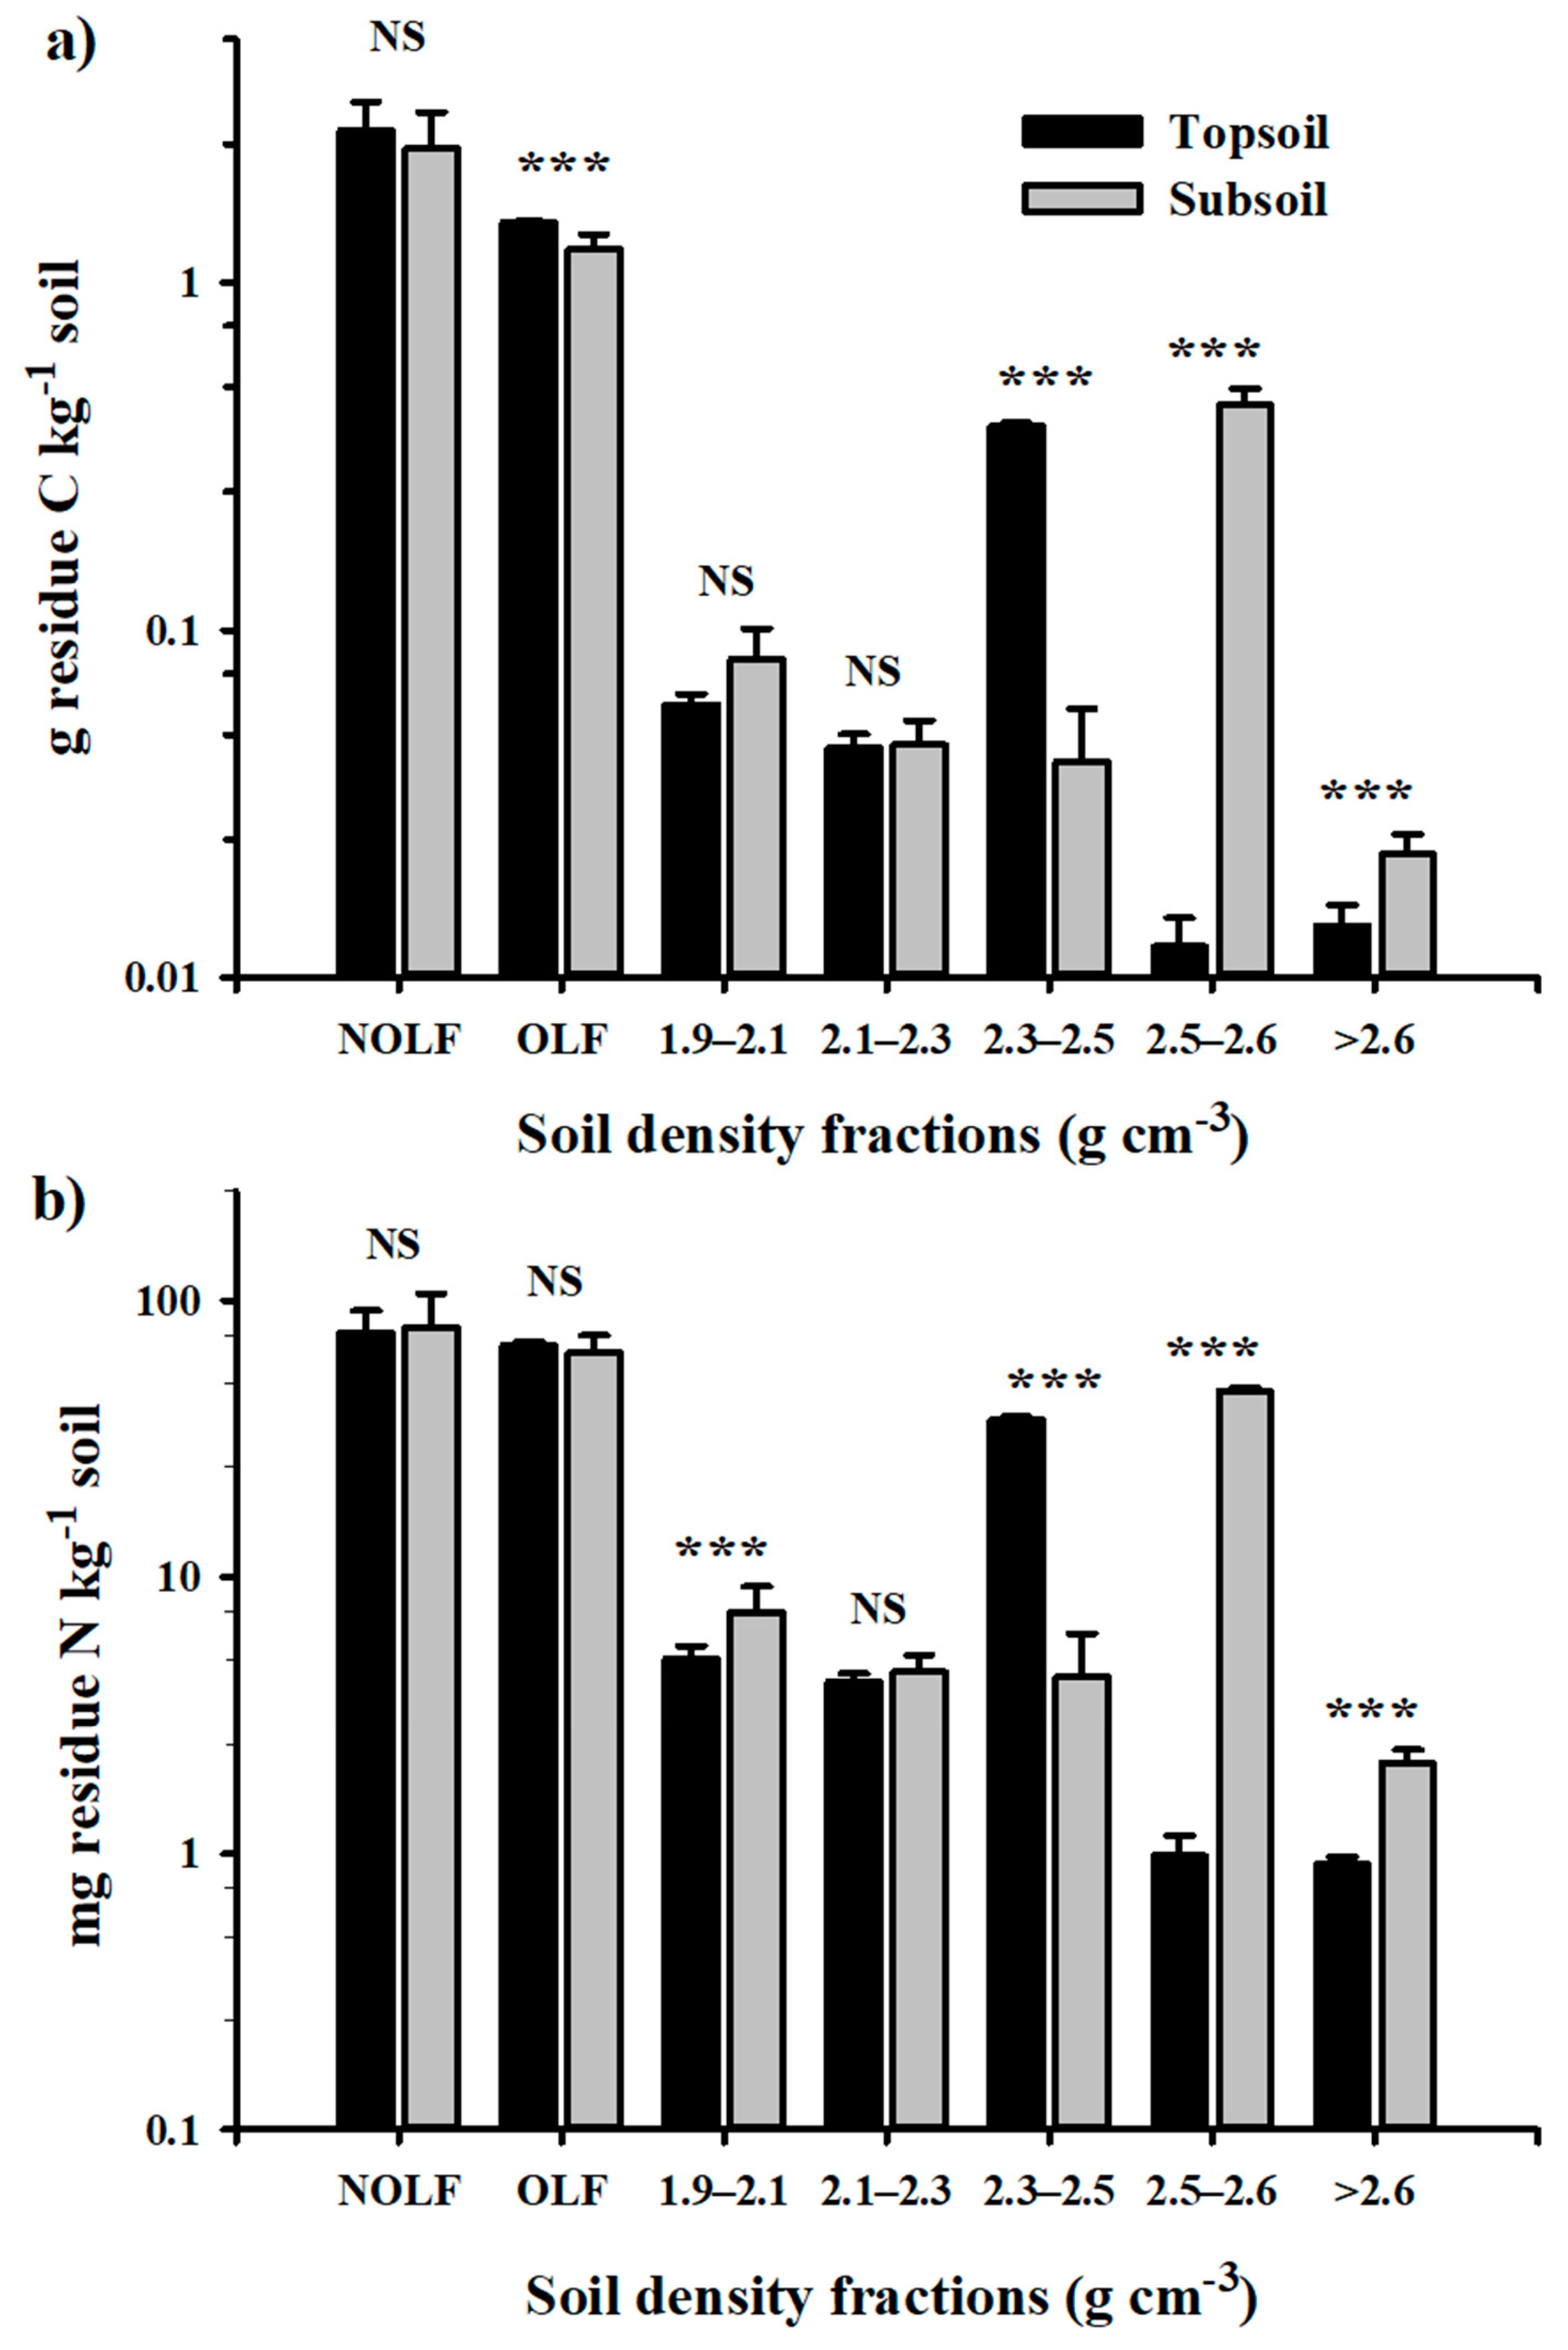
3.3. Residue C and N in Soil Density Fractions
4. Discussion
4.1. Methodological Considerations
4.2. Residue-Derived C and N Retention in Occluded SOM
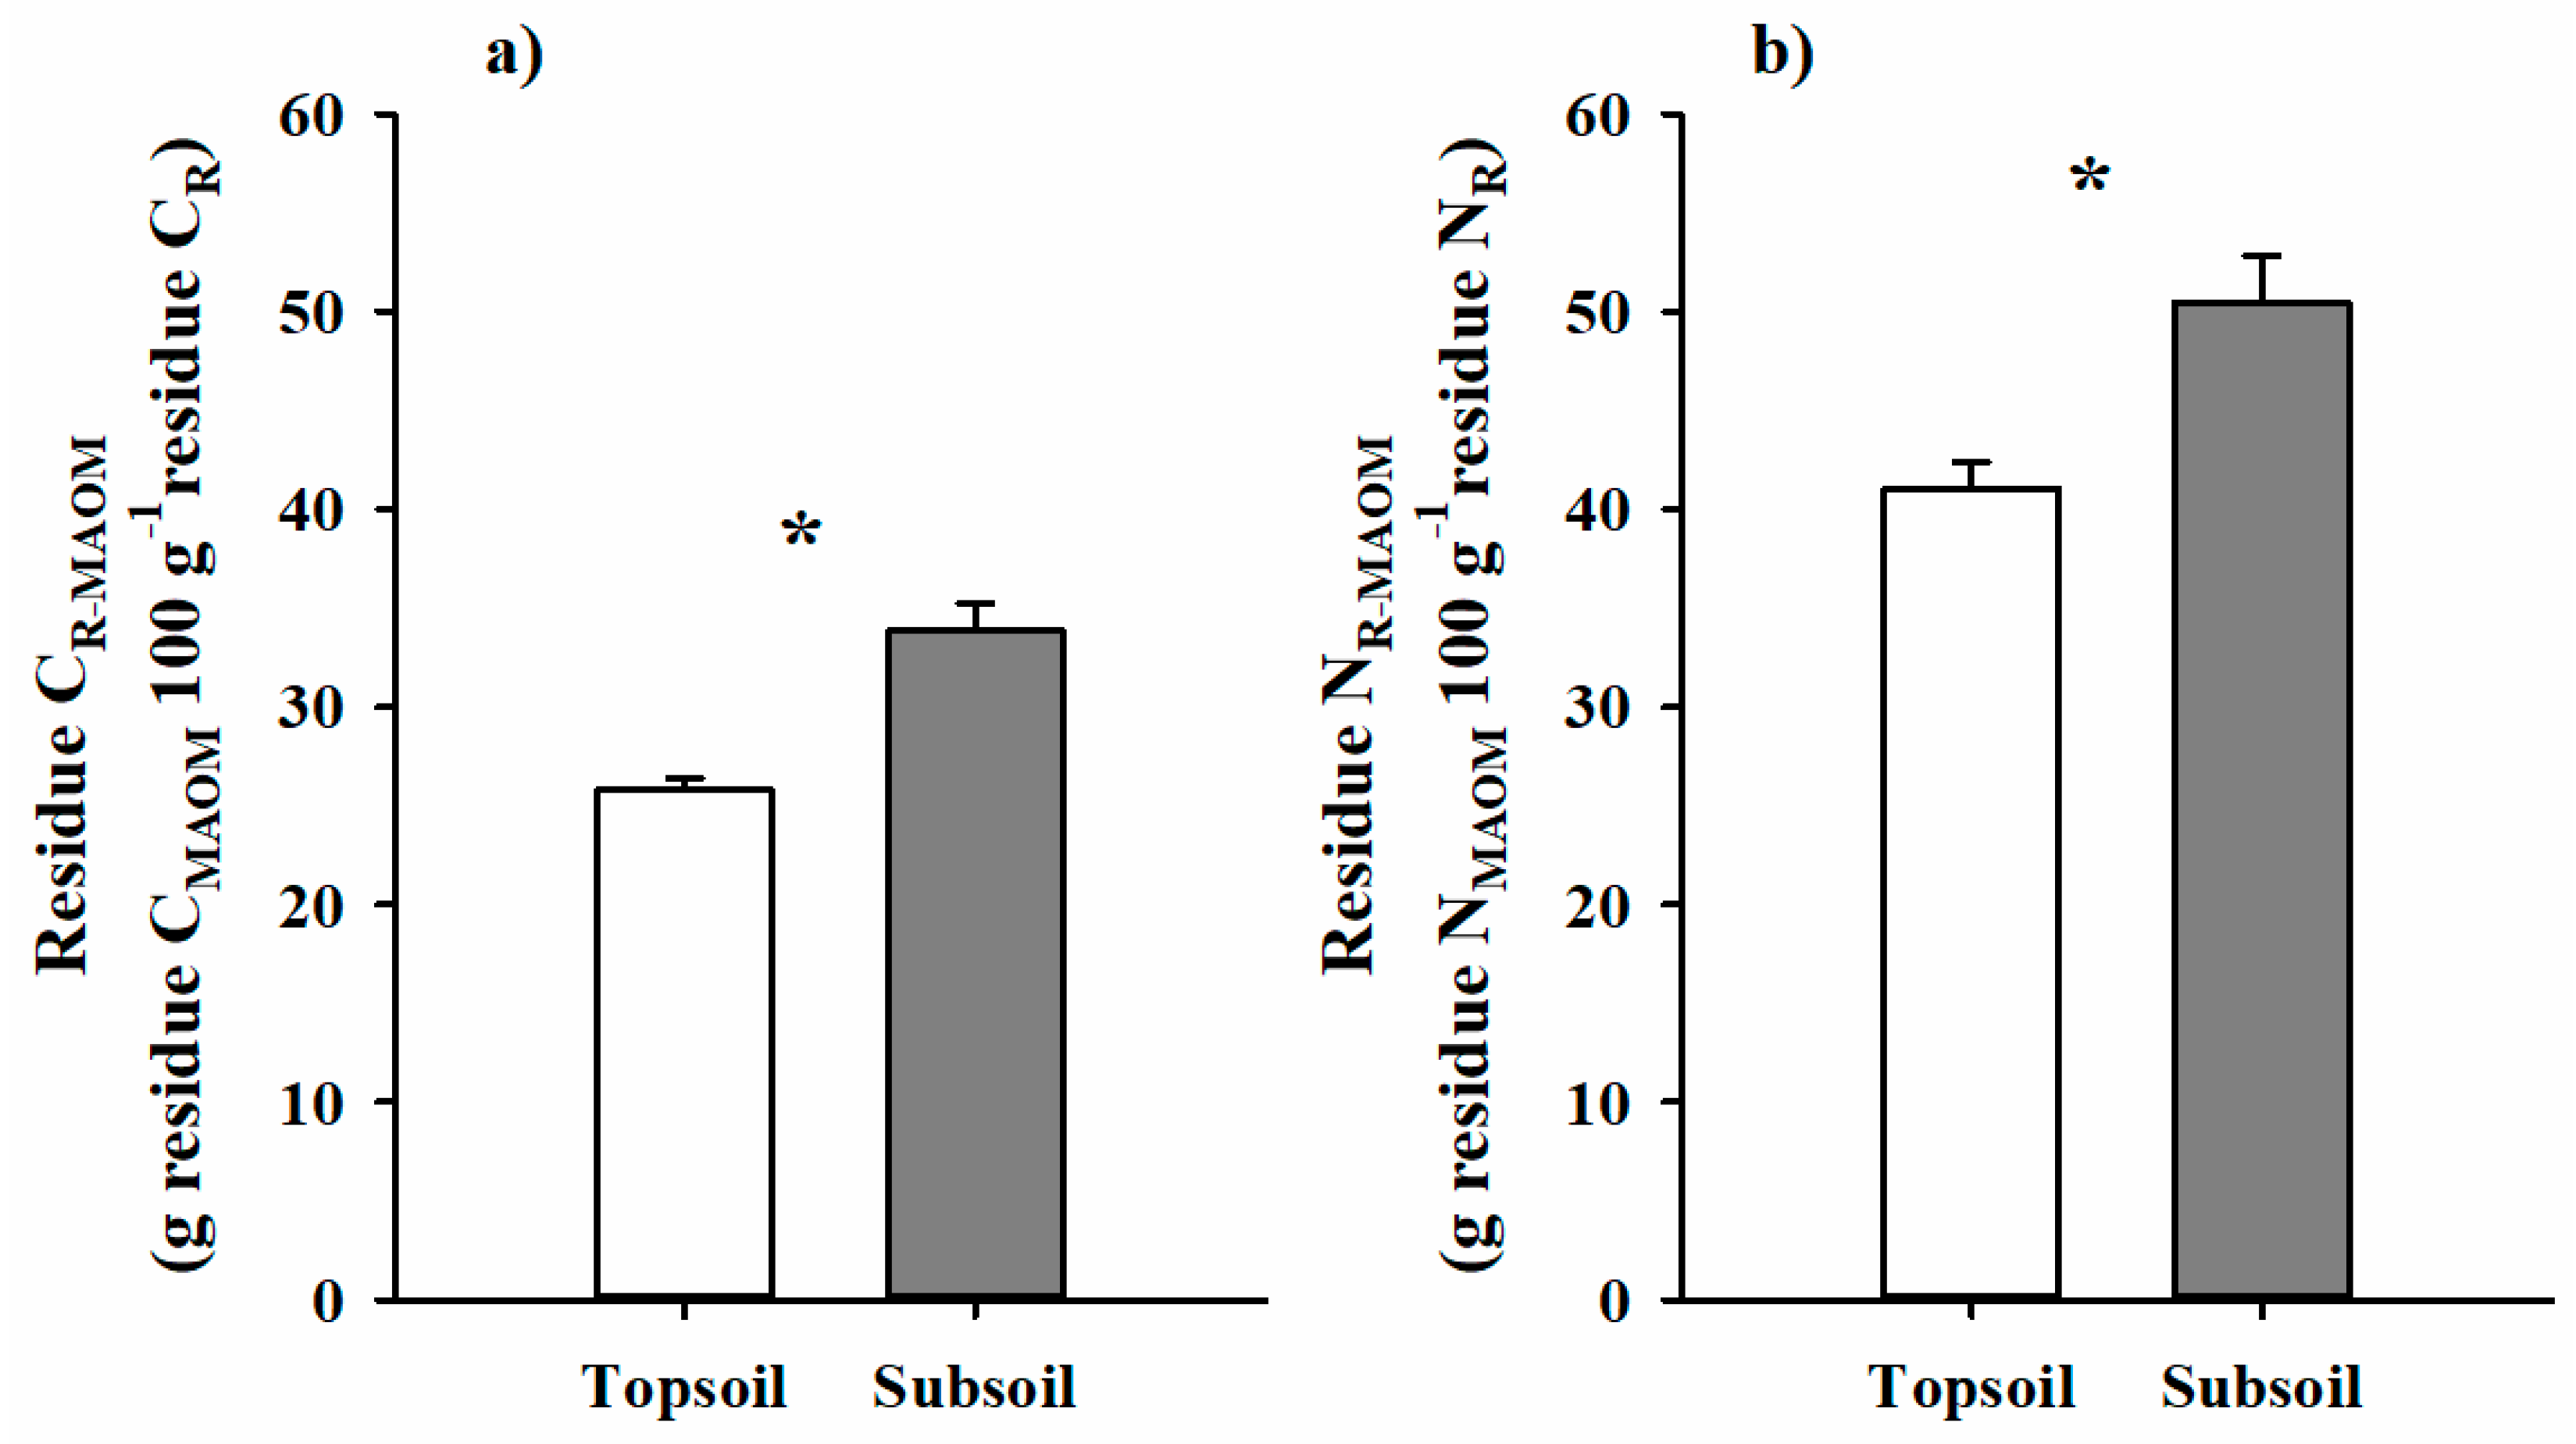
4.3. Residue-Derived C and N Retention in Mineral-Associated SOM
5. Conclusions
Author Contributions
Funding
Acknowledgments
Conflicts of Interest
Appendix A

| Quartz | ||||||||||
| ρmx (g cm−3) † | 2.62 | 2.65 | 2.66 | Mean (SD) | ||||||
| SOCcpx (mg SOC g−1 cpx) | 0 | 25 | 50 | 0 | 25 | 50 | 0 | 25 | 50 | |
| Vom (cm3) ‡ | 0.000 | 0.027 | 0.053 | 0.000 | 0.027 | 0.053 | 0.000 | 0.027 | 0.053 | - |
| Vmx (cm3) ∫ | 0.382 | 0.365 | 0.349 | 0.378 | 0.362 | 0.346 | 0.376 | 0.360 | 0.344 | - |
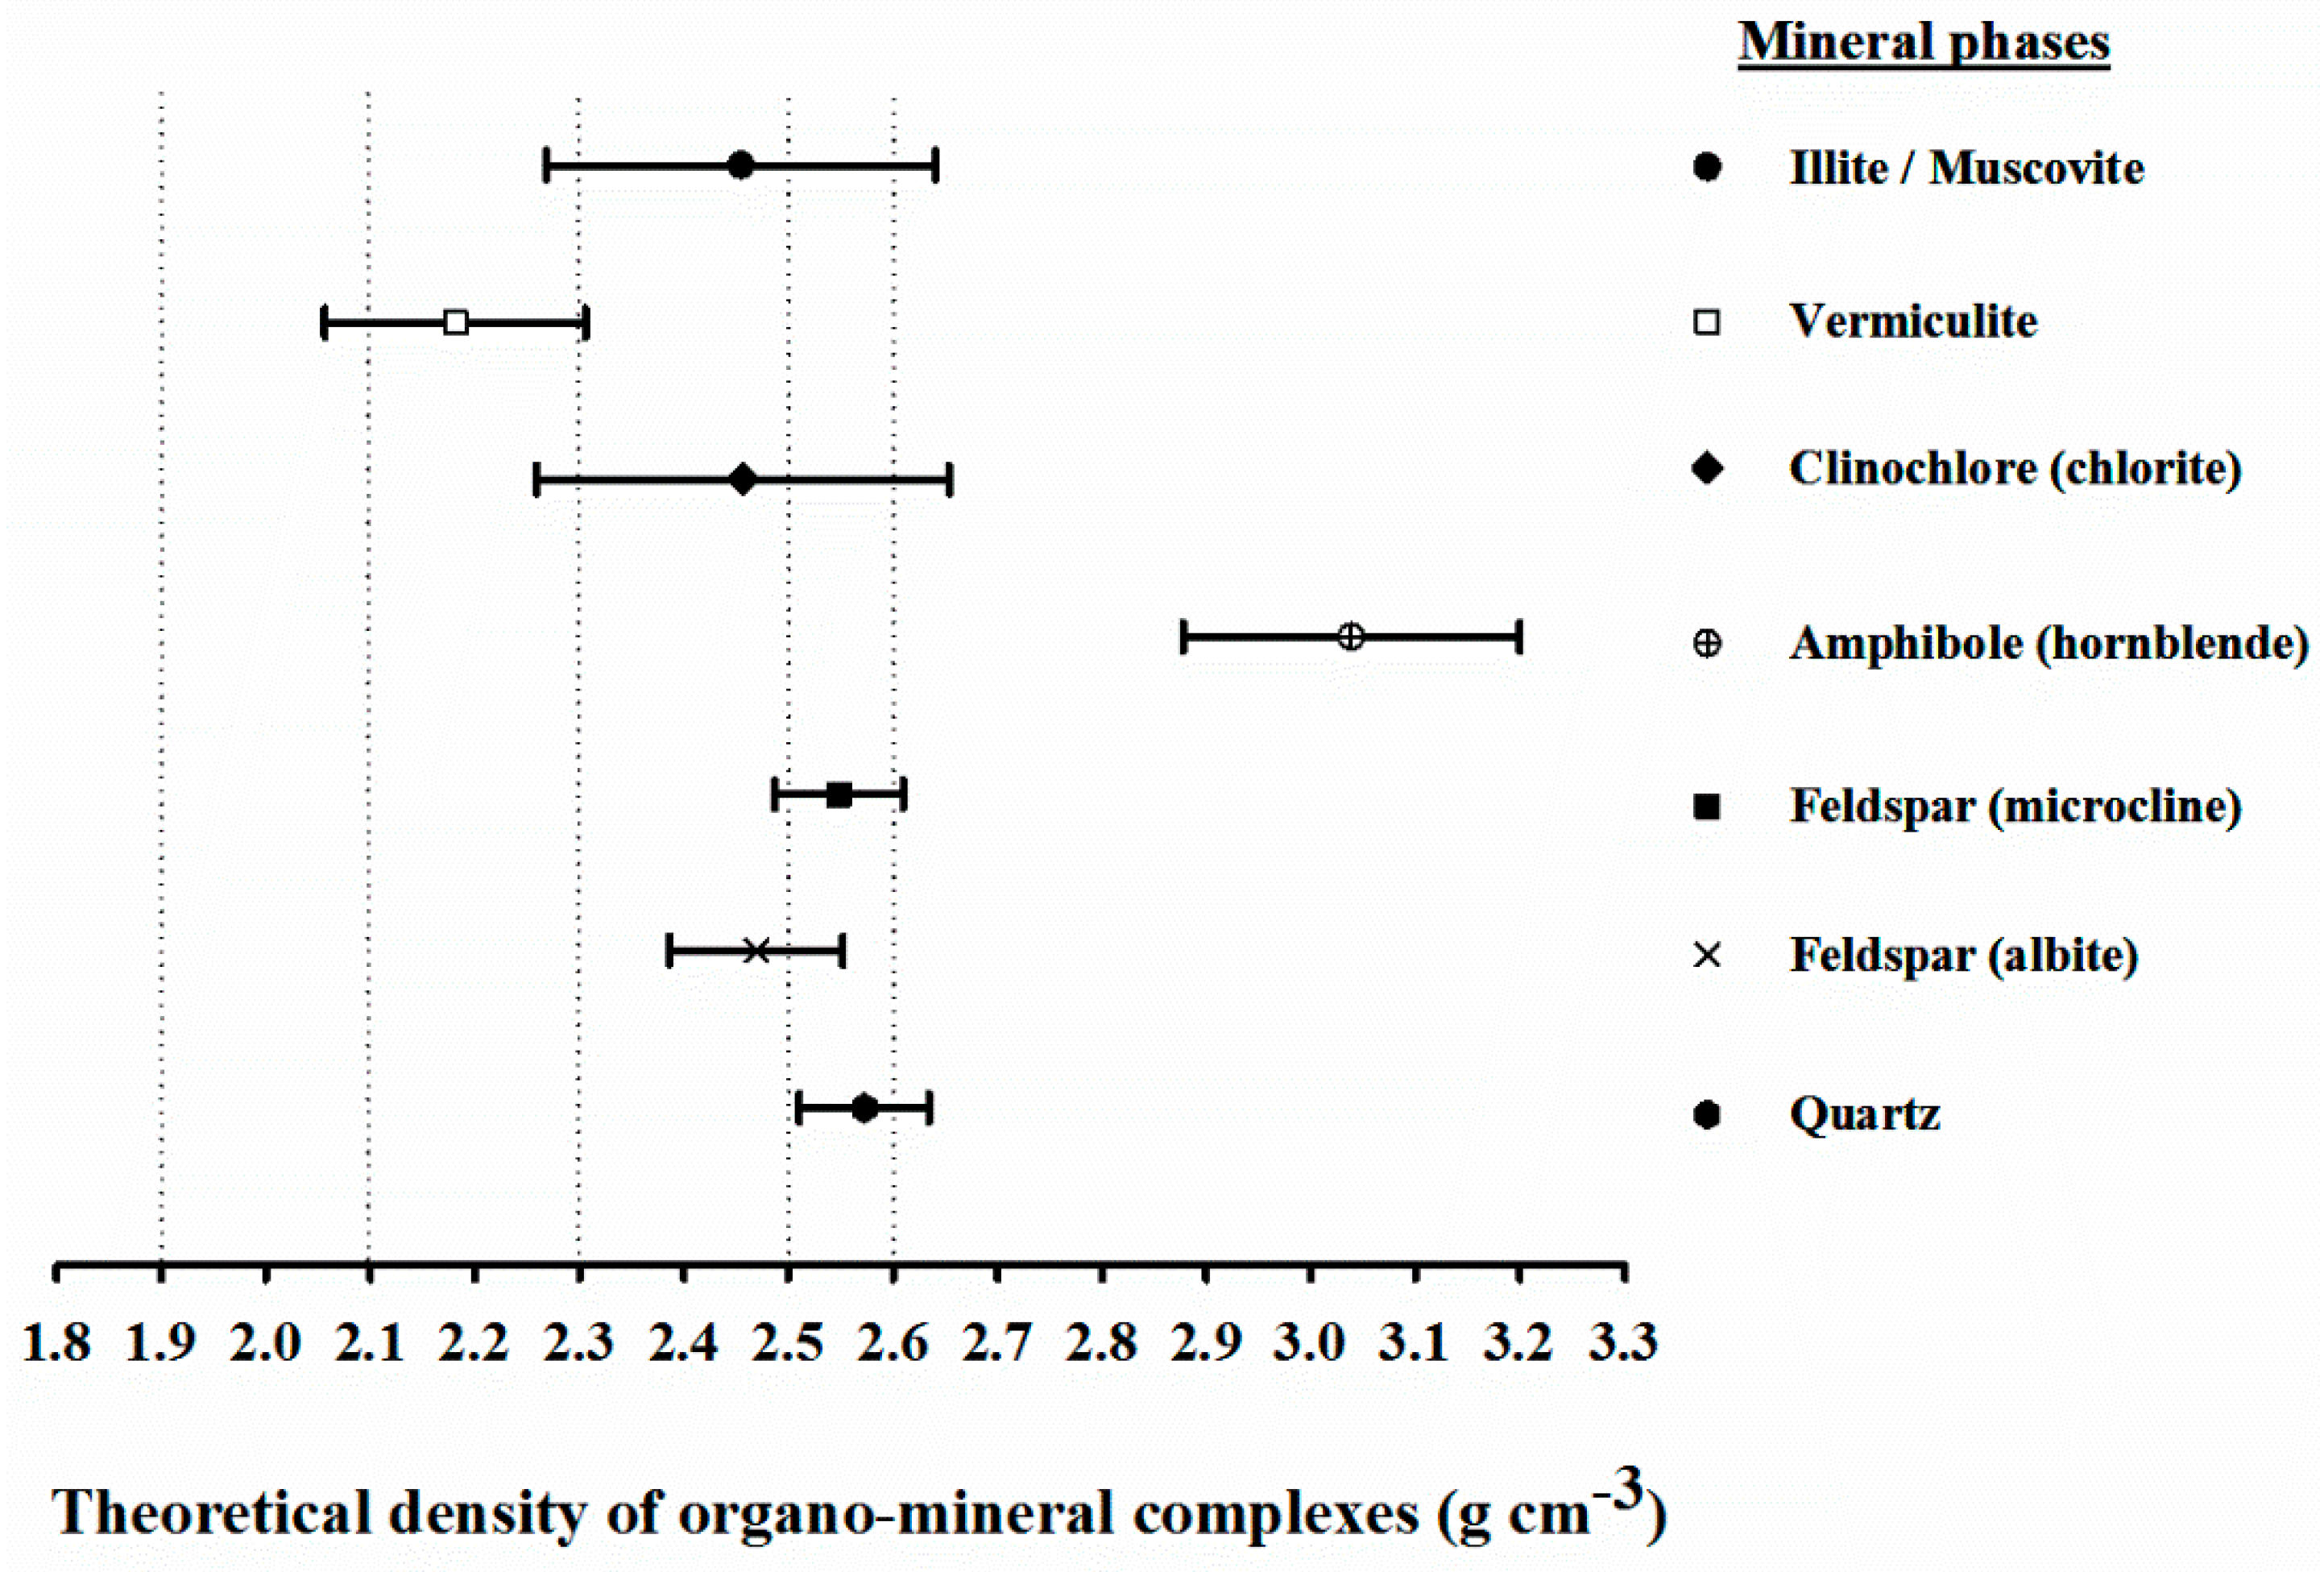
| ρcpx (g cm−3) § | 2.620 | 2.551 | 2.485 | 2.647 | 2.576 | 2.508 | 2.660 | 2.584 | 2.518 | 2.572 (0.062) |
| Microcline | ||||||||||
| ρmx (g cm−3) | 2.44 | 2.55 | 2.60 | Mean (SD) | ||||||
| SOCcpx (mg SOC g−1 cpx) | 0 | 25 | 50 | 0 | 25 | 50 | 0 | 25 | 50 | |
| Vom (cm3) | 0.000 | 0.027 | 0.053 | 0.000 | 0.027 | 0.053 | 0.000 | 0.027 | 0.053 | - |
| Vmx (cm3) | 0.410 | 0.392 | 0.375 | 0.393 | 0.376 | 0.359 | 0.385 | 0.368 | 0.352 | - |
| ρcpx (g cm−3) | 2.440 | 2.387 | 2.336 | 2.547 | 2.484 | 2.425 | 2.600 | 2.533 | 2.469 | 2.469 (0.083) |
| Albite | ||||||||||
| ρmx (g cm−3) | 2.59 | 2.62 | 2.64 | Mean (SD) | ||||||
| SOCcpx (mg SOC g−1 cpx) | 0 | 25 | 50 | 0 | 25 | 50 | 0 | 25 | 50 | |
| Vom (cm3) | 0.000 | 0.027 | 0.053 | 0.000 | 0.027 | 0.053 | 0.000 | 0.027 | 0.053 | - |
| Vmx (cm3) | 0.386 | 0.370 | 0.353 | 0.382 | 0.366 | 0.350 | 0.379 | 0.363 | 0.347 | - |
| ρcpx (g cm−3) | 2.590 | 2.524 | 2.461 | 2.618 | 2.549 | 2.483 | 2.640 | 2.569 | 2.502 | 2.548 (0.061) |
| Amphibole | ||||||||||
| ρmx (g cm−3) | 2.59 | 2.62 | 2.64 | Mean (SD) | ||||||
| SOCcpx (mg SOC g−1 cpx) | 0 | 25 | 50 | 0 | 25 | 50 | 0 | 25 | 50 | |
| Vom (cm3) | 0.000 | 0.027 | 0.053 | 0.000 | 0.027 | 0.053 | 0.000 | 0.027 | 0.053 | - |
| Vmx (cm3) | 0.334 | 0.320 | 0.306 | 0.313 | 0.300 | 0.286 | 0.303 | 0.290 | 0.277 | - |
| ρcpx (g cm−3) | 2.990 | 2.884 | 2.784 | 3.195 | 3.065 | 2.945 | 3.300 | 3.157 | 3.027 | 3.039 (0.161) |
| Chlorite | ||||||||||
| ρmx (g cm−3) † | 2.65 | 2.83 | 2.95 | Mean (SD) | ||||||
| SOCcpx (mg SOC g−1 cpx) ¶ | 50 | 100 | 200 | 50 | 100 | 200 | 50 | 100 | 200 | |
| Vom (cm3) ‡ | 0.053 | 0.106 | 0.213 | 0.053 | 0.106 | 0.213 | 0.053 | 0.106 | 0.213 | - |
| Vmx (cm3) ∫ | 0.345 | 0.313 | 0.249 | 0.323 | 0.293 | 0.233 | 0.310 | 0.281 | 0.224 | - |
| ρcpx (g cm−3) § | 2.510 | 2.384 | 2.167 | 2.659 | 2.505 | 2.245 | 2.753 | 2.580 | 2.292 | 2.455 (0.197) |
| Vermiculite | ||||||||||
| ρmx (g cm−3) | 2.30 | 2.37 | 2.50 | Mean (SD) | ||||||
| SOCcpx (mg SOC g−1 cpx) | 50 | 100 | 200 | 50 | 100 | 200 | 50 | 100 | 200 | |
| Vom (cm3) | 0.053 | 0.106 | 0.213 | 0.053 | 0.106 | 0.213 | 0.053 | 0.106 | 0.213 | - |
| Vmx (cm3) | 0.398 | 0.361 | 0.287 | 0.386 | 0.350 | 0.278 | 0.366 | 0.332 | 0.264 | - |
| ρcpx (g cm−3) | 2.218 | 2.141 | 2.002 | 2.277 | 2.191 | 2.037 | 2.386 | 2.282 | 2.099 | 2.181 (0.184) |
| Illite/Muscovite | ||||||||||
| ρmx (g cm−3) | 2.70 | 2.83 | 2.90 | Mean (SD) | ||||||
| SOCcpx (mg SOC g−1 cpx) | 50 | 100 | 200 | 50 | 100 | 200 | 50 | 100 | 200 | |
| Vom (cm3) | 0.053 | 0.106 | 0.213 | 0.053 | 0.106 | 0.213 | 0.053 | 0.106 | 0.213 | - |
| Vmx (cm3) | 0.339 | 0.307 | 0.244 | 0.323 | 0.293 | 0.233 | 0.316 | 0.286 | 0.228 | - |
| ρcpx (g cm−3) | 2.551 | 2.417 | 2.188 | 2.713 | 2.548 | 2.272 | 2.656 | 2.503 | 2.244 | 2.455 (0.186) |

References
- Derrien, D.; Dignac, M.-F.; Basile-Doelsch, I.; Barot, S.; Cécillon, L.; Chenu, C.; Chevallier, T.; Freschet, G.T.; Garnier, P.; Guenet, B.; et al. Stocker du C dans les sols: Quels mécanismes, quelles pratiques agricoles, quels indicateurs? Étude Gest. des sols 2016, 23, 193–224. [Google Scholar]
- Paustian, K.; Lehmann, J.; Ogle, S.; Reay, D.; Robertson, G.P.; Smith, P. Climate-smart soils. Nature 2016, 532, 49–57. [Google Scholar] [CrossRef] [Green Version]
- Chen, S.; Martin, M.P.; Saby, N.P.A.; Walter, C.; Angers, D.A.; Arrouays, D. Fine resolution map of top- and subsoil carbon sequestration potential in France. Sci. Total Environ. 2018, 630, 389–400. [Google Scholar] [CrossRef] [PubMed]
- Golchin, A.; Oades, J.M.; Skjemstad, J.O.; Clarke, P. Soil structure and carbon cycling. Aust. J. Soil Res. 1994, 32, 1043–1068. [Google Scholar] [CrossRef]
- Baldock, J.; Skjemstad, J. Role of the soil matrix and minerals in protecting natural organic materials against biological attack. Org. Geochem. 2000, 31, 697–710. [Google Scholar] [CrossRef]
- Von Lützow, M.; Kögel-Knabner, I.; Ekschmitt, K.; Matzner, E.; Guggenberger, G.; Marschner, B.; Flessa, H. Stabilization of organic matter in temperate soils: Mechanisms and their relevance under different soil conditions—A review. Eur. J. Soil Sci. 2006, 57, 426–445. [Google Scholar] [CrossRef]
- Von Lützow, M.; Kögel-Knabner, I.; Ekschmitt, K.; Flessa, H.; Guggenberger, G.; Matzner, E.; Marschner, B. SOM fractionation methods: Relevance to functional pools and to stabilization mechanisms. Soil Biol. Biochem. 2007, 39, 2183–2207. [Google Scholar] [CrossRef]
- Kleber, M.; Sollins, P.; Sutton, R. A conceptual model of organo-mineral interactions in soils: Self-assembly of organic molecular fragments into zonal structures on mineral surfaces. Biogeochemistry 2007, 85, 9–24. [Google Scholar] [CrossRef]
- Moni, C.; Derrien, D.; Hatton, P.-J.; Zeller, B.; Kleber, M. Density fractions versus size separates: Does physical fractionation isolate functional soil compartments? Biogeosciences 2012, 9, 5181–5197. [Google Scholar] [CrossRef] [Green Version]
- De Kimpe, C.; Laverdière, M.; Martel, Y. Surface area and exchange capacity of clay in relation to the mineralogical composition of gleysolic soils. Can. J. Soil Sci. 1979, 59, 341–347. [Google Scholar] [CrossRef]
- Monreal, C.M.; Schulten, H.-R.; Kodama, H. Age, turnover and molecular diversity of soil organic matter in aggregates of a Gleysol. Can. J. Soil Sci. 1997, 77, 379–388. [Google Scholar] [CrossRef] [Green Version]
- Hassink, J. The capacity of soils to preserve organic C and N by their association with clay and silt particles. Plant Soil 1997, 191, 77–87. [Google Scholar] [CrossRef]
- Carter, M.R.; Angers, D.A.; Gregorich, E.G.; Bolinder, M.A. Characterizing organic matter retention for surface soils in eastern Canada using density and particle size fractions. Can. J. Soil Sci. 2003, 83, 11–23. [Google Scholar] [CrossRef]
- Sollins, P.; Swanston, C.; Kleber, M.; Filley, T.; Kramer, M.; Crow, S.; Caldwell, B.A.; Lajtha, K.; Bowden, R. Organic C and N stabilization in a forest soil: Evidence from sequential density fractionation. Soil Biol. Biochem. 2006, 38, 3313–3324. [Google Scholar] [CrossRef] [Green Version]
- Gunina, A.; Kuzyakov, Y. Pathways of litter C by formation of aggregates and SOM density fractions: Implications from 13C natural abundance. Soil Biol. Biochem. 2014, 71, 95–104. [Google Scholar] [CrossRef]
- Basile-Doelsch, I.; Amundson, R.; Stone, W.E.E.; Borschneck, D. Mineral control of carbon pools in a volcanic soil horizon. Geoderma 2007, 137, 477–489. [Google Scholar] [CrossRef]
- Basile-Doelsch, I.; Brun, T.; Borschneck, D.; Masion, A.; Marol, C.; Balesdent, J. Effect of landuse on organic matter stabilized in organomineral complexes: A study combining density fractionation, mineralogy and δ 13 C. Geoderma 2009, 151, 77–86. [Google Scholar] [CrossRef]
- Gregorich, E.G.; Carter, M.R.; Angers, D.A.; Drury, C.F. Using a sequential density and particle-size fractionation to evaluate carbon and nitrogen storage in the profile of tilled and no-till soils in eastern Canada. Can. J. Soil Sci. 2009, 89, 255–267. [Google Scholar] [CrossRef]
- Poirier, V.; Angers, D.A.; Whalen, J.K. Formation of millimetric-scale aggregates and associated retention of 13C-15N-labelled residues are greater in subsoil than topsoil. Soil Biol. Biochem. 2014, 75, 45–53. [Google Scholar] [CrossRef]
- Stewart, C.; Paustian, K.; Conant, R.; Plante, A.; Six, J. Soil carbon saturation: Evaluation and corroboration by long-term incubations. Soil Biol. Biochem. 2008, 40, 1741–1750. [Google Scholar] [CrossRef]
- Poirier, V.; Angers, D.A.; Rochette, P.; Whalen, J.K. Initial soil organic carbon concentration influences the short-term retention of crop-residue carbon in the fine fraction of a heavy clay soil. Biol. Fertil. Soils 2013, 49, 527–535. [Google Scholar] [CrossRef]
- Kaiser, K.; Guggenberger, G. Mineral surfaces and soil organic matter. Eur. J. Soil Sci. 2003, 54, 219–236. [Google Scholar] [CrossRef] [Green Version]
- Lorenz, K.; Lal, R. The depth distribution of soil organic carbon in relation to land use and management and the potential of carbon sequestration in subsoil horizons. Adv. Agron. 2005, 88, 35–66. [Google Scholar]
- IUSSS Working Group WRB. World Reference Base for Soil Resources, 2nd ed.; World Soil Resources Report No. 103; FAO: Rome, Italy, 2006; ISBN 9251055114. [Google Scholar]
- Soil Classification Working Group. The Canadian System of Soil Classification, 3rd ed.; Agriculture and Agri-Food Canada Publication No. 1646; National Research Council of Canada: Ottawa, ON, USA, 1998. [Google Scholar]
- Pangea, U.K. LST Fastfloat—Technical Brochure; Chippenham: Wilts, UK, 2006. [Google Scholar]
- X’Pert High Score Software, version 3.0; PANalytical B.V.: Alamo, The Netherlands, 2009.
- SAS/STAT for Windos, version 9.2; SAS Institute Inc.: Cary, NC, USA, 2002.
- SigmaPlot for Windows, version 13.0; Systat Software Inc.: San Jose, CA, USA, 2014.
- Gregorich, E.G.; Beare, M.H.; Mckim, U.F.; Skjemstad, J.O. Chemical and biological characteristics of physically uncomplexed organic matter. Soil Sci. Soc. Am. J. 2006, 70, 975–985. [Google Scholar] [CrossRef]
- Ludwig, M.; Achtenhagen, J.; Miltner, A.; Eckhardt, K.; Leinweber, P.; Emmerling, C.; Thiele-Bruhn, S. Microbial contribution to SOM quantity and quality in density fractions of temperate arable soils. Soil Biol. Biochem. 2015, 81, 311–322. [Google Scholar] [CrossRef]
- Sollins, P.; Kramer, M.G.; Swanston, C.; Lajtha, K.; Filley, T.; Aufdenkampe, A.K.; Wagai, R.; Bowden, R.D. Sequential density fractionation across soils of contrasting mineralogy: Evidence for both microbial- and mineral-controlled soil organic matter stabilization. Biogeochemistry 2009, 96, 209–231. [Google Scholar] [CrossRef]
- Bonnard, P.; Basile-Doelsch, I.; Balesdent, J.; Masion, A.; Borschneck, D.; Arrouays, D. Organic matter content and features related to associated mineral fractions in an acid, loamy soil. Eur. J. Soil Sci. 2012, 63, 625–636. [Google Scholar] [CrossRef]
- Swanston, C.; Torn, M.; Hanson, P.; Southon, J.; Garten, C.; Hanlon, E.; Ganio, L. Initial characterization of processes of soil carbon stabilization using forest stand-level radiocarbon enrichment. Geoderma 2005, 128, 52–62. [Google Scholar] [CrossRef] [Green Version]
- Plante, A.; Virto, I.; Malhi, S. Pedogenic, mineralogical and land-use controls on organic carbon stabilization in two contrasting soils. Can. J. Soil Sci. 2010, 90, 15–26. [Google Scholar] [CrossRef]
- Martel, Y.; De Kimpe, C.; Laverdière, M. Cation-exchange capacity of clay-rich soils in relation to organic matter, mineral composition and surface area. Soil Sci. Soc. Am. J. 1978, 42, 764–767. [Google Scholar] [CrossRef]
- Rasse, D.; Rumpel, C.; Dignac, M.-F. Is soil carbon mostly root carbon? Mechanisms for a specific stabilisation. Plant Soil 2005, 269, 341–356. [Google Scholar] [CrossRef]
- Castellano, M.J.; Kaye, J.P.; Lin, H.; Schmidt, J.P. Linking carbon saturation concepts to nitrogen saturation and retention. Ecosystems 2012, 15, 175–187. [Google Scholar] [CrossRef]
- Kodama, H. Clay minerals in Canadian soils: Their origin, distribution and alteration. Can. J. Soil Sci. 1979, 59, 37–58. [Google Scholar] [CrossRef]
- Kodama, H.; Nelson, S.; Yang, A.; Kohyama, N. Mineralogy of rhizospheric and non-rhizospheric soils in corn fields. Clays Clay Miner. 1994, 42, 755–763. [Google Scholar] [CrossRef]
- Sarkar, B.; Singh, M.; Mandal, S.; Churchman, G.J.; Bolan, N.S. Clay minerals-organic matter interactions in relation to carbon stabilization in soils. In The Future of Soil Carbon: Its Conservation and Formation; Garcia, C., Nannipieri, P., Hernandez, T., Eds.; Elsevier Inc.: Amsterdam, The Netherlands, 2018; pp. 71–86. ISBN 9780128116876. [Google Scholar]
- Brady, N.; Weil, R. Elements of the Nature and Properties of Soils, 2nd ed.; Pearson Education: Upper Saddle River, NJ, USA, 2004. [Google Scholar]
- Wilson, M.J. The origin and formation of clay minerals in soils: Past, present and future perspectives. Clay Miner. 1999, 34, 7–25. [Google Scholar] [CrossRef]
- Churchman, G.J. Is the geological concept of clay minerals appropriate for soil science? A literature-based and philosophical analysis. Phys. Chem. Earth 2010, 35, 927–940. [Google Scholar] [CrossRef]
- Feng, X.; Simpson, A.; Simpson, M. Chemical and mineralogical controls on humic acid sorption to clay mineral surfaces. Org. Geochem. 2005, 36, 1553–1566. [Google Scholar] [CrossRef]
- Block, K.A.; Trusiak, A.; Katz, A.; Alimova, A.; Wei, H.; Gottlieb, P.; Steiner, J.C. Applied Clay Science Exfoliation and intercalation of montmorillonite by small peptides. Appl. Clay Sci. 2015, 107, 173–181. [Google Scholar] [CrossRef] [Green Version]
- Jindaluang, W.; Kheoruenromne, I.; Suddhiprakarn, A.; Pal Singh, B.; Singh, B. Influence of soil texture and mineralogy on organic matter content and composition in physically separated fractions soils of Thailand. Geoderma 2013, 195–196, 207–219. [Google Scholar] [CrossRef]
- Singh, B.P.; Hatton, B.J.; Singh, B.; Cowie, A.L.; Kathuria, A. Influence of Biochars on Nitrous Oxide Emission and Nitrogen Leaching from Two Contrasting Soils. J. Environ. Qual. 2010, 39, 1224. [Google Scholar] [CrossRef]
- Vogel, C.; Heister, K.; Buegger, F.; Tanuwidjaja, I.; Haug, S.; Schloter, M.; Kögel-knabner, I. Clay mineral composition modifies decomposition and sequestration of organic carbon and nitrogen in fine soil fractions. Biol. Fertil. Soils 2015, 51, 427–442. [Google Scholar] [CrossRef]
- Hatton, P.-J.; Remusat, L.; Zeller, B.; Brewer, E.A.; Derrien, D. NanoSIMS investigation of glycine-derived C and N retention with soil organo-mineral associations. Biogeochemistry 2015, 125, 303–313. [Google Scholar] [CrossRef]
- Hatton, P.-J.; Bodé, S.; Angeli, N.; Boeckx, P.; Zeller, B.; Boiry, S.; Gelhaye, L.; Derrien, D. Assimilation and accumulation of C by fungi and bacteria attached to soil density fractions. Soil Biol. Biochem. 2014, 79, 132–139. [Google Scholar] [CrossRef]
- Baldock, J.; Nelson, P. Soil organic matter. In Handbook of Soil Science; Summer, M., Ed.; CRC Press: New York, NY, USA, 1999; pp. B25–B84. [Google Scholar]
- Chenu, C.; Plante, A. Clay-sized organo-mineral complexes in a cultivation chronosequence: Revisiting the concept of the “primary organo-mineral complex”. Eur. J. Soil Sci. 2006, 57, 596–607. [Google Scholar] [CrossRef]
- Battey, M. Mineralogy for Students; Hafner Press: New York, NY, USA, 1972. [Google Scholar]
- Barthelmy, D. Webmineral—Mineralogy Database. Available online: http://www.webmineral.com (accessed on 10 July 2018).
- Deer, W.; Howie, R.; Zussman, J. An Introduction to the Rock-Forming Minerals; Longman: London, UK, 1966. [Google Scholar]
- Fischenner, R. Données Des Principales Espèces Minérales; Société de l’industrie minérale: St-Étienne (Loire), France, 1977. [Google Scholar]
- Jouenne, C. Céramique Générale—Notions de physico-chimie. Tome 1; Gauthier-Villars: Paris, France, 1960. (In French) [Google Scholar]
- Mincryst Crystallographic and Crystallochemical Database for Minerals and Their Structural Analogues. Available online: http://database.iem.ac.ru/mincryst (accessed on 10 July 2018).
- Mindat Mineral and Locality Database. Available online: http://www.mindat.org (accessed on 10 July 2018).


| Density Fractions (g cm−3) | Distribution of Residue C (%) | Distribution of Residue N (%) | C/N | Residue C-to- Residue N Ratio | ||||
|---|---|---|---|---|---|---|---|---|
| Topsoil | Subsoil | Topsoil | Subsoil | Topsoil | Subsoil | Topsoil | Subsoil | |
| NOLF 1 | 45.7 Aa3 | 40.5 Aa | 16.7 Aa | 18.8 Aa | 21.6 Aa | 19.2 Ba | 35.7 Aa | 30.5 Aa |
| OLF 2 | 24.9 Ab | 20.8 Bb | 15.1 Aa | 15.1 Aa | 18.7 Ab | 14.2 Bb | 21.6 Ab | 19.4 Ab |
| 1.9–2.1 | 1.0 Ad | 1.4 Ad | 1.1 Ac | 1.7 Ab | 15.4 Ac | 9.8 Bc | 12.1 Ad | 11.1 Ac |
| 2.1–2.3 | 0.8 Ae | 0.8 Ae | 0.9 Ac | 1.1 Ad | 12.7 Ad | 9.7 Bc | 10.9 Ae | 10.2 Ac |
| 2.3–2.5 | 6.4 Ac | 0.7 Be | 8.1 Ab | 1.0 Bd | 9.5 Af | 10.1 Ac | 10.4 Ae | 9.8 Ac |
| 2.5–2.6 | 0.2 Bf | 7.4 Ac | 0.2 Bd | 11.0 Aa | 10.8 Ae | 7.4 Bd | 12.7 Acde | 9.4 Ac |
| >2.6 | 0.2 Bf | 0.4 Af | 0.2 Bd | 0.5 Ae | 9.4 Af | 7.9 Ad | 15.4 Ac | 10.7 Bc |
| All fractions | 79.2 A | 72.0 A | 42.1 A | 49.2 A | - | - | - | - |
© 2020 by the authors. Licensee MDPI, Basel, Switzerland. This article is an open access article distributed under the terms and conditions of the Creative Commons Attribution (CC BY) license (http://creativecommons.org/licenses/by/4.0/).
Share and Cite
Poirier, V.; Basile-Doelsch, I.; Balesdent, J.; Borschneck, D.; Whalen, J.K.; Angers, D.A. Organo-Mineral Interactions Are More Important for Organic Matter Retention in Subsoil Than Topsoil. Soil Syst. 2020, 4, 4. https://0-doi-org.brum.beds.ac.uk/10.3390/soilsystems4010004
Poirier V, Basile-Doelsch I, Balesdent J, Borschneck D, Whalen JK, Angers DA. Organo-Mineral Interactions Are More Important for Organic Matter Retention in Subsoil Than Topsoil. Soil Systems. 2020; 4(1):4. https://0-doi-org.brum.beds.ac.uk/10.3390/soilsystems4010004
Chicago/Turabian StylePoirier, Vincent, Isabelle Basile-Doelsch, Jérôme Balesdent, Daniel Borschneck, Joann K. Whalen, and Denis A. Angers. 2020. "Organo-Mineral Interactions Are More Important for Organic Matter Retention in Subsoil Than Topsoil" Soil Systems 4, no. 1: 4. https://0-doi-org.brum.beds.ac.uk/10.3390/soilsystems4010004