Article

Agronomic Practices for Reducing Soil Erosion in Hillside Vineyards under Atlantic Climatic Conditions (Galicia, Spain)

by
José M. Mirás-Avalos
1,2,*,
Juan M. Ramírez-Cuesta
1,
María Fandiño
3,
Javier J. Cancela
3 and
Diego S. Intrigliolo
1
1
Centro de Edafología y Biología Aplicada del Segura (CEBAS), Consejo Superior de Investigaciones Científicas (CSIC), Espinardo, 30100 Murcia, Spain
2
Unidad de Suelos y Riegos (asociada EEAD-CSIC), Centro de Investigación y Tecnología Agroalimentaria de Aragón (CITA), Montañana, 50059 Zaragoza, Spain
3
GI-1716. Departamento de Ingeniería Agroforestal. Escola Politécnica Superior de Enxeñaría, Universidade de Santiago de Compostela, Campus de Lugo, 27002 Lugo, Spain
*
Author to whom correspondence should be addressed.
Submission received: 13 February 2020 / Revised: 26 March 2020 / Accepted: 31 March 2020 / Published: 2 April 2020

Abstract

:
Water erosion is a severe threat to soil resources, especially on cultivated lands, such as vineyards, which are extremely susceptible to soil losses. In this context, management practices aiming at reducing erosion risks must be favored. This current study aimed at estimating soil losses in two vineyards under Atlantic climatic conditions (Galicia, North West Spain). The capacity of two management practices for reducing soil erosion was tested and compared with tilled soil in the inter-rows: (i) application of mulching, and (ii) maintaining native vegetation. Soil losses were assessed using erosion pins and micro-plots. In addition, the improved stock unearthing method (ISUM) was employed in one of the vineyards to estimate soil remobilization since plantation. Soil loss rates in one of the vineyards were lower when soil was managed under mulching (0.36 Mg ha−1) and native vegetation (0.42 Mg ha−1), compared to tilled soil (0.84 Mg ha−1). Sediment losses measured in the second vineyard ranged between 0.21 and 0.69 Mg ha−1, depending on the treatment, but no clear conclusions could be drawn. Long-term soil loss, as estimated by ISUM, was of the same order of magnitude than that obtained by erosion pins and micro-plots. In both vineyards, soil loss rates were lower than those registered in Mediterranean vineyards, and were below the limit for sustainable erosion in Europe. Nevertheless, soil management practices alternative to tillage in the inter-row might reduce erosion risks under Atlantic climate conditions.

1. Introduction

Water erosion on cultivated lands represents a severe threat to soil resources, affecting 12% of the emerged lands in Europe [1], and causing substantial environmental and economic losses [2]. In this context, the concept of tolerable soil erosion has been defined as “any actual erosion rate at which a deterioration or loss of one or more soil functions does not occur” [2].
For Europe, actual soil loss rates for cultivated lands are unsustainable, being 3 to 40 times greater than the upper threshold (1.4 Mg ha−1 year−1) [2]. Among cultivated lands, vineyards, especially in sloping terrains, are highly susceptible to erosion, with substantial soil losses as compared to other agricultural lands [3,4,5,6].
A great research effort has been devoted to quantify soil loss rates in vineyards from all over Europe, revealing a large variability depending on the soil type, climate conditions and management practices [7]. For instance, erosion rates ranged from 0.04 to 11.5 Mg ha−1 year−1 in Catalonia, Spain [8], and they were, approximately, 7.9 Mg ha−1 year−1 in Madrid, Spain [9], 11.2 Mg ha−1 year−1 in Piedmont, Italy [10], 23.0 Mg ha−1 year−1 in Burgundy, France [4], and up to 62.5 Mg ha−1 year−1 in Rhineland-Palatinate, Germany [11], or 88.7 Mg ha−1 year−1 in Sicily, Italy [12]. Most of these studies have been conducted in Mediterranean areas, being vineyards under Atlantic or continental climates less surveyed due to the perception of these vineyards suffering from lower erosion rates [13]. In order to reduce these unsustainable rates, the employment of cover crops in the vineyard inter-rows has been proposed as a means for soil protection [14,15].
Therefore, the aims of the current study were two-fold: first, to quantify the soil erosion rates in two vineyards from an Atlantic area (North West Spain), and second, to assess the efficiency of two management techniques (mulching and native vegetation) for reducing the risk of soil erosion. We hypothesized that erosion rates in these two vineyards would be lower than those reported for Mediterranean sites, and that employing cover crops or mulching would reduce soil loss rates when compared with tilled soil.

2. Materials and Methods

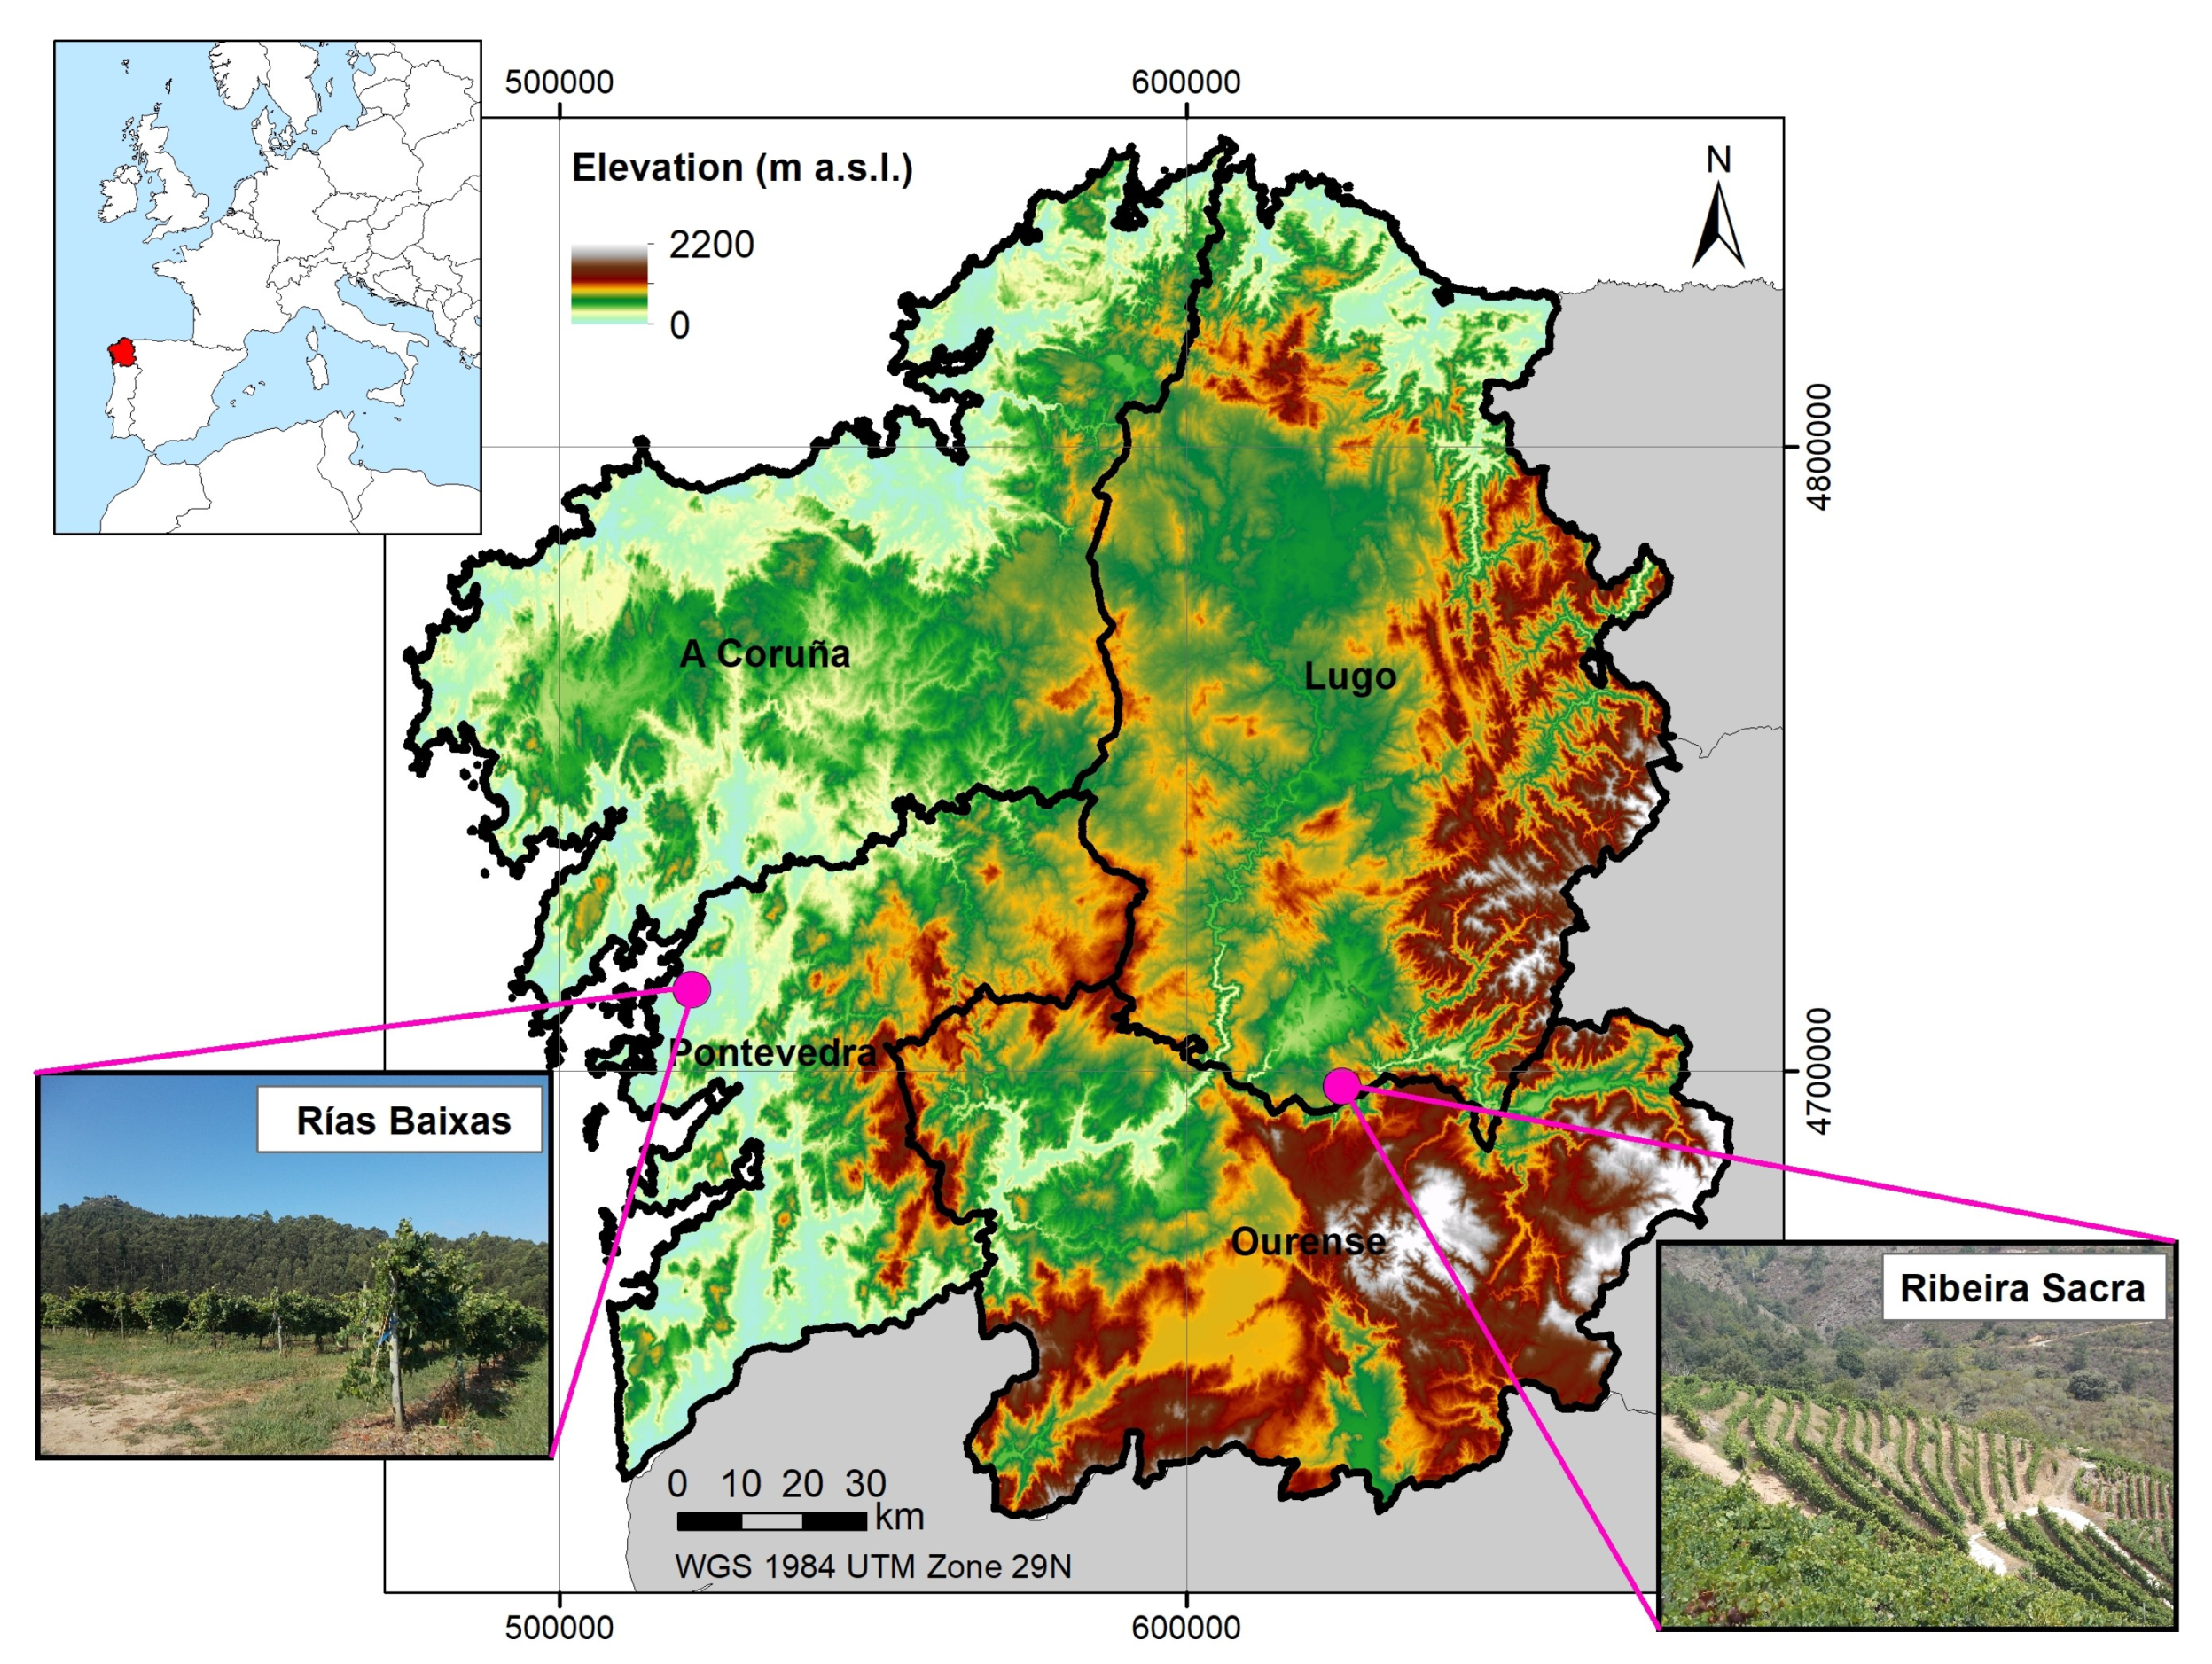
2.1. Description of the Experimental Sites

The experiments were conducted in two commercial vineyards (Figure 1), one of them planted on terraces within the Ribeira Sacra Designation of Origin (DO), and the other one planted without terraces, and following the slope direction in the Rías Baixas DO, both located in North West Spain.
The vineyard from Ribeira Sacra is located in Doade, a municipality in the South of the Lugo Province (42°24′36.9′’N, 7°28′26.38′’W, 500 m above sea level). The vines (Vitis vinifera L. cv. Mencía) are, approximately, 7 years old, and are established in terraces, with two vine rows per terrace, spaced 2 m between rows and 1 m between the vines. In general, this area presents an average annual rainfall around 800 mm, and the soil at this site is developed on schists, and it is classified as an Inceptisol [16]. Three treatments were established in this vineyard: a) No tillage (native vegetation grows in the inter-row), b) Tillage in the inter-row and c) Mulching in the inter-row (a mixture of straw and residues from Ulex europaeus L.). Each treatment had three replications, each at a different altitude (one replicate per terrace).
The vineyard from Rías Baixas is located in the municipality of Meis, in the Northwest of the Pontevedra Province (42°34′03′’N, 8°45′22′’W, 110 m above sea level). The vines (Vitis vinifera L. cv. Albariño) are, approximately, 14 years old, and are spaced 3 m between the rows and 2.5 m between the vines. In general, this area presents an average annual rainfall around 1500 mm, and the soil at this site is developed upon granite, and is classified as an Inceptisol [16]. Four treatments were established in this vineyard: a) Rain-fed without soil tillage, and rows oriented against the terrain slope (R-Against); b) Irrigated to cover 30% of the reference evapotranspiration (ETo) during July and August, without soil tillage (I-NT); c) Irrigated to cover 30% of ETo during July and August, with soil tillage and herbicide application, so as to maintain soil without the protection of a vegetal cover (I-ST); and d) Rain-fed without soil tillage, and rows oriented in favor of the terrain slope (R-Slope). Treatments were laid out following a randomized block design with three replications.

2.2. Soil and Climate Characterization of the Experimental Vineyards

At the beginning of the experiment, three samples from the soil surface layer (0–40 cm depth) were collected per experimental unit to characterize the soil in both vineyards. Its physical and chemical properties were determined following standard procedures [17].
For characterizing climate in both vineyards, data were collected from the nearest weather stations managed by MeteoGalicia (www.meteogalicia.gal) (‘Tremoedo’ in the case of Rías Baixas and ‘Ponte da Boga’ in the case of Ribeira Sacra). Data available from 2003 to 2017 were used for climate description at both sites. Apart from the description of the main weather variables, ETo and bioclimatic indices with relevance to viticulture were computed, including Huglin, cool night and dryness indices [18,19].

2.3. Soil Loss Quantification

2.3.1. Erosion Pins

In order to determine erosion rates in both vineyards, seven erosion pins per experimental unit (300 mm length, 7 mm diameter) were used as erosion markers, since they are the simplest and most effective method for monitoring the minute changes in the altitude of the ground surface which are due to erosion and deposition [20]. During May 2018, after two months since the last tilling practice, in both vineyards, pins were installed in the vine rows at regular intervals (5 m) following the slope of the terrain. The installation and measurement recommendations by Haigh [20] were taken into account. After installation, the initial height of the erosion pins (hi) was recorded using a flex measurement tape.
For each erosion pin, the difference (h) between the over-ground height at a given time (hf) and the initial value (hi) indicated the topographical change since pin installation, which is the soil erosion or deposition. The soil erosion volume was equal to the area multiplied by the plot length. For each vineyard, the soil bulk density was measured at 10 cm depth in one spot per experimental unit, using the core method [17] in order to transform the calculated volume into weight (Mg ha−1). Due to soil redistribution, patches of eroded and accumulated material were found. An area index (I) was calculated between two consecutive erosion pins using the following equation [12]:
I = h f , 1 h f , 1 + n h i , 1 + h i , 1 + n 2  
where hf,1 is the over-ground height of an erosion pin (cm) at the present time, and hf1+n is the height of the next erosion pin (cm) at lower elevation; the subscript i indicates the initial measurements of the above-ground height for each pin. Positive values for I represent soil erosion, while negative values indicate soil sedimentation [21].

2.3.2. Erosion Plots

To monitor the water and sediment yield over short time periods, two erosion plots (0.98 m long and 0.46 m wide: approximately, 0.5 m2) per treatment were installed in the inter-rows of the Rías Baixas vineyard. Installation was completed in early January 2019, when a couple of erosion plots were substituted due to the damage caused by machinery trafficking. These micro-plots consisted of three metal sheets on the sides, and a V-shaped metal structure on the lower side for sample collection [22], which was performed using 8 L plastic containers connected to the erosion plot by a tube. This kind of system has been proven useful for assessing runoff and sediment yields under several cover crops in steep vineyards in Spain [9]. Runoff samples were collected in 100 mL plastic jars to determine water and soil losses using a gravimetric method with oven drying [23].

2.3.3. Improved Stock Unearthing Method

In order to assess long-term soil losses in the Rías Baixas vineyard, we used a variant of the stock unearthing method (SUM). The SUM is based on the measurements of the vertical distance between frontal marks on the graft union (visible on grape vines) and the actual topsoil level [4]. At planting, all graft unions are located at 2 cm above the levelled surface of the soil to avoid the detrimental effects of soil moisture, freezing, or fungal infections [24]. The distance of the graft union in relation to the soil surface does not vary as a result of plant growth, and it is considered a fixed position [4]. Therefore, changes in the distance between the grafting point and the soil surface are assumed to be consequence of micro-topographical changes, namely soil depletion or the accumulation of sediments [25]. The main limitation of SUM is the assumption that the topsoil surface between the vine rows remains constantly planar, without any measuring of the uncertainty due to roughness by rills, footpaths and wheel tracks [26]. In order to overcome this limitation, we employed the improved stock unearthing method (ISUM), which includes measures of topsoil level on three spots in the inter-row between two facing vine stocks [26].
In order to estimate soil losses which have occurred from vineyard plantation, by the end of the experiment, on 10th October 2019, the ISUM was applied to the vineyard located in Rías Baixas. From the vine stock graft union, an aluminum bar with one level attached to each side was put at a given height above the grafting point. This allowed for measuring both buried vine stocks (positive measures) and uncovered ones (negative measures). Two points at a distance of 0.75 m from the vines, and one directly in the middle (1.5 m) of the inter-row area, were also measured [24].
The measurements were always conducted by the same researcher in order to avoid any bias. When the surface had little steps or grass cover, we carefully levelled the surface with the nearby current topsoil level. After measuring the graft union, three more points were also measured. Therefore, for every paired vine, we obtained five different points. The survey was conducted on 13 paired rows distributed all over the vineyard, including those in which the treatments were imposed, in order to account for the spatial variability of this soil erosion. Depending upon the length of the vine rows, ISUM measurements were performed on 10 to 12 sections per row. In total, 670 points were measured. For final estimations, an addition of 2 cm, corresponding to the initial graft union distance to the soil, was applied to all measurements.
The total soil loss (Mg ha−1 yr−1) was estimated using the volume differences (m3) of soil. The volumes were computed by creating imaginary polygons, which were delimited as the distance between each graft union (3 m) and the average of point measures.
The height of this polygon corresponded to the distance between the botanic marks and the measured point within the inter-row [26]. Total soil loss was estimated from the erosion–deposition (ER) equation [27]:
E R = V o l × B D S t × A v
where the volume (Vol), the total area of the field (St), the age of the vines (Av; 15 years) and the bulk density (BD; 1.13 Mg m−3) were used as inputs.

2.4. Statistical Analysis

An analysis of variance considering the treatment imposed in the field as factor was used for assessing the differences among management practices in each vineyard. When necessary, the means were separated using the Tukey Honest Significant Difference test. Statistical tests were conducted within the R Statistical Environment v.3.6.1 [28].

3. Results

3.1. Climate and Soil Characterization of the Experimental Sites

The station (“Ponte da Boga”) located close to the Ribeira Sacra vineyard recorded an annual mean temperature of 13.0 °C for the period from 2003 to 2017. Annual rainfall and ETo amounted 786 and 1055 mm, respectively. If referred to the growing season (April to September), mean temperature, total rainfall and ETo were 17.1 °C, 239 mm and 806 mm, respectively. Huglin and cool night indices for this station are, respectively, 2028 °C and 11.9 °C. The dryness index is −20.96 mm, suggesting the existence of a drought period over the average growing season.
The station (“Tremoedo”) located close to the Rías Baixas vineyard recorded an annual mean temperature of 14.3 °C for the period from 2003 to 2017. Annual rainfall and ETo amounted 1433 and 948 mm, respectively. If referred to the growing season (April to September), mean temperature, total rainfall and ETo were 17.4 °C, 417 mm and 696 mm, respectively. Huglin and cool night indices for this station are, respectively, 1880 °C and 13.5 °C. The dryness index is 135.3 mm, indicating the absence of a drought period over the average growing season.
Concerning the soils from the two experimental vineyards, Table 1 summarizes their main physical and chemical properties.
The soil from the Rías Baixas vineyard has a sandy clay loam texture, whereas that from Ribeira Sacra is loamy. This difference in texture between the soils in the two experimental vineyards reflects in the bulk density, which was lower in Rías Baixas than in Ribeira Sacra. Both soils have a pH in water ranging from 4.9 to 6.0 (Table 1), so they are acid soils with no base saturation, and a very good solubility for iron.
The soils from both vineyards are mineral with a medium content in organic matter and low salinity (Table 1). The cation exchange capacity is low in the soil from Rías Baixas, and very low in that from Ribeira Sacra.

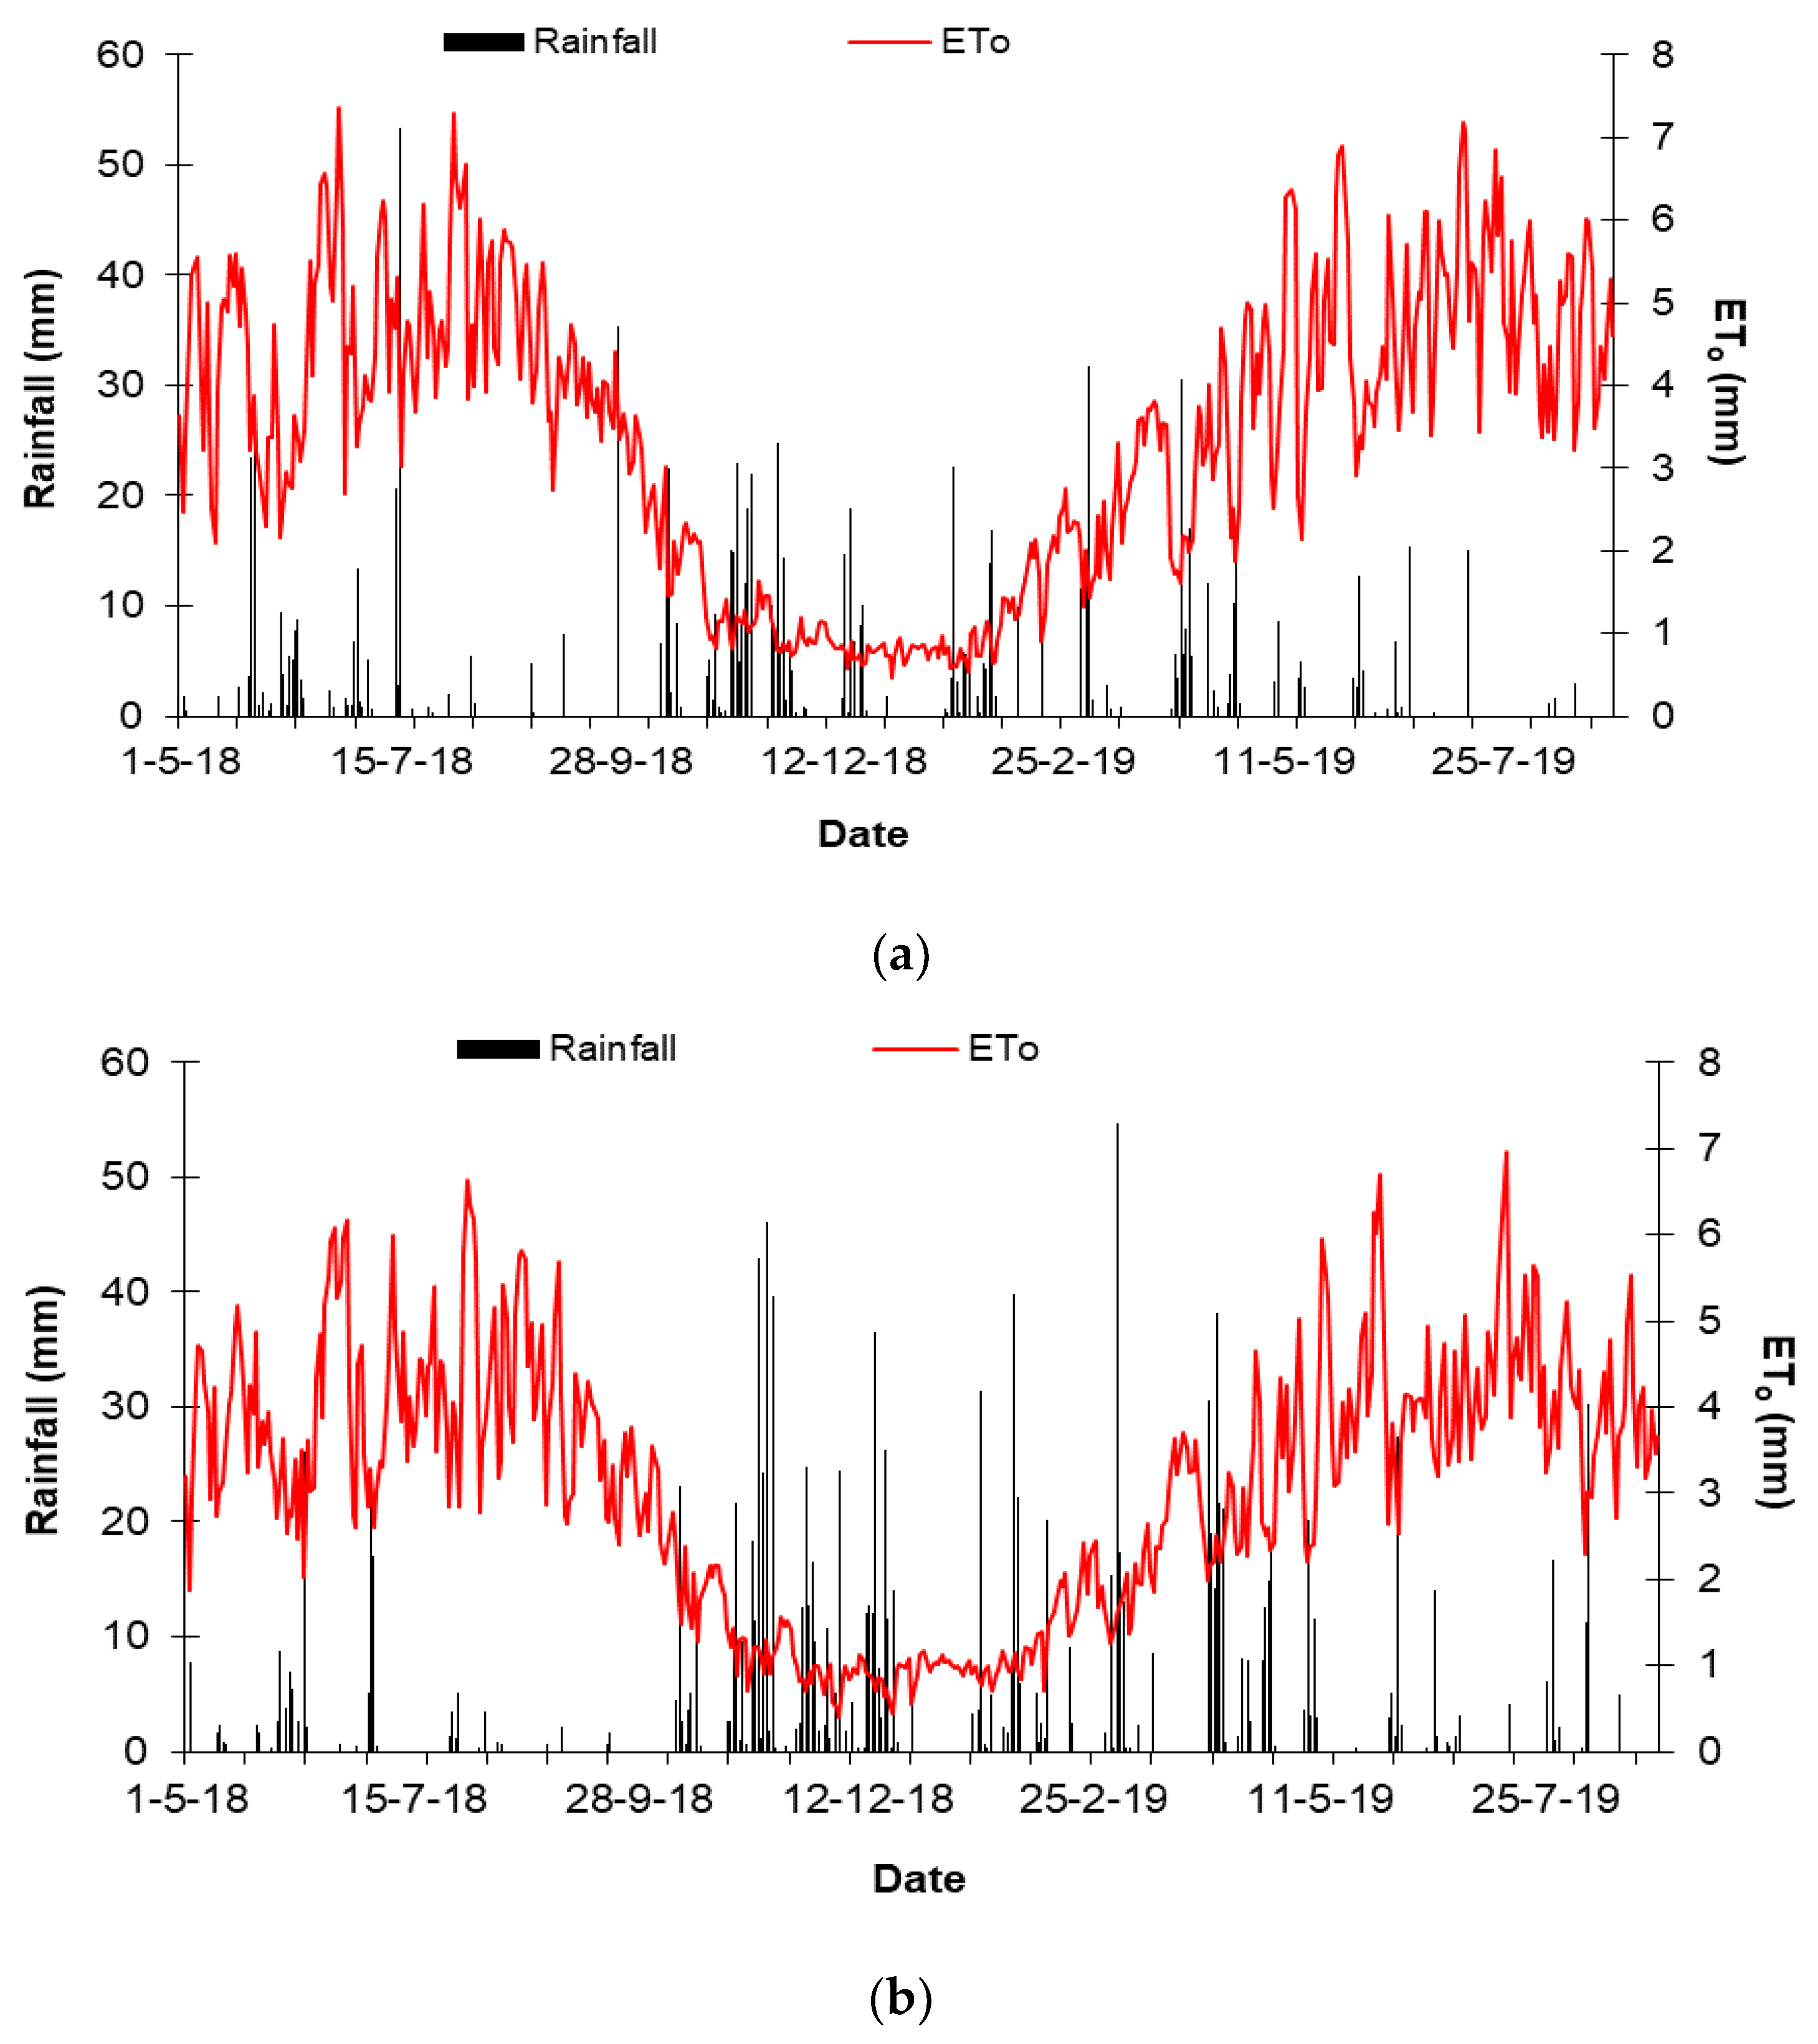
3.2. Weather Conditions over the Study Period

Over the study period, May 2018 to August 2019, 1004 and 1384 mm rainfall were registered in Ribeira Sacra and Rías Baixas, respectively. The distribution of this rainfall amounts over the study period differed between vineyards (Figure 2). In Ribeira Sacra, June and July 2018 were rainy, with daily events of more than 50 mm by mid-July. However, the magnitude of rainfall events was reduced, but their frequency increased between October 2018 and May 2019 (Figure 2a). In Rías Baixas, June and July 2018 were dry, with sporadic rainfall events. In contrast, the frequency and magnitude of rainfall events increased from October 2018 to May 2019, with several daily events surpassing 40 mm (Figure 2b). Evapotranspiration rates followed a similar pattern in both vineyards, although slightly higher values were observed in Ribeira Sacra (Figure 2).

3.3. Soil Loss Quantification
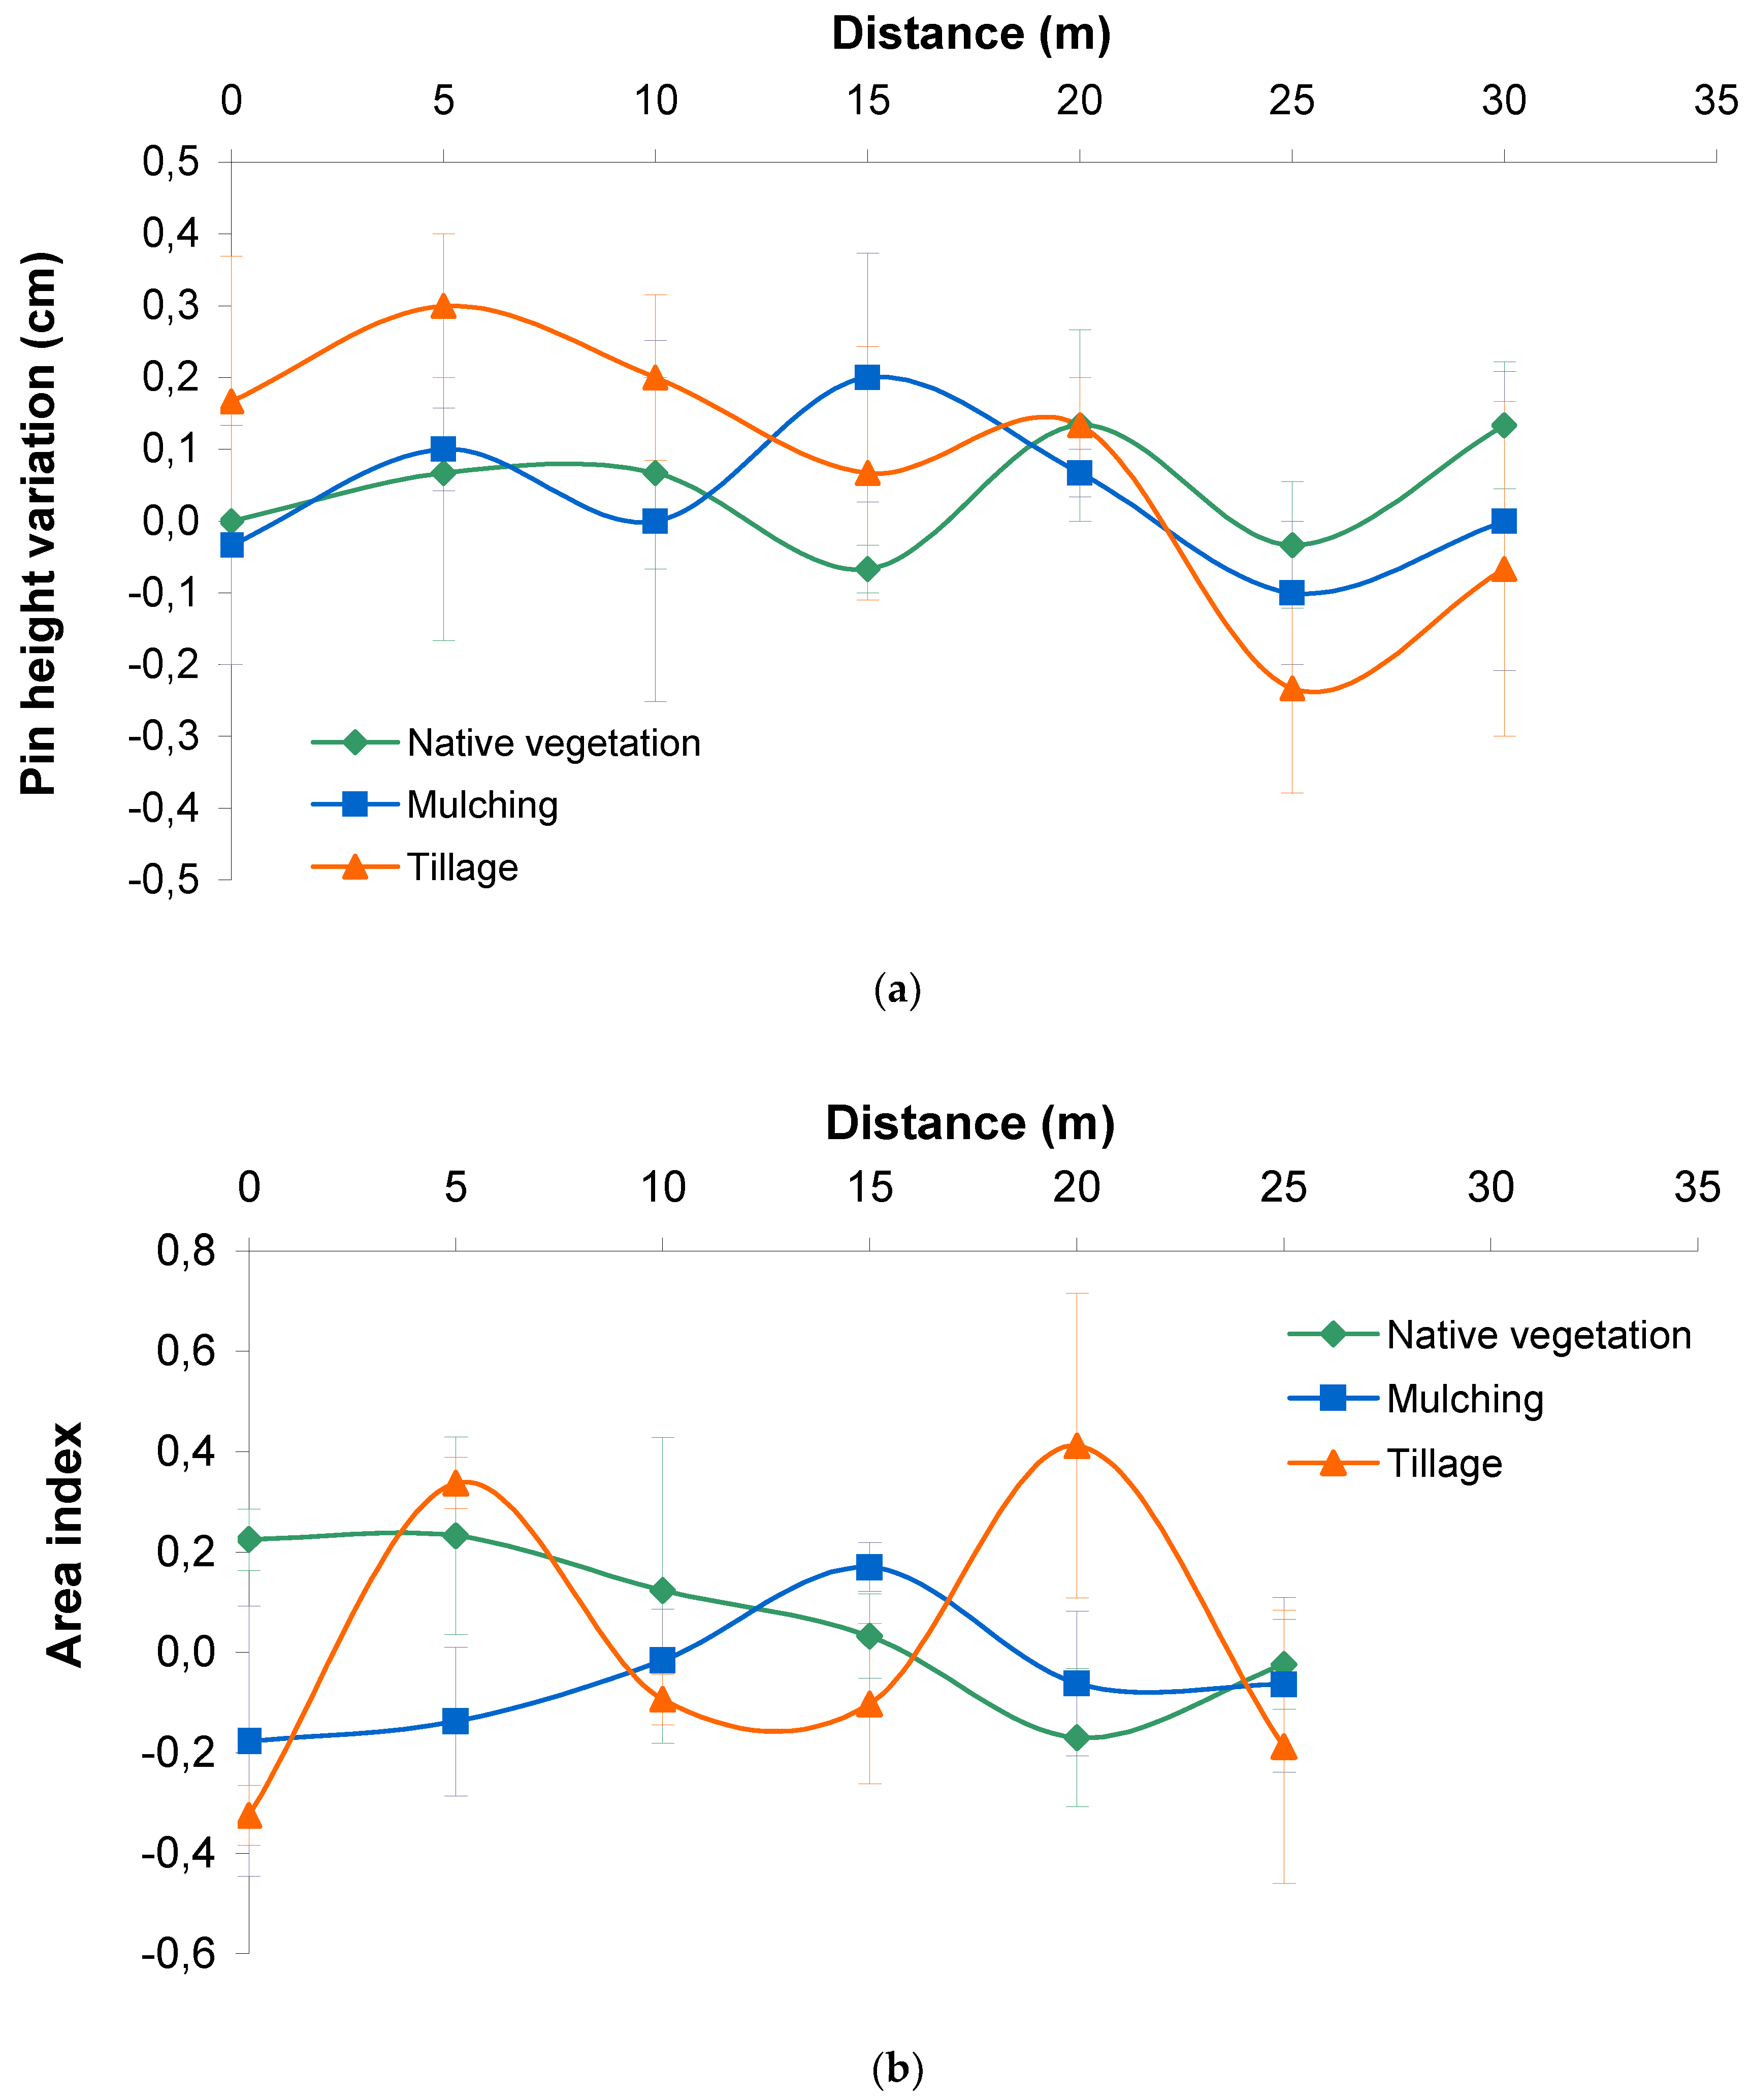
3.3.1. Erosion Pins

The differences between pin height at the installation date and at the end of the experiment for the Ribeira Sacra vineyard are illustrated in Figure 3. Pin height variation was not constant, showing high variability depending on the treatment and the terraces (Figure 3a). The area index was also highly variable, although mulching seemed to favor deposition processes when compared to the other treatments (negative values in Figure 3b), whereas tillage seemed to favor erosion (positive values in Figure 3b).
When extrapolated to the whole area surveyed in the Ribeira Sacra vineyard, soil erosion occurred in all the treatments considered, following the rank order expected: tillage (0.84 Mg ha−1), native vegetation (0.42 Mg ha−1) and mulching (0.36 Mg ha−1). However, due to the high variability among replications, no significant differences were detected among treatments.
In the Rías Baixas vineyard, the differences between pin heights at the beginning and end of the assessment period are illustrated in Figure 4. Pin height variation was not constant along the slope, but ranged from −0.6 to 0.7 cm, depending on the treatment (Figure 4a).
The area index ranged from −0.53 (deposition area) to 0.45 (erosion area), and was different among treatments (Figure 4b). Those treatments in which soil was covered by native vegetation recorded negative erosion rates, I-NT = −0.03 ± 0.03 Mg ha−1 and R-Against = −0.17 ± 0.00 Mg ha−1, except for R-Slope = 0.10 ± 0.02 Mg ha−1. In contrast, the treatment in which soil was tilled registered positive erosion rates: I-ST = 0.10 ± 0.01 Mg ha−1.

3.3.2. Erosion Plots

In those plots installed in May 2018, sediments and runoff samples were collected from mid-June 2018 to the end of August 2019, whereas in those installed in January 2019, samples were collected from the end of January to the end of August 2019 (Table 2). Therefore, precipitation over the plots differed, as displayed in Table 2, which divides the collections in four periods of, approximately, four months each, and differing in rainfall amounts (Table 2). Precipitation over the first period (12/06/2018 to 17/10/2018) amounted 109.4 mm, which were distributed in 24 days, with two events greater than 20 mm. Precipitation over the second period (17/10/2018 to 21/01/2019) amounted 561 mm, which were distributed in 53 days, with nine events greater than 20 mm. Precipitation over the third period (22/01/2019 to 29/04/2019) amounted 459 mm, which were distributed in 41 days, with eight events greater than 20 mm. Precipitation over the fourth period (30/04/2019 to 29/08/2019) amounted 180 mm, which were distributed in 27 days, with two events greater than 20 mm.
In the first period, despite being similar in runoff collected, R-Slope and I-NT treatments differed in the sediment yield, which was 30% greater in I-NT (13.3 versus 19.7 kg ha−1, for R-Slope and IN-T, respectively; Table 2). The I-ST treatment showed the highest runoff and sediment yields (5.59 L m−2 and 22.5 kg ha−1, respectively; Table 2). In the second period, runoff and sediment yield increased in all treatments, especially in I-NT, which reached sediment yield values of 340.4 kg ha−1 (Table 2). In the third period, sediment yields increased, except for the I-NT treatment, where they were of the same order of magnitude as in the former period (298.4 kg ha−1). It is noticeable as to the high value of runoff for the R-Against treatment (55.19 L m−2; Table 2).
Finally, the fourth period showed runoff and sediment yields similar to those of the first period (Table 2). Overall, runoff rates differed among treatments; however, sediment yield was similar in both rain-fed treatments (Table 2). The erosion under I-ST was 11% and 46% greater than that in the R-Slope and R-Against treatments, respectively. Surprisingly, sediment yields under the I-NT treatment were much higher than those observed in the rest of the treatments: 2.3, 2.6 and 3.4 times greater than under I-ST, R-Slope and R-Against, respectively.

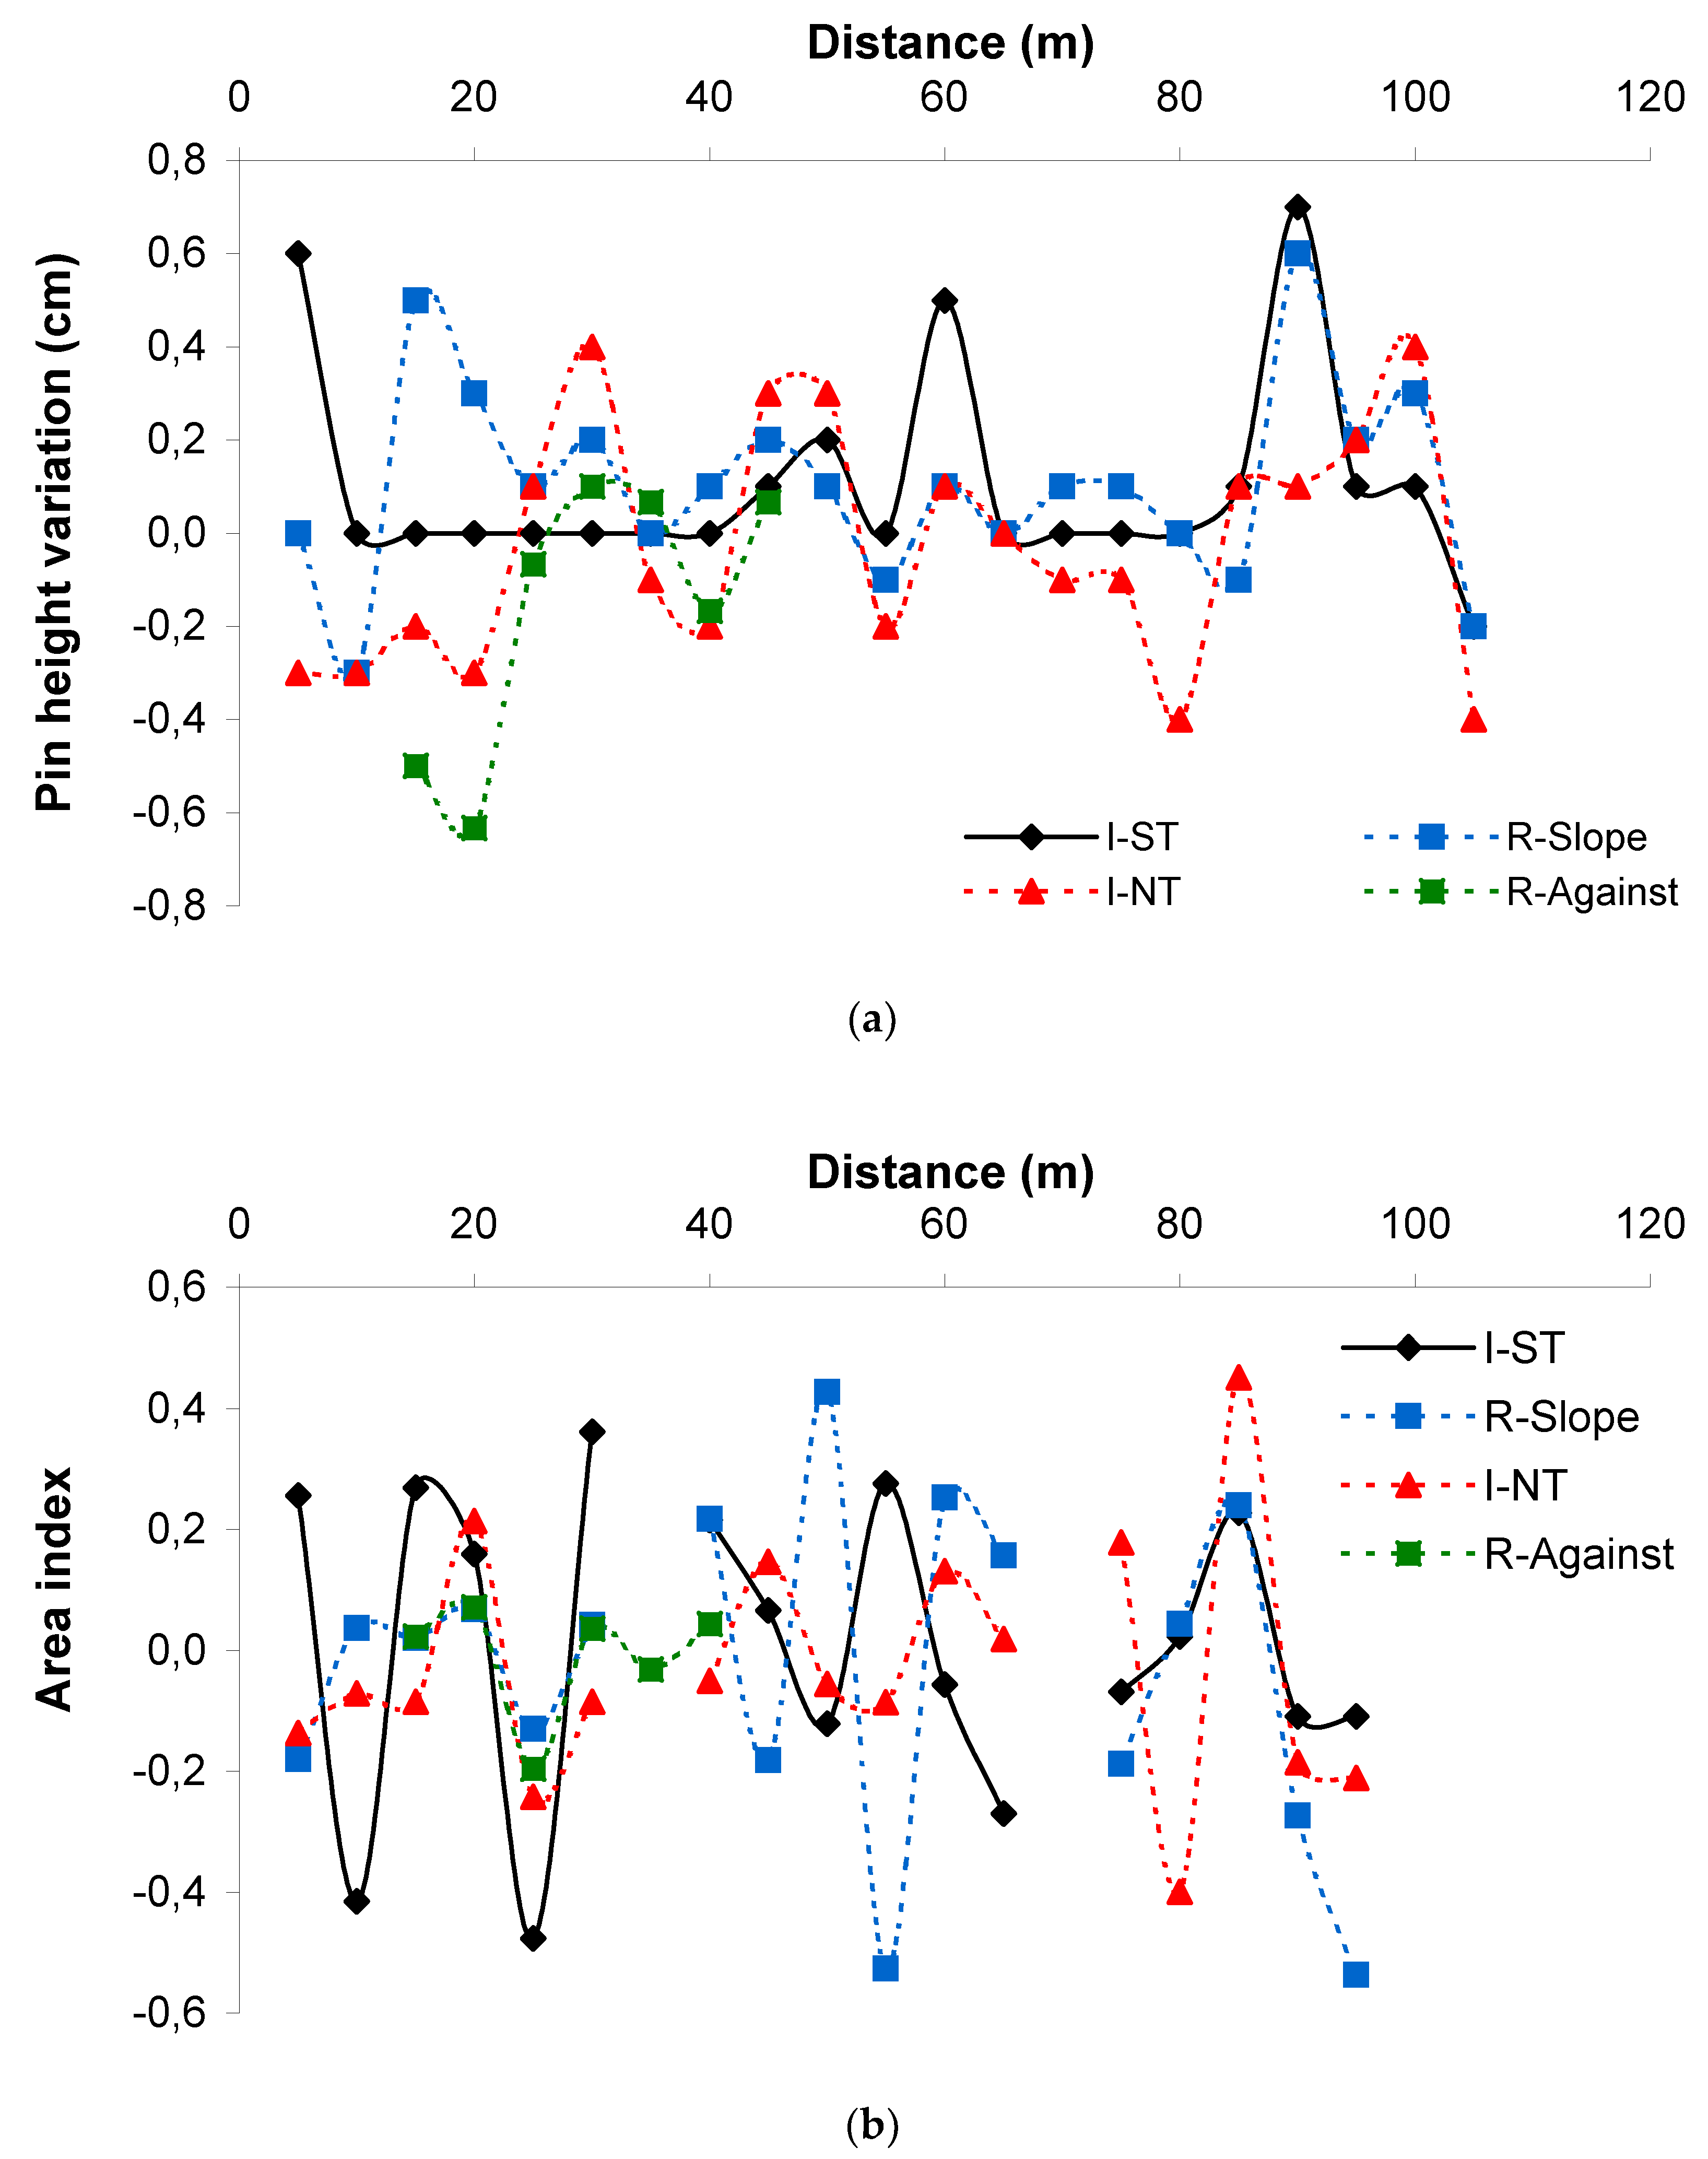
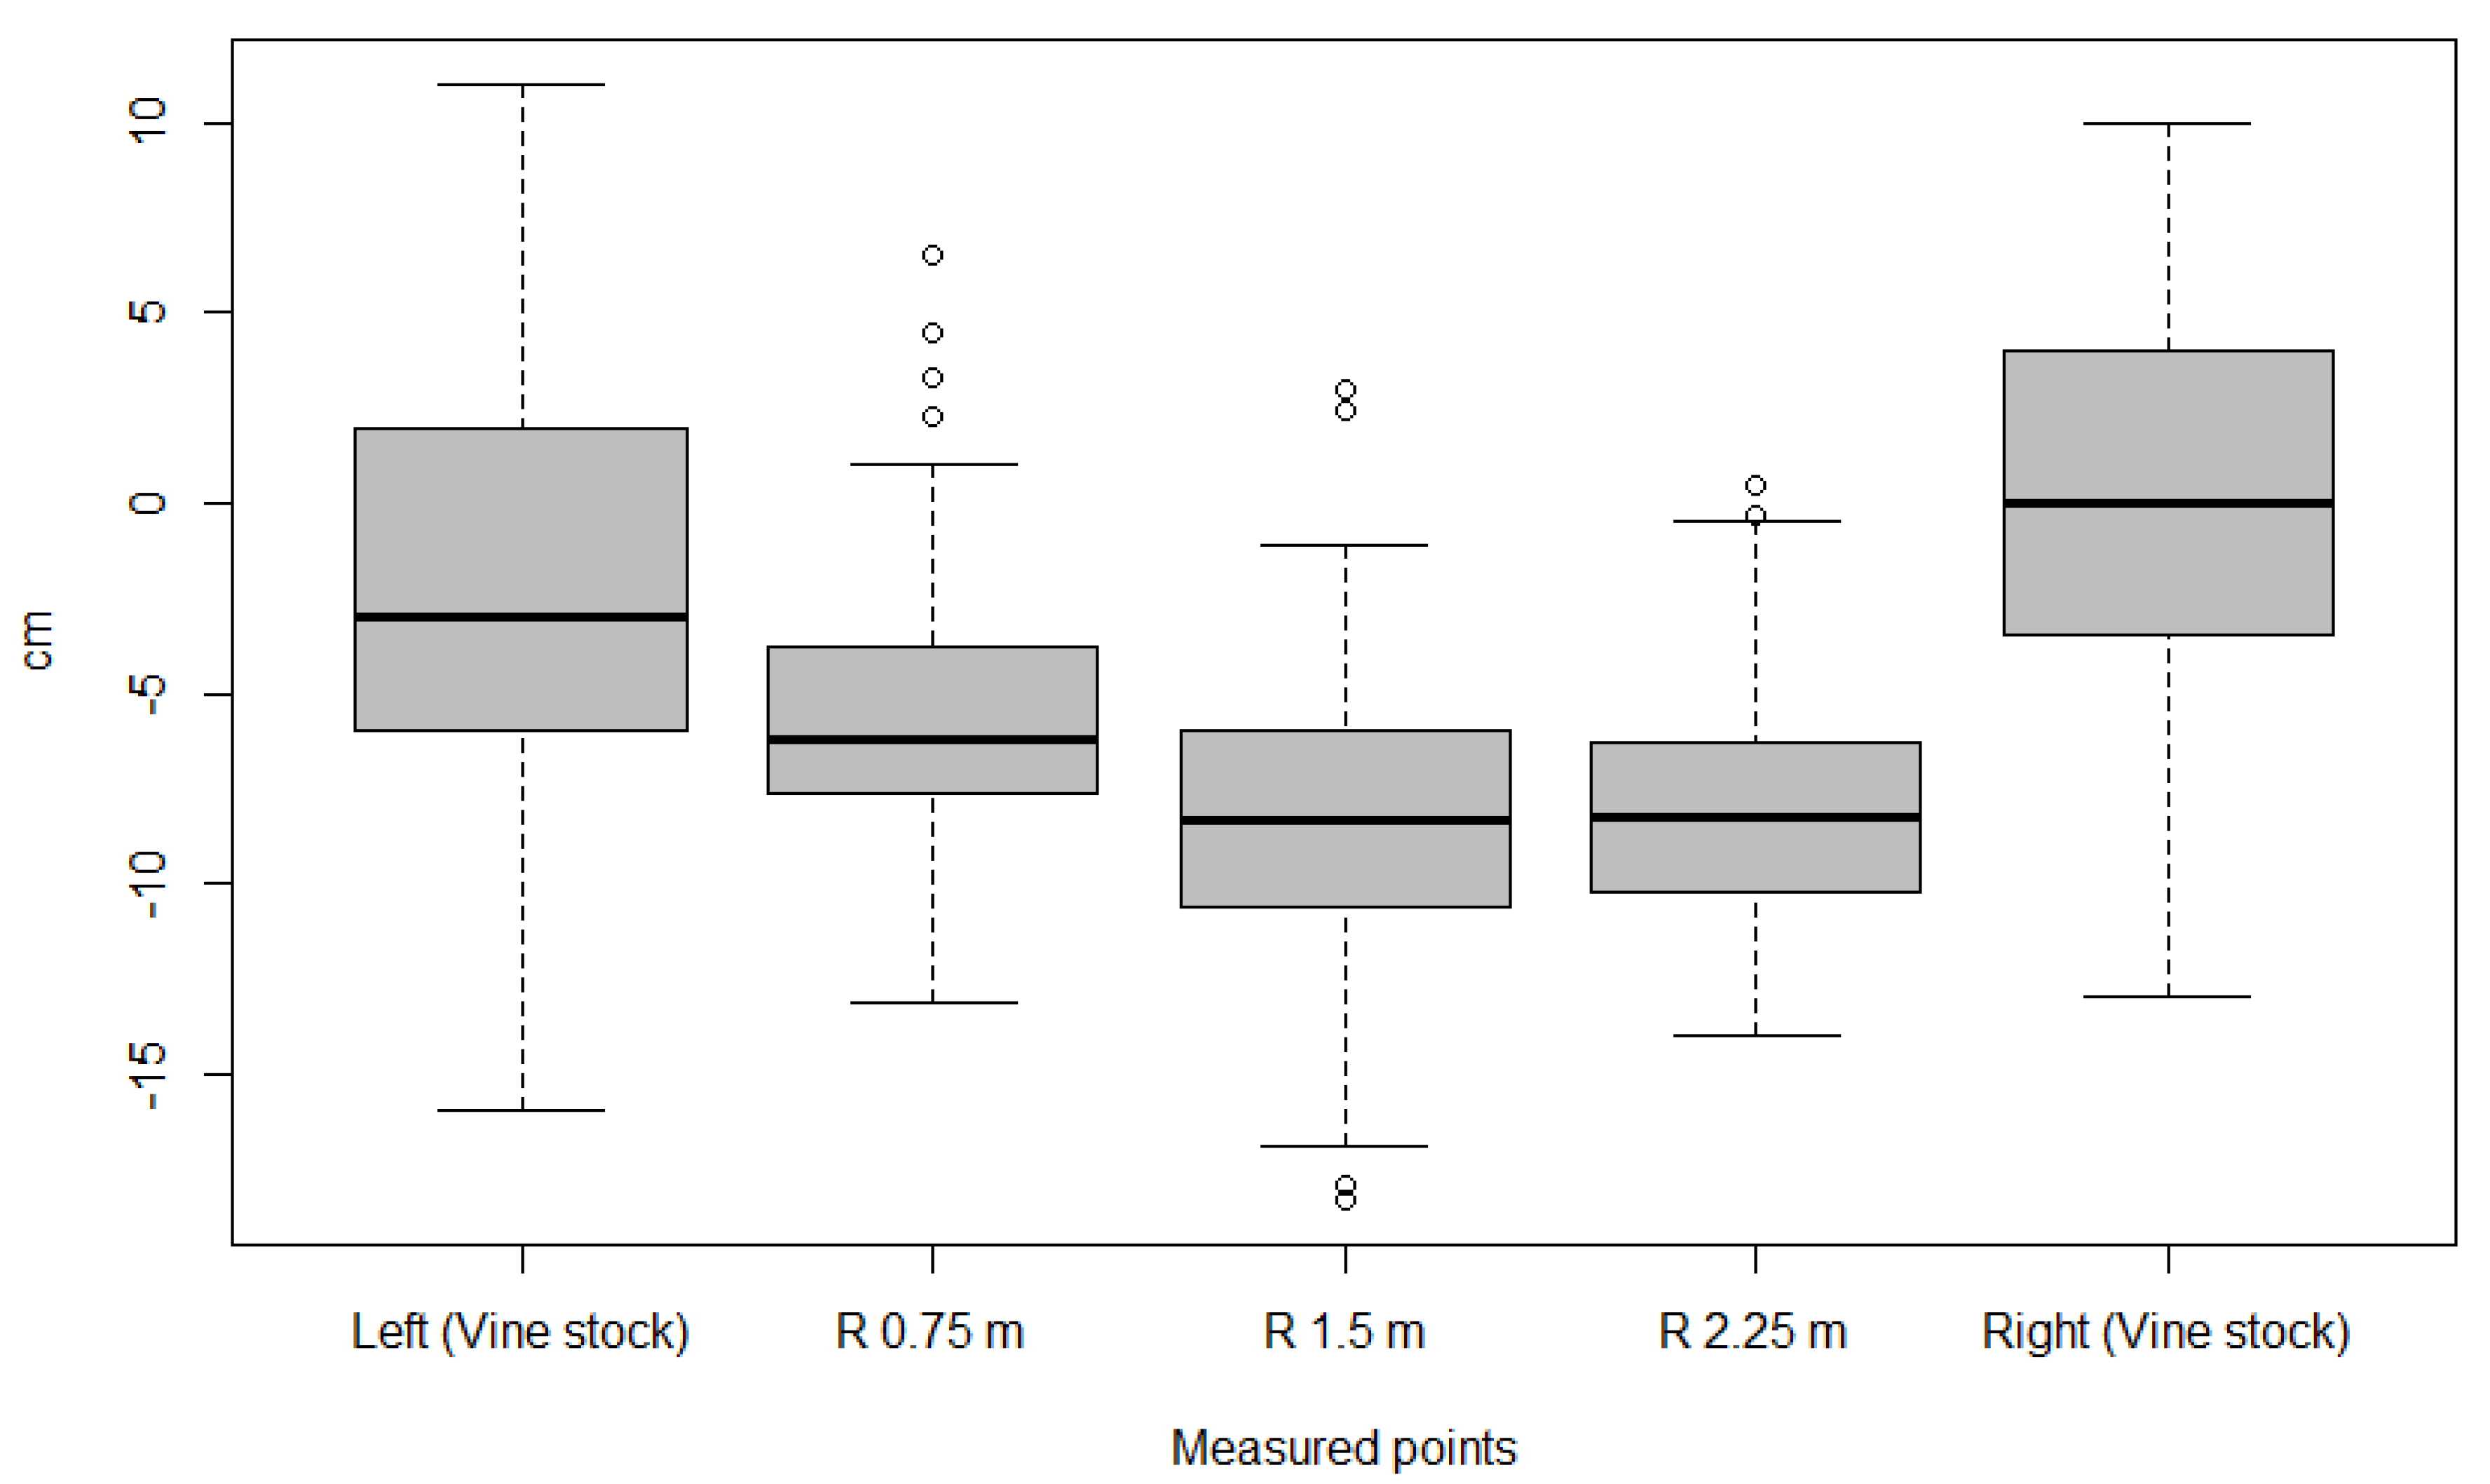
3.3.3. Improved Stock Unearthing Method

Figure 5 shows a box-plot summarizing the information obtained over the whole vineyard. A large variability was detected on these measurements, ranging from −16.9 to + 11.0 cm, especially in both vine stocks rather than in the inter-row. On average, right stocks presented neither soil sedimentation nor soil depletion (Figure 5). The rest of the positions surveyed along the inter-row and the left vine stocks tended to suffer from soil depletion (median values from −3.0 to −8.4 cm). In order to understand this variability, the vineyard was divided into three parts: northern, middle and southern. For doing this, the total of 66 vine rows in this vineyard were divided in three, thus 22 rows, and classified according to their position with respect to the North, thus 22 vine rows were located in the northern part, and 22 on the southern part of the vineyard; the remaining 22 rows were considered to be in the middle.
In the northern part, soil depletion (from −1.8 to −8.9 cm) predominated over sedimentation. In the middle part, soil erosion (−2.0 to −9.6 cm) predominated over sedimentation, although this process was predominant on the right vine stocks (+2.0 cm). Finally, a similar situation occurred on the southern part of the vineyard, where sedimentation predominated over erosion on the right vine stocks (+2.0 cm), whereas depletion (from −1.0 to −6.8 cm) occurred on the rest of the positions (data not shown). From these data, the erosion–deposition rate was calculated for each part of the vineyard.
On average, 0.36 Mg ha−1 year−1 were lost in this vineyard, since its establishment according to the ISUM approach. This indicates that, after 15 years since plantation, 5.40 Mg ha−1 of soil were lost, or redistributed. In this vineyard, the erosion rates diminished from north to south: 0.47, 0.40 and 0.17 Mg ha−1 year−1 for the northern, middle and southern parts, respectively.

4. Discussion

The erosion rates estimated for the Ribeira Sacra (ranging from 0.36 to 0.84 Mg ha−1) and Rías Baixas (from 0.10 to 0.36 Mg ha−1) vineyards are lower than those reported for Mediterranean regions [5,12,21,29,30]. Soil remobilization caused by works in the vine row or tractor passes in the row for applying phytosanitary products can cause overestimation of erosion rates [31]; therefore, we removed these effects when analyzing the data. In fact, erosion pins were protected as much as possible from the effects of machinery as mechanical practices are common in viticulture. For instance, in the Rías Baixas vineyard, tractor passes for tilling, mowing the inter-rows, applying herbicides in the row, fertilizing, canopy management and phytosanitary applications led to 30 passes of machinery from November 2018 to September 2019. Following the general recommendations for the use of erosion pins [20], data collection started after the pins had been in the soil for a period of three months, and then measurements were carried out every two months. This should have reduced the errors caused by soil disturbance due to pin installation, while providing an amount of data enough to accurately estimate erosion by reducing the effect of random errors [20]. In addition, the soil of this vineyard is sandy, with a relatively rapid consolidation after tillage or other disturbances, caused by fauna or machinery, due to a high hydraulic conductivity and low bulk density. However, soil consolidation per se has not been assessed in the current study.
Furthermore, because of the high rainfall regime within the experimental area, vegetation in the vine row existed in all treatments, despite being removed mechanically from time to time (five times since November 2018 to September 2019). This can also explain the low amounts of soil loss estimated, due to the fact that erosion pins were installed in the vine rows. Nevertheless, special care must be made when installing and maintaining these devices in the field, since they are susceptible to being moved, buried or even detached from the ground, when inter-row mechanical management practices are undertaken [31]. In this sense, employing botanical indicators or the pole method might be recommended [11,12,21]. Under the Atlantic conditions of the experimental vineyards, the soil is more protected than in arid areas where rainfall can limit natural vegetation growth, which explains the lower soil loss values observed in our study when compared with those referred to Mediterranean vineyards [5,12,21,29,30]. In conclusion, the estimated rates of soil loss were low for both vineyards, and they never surpassed the European threshold of tolerable soil erosion, estimated at 1.4 Mg ha−1 per year [2], despite the management treatment considered.
The scientific community agrees on the fact that vineyards are highly susceptible to erosion with substantial soil losses, and therefore they constitute a situation where soil susceptibility is threatened [3,4,6]. Under the current prevailing management practices, vineyards are not sustainable from the point of view of soil erosion [21]. In this context, the use of alternative practices, such as cover crops and mulching (both employed in the current study), should be used to prevent erosion [5,14,15]. The results from the current study showed that both alternatives are useful in reducing soil losses when compared to conventional management tilling the inter-rows, and confirmed other reports on the use of mulch in the vineyard inter-row for preventing erosion [32]. Furthermore, leaving some natural vegetation or sown cover crops within the vineyard’s inter-row may also bring additional benefits related to, for instance, an increase in biodiversity, particularly for crop protection against some pests, and improvements in soil quality [33]. In addition, cover crops can limit vegetative growth in humid areas, as the ones reported in the current study, which might enhance grape composition for premium wine production [34]. In contrast, tilling practices and the use of tractors increase the micro-topographical changes in the vineyard inter-rows [35] and the flow path, affecting connectivity processes [36] and soil erosion features such as rills [25]. For instance, the development of a ridge under the vines due to tillage reduced erosion rates at the slope scale, because the ridge reduced the connectivity of the flows [37], concentrating the geomorphological activity in the inter-rows, as observed in the current study in which the soil loss rates were greater when estimated by micro-plots in the inter-row than when estimated by erosion pins in the vine row. The ISUM methodology confirmed this observation, as soil depletion occurred mainly in the rows.
When considering the data from the erosion plots, surprisingly, the highest erosion rate was observed under irrigation with no-tillage (I-NT), likely due to the application of organic fertilizers and the labors to incorporate those fertilizers into the soil during the winter. Moreover, a trend to higher runoff rates under covered soil (R-Slope, I-NT), in comparison with the tilled system, was observed. This increase in runoff rates can be attributed to changes in soil permeability due to an increment in soil compaction and reduced soil macropores [38,39]. Nevertheless, the runoff and sediment loss rates observed in the current work were lower than those reported by Martínez Casasnovas and Ramos [30] for a vineyard in Cataluña, and those described by Ruiz-Colmenero et al. [15] in vineyards located in Madrid, and managed under different cover crops in the inter-row. Sediment loss rates observed by Novara et al. [21] referred only to winter months, and were much higher than the values reported here, which covered a whole year. In humid climates, Rodrigo-Comino et al. [11] reported soil loss rates higher than those found in this work, likely because the methodology employed was different, as well as the soil-climate conditions of their study site. Nevertheless, the soil losses estimated in the current work are lower than the threshold of tolerance estimated for European agricultural lands [2]. In addition, the use of soil erosion control measures (including mulching and cover crops in the inter-rows) might provide other ecosystem services apart from protecting soil against erosion, including the conservation of grape and wine quality [40,41].
It is important to highlight the noticeable disagreement between the soil loss rates estimated by either pins or erosion plots employed in the Rías Baixas vineyard, which differed in more than one order of magnitude. This disagreement among determination methods is common, as reviewed by Rodrigo-Comino [13], who showed a huge variation on the soil erosion rates provided by different estimation techniques, including erosion pins, plots and modeling. Differences can be caused by the sources of variation intervening in these approaches [42]. One explanation might be the fact that pins were installed in the vine rows, whereas the erosion plots were established in the middle of the rows, in which most erosion processes take place [26]. In this sense, pins were more protected against machinery traffic, and they were covered by vegetation most part of the growing season, which likely induced these lower erosion rates when estimated by pins. Moreover, vegetation was present in all treatments, except for certain periods. The percentage of cover was greater than 80%, limiting water runoff, but reduced to 20% in winter 2019 in which the application of organic fertilizers took place on the vineyard. Moreover, in the tilled treatment, vegetation cover was lower than 5% during certain periods of the year and the micro-topography of the soil surface might have played an important role in the connectivity processes at the pedon scale, leading to an increase in the runoff and soil depletion rates [43]. Therefore, understanding the advantages and limitations of the methodologies employed would help obtaining complementary results and more robust conclusions.
In the long-term, since the plantation of the vineyard (15 years ago), the erosion–deposition rate was, on average, 0.36 Mg ha−1 year−1 according to the ISUM approach [26], ranging from 0.47 to 0.17 Mg ha−1 year−1 between the northern and southern parts, respectively. In any case, the estimated rates are below the maximum tolerable threshold of soil loss reported for Europe [2]. Moreover, they were much lower than those reported for Mediterranean vineyards following the same methodology [24,26,29]. Moreover, the erosion rates observed with ISUM are of the same order of magnitude than those estimated with erosion pins and micro-plots, re-enforcing the results obtained. They were also similar to the rates reported for vineyards under conservative soil management practices [14,15,32]. It is interesting to notice that, when only using the vine stocks as reference, namely the SUM approach [4], soil loss rates differed from those estimated using ISUM. According to SUM, 0.09 Mg ha−1 year−1 were lost from this vineyard, which is 25% of the rate calculated using ISUM. This disagreement is caused by the fact that the SUM approach considers planar the inter-row, and most of the topographical changes within a vineyard occur in the inter-row, as previously reported [26].
Future work, including photogrammetric approaches using images captured by drones [44,45], could enhance the estimations obtained in the current study. These technologies provided successful results for mapping soil degradation in drylands, achieving a similar accuracy to conventional field mapping [44]. Nevertheless, geo-referencing and the geometric correction of images is imperative, requiring time, effort, a digital elevation model, and excellent ground control. The use of grid control points distributed over the study site and correctly geo-referenced might be a reasonable solution for achieving enough accuracy for employing drones in the estimation of soil erosion, as proven for monitoring gullies in Morocco [45]. However, current studies employing these technologies referred to relatively large erosion processes (gullies) in arid environments [44,45], which might not occur in vineyards in which vegetation might pose problems for analyzing the images acquired. Therefore, the use of drone-acquired images for assessing erosion processes in vineyards still remains an interrogation.

5. Conclusions

The current study showed that erosion rates in vineyards from North West Spain are low compared to those estimated for Mediterranean vineyards. However, the limit of tolerable soil erosion (1.4 Mg ha−1 year−1) can be reached under certain conditions, so measurements for reducing erosion risks should be implemented in the vineyards. The proposed actions (mulching, native vegetation in the inter-row) reduced considerably the rate of soil loss (up to 55%), especially in one of the vineyards studied. Certain practices, such as the incorporation of organic fertilizers into the soil prior to a period of rainfall, increased soil losses. A noticeable disagreement between the two short-term soil-loss estimation methods employed in the current study was detected, likely caused by the different sources of variation intervening in these approaches. Nevertheless, the improved stock unearthing method showed, for the long-term, soil loss rates of the same order of magnitude than those estimated by erosion pins and micro-plots. In conclusion, the use of soil management practices alternative to tillage (native vegetation, mulching) might reduce soil loss rates in vineyards from Atlantic regions.

Author Contributions

Conceptualization, J.M.M.-A., J.J.C. and D.S.I.; methodology, J.M.M.-A. and J.J.C.; formal analysis, J.M.M.-A., J.M.R.-C., M.F. and J.J.C.; investigation, J.M.M.-A., M.F. and J.J.C.; resources, J.J.C. and D.S.I.; data curation, J.M.M.-A. and J.M.R.-C.; writing—original draft preparation, all authors; writing—review and editing, all authors; supervision, J.J.C. and D.S.I.; project administration, D.S.I.; funding acquisition, D.S.I. All authors have read and agree to the published version of the manuscript.

Funding

This research was funded by Interreg Atlantic Area with European Regional Development Fund, grant number EAPA_272/2016 project Risk-AquaSoil.

Acknowledgments

The authors wish to express their gratitude to the Mar de Frades (Rías Baixas) and Regina Viarum (Ribeira Sacra) wineries for allowing them to perform the experiments within their vineyards, as well as for their collaboration in their maintenance.

Conflicts of Interest

The authors declare no conflict of interest. The funders had no role in the design of the study; in the collection, analyses, or interpretation of data; in the writing of the manuscript, or in the decision to publish the results.

References

  1. C.E.C. (Commission of the European Communities). Communication for the Commission to the Council, the European Parliament, the European Economic and Social Committee and the Committee of the Regions. Thematic Strategy for Soil Protection, 2006. Brussels, 22.9.2006. COM 2006, 231. Available online: http://eur-lex.europa.eu/legal-content/EN/TXT/PDF/?uri=CELEX:52006DC0231&from=EN (accessed on 1 April 2020).
  2. Verheijen, F.G.A.; Jones, R.J.A.; Rickson, R.J.; Smith, C.J. Tolerable versus actual soil erosion rates in Europe. Earth Sci. Rev. 2009, 94, 23–38. [Google Scholar] [CrossRef] [Green Version]
  3. Boardman, J.; Poesen, J. Soil Erosion in Europe; Wiley Editions: Chichester, UK, 2006. [Google Scholar]
  4. Brenot, J.; Quiquerez, A.; Petit, C.; Garcia, J.P. Erosion rates and sediment budgets in vineyards at 1-m resolution based on stock unearthing (Burgundy, France). Geomorphology 2008, 100, 345–355. [Google Scholar] [CrossRef]
  5. Prosdocimi, M.; Cerdà, A.; Tarolli, P. Soil water erosion on Mediterranean vineyards: A review. Catena 2016, 141, 1–21. [Google Scholar] [CrossRef]
  6. Ferreira, C.S.S.; Keizer, J.J.; Santos, L.M.B.; Serpa, D.; Silva, K.; Cerqueira, M.; Ferreira, A.J.D.; Abrantes, N. Runoff, sediment and nutrient exports from a Mediterranean vineyard under integrated production: An experiment at plot scale. Agric. Ecosyst. Environ. 2018, 256, 184–193. [Google Scholar] [CrossRef]
  7. Maetens, W.; Poesen, J.; Vanmaercke, M. How effective are soil conservation techniques in reducing plot runoff and soil loss in Europe and the Mediterranean? Earth Sci. Rev. 2012, 115, 21–36. [Google Scholar] [CrossRef] [Green Version]
  8. Ramos, M.C.; Martínez-Casasnovas, J.A. Nutrient losses by runoff in vineyards of the Mediterranean Alt Penedès region (NE Spain). Agric. Ecosyst. Environ. 2006, 113, 356–363. [Google Scholar] [CrossRef]
  9. Marques, M.J.; García-Muñoz, S.; Muñoz-Organero, G.; Bienes, R. Soil conservation beneath grass cover in hillside vineyards under Mediterrranean climatic conditions (Madrid, Spain). Land Degrad. Dev. 2010, 21, 122–131. [Google Scholar] [CrossRef]
  10. Biddoccu, M.; Ferraris, S.; Opsi, F.; Cavallo, E. Long-term monitoring of soil management effects on runoff and soil erosion in sloping vineyards in Alto Monferrato (North-West Italy). Soil Tillage Res. 2016, 155, 176–189. [Google Scholar] [CrossRef]
  11. Rodrigo-Comino, J.; Quiquerez, A.; Follain, S.; Raclot, D.; Le Bissonnais, Y.; Casalí, J.; Giménez, R.; Cerdà, A.; Keestra, S.D.; Brevik, E.C.; et al. Soil erosion in sloping vineyards assessed by using botanical indicators and sediment collectors in the Ruwer-Mosel valley. Agric. Ecosyst. Environ. 2016, 233, 158–170. [Google Scholar] [CrossRef]
  12. Novara, A.; Gristina, L.; Saladino, S.S.; Santoro, A.; Cerdà, A. Soil erosion assessment on tillage and alternative soil managements in a Sicilian vineyard. Soil Tillage Res. 2011, 117, 140–147. [Google Scholar] [CrossRef] [Green Version]
  13. Rodrigo-Comino, J. Five decades of soil erosion research in “terroir”. The State-of-the-Art. Earth Sci. Rev. 2018, 179, 436–447. [Google Scholar] [CrossRef]
  14. Durán-Zuazo, V.H.; Rodríguez-Pleguezuelo, C.R. Soil-erosion and runoff prevention by plant covers. A review. Agron. Sustain. Dev. 2008, 65–86. [Google Scholar] [CrossRef] [Green Version]
  15. Ruiz-Colmenero, M.; Bienes, R.; Marques, M.J. Soil and water conservation dilemmas associated with the use of green cover in steep vineyards. Soil Tillage Res. 2011, 117, 211–223. [Google Scholar] [CrossRef]
  16. Soil Survey Staff. Keys to Soil Taxonomy, 12th ed.; USDA-Natural Resources Conservation Service: Washington, DC, USA, 2014; p. 372.
  17. Carter, M.R.; Gregorich, E.G. (Eds.) Soil Sampling Methods of Analysis; Canadian Society of Soil Science: Pinawa, MB, Canada; CRC Press: Boca Raton, FL, USA, 2008; p. 1224. [Google Scholar]
  18. Hargreaves, G.H.; Samani, Z.A. Estimating potential evapotranspiration. J. Irrig. Drain. Eng. 1982, 108, 225–230. [Google Scholar]
  19. Tonietto, J.; Carbonneau, A. A multicriteria climatic classification system for grape-growing regions worldwide. Agric. For. Meteorol. 2004, 124, 81–97. [Google Scholar] [CrossRef] [Green Version]
  20. Haigh, M.J. The use of erosion pins in the study of slope evolution. Br. Geomorphol. Res. Group Tech. Bull. 1977, 18, 31–49. [Google Scholar]
  21. Novara, A.; Pisciotta, A.; Minacapilli, M.; Maltese, A.; Capodici, F.; Cerdà, A.; Gristina, L. The impact of soil erosion on soil fertility and vine vigor. A multidisciplinary approach based on field, laboratory and remote sensing approaches. Sci. Total Environ. 2018, 622, 474–480. [Google Scholar] [CrossRef] [Green Version]
  22. Mirás-Avalos, J.M.; Bertol, I.; de Abreu, C.A.; Vidal Vázquez, E.; Paz González, A. Crop residue effects on total and dissolved losses of Fe, Mn, Cu, and Zn by runoff. Commun. Soil Sci. Plant Anal. 2015, 46, 272–282. [Google Scholar] [CrossRef]
  23. Cogo, N.P. Effect of Residue Cover, Tillage-Induced Roughness, and Slope Length on Erosion and Related Parameters. Ph.D. Thesis, Purdue University, West Lafayette, IN, USA, 1981. [Google Scholar]
  24. Rodrigo-Comino, J.; Keestra, S.D.; Cerdà, A. Connectivity assessment in Mediterranean vineyards using improved stock unearthing method, LiDAR and soil erosion field surveys. Earth Surf. Process. Landf. 2018, 43, 2193–2206. [Google Scholar] [CrossRef]
  25. Quiquerez, A.; Brenot, J.; Garcia, J.P.; Petit, C. Soil degradation caused by a high-intensity rainfall event: Implications for medium-term soil sustainability in Burgundian vineyards. Catena 2008, 73, 89–97. [Google Scholar] [CrossRef]
  26. Rodrigo-Comino, J.; Cerdà, A. Improving stock unearthing method to measure soil erosion rates in vineyards. Ecol. Indic. 2018, 85, 509–517. [Google Scholar] [CrossRef] [Green Version]
  27. Paroissien, J.B.; Lagacherie, P.; Le Bissonnais, Y. A regional-scale study of multi-decennial erosion of vineyard fields using vine-stock unearthing-burying measurements. Catena 2010, 82, 159–168. [Google Scholar] [CrossRef]
  28. R Core Team. R: A Language and Environment for Statistical Computing; R Foundation for Statistical Computing: Vienna, Austria, 2019; Available online: https://R-project.org/ (accessed on 4 January 2020).
  29. Rodrigo-Comino, J.R.; Sinoga, J.R.; González, J.S.; Guerra-Merchán, A.; Seeger, M.; Ries, J.B. High variability of soil erosion and hydrological processes in Mediterranean hillslope vineyards (Montes de Málaga, Spain). Catena 2016, 145, 274–284. [Google Scholar] [CrossRef]
  30. Martínez-Casasnovas, J.A.; Ramos, M.C. The cost of soil erosion in vineyard fields in the Penedès-Anoia Region (NE Spain). Catena 2006, 68, 194–199. [Google Scholar] [CrossRef]
  31. Chevigny, E.; Quiquerez, A.; Petit, C.; Curmi, P. Lithology, landscape structure and management practice changes: Key factors patterning vineyard soil erosion at metre-scale spatial resolution. Catena 2014, 121, 354–364. [Google Scholar] [CrossRef]
  32. Prosdocimi, M.; Jordán, A.; Tarolli, P.; Keestra, S.; Novara, A.; Cerdà, A. The immediate effectiveness of barley straw mulch in reducing soil erodibility and surface runoff generation in Mediterranean vineyards. Sci. Total Environ. 2016, 547, 323–330. [Google Scholar] [CrossRef] [Green Version]
  33. Guerra, B.; Steenwerth, K. Influence of floor management technique on grapevine growth, disease pressure, and juice and wine composition: A review. Am. J. Enol. Vitic. 2012, 63, 149–164. [Google Scholar] [CrossRef]
  34. Trigo-Córdoba, E.; Bouzas-Cid, Y.; Orriols-Fernández, I.; Díaz-Losada, E.; Mirás-Avalos, J.M. Influence of cover crop treatments on the performance of a vineyard in a humid region. Span. J. Agric. Res. 2015, 13, e0907. [Google Scholar] [CrossRef] [Green Version]
  35. Ferrero, A.; Usowicz, B.; Lipiec, J. Effects of tractor traffic on spatial variability of soil strength and water content in grass covered and cultivated sloping vineyard. Soil Tillage Res. 2005, 84, 127–138. [Google Scholar] [CrossRef]
  36. Masselink, R.J.H.; Heckman, T.; Temme, A.J.A.M.; Anders, N.S.; Gooren, H.P.A.; Keesstra, S.D. A network theory approach for a better understanding of overland flow connectivity. Hydrol. Process. 2017, 31, 207–220. [Google Scholar] [CrossRef] [Green Version]
  37. Rodrigo-Comino, J.; Brevik, E.C.; Cerdà, A. The age of vines as a controlling factor of soil erosion processes in Mediterranean vineyards. Sci. Total Environ. 2018, 616, 1163–1173. [Google Scholar] [CrossRef] [PubMed] [Green Version]
  38. Lampurlanés, J.; Cantero-Martínez, C. Hydraulic conductivity, residue cover and soil surface roughness under different tillage systems in semiarid conditions. Soil Till. Res. 2006, 85, 13–26. [Google Scholar] [CrossRef]
  39. Warnemuende, E.A.; Patterson, J.P.; Smith, D.R.; Huang, C. Effects of tilling no-till soil on losses of atrazine and glyphosate to runoff water under variable intensity simulated rainfall. Soil Tillage Res. 2007, 95, 19–26. [Google Scholar] [CrossRef]
  40. Morvan, X.; Naisse, C.; Malam Issa, O.; Desprats, J.F.; Combaud, A.; Cerdan, O. Effect of ground-cover type on surface runoff and subsequent soil erosion in Champagne vineyards in France. Soil Use Manag. 2014, 30, 372–381. [Google Scholar] [CrossRef]
  41. Rodrigo-Comino, J.; Keesstra, S.D.; Cerdà, A. Soil erosion as an environmental concern in vineyards: The case study of Celler del Roure, Eastern Spain, by means of rainfall simulation experiments. Beverages 2018, 4, 31. [Google Scholar] [CrossRef] [Green Version]
  42. Boix-Fayos, C.; Martínez-Mena, M.; Arnau-Rosalén, E.; Calvo-Cases, A.; Castillo, V.; Albadalejo, J. Measuring soil erosion by field plots: Understanding the sources of variation. Earth Sci. Rev. 2006, 78, 267–285. [Google Scholar] [CrossRef]
  43. López-Vicente, M.; Álvarez, S. Influence of DEM resolution on modelling hydrological connectivity in a complex agricultural catchment with woody crops. Earth Surf. Process. Landf. 2018, 43, 1403–1415. [Google Scholar] [CrossRef]
  44. Krenz, J.; Greenwood, P.; Kuhn, N.J. Soil degradation mapping in drylands using unmanned aerial vehicle (UAV) data. Soil Syst. 2019, 3, 33. [Google Scholar] [CrossRef] [Green Version]
  45. d’Oleire-Oltmanns, S.; Marzoff, I.; Peter, K.D.; Ries, J.B. Unmanned aerial vehicle (UAV) for monitoring soil erosion in Morocco. Remote Sens. 2012, 4, 3390–3416. [Google Scholar] [CrossRef] [Green Version]
Figure 1. Location of the experimental vineyards within Galicia (North West Spain).
Soilsystems 04 00019 g001
Figure 2. Dynamics of daily rainfall and reference evapotranspiration (ETo) over the study period (May 2018–August 2019) for (a) “Ponte da Boga” in Ribeira Sacra; (b) “Tremoedo” in Rías Baixas weather stations.
Soilsystems 04 00019 g002
Figure 3. Pin height variation (a) and area index (b) over a year (May 2018 to April 2019) timespan for the treatments imposed in the Ribeira Sacra vineyard. Error bars refer to standard errors. Positive values of the area index indicate erosion, whereas negative values indicate soil deposition.
Soilsystems 04 00019 g003
Figure 4. Pin height variation (a) and area index (b) over a year (May 2018 to April 2019) timespan for the treatments imposed in the Rías Baixas vineyard. Positive values of the area index indicate erosion, whereas negative values indicate soil deposition. R-Against: Rain-fed without soil tillage and rows oriented against the terrain slope; I-NT: Irrigated to cover 30% of reference evapotranspiration (ETo) without soil tillage; I-ST: Irrigated to cover 30% of ETo with soil tillage and herbicide application to maintain soil without the protection of a vegetal cover; and R-Slope: Rain-fed without soil tillage and rows oriented in favor of the terrain slope.
Soilsystems 04 00019 g004
Figure 5. Box-plot graphic of graft union and inter-row measures (n = 670), representing the actual topsoil level on average for the whole Rías Baixas vineyard. R 0.75 m, R 1.5 m and R 2.25 m stands for the reference points measured within the inter-row at 0.75, 1.5 and 2.25 m, respectively, from the left vine stock.
Soilsystems 04 00019 g005
Table 1. Main physical and chemical properties from the surface layer of the soils from the two experimental vineyards studied (averages ± standard errors).
Soil PropertyUnitsRías BaixasRibeira Sacra
Bulk densityg cm−31.13 ± 0.021.23 ± 0.08
Fine fraction%59.8 ± 0.358.3 ± 1.8
Coarse fraction40.2 ± 0.941.7 ± 1.8
Sand54.2 ± 0.741.3 ± 2.9
Silt22.3 ± 0.732.9 ± 2.0
Clay23.5 ± 0.325.8 ± 1.7
Organic matter4.06 ± 0.142.94 ± 0.27
pH (H2O) 5.84 ± 0.085.19 ± 0.19
pH (KCl) 5.27 ± 0.084.39 ± 0.20
Effective cation exchange capacitycmol(+) kg−18.50 ± 0.464.97 ± 0.72
Electrical conductivitymS cm−1149.1 ± 8.875.8 ± 12.0
Table 2. Rainfall, runoff and sediments mobilized by runoff for the different treatments surveyed in the Rías Baixas vineyard from mid-June 2018 to end August 2019.
PeriodTreatmentRainfall (mm)Runoff (L m−2)Sediment (kg ha−1)
First
(12/06/2018–16/10/2018)
R-Slope1094.5813.3
I-NT4.4119.7
I-ST5.5922.5
Second
(17/10/2018–21/01/2019)
R-Slope56142.9579.7
I-NT34.47340.4
I-ST20.5643.1
Third
(22/01/2019–29/04/2019)
R-Slope45929.05153.5
I-NT31.56298.4
I-ST32.16198.2
R-Against55.19151.7
Fourth
(30/04/2019–29/08/2019)
R-Slope1807.9921.8
I-NT5.4930.9
I-ST6.2734.4
R-Against7.0051.9
TotalR-Slope131084.57268.3
I-NT75.93689.4
I-ST64.58298.2
R-Against63962.19203.6
R-Against: Rain-fed without soil tillage and rows oriented against the terrain slope; I-NT: Irrigated to cover 30% of reference evapotranspiration (ETo) without soil tillage; I-ST: Irrigated to cover 30% of ETo with soil tillage and herbicide application to maintain soil without the protection of a vegetal cover; and R-Slope: Rain-fed without soil tillage and rows oriented in favor of the terrain slope.

