The Relationship between CrossFit® Performance and Laboratory-Based Measurements of Fitness

 ,
,
Abstract
:1. Introduction
2. Materials and Methods
2.1. Experimental Design
2.2. Participants
2.3. Laboratory Testing Protocols
2.3.1. Body Composition
2.3.2. Aerobic Fitness
2.3.3. Familiarization and CrossFit® Total
2.4. WOD Protocols
2.4.1. The 19.1
2.4.2. Modified Fran
2.5. Statistical Analysis
3. Results
4. Discussion
Author Contributions
Funding
Acknowledgments
Conflicts of Interest
References
- Glassman, G. CrossFit Training: Level One Training Guide. Available online: http://library.crossfit.com/free/pdf/CFJ_English_Level1_TrainingGuide.pdf (accessed on 1 June 2020).
- Feito, Y.; Heinrich, K.M.; Butcher, S.J.; Poston, W.S.C. High-Intensity Functional Training (HIFT): Definition and Research Implications for Improved Fitness. Sports 2018, 6, 76. [Google Scholar] [CrossRef] [PubMed] [Green Version]
- About Affiliation. Available online: https://www.crossfit.com/affiliate (accessed on 1 June 2020).
- Glassman, G. Benchmark Workouts. CrossFit J. 2003, 15, 1–5. [Google Scholar]
- Bellar, D.; Hatchett, A.; Judge, L.W.; Breaux, M.E.; Marcus, L. The relationship of aerobic capacity, anaerobic peak power and experience to performance in CrossFit exercise. Biol. Sport 2015, 32, 315–320. [Google Scholar] [CrossRef] [PubMed]
- Butcher, S.J.; Neyedly, T.J.; Horvey, K.J.; Benko, C.R. Do physiological measures predict selected CrossFit® benchmark performance. Open Access J. Sports Med. 2015, 6, 241–247. [Google Scholar] [CrossRef] [PubMed] [Green Version]
- Dexheimer, J.D.; Schroeder, E.T.; Sawyer, B.J.; Pettitt, W.R.; Aguinaldo, A.L.; Torrence, W.A. Physiological Performance Measures as Indicators of CrossFit. Sports 2019, 7, 93. [Google Scholar] [CrossRef] [Green Version]
- Serafini, P.R.; Feito, Y.; Mangine, G.T. Self-reported Measures of Strength and Sport-Specific Skills Distinguish Ranking in an International Online Fitness Competition. J. Strength Cond. Res. 2018, 32, 3474–3484. [Google Scholar] [CrossRef]
- Buckley, S.; Kelly, K.; Amy, L.; Colin, L.; Karla, H.; Chad, B.; Jason, T.; Scotty, B. Multimodal high-intensity interval training increases muscle function and metabolic performance in females. Appl. Physiol. Nutr. Metab. 2015, 4, 1157–1162. [Google Scholar] [CrossRef] [Green Version]
- Dwyer, G.; Davis, S. ACSM’s Health-Related Physical Fitness Assessment Manual; Lippincott Williams & Wilkins: Philadelphia, PA, USA, 2008. [Google Scholar]
- Tinsley, G.M.; Moore, M.L.; Graybeal, A.J. Precision of Dual-Energy X-Ray Absorptiometry Reflection Scans in Muscular Athletes. J. Clin. Densitom. 2018, in press. [Google Scholar] [CrossRef]
- Borg, G.A. Psychophysical bases of perceived exertion. Med. Sci. Sports Exerc. 1982, 14, 377–381. [Google Scholar] [CrossRef]
- Edvardsen, E.; Hem, E.; Anderssen, S.A. End criteria for reaching maximal oxygen uptake must be strict and adjusted to sex and age: A cross-sectional study. PLoS ONE 2014, 9, e85276. [Google Scholar] [CrossRef] [Green Version]
- Lucía, A.; Hoyos, J.; Pérez, M.; Chicharro, J.L. Heart rate and performance parameters in elite cyclists: A longitudinal study. Med. Sci. Sports Exerc. 2000, 32, 1777–1782. [Google Scholar] [CrossRef] [PubMed] [Green Version]
- Alsamir Tibana, R.; Frade de Sousa, N.M.; Prestes, J.; Nascimento, D.D.C.; Ernesto, C.; Falk Neto, J.H.; Kennedy, M.D.; Voltarelli, F.A. Is Perceived Exertion a Useful Indicator of the Metabolic and Cardiovascular Responses to a Metabolic Conditioning Session of Functional Fitness. Sports 2019, 7, 161. [Google Scholar] [CrossRef] [PubMed] [Green Version]
- Martínez-Gómez, R.; Valenzuela, P.L.; Alejo, B.L.; Gil-Cabrera, J.; Montalvo-Pérez, A.; Talavera, E.; Lucia, A.; Moral-González, S.; Barranco-Gil, D. Physiological Predictors of Competition Performance in CrossFit Athletes. Int. J. Environ. Res. Public Health 2020, 17, 3699. [Google Scholar] [CrossRef] [PubMed]
- Hale, T. History of developments in sport and exercise physiology: A. V. Hill, maximal oxygen uptake, and oxygen debt. J. Sports Sci. 2008, 26, 365–400. [Google Scholar] [CrossRef]
- Westerblad, H.; Allen, D.G.; Lännergren, J. Muscle fatigue: Lactic acid or inorganic phosphate the major cause. News Physiol. Sci. 2002, 17, 17–21. [Google Scholar] [CrossRef]
- Westerblad, H.; Allen, D.G.; Bruton, J.D.; Andrade, F.H.; Lännergren, J. Mechanisms underlying the reduction of isometric force in skeletal muscle fatigue. Acta Physiol. Scand. 1998, 162, 253–260. [Google Scholar] [CrossRef]
- Westerblad, H.; Allen, D.G. Changes of intracellular pH due to repetitive stimulation of single fibres from mouse skeletal muscle. J. Physiol. 1992, 449, 49–71. [Google Scholar] [CrossRef]
- Westerblad, H.; Allen, D.G. Cellular mechanisms of skeletal muscle fatigue. Adv. Exp. Med. Biol. 2003, 538, 563–570. [Google Scholar]
- Robergs, R.A.; Ghiasvand, F.; Parker, D. Biochemistry of exercise-induced metabolic acidosis. Am. J. Physiol. Regul. Integr. Comp. Physiol. 2004, 287, R502–R516. [Google Scholar] [CrossRef]
- Mangine, G.T.; Stratton, M.T.; Almeda, C.G.; Roberts, M.D.; Esmat, T.A.; Van Dusseldorp, T.A.; Feito, Y. Physiological differences between advanced CrossFit athletes, recreational CrossFit participants, and physically-active adults. PLoS ONE 2020, 15, e0223548. [Google Scholar] [CrossRef] [Green Version]
- Bishop, D.; Edge, J.; Goodman, C. Muscle buffer capacity and aerobic fitness are associated with repeated-sprint ability in women. Eur. J. Appl. Physiol. 2004, 92, 540–547. [Google Scholar] [CrossRef] [PubMed]
- Bogdanis, G.C.; Nevill, M.E.; Boobis, L.H.; Lakomy, H.K. Contribution of phosphocreatine and aerobic metabolism to energy supply during repeated sprint exercise. J. Appl. Physiol. 1996, 80, 876–884. [Google Scholar] [CrossRef] [PubMed]
- McGawley, K.; Bishop, D.J. Oxygen uptake during repeated-sprint exercise. J. Sci. Med. Sport 2015, 18, 214–228. [Google Scholar] [CrossRef] [PubMed] [Green Version]
- Martínez-Gómez, R.; Valenzuela, P.L.; Barranco-Gil, D.; Moral-González, S.; García-González, A.; Lucia, A. Full-Squat as a Determinant of Performance in CrossFit. Int. J. Sports Med. 2019, 40, 592–596. [Google Scholar] [CrossRef] [PubMed] [Green Version]
- Del Vecchio, L.; Stanton, R.; Reaburn, P.; Macgregor, C.; Meerkin, J.; Villegas, J.; Korhonen, M.T. Effects of Combined Strength and Sprint Training on Lean Mass, Strength, Power, and Sprint Performance in Masters Road Cyclists. J. Strength Cond. Res. 2019, 33, 66–79. [Google Scholar] [CrossRef] [PubMed] [Green Version]
- Stone, M.H.; Sands, W.A.; Carlock, J.; Callan, S.; Dickie, D.; Daigle, K.; Cotton, J.; Smith, S.L.; Hartman, M. The importance of isometric maximum strength and peak rate-of-force development in sprint cycling. J. Strength Cond. Res. 2004, 18, 878–884. [Google Scholar]


| Total (n = 22) | Female (n = 9) | Male (n = 13) | |
|---|---|---|---|
| Descriptive Variables | |||
| Age (year) | 22.2 ± 2.9 | 22.3 ± 3.1 | 22.2 ± 5.6 |
| Height (cm) | 165.4 ± 12.9 | 157.6 ± 15.7 | 170.8 ± 7.1 |
| Body Mass (kg) | 68.7 ± 9.1 | 66.4 ± 10.5 | 70.3 ± 8.2 |
| Body Fat % | 19.0 ± 9.8 | 27.7 ± 8.0 | 13.0 ± 5.6 |
| Skeletal Muscle Mass (kg) | 31.1 ± 5.4 | 26.3 ± 3.0 | 34.4 ± 3.8 |
| Metabolic Variables | |||
| Absolute VO2 peak (mL/min) | 3619.9 ± 870.4 | 2930 ± 501.0 | 4097.2 ± 745.0 |
| Relative VO2 peak (mL/kg/min) | 52.6 ± 9.7 | 44.2 ± 4.4 | 58.4 ± 7.9 |
| Absolute VO2 @ VT1 (mL/min) | 2475.5 ± 636.5 | 2053.7 ± 377.6 | 2767.5 ± 622.9 |
| Relative VO2 @ VT1 (mL/kg/min) | 36.0 ± 7.5 | 31.0 ± 4.2 | 39.5 ± 7.4 |
| VT1 (%VO2 peak) | 68.5 ± 6.3 | 70.1 ± 6.8 | 67.3 ± 5.9 |
| Absolute VO2 @ VT2 (mL/min) | 3295.9 ± 818.1 | 2726.4 ± 520.8 | 3690.2 ± 760.8 |
| Relative VO2 @ VT2 (mL/kg/min) | 48.0 ± 8.9 | 41.4 ± 4.8 | 52.5 ± 8.3 |
| VT2 (%VO2 peak) | 91.0 ± 5.3 | 92.9 ± 5.8 | 89.8 ± 4.7 |
| Strength Variables | |||
| Back Squat 1RM (kg) | 102.4 ± 29.8 | 77.3 ± 16.0 | 119.8 ± 24.1 |
| Overhead Press 1RM (kg) | 44.3 ± 15.4 | 29.8 ± 7.7 | 54.4 ± 10.4 |
| Deadlift 1RM (kg) | 116.3 ± 34.0 | 85.9 ± 18.6 | 137.4 ± 24.9 |
| CrossFit® Total (kg) | 263.0 ± 76.7 | 192.9 ± 40.2 | 311.5 ± 54.5 |
| Relative CrossFit® Total (AU) | 3.8 ± 0.9 | 2.9 ± 0.4 | 4.4 ± 0.6 |
| CrossFit® Performance Variables | |||
| 19.1 Performance (reps) | 193.3 ± 32 | 176.2 ± 27.1 | 205.2 ± 30.1 |
| Fran Performance (s) | 428.8 ± 84.4 | 465.3 ± 54.4 | 409.1 ± 92.7 |
| 19.1 (Reps) (n = 22) | Mod. Fran (s) (n = 20) | |
|---|---|---|
| Body Composition | ||
| Body Mass (kg) | 0.53 ** p = 0.01 | −0.27 p = 0.26 |
| Body Fat % | −0.46 * p = 0.03 | 0.26 p = 0.27 |
| Metabolic Variables | ||
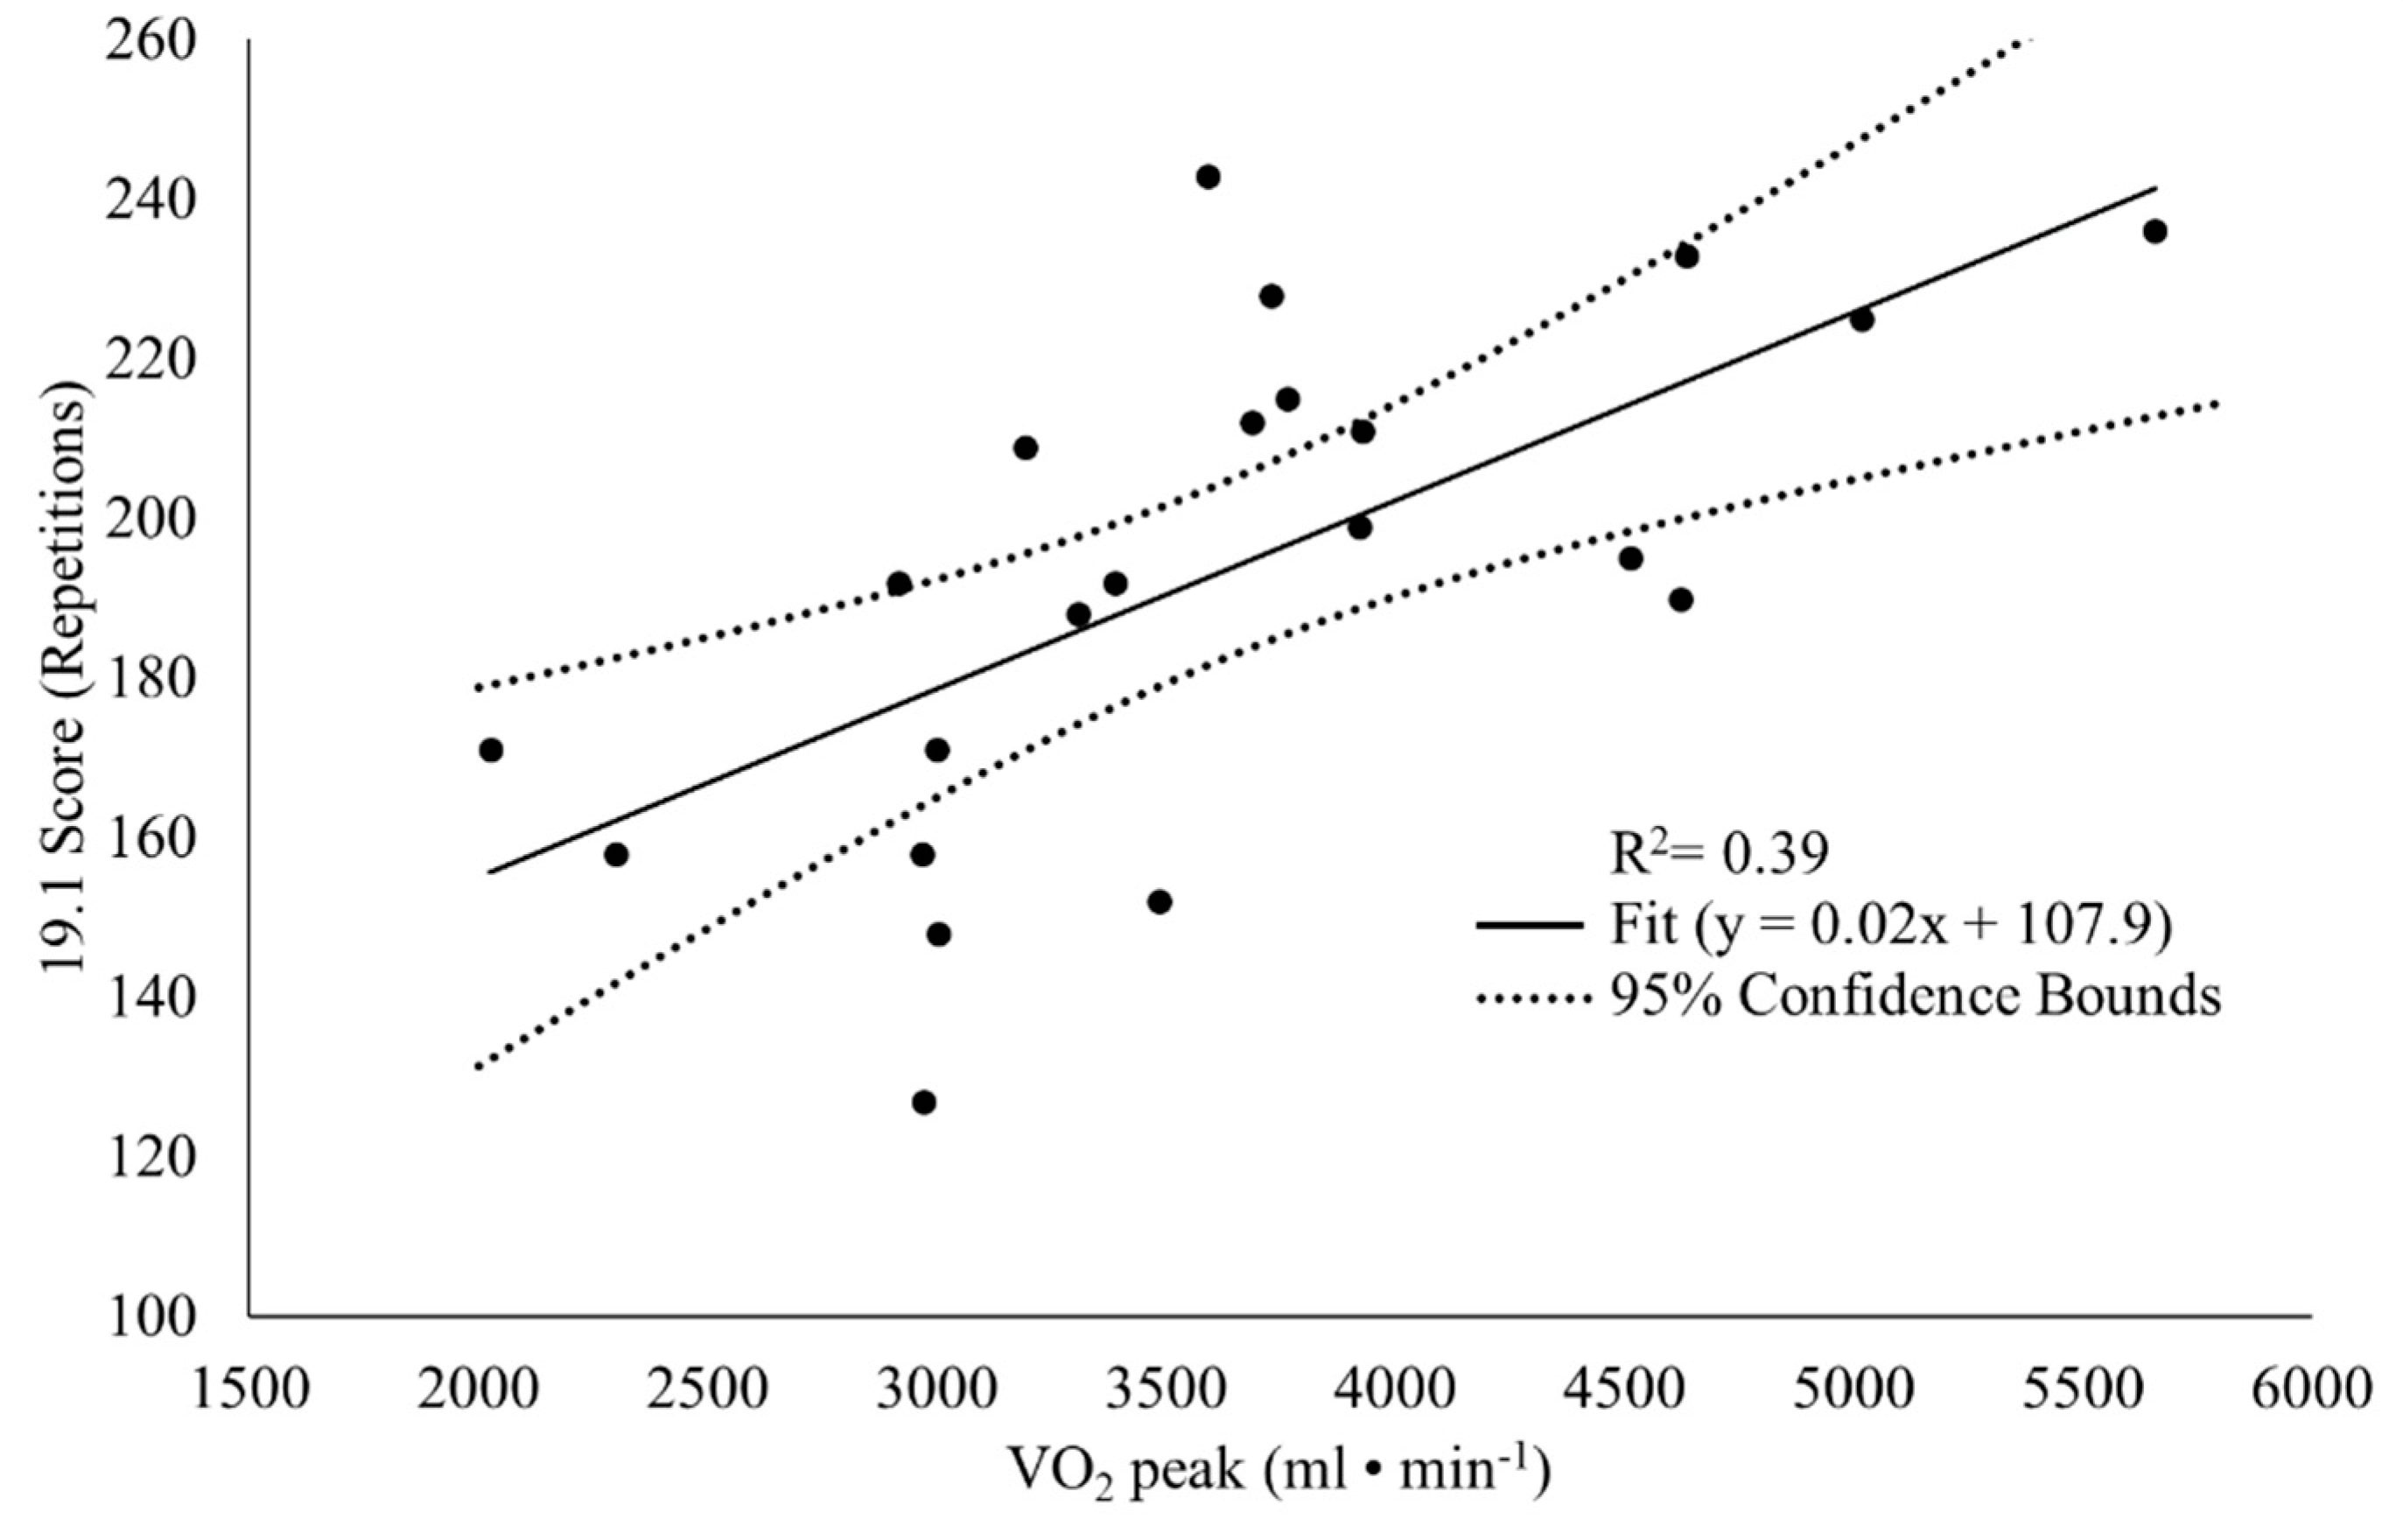
| Absolute VO2 peak (mL/min) | 0.65 ** p = 0.001 | −0.35 p = 0.13 |
| Relative VO2 peak (mL/kg/min) | 0.48 * p = 0.02 | −0.29 p = 0.22 |
| Absolute VO2 @ VT1 (mL/min) | 0.56 ** p= 0.01 | −0.32 p = 0.17 |
| Relative VO2 @ VT1 (mL/kg/min) | 0.36 p = 0.10 | −0.23 p = 0.34 |
| VT1 (%VO2 peak) | −0.19 p = 0.39 | 0.02 p = 0.92 |
| Absolute VO2 @ VT2 (mL/min) | 0.61 ** p = 0.002 | −0.26 p = 0.27 |
| Relative VO2 @ VT2 (mL/kg/min) | 0.48 * p = 0.03 | −0.19 p = 0.43 |
| VT2 (%VO2 peak) | −0.03 p = 0.90 | 0.35 p = 0.13 |
| Strength Variables | ||
| Back Squat 1RM (kg) | 0.58 ** p = 0.01 | −0.58 ** p = 0.01 |
| Overhead Press 1RM (kg) | 0.59 ** p = 0.004 | −0.63 ** p = 0.003 |
| Deadlift 1RM (kg) | 0.62 ** p = 0.002 | −0.57 ** p = 0.01 |
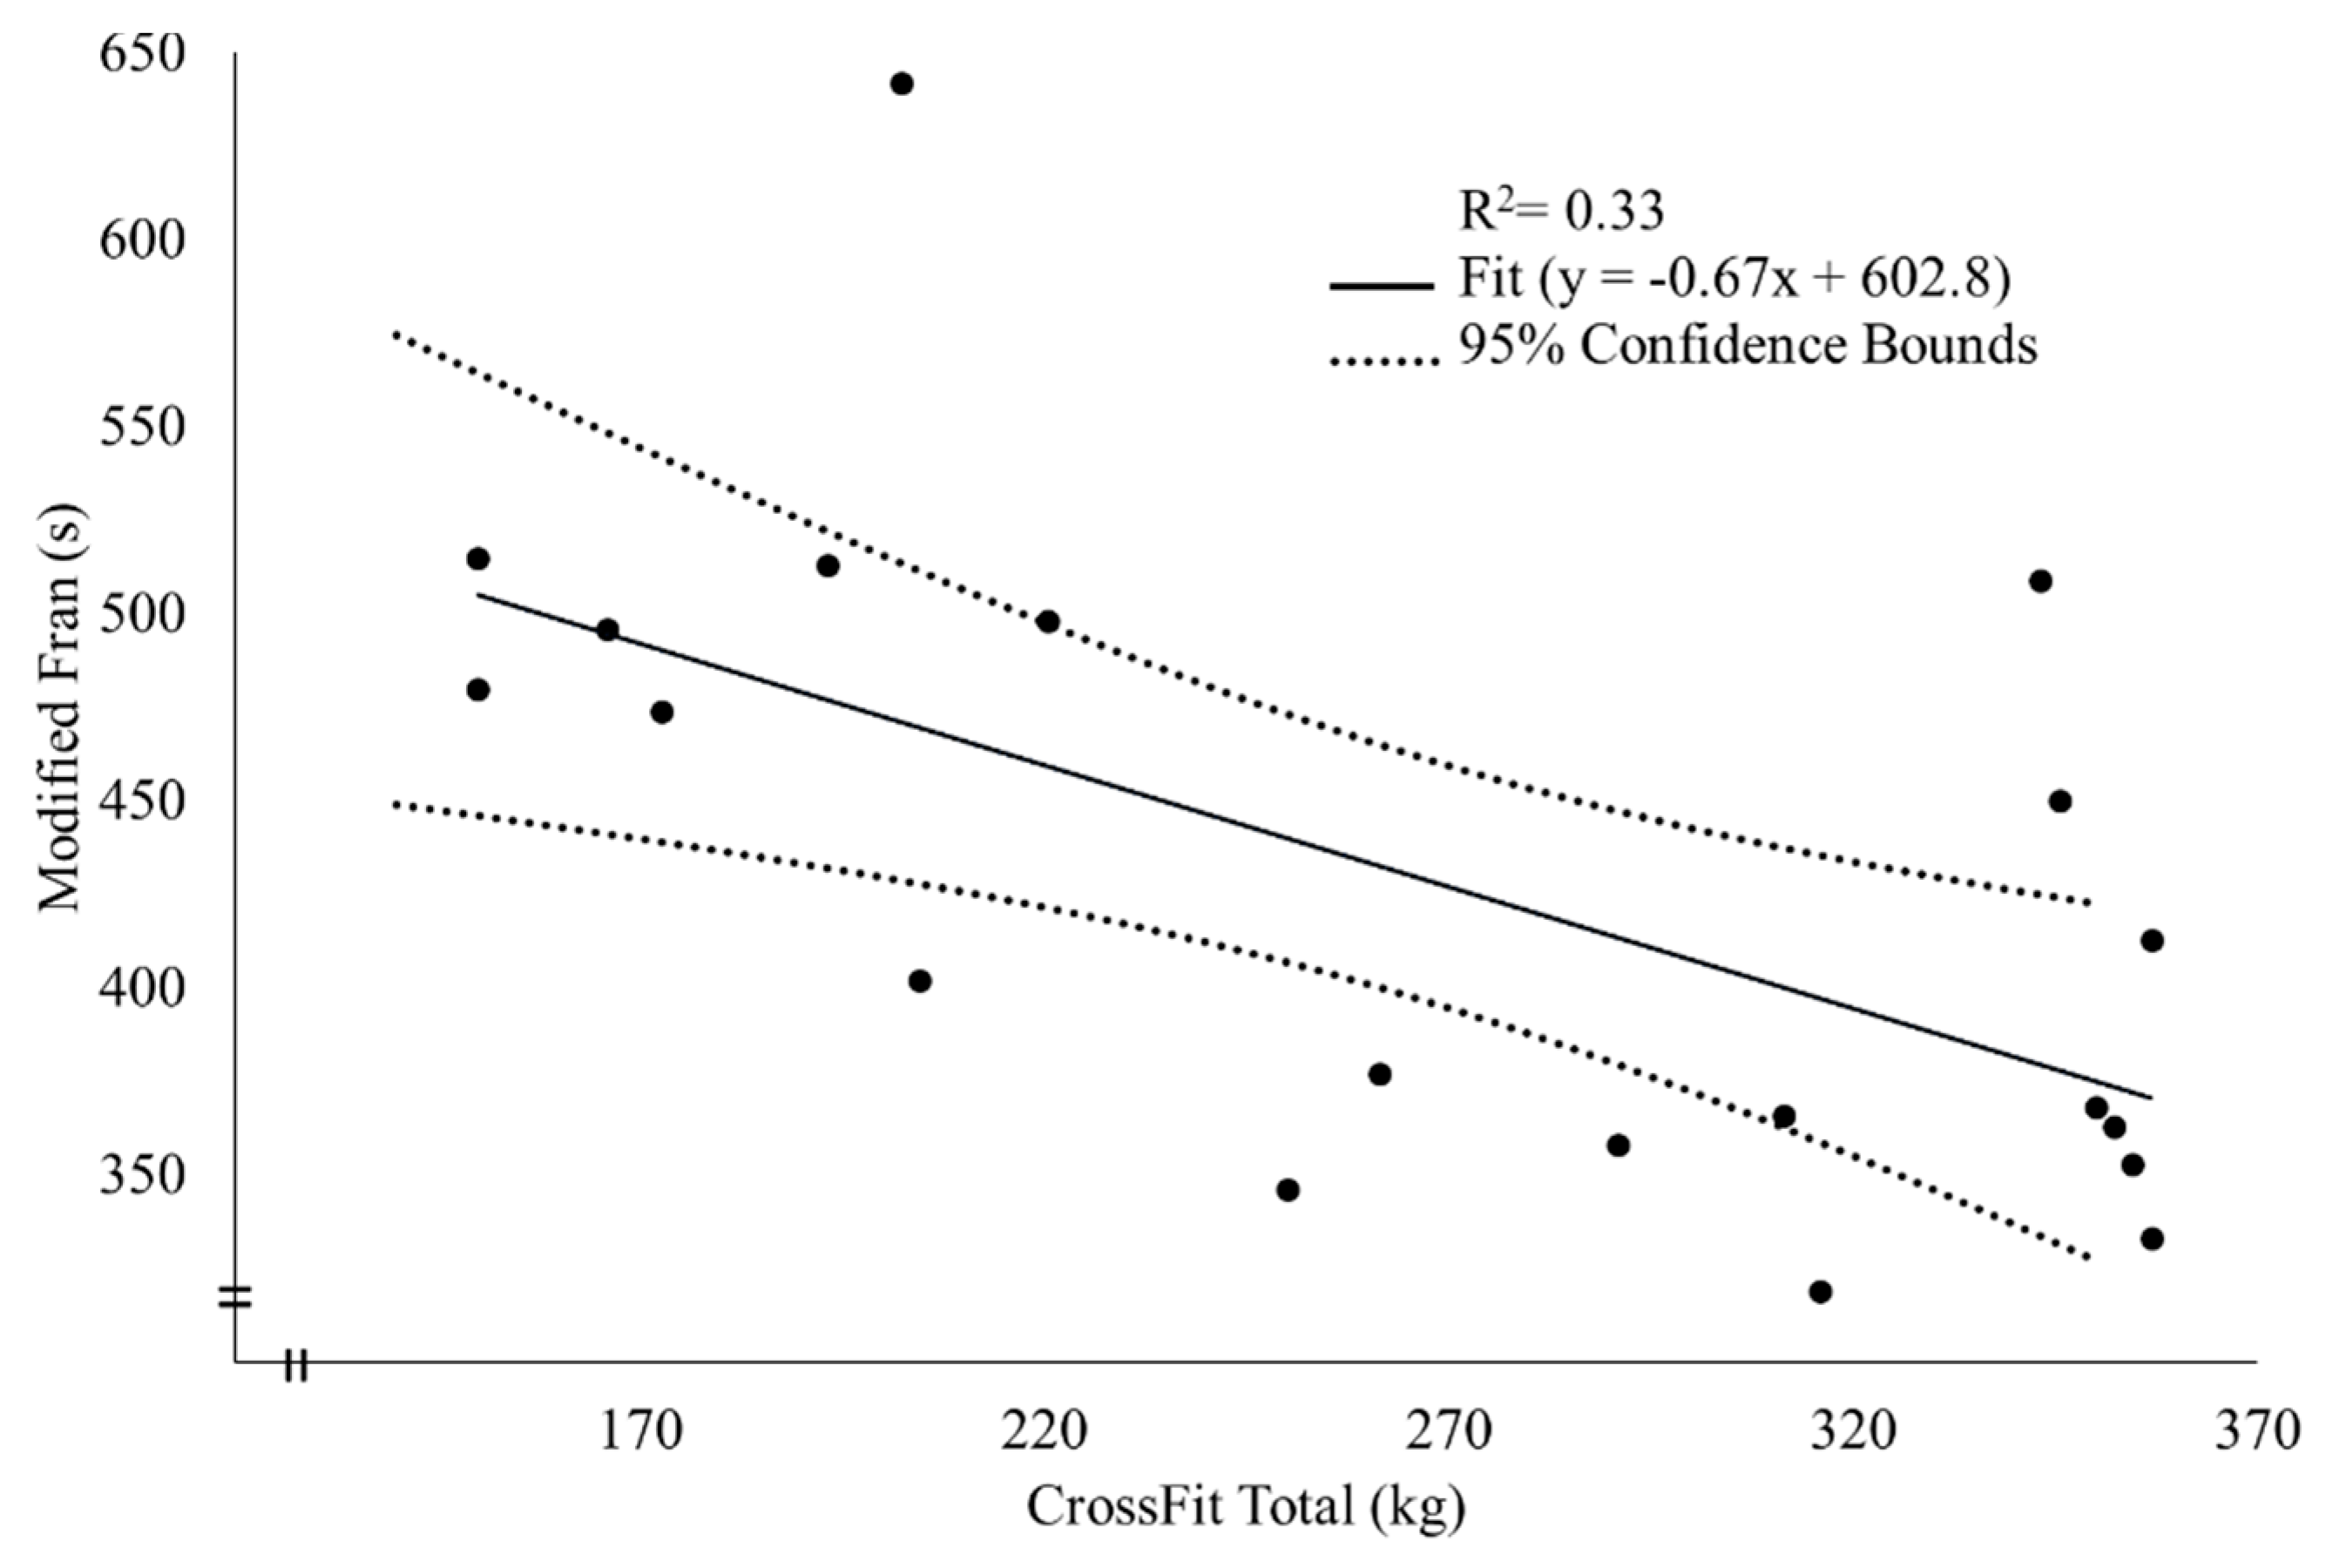
| CrossFit® Total (kg) | 0.62 ** p = 0.002 | −0.61 ** p = 0.01 |
| Relative CrossFit® Total (AU) | 0.46 * p = 0.03 | −0.62 ** p = 0.004 |
| CrossFit® Performance Variables | ||
| 19.1 Performance (reps) | N/A | −0.50 * p = 0.02 |
| Fran Performance (s) | −0.50 * p = 0.02 | N/A |
| Dependent Variable | Independent Variable | B | SEB | β | p-Value |
|---|---|---|---|---|---|
| 19.1 Performance | Absolute VO2 Peak (mL/min) | 0.024 | 0.007 | 0.647 | 0.002 |
| Dependent Variable | Independent Variable | B | SEB | β | p-Value |
|---|---|---|---|---|---|
| Fran Performance | CrossFit® Total (kg) | −0.667 | 0.206 | 0.606 | 0.005 |
© 2020 by the authors. Licensee MDPI, Basel, Switzerland. This article is an open access article distributed under the terms and conditions of the Creative Commons Attribution (CC BY) license (http://creativecommons.org/licenses/by/4.0/).
Share and Cite
Zeitz, E.K.; Cook, L.F.; Dexheimer, J.D.; Lemez, S.; Leyva, W.D.; Terbio, I.Y.; Tran, J.R.; Jo, E. The Relationship between CrossFit® Performance and Laboratory-Based Measurements of Fitness. Sports 2020, 8, 112. https://0-doi-org.brum.beds.ac.uk/10.3390/sports8080112
Zeitz EK, Cook LF, Dexheimer JD, Lemez S, Leyva WD, Terbio IY, Tran JR, Jo E. The Relationship between CrossFit® Performance and Laboratory-Based Measurements of Fitness. Sports. 2020; 8(8):112. https://0-doi-org.brum.beds.ac.uk/10.3390/sports8080112
Chicago/Turabian StyleZeitz, Elisabeth K., Lena F. Cook, Joshua D. Dexheimer, Srdjan Lemez, Whitney D. Leyva, Immanuel Y. Terbio, Justin R. Tran, and Edward Jo. 2020. "The Relationship between CrossFit® Performance and Laboratory-Based Measurements of Fitness" Sports 8, no. 8: 112. https://0-doi-org.brum.beds.ac.uk/10.3390/sports8080112