Significance of Submarine Groundwater Discharge in Nutrient Budgets in Tropical Sanya Bay, China


1
State Key Laboratory of Marine Environmental Science, Xiamen University, Xiamen 361102, China
2
Fujian Provincial Key Laboratory for Coastal Ecology and Environmental Studies, Xiamen University, Xiamen 361102, China
3
College of Ocean and Earth Sciences, Xiamen University, Xiamen 361102, China
*
Author to whom correspondence should be addressed.
Sustainability 2018, 10(2), 380; https://0-doi-org.brum.beds.ac.uk/10.3390/su10020380
Submission received: 22 December 2017
/
Revised: 22 January 2018
/
Accepted: 30 January 2018
/
Published: 1 February 2018
(This article belongs to the Special Issue Marine Carbon Cycles)
Abstract
:To quantify the contribution of submarine groundwater discharge (SGD) to the nutrient budget in tropical embayments, naturally occurring radium isotopes (223Ra, 224Ra, 226Ra, and 228Ra) were investigated as SGD tracers in Sanya Bay, China. Higher activities of radium were present along the north coast and near the Sanya River estuary. Using the activity ratio of 224Ra/228Ra, the apparent water age in Sanya Bay was estimated to be 0–13.2 days, with an average of 7.2 ± 3.2 days. Based on the mass balance of 226Ra and 228Ra, SGD was calculated to be 2.79 ± 1.39–5.07 ± 2.67 × 10⁶ m3 d−1 (or 4.3 ± 2.1–7.8 ± 4.1 cm d−1). SGD associated dissolved inorganic nutrient fluxes into Sanya Bay were estimated to be 3.94 ± 2.00–7.15 ± 3.85 × 10⁵ mol d−1 for oxidized inorganic nitrogen, 4.64 ± 2.74–8.42 ± 5.19 × 10³ mol d−1 for phosphate, and 6.63 ± 3.29–12.0 ± 6.34 × 10⁵ mol d−1 for silicate. The estuarine nutrient flux from the Sanya River was a few times smaller than the phosphate flux via SGD and at least an order of magnitude smaller than the oxidized inorganic nitrogen and silicate fluxes carried by SGD. SGD was also more important than atmospheric deposition and nitrogen fixation in the nutrient budget. Our results demonstrate that SGD compensated for at least 15% phosphate, 90% oxidized inorganic nitrogen, and 60% silicate of the nutrients sink in Sanya Bay.
Keywords:
submarine groundwater discharge; radium isotopes; nutrients; flux; China; Hainan Island; Sanya Bay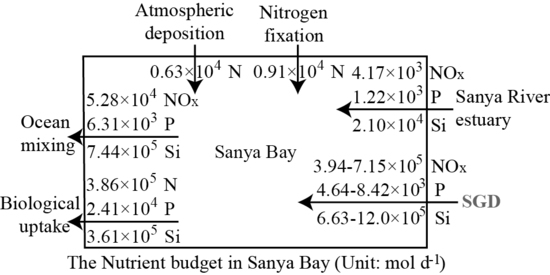
1. Introduction
Coastal waters are prone to deterioration under a global context of climate change and changes in ocean and land-source forces. For example, acidification and hypoxia occur in coastal waters induced by upwelling [1,2,3,4,5] and coastal eutrophication and consequent hypoxia are observed due to increasing terrestrial nutrient loadings from catchment areas [6]. These massive nutrient inputs often stimulate phytoplankton growth in coastal waters and result in the conversion of inorganic carbon to organic carbon [6], which is an important step in the marine carbon cycle. Among these interacting forces submarine groundwater discharge (SGD) has been recognized as an important carrier of water often characterized by high concentrations of nutrients, dissolved inorganic and organic carbon, and metals [7,8,9,10,11,12]. Thus, SGD is a key factor to quantify in evaluating material budgets of any coastal system.
Naturally occurring radioactive radium isotopes (223Ra, 224Ra, 226Ra, and 228Ra) have been widely used to trace SGD because they are not chemically active in coastal waters and their activities in SGD are typically at least an order of magnitude greater than in the receiving coastal waters [9,10,13,14,15]. Radium is regenerated from decay of particle-reactive thorium isotopes and released from particles when encountering brackish or saline waters. The short-lived radium isotopes, 223Ra (half-life = 11.4 days) and 224Ra (half-life = 3.66 days), also work well in estimating apparent water ages on the shelf on time scales of a few to tens of days [16,17,18].
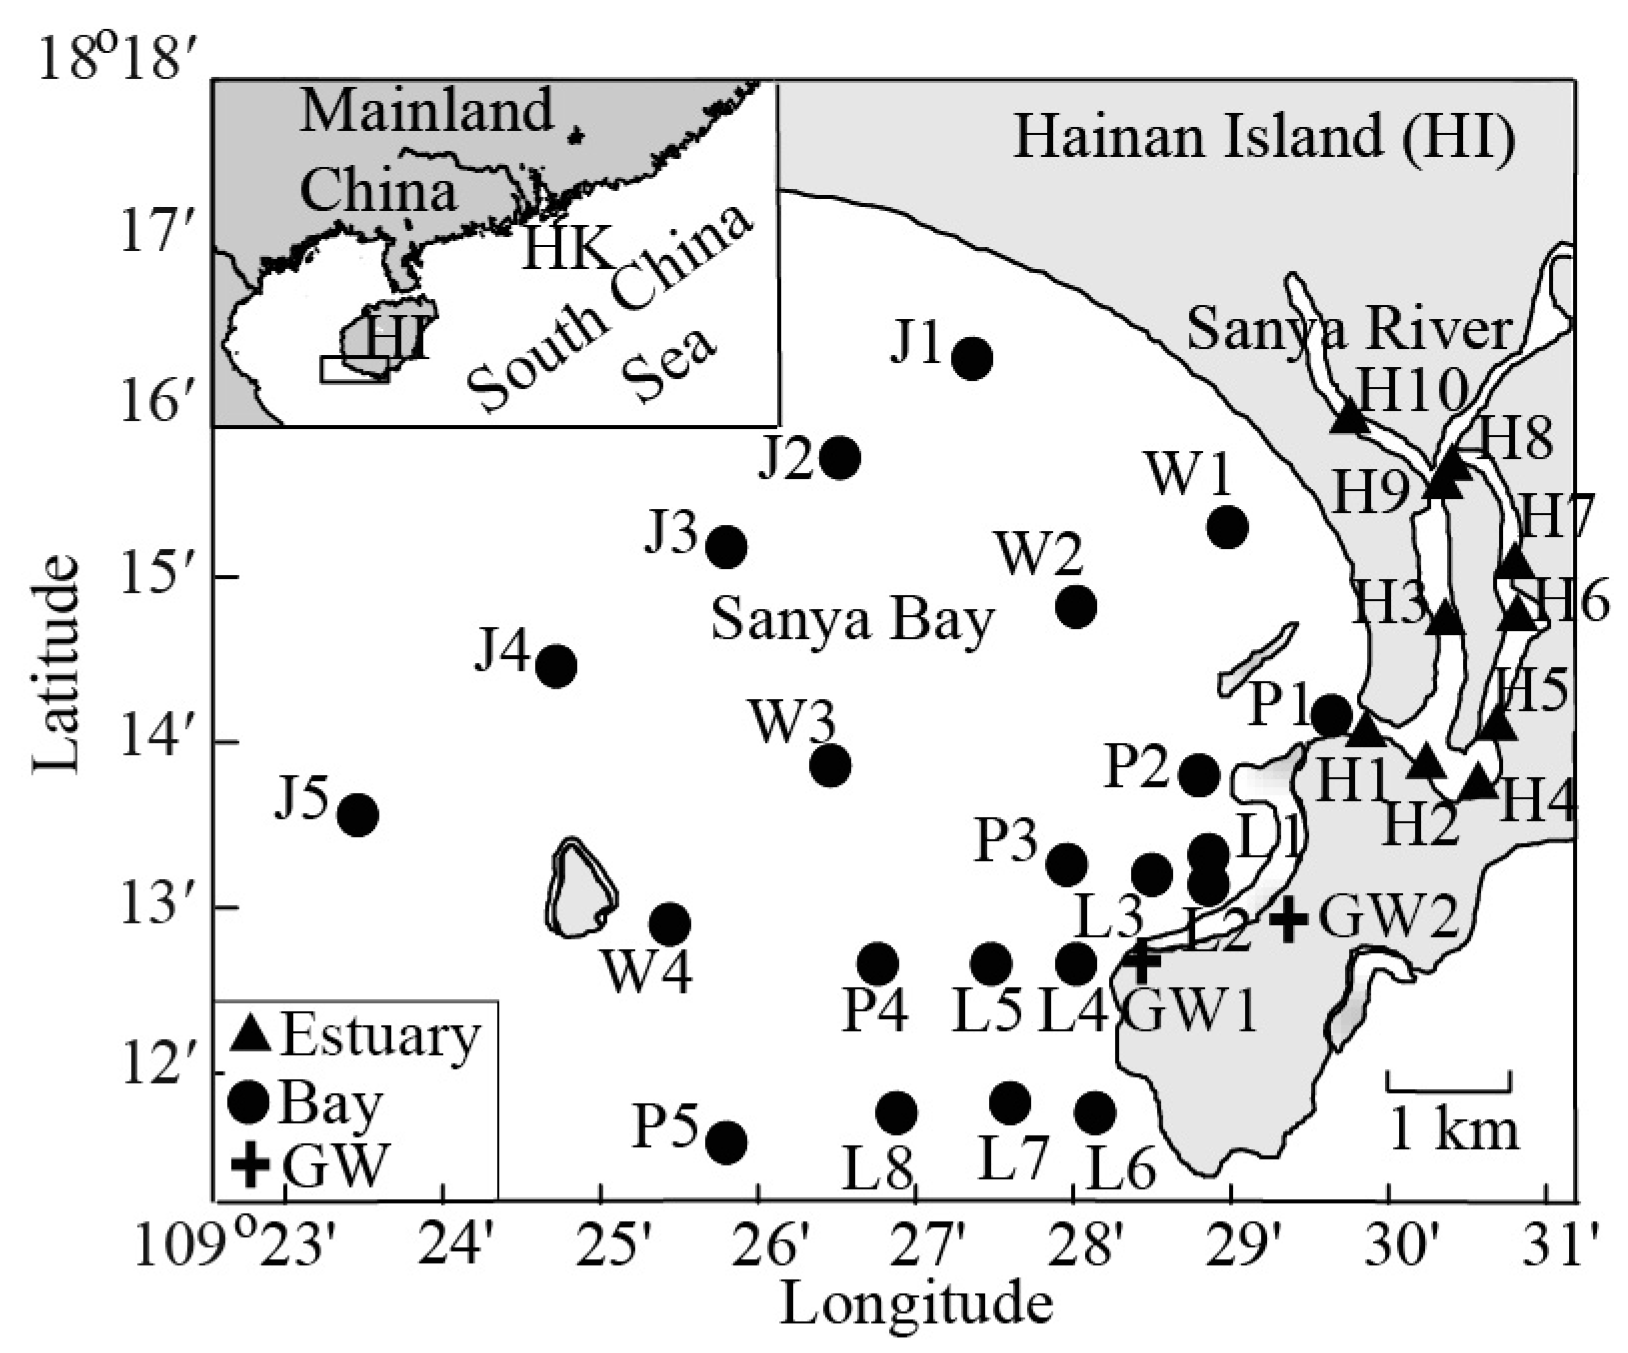
Sanya Bay is a tropical bay located at the southern tip of Hainan Island, China in the northern South China Sea under the influence of the Southeast Asian monsoon (Figure 1). Coral reefs account for 30% of its coastline [19]. The Sanya River flows into the bay in the northeast. Seasonal investigations in the bay demonstrated that the inner bay was influenced by the discharge of the Sanya River with relatively high nutrient levels, and the central and outer bay was dominated by oceanic forces from the South China Sea [20]. Our time-series studies demonstrate that tidally-driven SGD occurred at the Luhuitou fringing reef in the bay in a dry season, which caused coastal acidification [21] and affected nutrient dynamics of the reef system [22]. The flux of SGD into Sanya Bay based on Ra mass balance, however, has never been reported.
To quantify SGD and evaluate its geochemical impacts on Sanya Bay, a study was designed and implemented in February 2012, using radium isotopes as SGD tracers. This study includes time-series observations at the Luhuitou fringing coral reef and an investigation in the bay. The time-series observations were reported in Wang et al. [21]. The present work is focused on interpretations of the bay data. The results from this work indicate that SGD is a nutrient source more important than the Sanya River, the atmospheric deposition, and nitrogen fixation in Sanya Bay in dry season.
2. Materials and Methods
2.1. Study Area
Sanya Bay has an average water depth of 16 m [19] and irregular diurnal tides with a mean tidal range of 0.9 m [23]. The annual mean surface water temperature is 26.8 °C and the annual precipitation is around 1600–1800 mm [23]. The Sanya River discharges into Sanya Bay in the northeast with an annual average discharge of 5.86 m3 s−1 [24]. 90% of the rainfall occurs in May to October, and the river discharge in June to November accounts for 85% of the annual discharge [25]. Fringing reefs develop along the east coast and around the islands in the bay. Sanya Bay is oligotrophic under the influence of the northern South China Sea [26]. Multiple habitats, coral reefs, mangroves, mudflats, and rocky and sandy beaches, are present in the bay [19]. Holocene deposits of coral debris, sand, and silt surround the coast [27]. The sediments in the bay are mostly sands (>60%) [28], composing a highly permeable surface quifer.
2.2. Sampling and Measurements
Surface water samples were collected for radium, using a plastic barrel in Sanya Bay from 2–3 February 2012 and at the lower Sanya River estuary station H1 on 4 February 2012 (Figure 1). Samples for nutrients were collected using a 5 L Niskin bottle on 4 February 2012 in the Sanya River estuary in order to evaluate the estuarine export flux of nutrients. Temperature and salinity were measured using a multiparameter sonde YSI 6600. The salinity was in the Practical Salinity Scale.
Groundwater samples were taken from the well head after flushing at domestic wells in countryside using a submersible pump. Groundwater Station GW1 is about 50 m away from the coast. It is 2.05 m deep with a 1 m radius and samples were taken at this station every 2 h from the morning of 7 February to the morning of 8 February 2012 for 24 h to catch the diurnal variation of the groundwater. Station GW2 is about 100 m away from the coast and was sampled on 9 February 2012. At this station the well was about 40 cm in diameter and 2.33 m deep and the water was 0.83 m deep. Samples for dissolved nitrate and nitrite, phosphate, silicate, and radium isotopes were taken at both groundwater stations.
Radium samples were passed through a 1 μm cartridge filter followed by a MnO2-impregnated acrylic fiber (Mn-fiber) column to extract the dissolved radium [29]. The Mn-fiber was measured for 223Ra and 224Ra with a radium delayed coincidence counter [30] with an error less than 13%. After the measurements were finished in two months, the Mn-fibers were leached for 226Ra and 228Ra, which were then co-precipitated with BaSO4 and measured in a germanium gamma detector (GCW4022, Canberra) [31] with an error less than 7%. To estimate radium desorbed from particles of the estuary water, total suspended matter (TSM) was collected at Station P1 on pre-weighed and pre-combusted 47-mm-diameter GF/F filters (pore size of 0.7 μm) and measured by weighing after drying.
Nutrient samples were filtered through 0.45 μm cellulose acetate membranes and preserved with 1–2‰ chloroform. One filtrate was stored at 4 °C before measurement for silicate, and one was kept at −20 °C for nitrate, nitrite, and phosphate measurements. In the laboratory, nitrate, nitrite, silicate and phosphate were measured with a Technicon AA3 Auto-Analyzer (Bran-Luebbe, GmbH) following the same methods in Han et al. [32]. The analytical precision was better than 1% for nitrate and nitrite, 2% for phosphate, and 2.8% for silicate.
2.3. Radium Mass-Balance Model and Apparent Water Age Estimation
Radium mass balance was set up to calculate the flux of SGD. The decay of the long-lived radium isotopes, 226Ra (half-life = 1600 years) and 228Ra (half-life = 5.75 years), can be ignored in studying coastal and estuarine processes [33]. Under the assumption of steady state of the system investigated, long-lived radium loss via mixing was equal to gains from river, SGD, and sediment diffusion, i.e.,
where on the left-hand side are the source terms: the first term represents the dissolved radium flux from the river, where FR is the river water discharge, iRaR is the activity of dissolved iRa of the estuary water, i = 226 and 228; the second term represents the sediment diffusion flux of radium, where iFsed is the areal diffusive flux of iRa from the sediments, and AB is the sediment surface area of the bay investigated; the third term represents the desorbed radium flux from the river, where fd is the fraction of radium exchangeable from particles, iRap is the activity of iRa on particles, and CTSM is the concentration of TSM of the estuary water; and the fourth term represents the radium flux via SGD, where FSGD is the SGD flux, and iRaGW is the average activity of dissolved iRa of the groundwater; on the right-hand side are the sink terms: where VB is the volume of the bay under investigation, iRaB is the average activity of dissolved iRa in the bay, iRaO is the activity of dissolved iRa of the ocean water, and τ is the apparent water age in the bay.
The apparent water age in the bay can be estimated using the activity ratio of 224Ra and 228Ra under the assumption of steady state and constant continuous sources of radium from the sediments, rivers, and groundwater as derived by Moore et al. [33]:
where is the ratio of the flux of 224Ra over that of 228Ra into the system, equivalent to the activity ratio of 224Ra to 228Ra of the flux into the system, λ224 is the decay constant of 224Ra, and is the ratio of the inventory of 224Ra over that of 228Ra in the system, which is equal to the activity ratio of 224Ra to 228Ra in the system. In estimating the apparent water age, 224Ra works well in time scale of a few days and 223Ra works well in longer time scale up to tens of days [16,17,18]. Due to the relatively short residence time in the bay, 2.85–7.89 days [24], 224Ra, but not 223Ra, was used in the age model in this study.
3. Results
3.1. Radium Isotopes in Sanya Bay
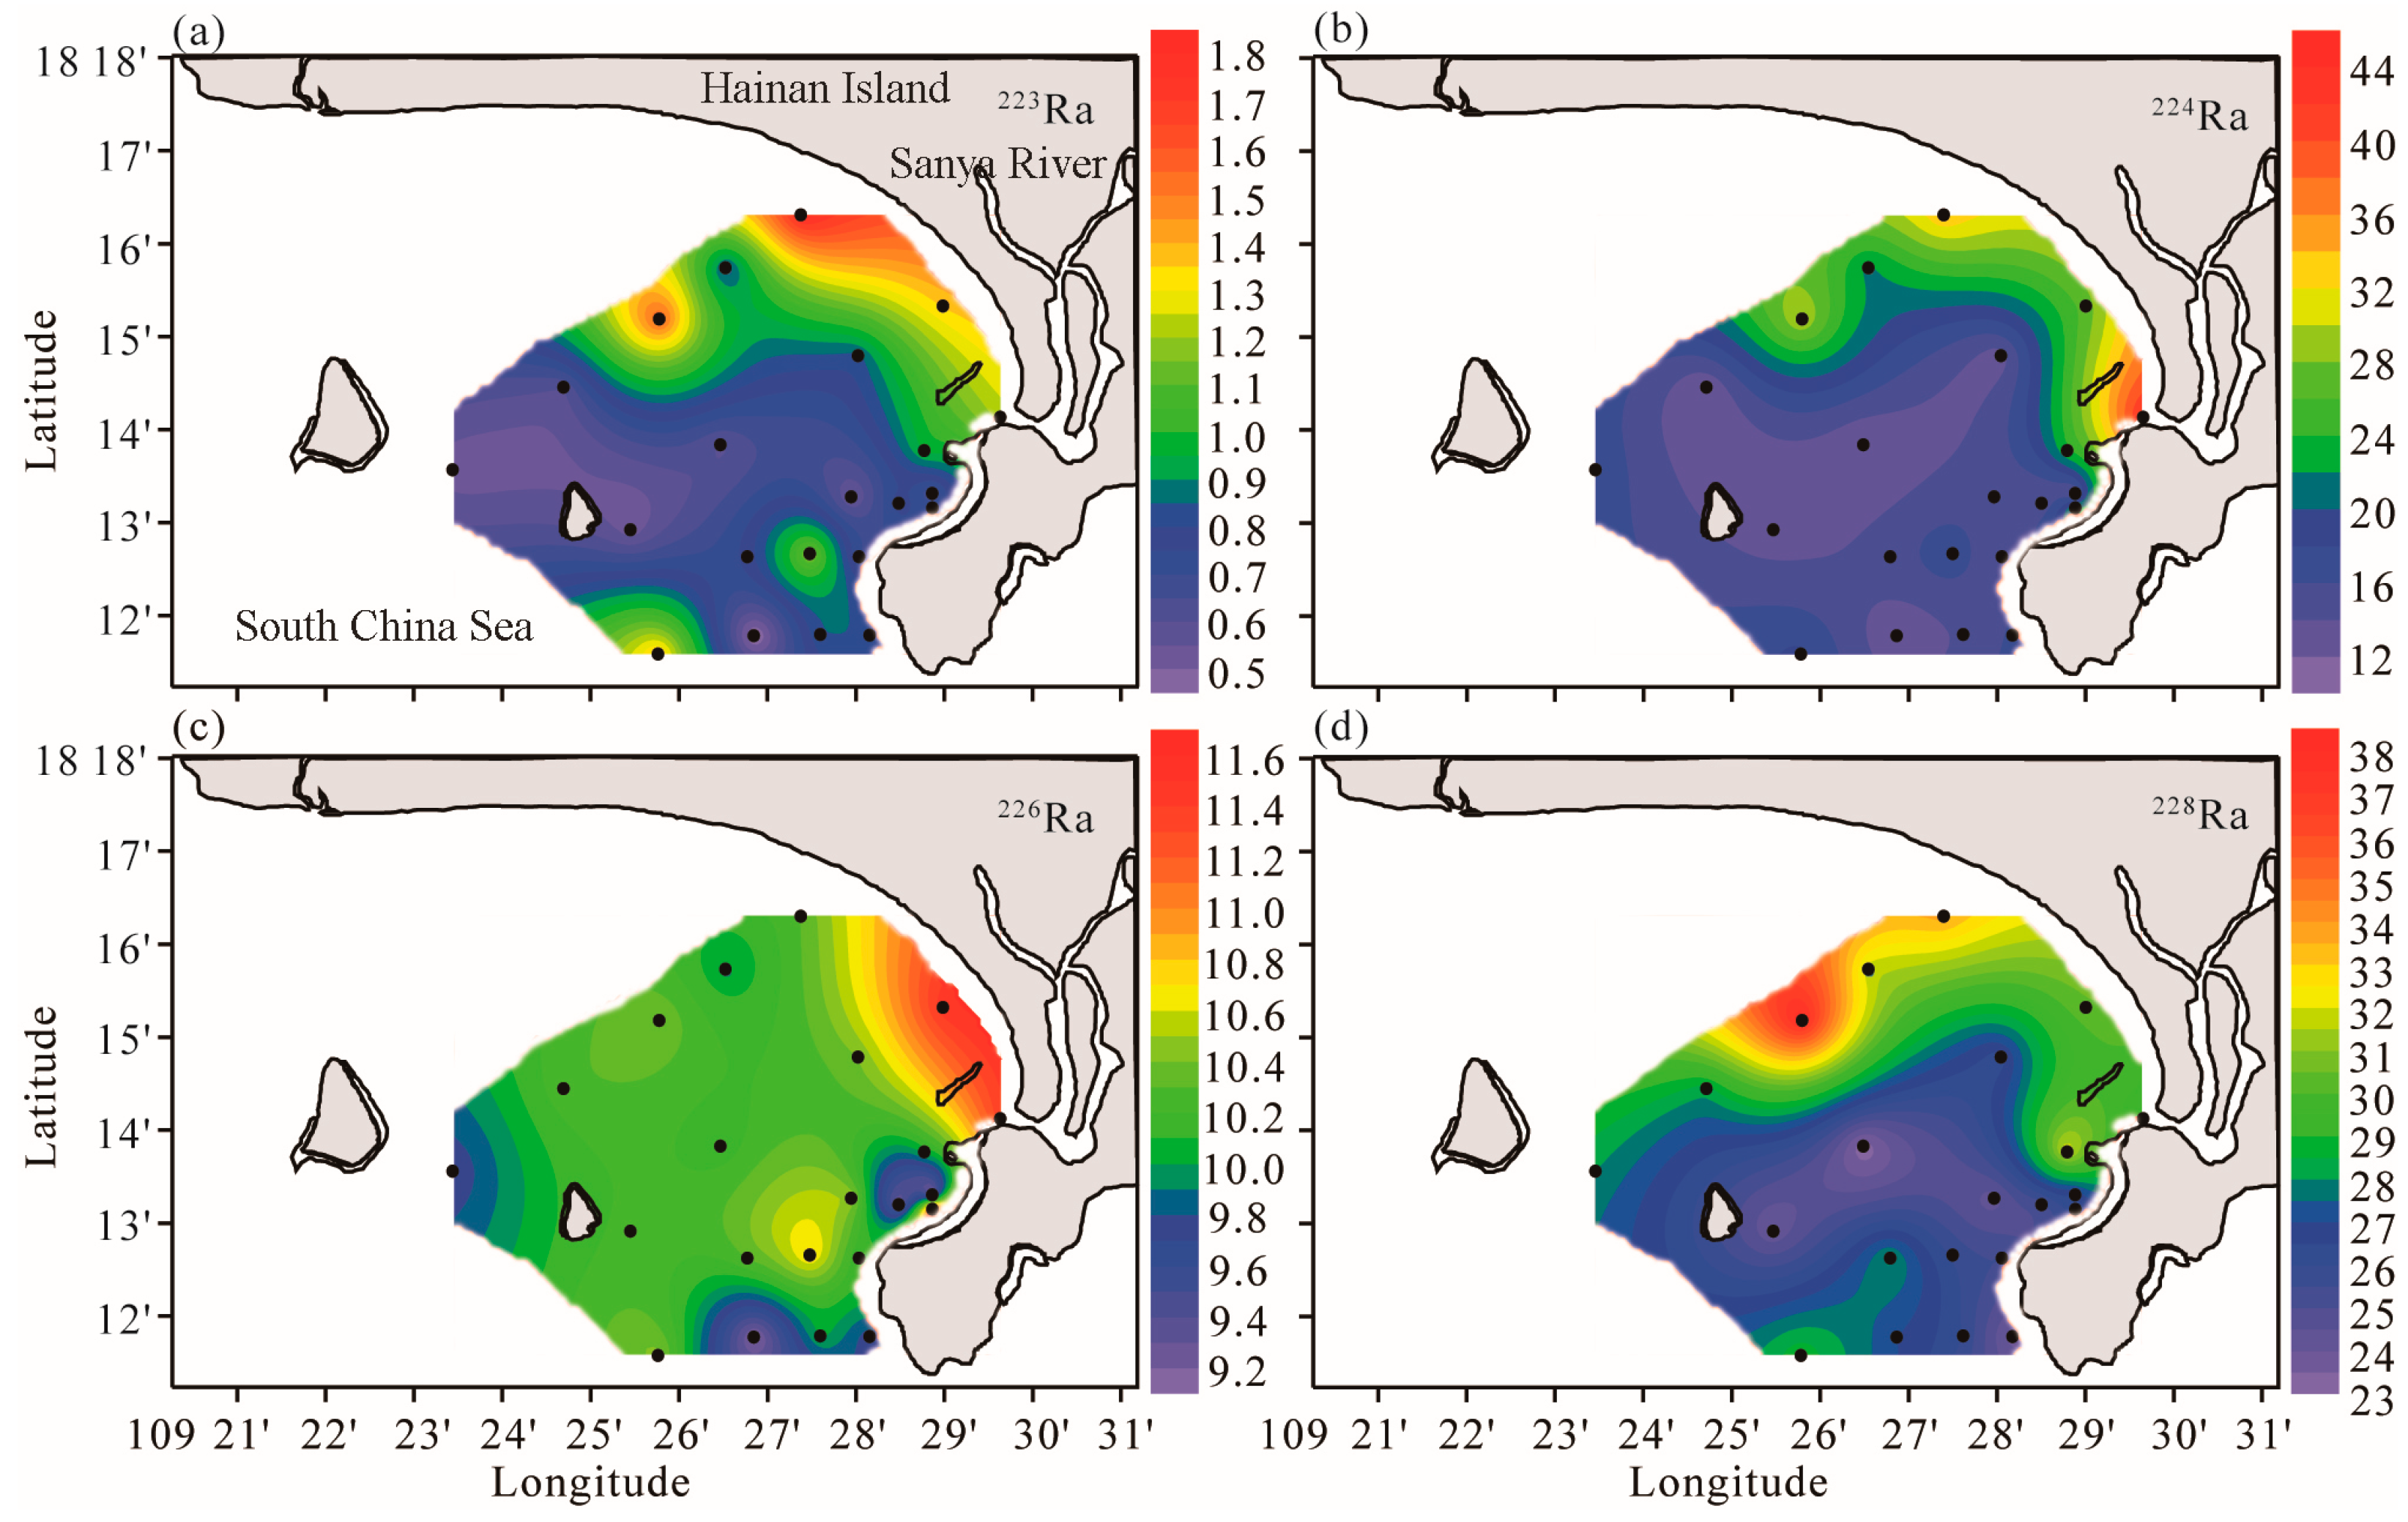
Activities of 223Ra ranged 0.4–1.8 dpm 100 L−1 (i.e., 0.07–0.30 Bq m−3), decreasing offshore and southward with the maximum in the north of the bay (Figure 2a). The activity of 228Ra showed a similar pattern, varying in the range 23–38 dpm 100 L−1 (Figure 2d). 224Ra and 226Ra demonstrated the highest activities in the northeast bay off the Sanya River estuary. The range of activity was 12–43 dpm 100 L−1 for 224Ra and 9.6–11.9 dpm 100 L−1 for 226Ra (Figure 2b,c). In general, activities of radium isotopes were higher in the northern Sanya Bay and outside the Sanya River estuary, coincident with lower salinities of 33.60–33.62 at these stations (Table 1). These higher radium signals were reflective of the Sanya River plume and other land sources.
3.2. Parameters of the Estuary Water and of the Groundwater
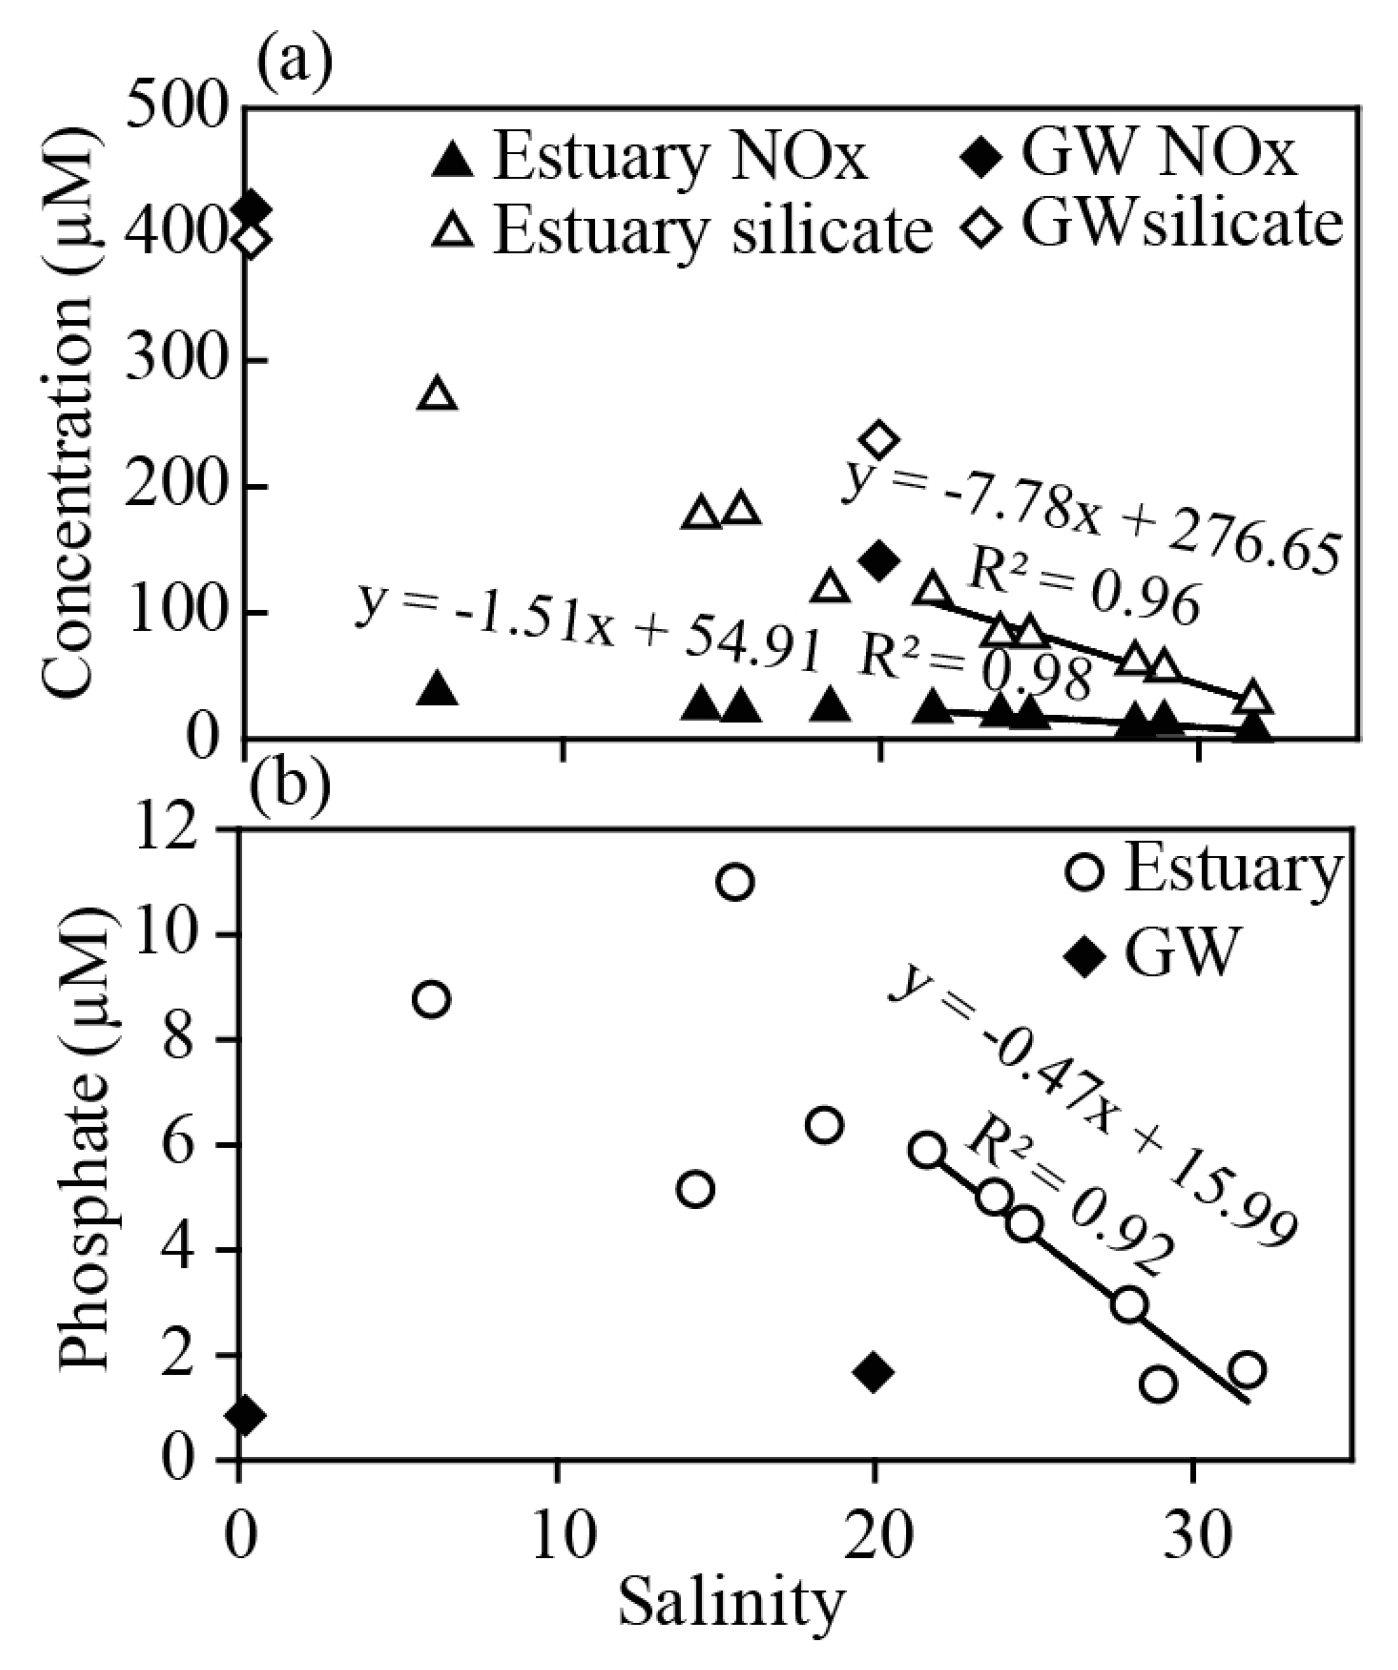
The salinity in the investigated Sanya River estuary increased from 6.06 downstream to 31.70 at the estuary outlet. Temperature ranged from 23.12 to 24.00. Nutrients decreased consistently with salinity for oxidized inorganic nitrogen (nitrite and nitrate) and silicate, from 36.6 to 6.72 μM for oxidized inorganic nitrogen with nitrite accounting for one third of oxidized inorganic nitrogen and from 271 to 30.1 μM for silicate (Figure 3a). For phosphate, a general decreasing trend was present (Figure 3b), however, the peak concentration, 11.0 μM, appeared at the mid-salinity station H8, where the salinity was 15.60, and the minimum concentration, 1.45 μM, showed at Station H3, where the salinity was 28.91. The deviation from conservative mixing of phosphate in the mid-salinity in estuaries has been proposed to be due to particle sorption/desorption [34,35]. The estuarine station H1 had a salinity of 31.70 and relatively high activities of radium isotopes (in dpm 100 L−1) compared with the bay water, 1.7 for 223Ra, 65 for 224Ra, 16 for 226Ra, and 44 for 228Ra. TSM of the estuary water was 25.3 mg L−1.
A weekly observation of temperature and salinity at groundwater Station GW1 indicated that groundwater properties were relatively constant with time, without apparent tidal resonances as the salinity varied in the range of 20.06–20.49 [21]. Oxidized inorganic nitrogen was mostly nitrate with nitrite less than 0.1% (i.e., <0.1 μM). The average concentrations of oxidized inorganic nitrogen, phosphate, and silicate (in μM) were 141 ± 15, 1.66 ± 0.53, and 237 ± 2, with n = 12, respectively. The average activities of radium isotopes (in dpm 100 L−1) were 30.6 ± 7.2 for 223Ra, 624 ± 26 for 224Ra, 246 ± 36 for 226Ra, and 435 ± 17 for 228Ra. At Station GW2 the salinity was 0.20. The activities of radium isotopes (in dpm 100 L−1) were much lower than at Station GW1, 2.0 for 223Ra, 62 for 224Ra, 18 for 226Ra, and 43 for 228Ra; while concentrations of nutrients were twice greater for oxidized inorganic nitrogen than at Station GW1, twice as high for silicate, but half as much for phosphate as at Station GW1. The lower Ra activity at Station GW2 than at Station GW1 was most likely due to less desorption of radium at smaller ionic strength in the groundwater. The nutrients in the groundwater were higher than those in the estuary at the same salinity for oxidized inorganic nitrogen and silicate (Figure 3a), presumably due to remineralization of organic matter in the groundwater [10]. However, phosphate was lower in the groundwater than in the estuary at the same salinity (Figure 3b), likely due to complexation and/or sorption of phosphate in the groundwater [10].
4. Discussion
4.1. Apparent Water Age in Sanya Bay
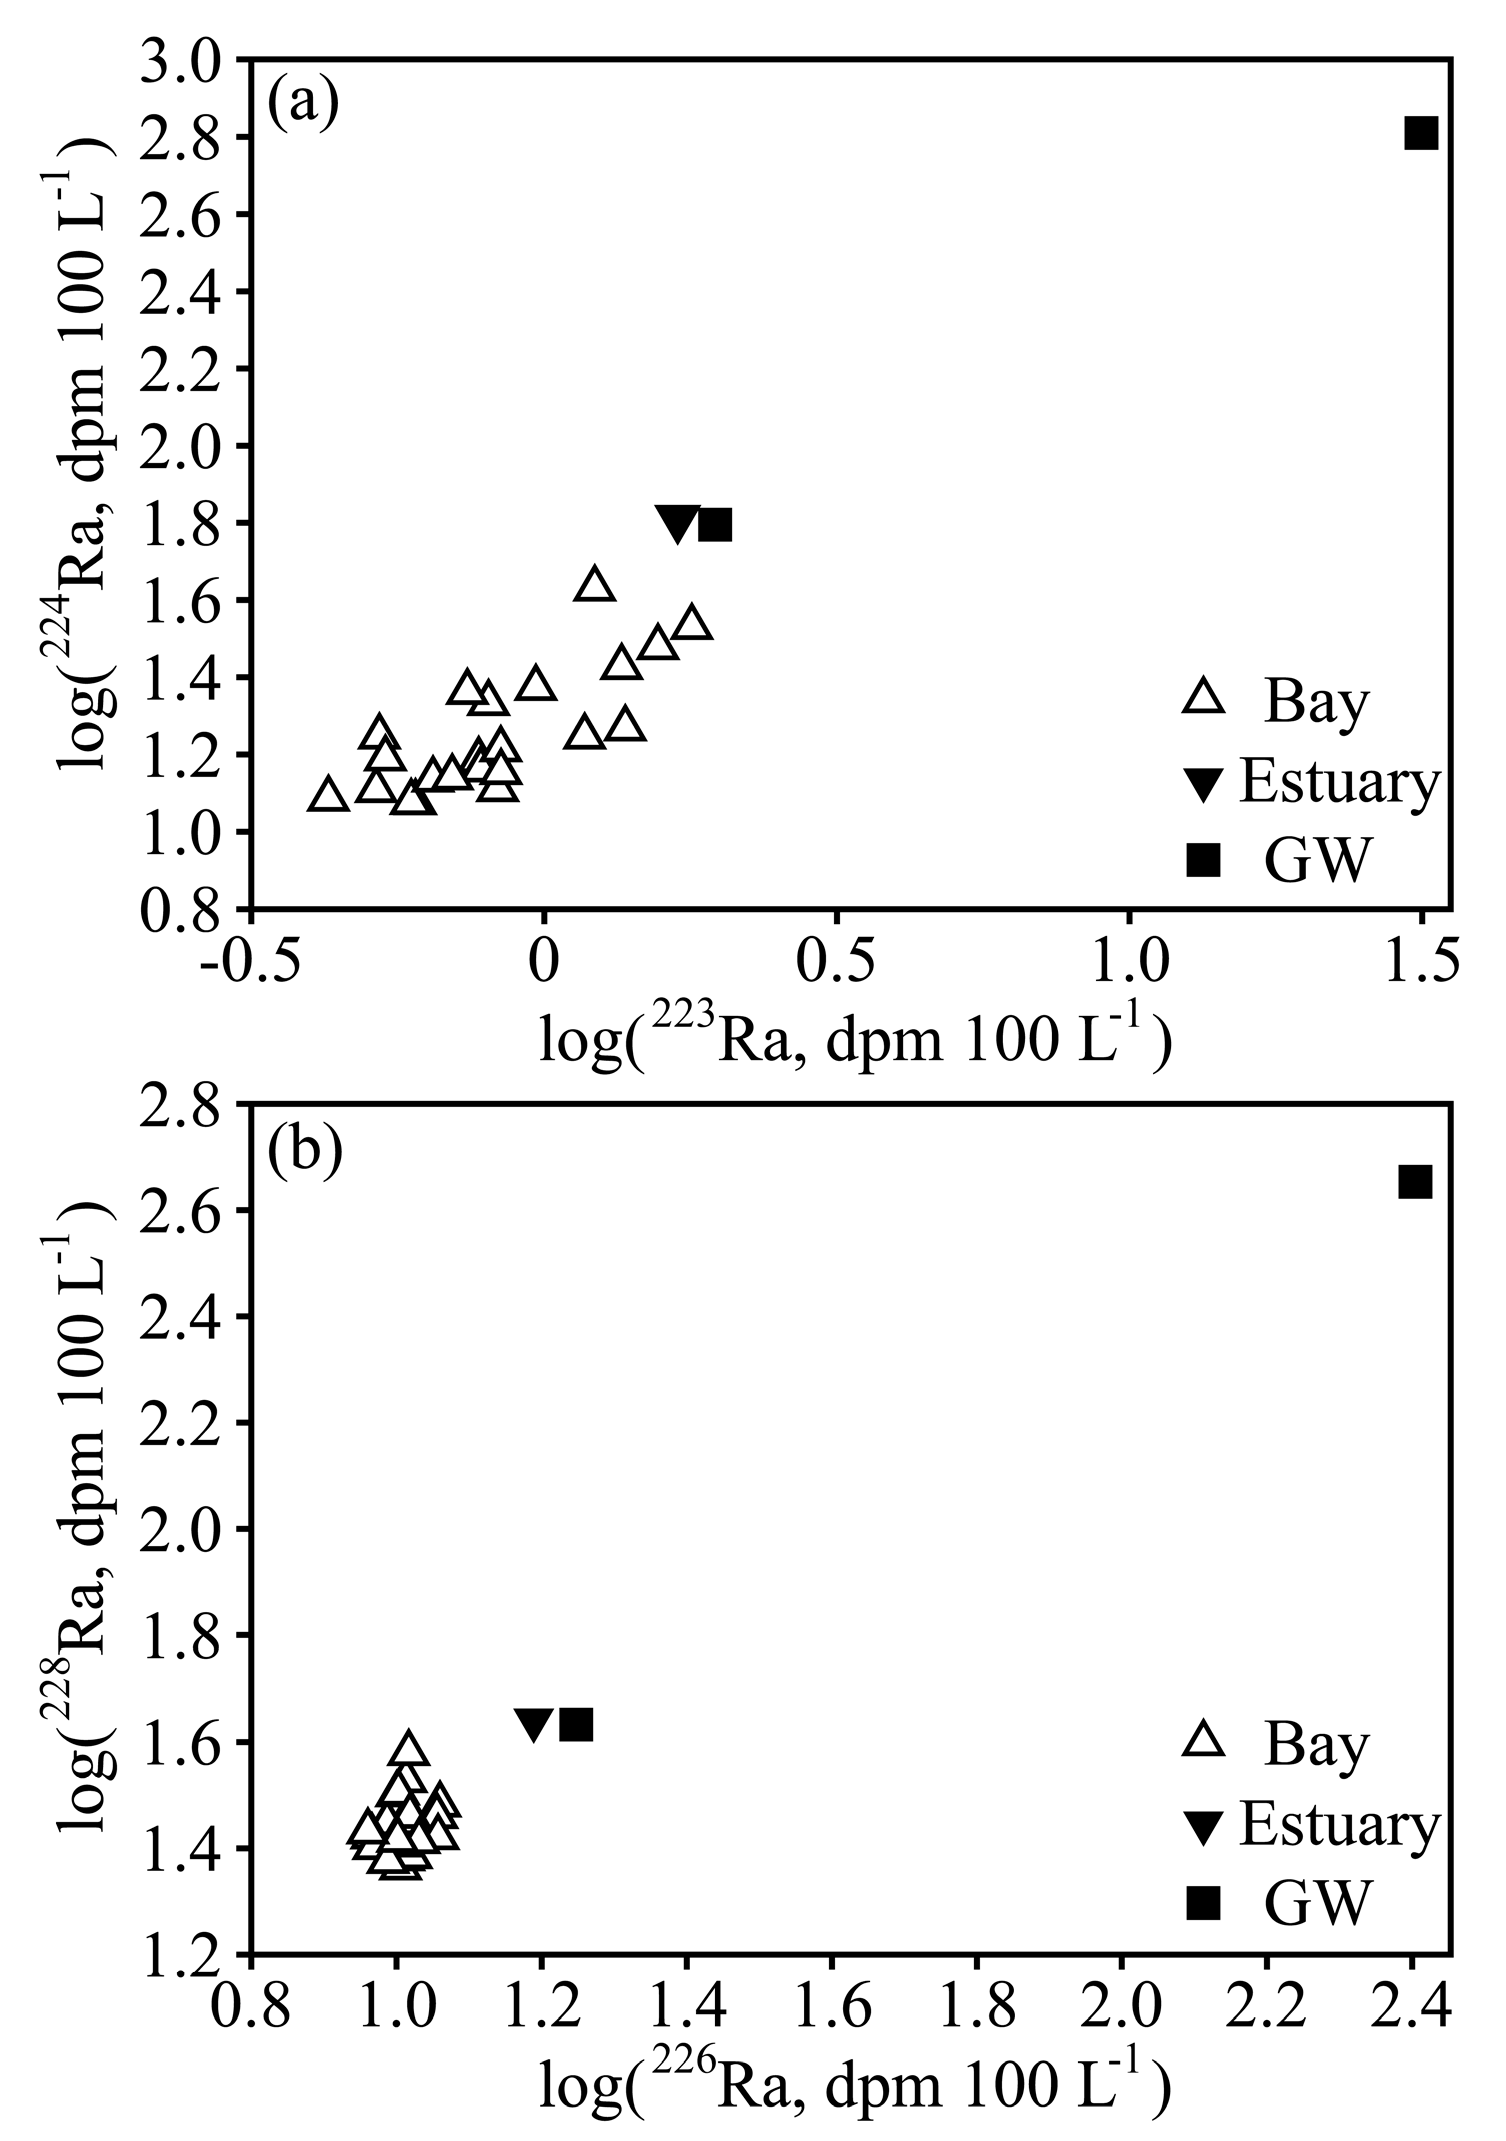
Dissolved radium in Sanya Bay appeared to have the same source as that of the estuary water and of the groundwater with 224Ra vs. 223Ra and 228Ra vs. 226Ra falling not far from a linear line (Figure 4). The activity ratio of 224Ra/228Ra ranged 0.42–1.48 in Sanya Bay with the maximum occurring at Station P1 outside the Sanya River estuary, with higher values in the north and northeast of the bay (Figure 5a), indicating sources of radium from the coastline. The surface salinity in the bay was slightly lower in the northeast off the Sanya River estuary and along the north coast, indicating the extension of the river plume along the north and northeast coast of the bay [22]. The extension of the river plume is coincident with the higher activity ratio of 224Ra/228Ra. Besides the river plume groundwater discharge from the coastline may likely contribute to the higher activity ratio. The intrusion of the northern South China Sea water into the bay caused the lower activity ratio of 224Ra/228Ra in the south of the bay. In terms of the sources of radium into Sanya Bay, the activity ratio of 224Ra/228Ra was almost the same for the Sanya River plume and groundwater, 1.48 for Sanya River estuary water and 1.44 ± 0.07 for the groundwater. SGD was assumed to have the same activity ratio as the groundwater. Considering that the radium flux from sediment diffusion is usually much less than SGD [9,33], the apparent water age in the bay was estimated using Equation (2), taking 1.48 to represent the activity ratio of radium input fluxes from the river plume and SGD. The apparent water age ranged 0–13.2 days in Sanya Bay with an average of 7.2 ± 3.2 days, relatively short near the north and northeast coast of the bay and increasing offshore (Figure 5b). The apparent water age was close to the residence time reported for Sanya Bay [24].
4.2. SGD Estimation Using Radium Isotopes
To estimate SGD into Sanya Bay, the mass balance of 226Ra and 228Ra was set up, respectively as illustrated in Equation (1). The average salinity of the bay water was 33.77 ± 0.10. Thus, groundwater Station GW1, a well much closer to the coast, where the average salinity was 20.22, was more representative of SGD water directly interacting with the bay water. Station GW1 is located at countryside without any land use and its aquifer is composed of Holocene deposits just as the rest of the coastal area of the bay. Therefore, data from Station GW1 were taken as the SGD end-member under the assumption that SGD occurred as brackish SGD. The Sanya River discharge in dry season was 15% of the annual discharge [24,25], which was 0.88 m3 s−1. The parameters at the lower estuarine station H1 were taken to calculate the river/estuarine contribution of radium to the bay. Diffusive fluxes of radium were taken from the literature [8,36]. The surface area of the bay investigated was the polygon area constrained by the sampling stations. The volume of the bay investigated was estimated using the surface area of the bay investigated and the average water depth of the bay, 16 m [19]. Radium data at an offshore station LE01 (110° E, 18° N) were taken to represent the ocean water radium. All the parameters used in Equation (1) to estimate SGD are listed in Table 2 and sources and sinks of radium in the bay were quantified and are listed in Table 3. The SGD flux was estimated to be 2.79 ± 1.37 × 10⁶ m3 d−1 (or 4.3 ± 2.1 cm d−1) based on 226Ra and 5.07 ± 2.64 × 10⁶ m3 d−1 (or 7.8 ± 4.1 cm d−1) based on 228Ra. This rate was comparable to the SGD rate along the eastern coast of Hainan Island and in other embayments in the Asian region and US (Table 4). The rate estimated using the mass balance of long-lived radium isotopes in the bay fell in the range of the seepage rates derived from time-series observations of 226Ra in a coastal station in Sanya Bay, 0–44 cm d−1 [21]. The SGD rate might be higher in the nearshore area as indicated by the higher seepage rates obtained at the coastal station.
The uncertainty in the flux of SGD was calculated considering errors in each term listed in Table 2 using error propagation as in Wang et al. [37]. The spatial variation in the residence time contributed the most, about 90%, to the uncertainty in the flux of SGD, followed by the error in the Ra activity of the groundwater endmember and of the bay water, then the error in the Ra activity of the ocean (Table A1). The error in the Ra activity of the river water contributed the least to the SGD flux uncertainty.
There are a couple of limitations in this study. The first is related to SGD endmember as follows: (a) groundwater sampling was not extensive along the coast; (b) beach groundwater was not sampled; and (c) only one brackish groundwater was taken as the SGD endmember. More groundwater sampling may make the determination of the SGD endmember more accurate. Nevertheless, more groundwater samples may increase the uncertainty of the SGD endmember and further increase the uncertainty of the SGD flux estimation. The second is related to the apparent water age in the mass balance model, where the apparent water age was taken to represent the residence time. Although the values of the two terms were comparable to each other, their physical definitions are different.
4.3. Nutrient Fluxes Via SGD into Sanya Bay and Their Contributions to the Nutrient Budgets
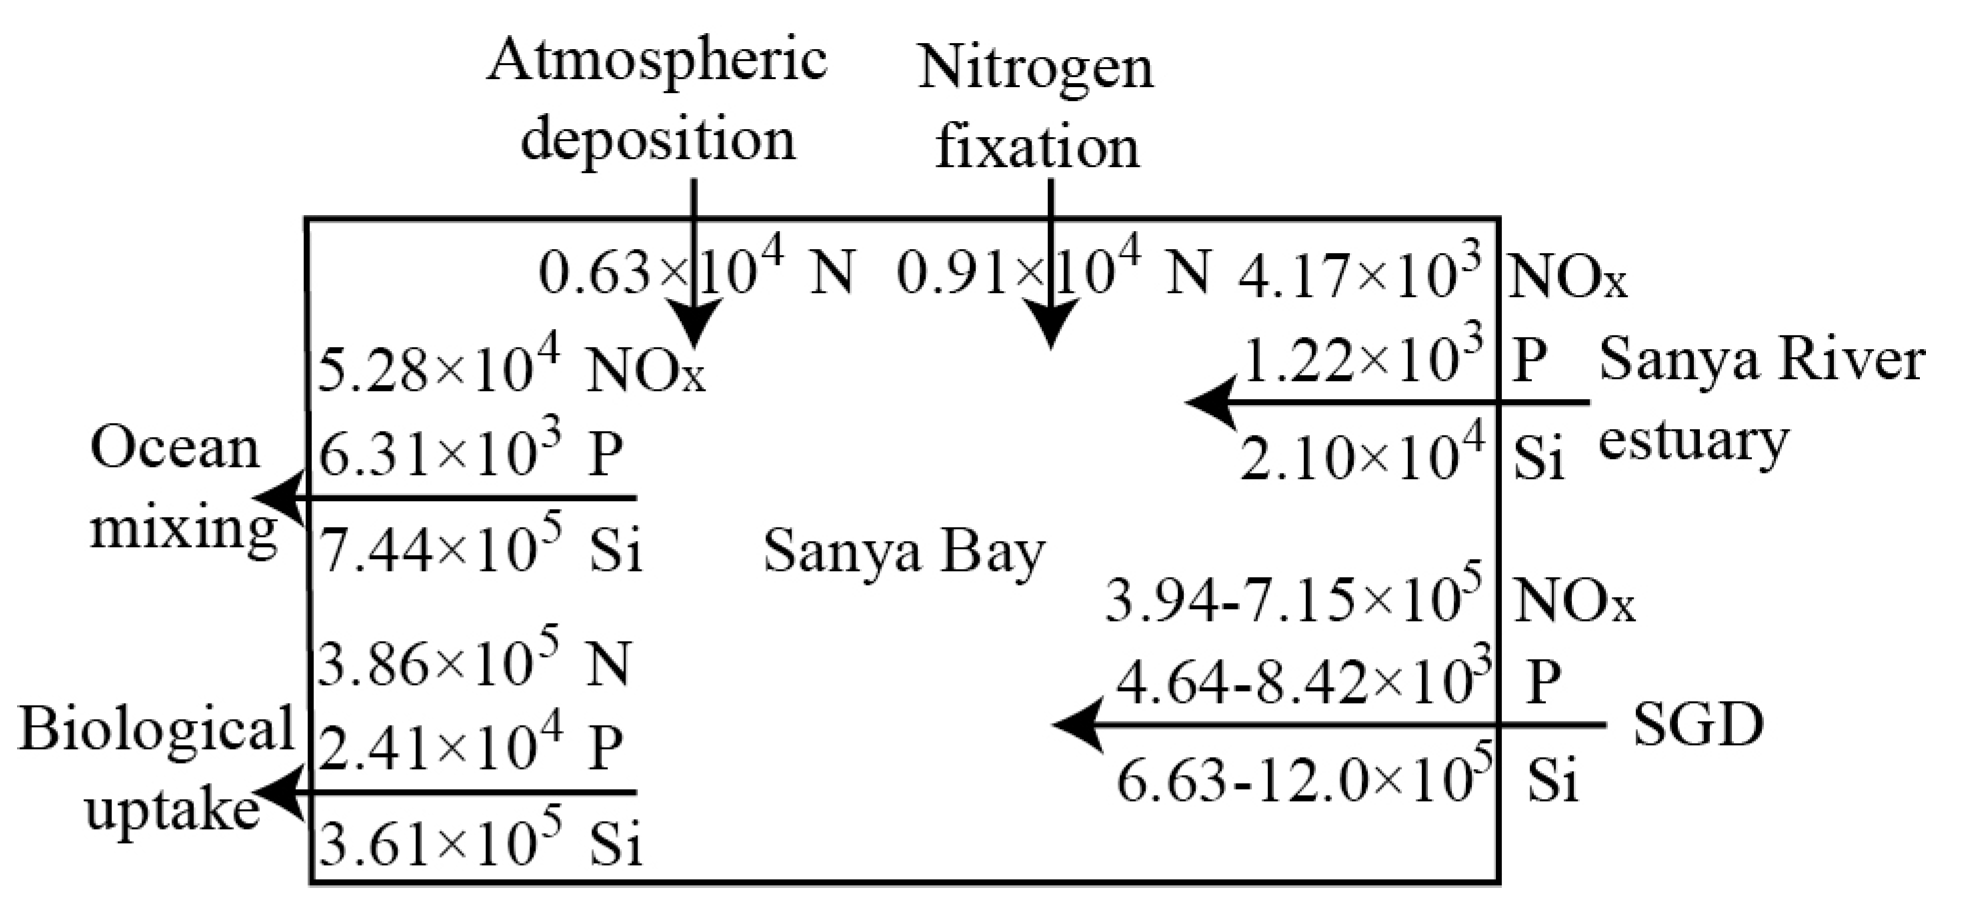
Nutrient fluxes via SGD into Sanya Bay were calculated using the flux of SGD estimated from surface distributions of long-lived radium in the bay multiplied by nutrient concentrations at the groundwater Station GW1. Thus, nutrient fluxes via SGD were 4.64 ± 2.74–8.42 ± 5.19 × 10³ mol d−1 for phosphate, 3.94 ± 2.00–7.15 ± 3.85 × 10⁵ mol d−1 for oxidized inorganic nitrogen, and 6.63 ± 3.29–12.0 ± 6.34 × 10⁵ mol d−1 for silicate. The uncertainty in the material flux was calculated using error propagation considering the uncertainty in the flux of SGD and in the groundwater nutrient concentrations. Sanya Bay is oligotrophic with concentrations of nutrients in the range of below the detection limit (BDL) to 0.17 μM for phosphate, BDL to 1.13 μM for oxidized inorganic nitrogen, and 4.06–7.92 μM for silicate [22]. The inventory of nutrients in Sanya Bay was estimated, taking the average concentration of nutrients in the bay and multiplied by the water volume under investigation, to be 4.57 × 10⁴ mol phosphate, 3.82 × 10⁵ mol oxidized inorganic nitrogen, and 5.39 × 10⁶ mol silicate. The inventory was then divided by the residence time in the bay, 7.2 d, and a removal rate of nutrients by mixing was estimated to be 6.31 × 10³ mol d−1 phosphate, 5.28 × 10⁴ mol d−1 oxidized inorganic nitrogen, and 7.44 × 10⁵ mol d−1 silicate. Comparisons with SGD-associated nutrient fluxes indicated that SGD could supply all oxidized inorganic nitrogen and almost all phosphate and silicate removed by mixing in Sanya Bay. The average planktonic primary production in Sanya Bay in winter is 39.36 mmol C m−2 d−1 [43]. Diatoms account for almost 80% of the phytoplankton in Sanya Bay [44]. Assuming an uptake ratio of C:N:P:Si of 106:16:1:15 [45,46], the corresponding nutrient uptake rates would be 2.41 × 10⁴ mol d−1 for phosphorus, 3.86 × 10⁵ mol d−1 for nitrogen, and 3.61 × 10⁵ mol d−1 for silicate. SGD seemed to provide more than enough nitrogen and silicate and at least 19% of the phosphorus necessary to support this planktonic primary production. In addition, nitrite, nitrate, and phosphate at offshore stations were below detection limits [22], indicating that the ocean provided negligible, if any, nutrients to Sanya Bay. The average nitrogen fixation rate in the bay is 0.14 mmol m−2 d−1 in winter [43], at most 2% equivalent to that contributed by SGD. The estuarine export nutrient fluxes from the Sanya River estuary were estimated, using an effective concentration multiplied by the dry-season river discharge, to be 1.22 × 10³ mol d−1 for phosphate, 4.17 × 10³ mol d−1 for oxidized inorganic nitrogen, and 2.10 × 10⁴ mol d−1 for silicate, which was a few times smaller than the SGD-associated phosphate flux and at least an order of magnitude smaller than the oxidized inorganic nitrogen and silicate fluxes carried by SGD. The effective concentration was the y intercept of a linear regression of the concentration in the estuary against salinity at mid to high salinity [47]. As shown in Figure 3, the linear regressions were significant for these nutrients with R2 > 0.9, p < 0.01 and the effective concentration was 16.0 μM for phosphate, 54.9 μM for oxidized inorganic nitrogen, and 277 μM for silicate. Another source of nutrients is atmospheric deposition. Since there was no rain during the two weeks before our sampling, a higher dry deposition rate of nitrogen for the south China from the literature, 9.72 × 10⁻⁵ mol m−2 d−1 [48], was considered, which gave a deposition flux of 6.31 × 10³ mol d−1 nitrogen. The deposition flux is about two orders of magnitude smaller than SGD-contributed nitrogen. Thus, SGD is the most important nutrient contributor to Sanya Bay in winter.
In the nutrient budget of Sanya Bay (Figure 6), the source terms include the Sanya River estuarine export, SGD, atmospheric deposition, and nitrogen fixation. The sink terms are ocean mixing and biological uptake. The biological uptake of nutrients is directly related to carbon uptake, i.e., conversion of inorganic carbon to organic carbon. On the other hand remineralization of organic matter releases inorganic carbon and nutrients. In this sense nutrient cycles are intertwined with the carbon cycle. The total sink is 4.39 × 10⁵ mol d−1 nitrogen, 3.04 × 10⁴ mol d−1 phosphorus, and 1.11 × 10⁶ mol d−1 silicate, while the total source is 4.13–7.34 × 10⁵ mol d−1 nitrogen, 5.86–9.64 × 10³ mol d−1 phosphorus, and 6.84–12.2 × 10⁵ mol d−1 silicate. According to our data, the source and sink terms of nitrogen and silicate can be balanced in Sanya Bay. A deficit in phosphate is present. At least 2.08 × 10⁴ mol d−1 phosphorus is required to fill the gap. We propose two reasons for this deficit: (a) benthic flora of about 150 species were found in Sanya Bay [49] and macroalgae usually demonstrate an N:P ratio of about 30 in their tissues [50]; if this ratio were considered in estimating the biological uptake rate of phosphate based on the nitrogen uptake rate, a much lower biological uptake rate of phosphate would have been obtained to decrease the deficit; and (b) benthic release of phosphorus due to remineralization or grazing of organic matter may be a phosphate source.
Nutrients carried by SGD account for 95–97% oxidized inorganic nitrogen, 79–87% phosphate, and 97–98% silicate of the nutrient source in Sanya Bay. SGD may compensate for at least 90% oxidized inorganic nitrogen, 15% phosphate, and 60% silicate of the nutrient sink in the bay and satisfy all nitrogen and silicate requirements by phytoplankton growth in the bay in dry season. Our results substantiate the regulation of SGD on nutrient composition in a coral reef system of Sanya Bay found in our time-series studies [22]. In summer, with upwelling influencing this area [51] as well as greater river discharge, the nutrient budget may be different from that in dry seasons and the contribution of SGD to the nutrient budget merits investigations. Nutrient enrichments have caused worldwide coastal environmental issues of eutrophication and hypoxia [52,53]. With frequencies and areas of eutrophication and associated hypoxia increasing around the world coast [54], coastal ecosystems under risk necessitates long term monitoring of SGD and its associated material fluxes in environmental protection programs.
Acknowledgments
We thank the crew on the ship QiongLinGao 02706 and Junde Dong for arranging local logistic support at the Tropical Marine Biological Research Station in Hainan, Chinese Academy of Sciences. Zhouling Zhang and Yi Xu helped in sample collection. Daochen Zhao measured the long-lived radium isotopes. We thank the two anonymous reviewers for their constructive comments. This work and publication in open access are supported by MOST (2015CB954001) and the National Natural Science Foundation of China (41576074).
Author Contributions
Guizhi Wang and Wenping Jing conceived and designed the project; Guizhi Wang, Shuling Wang, and Zhangyong Wang collected the samples and performed the measurements; Guizhi Wang analyzed the data; Guizhi Wang wrote the paper.
Conflicts of Interest
The authors declare no conflict of interest. The founding sponsors had no role in the design of the study; in the collection, analyses, or interpretation of data; in the writing of the manuscript, and in the decision to publish the results.
Appendix A

Table A1.
Errors calculated using error propagation for FSGD considering the uncertainty in each parameter in Equation (1) with values listed in Table 2.
Table A1.
Errors calculated using error propagation for FSGD considering the uncertainty in each parameter in Equation (1) with values listed in Table 2.
| FSGD_226Ra (m3 d−1) | 2.16 × 10² | 2.46 × 10⁵ | 4.08 × 10⁵ | 1.25 × 10⁶ | 3.86 × 10⁵ | 1.39 × 10⁶ |
| FSGD_228Ra (m3 d−1) | 3.32 × 10² | 4.69 × 10⁵ | 1.11 × 10⁵ | 2.35 × 10⁶ | 1.18 × 10⁶ | 2.67 × 10⁶ |
Note: represents the uncertainty resulting from the uncertainty in x. The subscript “R” represents river, “O”— ocean endmember, “GW”—groundwater, “B”—bay water.
References
- Booth, J.A.T.; McPhee-Shaw, E.E.; Chua, P.; Kingsley, E.; Denny, M.; Phillips, R.; Bograd, S.J.; Zeidberg, L.D.; Gilly, W.F. Natural intrusions of hypoxic, low pH water into nearshore marine environments on the California coast. Cont. Shelf Res. 2012, 45, 108–115. [Google Scholar] [CrossRef]
- Feely, R.A.; Sabine, C.L.; Hernandez-Ayon, J.M.; Ianson, D.; Hales, B. Evidence for upwelling of corrosive “acidified” water onto the continental shelf. Science 2008, 320, 1490–1492. [Google Scholar] [CrossRef] [PubMed]
- Glenn, S.; Arnone, R.; Bergmann, T.; Bissett, W.P.; Crowley, M.; Cullen, J.; Gryzmski, J.; Haidvogel, D.; Kohut, J.; Moline, M.; et al. Biogeochemical impact of summertime coastal upwelling on the New Jersey Shelf. J. Geophys. Res. Oceans 2004, 109, 15. [Google Scholar] [CrossRef]
- Grantham, B.A.; Chan, F.; Nielsen, K.J.; Fox, D.S.; Barth, J.A.; Huyer, A.; Lubchenco, J.; Menge, B.A. Upwelling-driven nearshore hypoxia signals ecosystem and oceanographic changes in the Northeast Pacific. Nature 2004, 429, 749–754. [Google Scholar] [CrossRef] [PubMed]
- Peterson, J.O.; Morgan, C.A.; Peterson, W.T.; Di Lorenzo, E. Seasonal and interannual variation in the extent of hypoxia in the Northern California Current from 1998–2012. Limnol. Oceanogr. 2013, 58, 2279–2292. [Google Scholar] [CrossRef]
- Zhang, J.; Gilbert, D.; Gooday, A.J.; Levin, L.; Naqvi, S.W.A.; Middelburg, J.J.; Scranton, M.; Ekau, W.; Pena, A.; Dewitte, B.; et al. Natural and human-induced hypoxia and consequences for coastal areas: Synthesis and future development. Biogeosciences 2010, 7, 1443–1467. [Google Scholar] [CrossRef] [Green Version]
- Cai, W.-J.; Wang, Y.; Krest, J.; Moore, W. The geochemistry of dissolved inorganic carbon in a surficial groundwater aquifer in North Inlet, South Carolina, and the carbon fluxes to the coastal ocean. Geochim. Cosmochim. Acta 2003, 67, 631–639. [Google Scholar] [CrossRef]
- Charette, M.A.; Buesseler, K.O.; Andrews, J.E. Utility of radium isotopes for evaluating the input and transport of groundwater-derived nitrogen to a Cape Cod estuary. Limnol. Oceanogr. 2001, 46, 465–470. [Google Scholar] [CrossRef]
- Liu, Q.; Dai, M.; Chen, W.; Huh, C.-A.; Wang, G.; Li, Q.; Charette, M.A. Charette, How significant is submarine groundwater discharge and its associated dissolved inorganic carbon in a river-dominated shelf system? Biogeosciences 2012, 9, 1777–1795. [Google Scholar] [CrossRef]
- Moore, W.S. The Effect of Submarine Groundwater Discharge on the Ocean. Annu. Rev. Mar. Sci. 2010, 2, 59–88. [Google Scholar] [CrossRef] [PubMed]
- Moosdorf, N.; Stieglitz, T.; Waska, H.; Duerr, H.H.; Hartmann, J. Submarine groundwater discharge from tropical islands: A review. Grundwasser 2015, 20, 53–67. [Google Scholar] [CrossRef]
- Porubsky, W.P.; Weston, N.B.; Moore, W.S.; Ruppel, C.; Joye, S.B. Dynamics of submarine groundwater discharge and associated fluxes of dissolved nutrients, carbon, and trace gases to the coastal zone (Okatee River estuary, South Carolina). Geochim. Cosmochim. Acta 2014, 131, 81–97. [Google Scholar] [CrossRef]
- Burnett, W.C.; Dulaiova, H. Estimating the dynamics of groundwater input into the coastal zone via continuous radon-222 measurements. J. Environ. Radioact. 2003, 69, 21–35. [Google Scholar] [CrossRef]
- Dulaiova, H.; Gonneea, M.E.; Henderson, P.B.; Charette, M.A. Geochemical and physical sources of radon variation in a subterranean estuary—Implications for groundwater radon activities in submarine groundwater discharge studies. Mar. Chem. 2008, 110, 120–127. [Google Scholar] [CrossRef]
- Schwartz, M.C. Significant groundwater input to a coastal plain estuary: Assessment from excess radon. Estuar. Coast. Shelf Sci. 2003, 56, 31–42. [Google Scholar] [CrossRef]
- Gu, H.; Moore, W.S.; Zhang, L.; Du, J.; Zhang, J. Using radium isotopes to estimate the residence time and the contribution of submarine groundwater discharge (SGD) in the Changjiang effluent plume, East China Sea. Cont. Shelf Res. 2012, 35, 95–107. [Google Scholar] [CrossRef]
- Moore, W.S. Ages of continental shelf waters determined from 223Ra and 224Ra. J. Geophys. Res. Oceans 2000, 105, 22117–22122. [Google Scholar] [CrossRef]
- Moore, W.S.; Krest, J. Distribution of 223Ra and 224Ra in the plumes of the Mississippi and Atchafalaya Rivers and the Gulf of Mexico. Mar. Chem. 2004, 86, 105–119. [Google Scholar] [CrossRef]
- Huang, L.; Tan, Y.; Song, X.; Huang, X.; Wang, H.; Zhang, S.; Dong, J.; Chen, R. The status of the ecological environment and a proposed protection strategy in Sanya Bay, Hainan Island, China. Mar. Pollut. Bull. 2003, 47, 180–186. [Google Scholar] [CrossRef]
- Wu, M.-L.; Ling, J.; Long, L.-J.; Zhang, S.; Zhang, Y.-Y.; Wang, Y.-S.; Dong, J.-D. Influence of human activity and monsoon dynamics on spatial and temporal hydrochemistry in tropical coastal waters (Sanya Bay, South China Sea). Chem. Ecol. 2012, 28, 375–390. [Google Scholar] [CrossRef]
- Wang, G.; Jing, W.; Wang, S.; Xu, Y.; Wang, Z.; Zhang, Z.; Li, Q.; Dai, M. Coastal acidification induced by tidal-driven submarine groundwater discharge in a coastal coral reef system. Environ. Sci. Technol. 2014, 48, 13069–13075. [Google Scholar] [CrossRef] [PubMed]
- Wang, G.; Wang, S.; Wang, Z.; Jing, W.; Xu, Y.; Zhang, Z.; Tan, E.; Dai, M. Tidal variability of nutrients in a coastal coral reef system influenced by groundwater. Biogeosci. Discuss. 2017. [Google Scholar] [CrossRef]
- Zhang, Q. On biogeomorphology of Luhuitou fringing reef of Sanya city, Hainan Island, China. Chin. Sci. Bull. 2001, 46, 97–101. [Google Scholar] [CrossRef]
- Wang, H.; Dong, J.; Wang, Y.; Chen, G.; Zhang, Y. Variations of nutrient contents and their transportation estimate at Sanya Bay. J. Trop. Oceanogr. 2005, 25, 90–95. [Google Scholar]
- Han, Y.; Zheng, H. Current situation and utilization of water resources in Sanya City. Chin. Water Sci. Eng. Technol. 2012, 6, 19–22. [Google Scholar]
- Wu, M.-L.; Zhang, Y.-Y.; Dong, J.-D.; Cai, C.-H.; Wang, Y.-S.; Long, L.-J.; Zhang, S. Monsoon-driven dynamics of environmental factors and phytoplankton in tropical Sanya Bay, South China sea. Oceanol. Hydrobiol. Stud. 2012, 41, 57–66. [Google Scholar] [CrossRef]
- Zhao, X.; Peng, G.; Zhang, J. A preliminary study of Holocene stratigraphy and sea level changes along the coast of Hainan Island. Chin. J. Geol. 1979, 4, 350–358. [Google Scholar]
- Che, Z.; Zhou, Y.; Che, Z. Comparison of the distribute characteristics of the suspended sediments between the Sanya River mouth and offshore water body. Chin. J. Hainan Univ. Nat. Sci. 2010, 28, 134–138. [Google Scholar]
- Rama; Moore, W.S. Using the radium quartet for evaluating groundwater input and water exchange in salt marshes. Geochim. Cosmochim. Acta 1996, 60, 4645–4652. [Google Scholar] [CrossRef]
- Moore, W.S.; Arnold, R. Measurement of 223Ra and 224Ra in coastal waters using a delayed coincidence counter. J. Geophys. Res. Oceans 1996, 101, 1321–1329. [Google Scholar] [CrossRef]
- Moore, W.S. Radium isotope measurements using germanium detectors. Nucl. Instrum. Methods Phys. Res. 1984, 223, 407–411. [Google Scholar] [CrossRef]
- Han, A.Q.; Dai, M.H.; Kao, S.J.; Gan, J.P.; Li, Q.; Wang, L.F.; Zhai, W.D.; Wang, L. Nutrient dynamics and biological consumption in a large continental shelf system under the influence of both a river plume and coastal upwelling. Limnol. Oceanogr. 2012, 57, 486–502. [Google Scholar] [CrossRef]
- Moore, W.S.; Blanton, J.O.; Joye, S.B. Estimates of flushing times, submarine groundwater discharge, and nutrient fluxes to Okatee Estuary, South Carolina. J. Geophys. Res. Oceans 2006, 111. [Google Scholar] [CrossRef]
- Froelich, P.N.; Bender, M.L.; Luedtke, N.A. The marine phosphorus cycle. Am. J. Sci. 1982, 282, 474–511. [Google Scholar] [CrossRef]
- Van der Zee, C.; Roevros, N.; Chou, L. Phosphorus speciation, transformation and retention in the Scheldts estuary (Belgium/The Netherlands) from the freshwater tidal limits to the North Sea. Mar. Chem. 2007, 106, 76–91. [Google Scholar] [CrossRef]
- Krest, J.M.; Rama, W.S.M. 226Ra and 228Ra in the mixing zones of the Mississippi and Atchafalaya Rivers: Indicators of groundwater input. Mar. Chem. 1999, 64, 129–152. [Google Scholar] [CrossRef]
- Wang, G.; Wang, Z.; Zhai, W.; Moore, W.S.; Li, Q.; Yan, X.; Qi, D.; Jiang, Y. Net subterranean estuarine export fluxes of dissolved inorganic C, N, P, Si, and total alkalinity into the Jiulong River estuary, China. Geochim. Cosmochim. Acta 2015, 149, 103–114. [Google Scholar] [CrossRef]
- Taniguchi, M.; Burnett, W.C.; Dulaiova, H.; Siringan, F.; Foronda, J.; Wattayakorn, G.; Rungsupa, S.; Kontar, E.A.; Ishitobi, T. Groundwater discharge as an important land-sea pathway into Manila Bay, Philippines. J. Coast. Res. 2008, 24, 15–24. [Google Scholar] [CrossRef]
- Beck, A.J.; Rapaglia, J.P.; Cochran, J.K.; Bokuniewicz, H.J. Radium mass-balance in Jamaica Bay NY: Evidence for a substantial flux of submarine groundwater. Mar. Chem. 2007, 106, 419–441. [Google Scholar] [CrossRef]
- Lee, Y.-W.; Hwang, D.W.; Kim, G.; Lee, W.C.; Oh, H.T. Nutrient inputs from submarine groundwater discharge (SGD) in Masan Bay, an embayment surrounded by heavily industrialized cities, Korea. Sci. Total Environ. 2009, 407, 3181–3188. [Google Scholar] [CrossRef] [PubMed]
- Kim, G.; Ryu, J.-W.; Hwang, D.W. Radium tracing of submarine groundwater discharge (SGD) and associated nutrient fluxes in a highly-permeable bed coastal zone, Korea. Mar. Chem. 2007, 109, 307–317. [Google Scholar] [CrossRef]
- Ji, T.; Du, J.; Moore, W.S.; Zhang, G.; Su, N.; Zhang, J. Nutrient inputs to a Lagoon through submarine groundwater discharge: The case of Laoye Lagoon, Hainan, China. J. Mar. Syst. 2013, 111–112, 253–262. [Google Scholar] [CrossRef]
- Dong, J.D.; Zhang, Y.Y.; Wang, Y.S.; Zhang, S.; Wang, H.K. Spatial and seasonal variations of Cyanobacteria and their nitrogen fixation rates in Sanya Bay, South China Sea. Sci. Mar. 2008, 72, 239–251. [Google Scholar]
- Zhou, W.; Li, T.; Cai, C.; Huang, L.; Wang, H.; Xu, J.; Dong, J.; Zhang, S. Spatial and temporal dynamics of phytoplankton and bacterioplankton biomass in Sanya Bay, northern South China Sea. J. Environ. Sci. 2009, 21, 595–603. [Google Scholar] [CrossRef]
- Brzezinski, M.A. The Si-C-N ratio of marine diatoms—Interspecific variability and the effect of some environmental variables. J. Phycol. 1985, 21, 347–357. [Google Scholar] [CrossRef]
- Redfield, A.C. The biological control of chemical factors in the environment. Sci. Prog. 1960, 11, 150–170. [Google Scholar] [PubMed]
- Officer, C.B. Discussion of the behavior of nonconservative dissolved constituents in estuaries. Estuar. Coast. Mar. Sci. 1979, 9, 91–94. [Google Scholar] [CrossRef]
- Wai, K.M.; Leung, K.Y.; Tanner, P.A. Observational and modeling study of dry deposition on surrogate surface in a South China Sea city: Implication of removal of atmospheric crustal particles. Environ. Monit. Assess. 2010, 164, 143–152. [Google Scholar] [CrossRef] [PubMed]
- Titlyanov, E.A.; Titlyanova, T.V.; Belous, O.S.; Kalita, T.L. Inventory change (1990s–2010s) in the marine flora of Sanya Bay (Hainan Island, China). J. Mar. Biol. Assoc. UK 2015, 95, 461–470. [Google Scholar] [CrossRef]
- Atkinson, M.J.; Smith, S.V. C-N-P Ratio of Benthic Marine Plants. Limnol. Oceanogr. 1983, 28, 568–574. [Google Scholar] [CrossRef]
- Wang, Y.; Jing, Z.; Qi, Y. Coastal upwelling off Eastern Hainan Island observed in the summer of 2013. Chin. J. Trop. Oceanogr. 2016, 35, 40–49. [Google Scholar]
- Chislock, M.F.; Doster, E.; Zitomer, R.A.; Wilson, A.E. Eutrophication: Causes, consequences, and controls in aquatic ecosystems. Nat. Educ. Knowl. 2013, 4, 10. [Google Scholar]
- Howarth, R.F.; Chan, F.; Conley, D.J.; Garnier, J.; Doney, S.C.; Marino, R.; Billen, G. Coupled biogeochemical cycles: Eutrophication and hypoxia in temperate estuaries and coastal marine ecosystems. Front. Ecol. Environ. 2011, 9, 18–26. [Google Scholar] [CrossRef]
- Diaz, R.J.; Rosenberg, R. Spreading dead zones and consequences for marine ecosystems. Science 2008, 321, 926–929. [Google Scholar] [CrossRef] [PubMed]
Figure 1.
Study area and sampling stations in Sanya Bay and the Sanya River estuary. HK represents Hong Kong.
Figure 1.
Study area and sampling stations in Sanya Bay and the Sanya River estuary. HK represents Hong Kong.

Figure 2.
Surface distributions of radium isotopes (in dpm100 L−1) in Sanya Bay in February 2012, (a) 223Ra; (b) 224Ra; (c) 226Ra; and (d) 228Ra.
Figure 2.
Surface distributions of radium isotopes (in dpm100 L−1) in Sanya Bay in February 2012, (a) 223Ra; (b) 224Ra; (c) 226Ra; and (d) 228Ra.

Figure 3.
Concentrations of nutrients against salinity in the Sanya River estuary and groundwater (GW), (a) oxidized inorganic nitrogen (NOx) and silicate (b) phosphate.
Figure 3.
Concentrations of nutrients against salinity in the Sanya River estuary and groundwater (GW), (a) oxidized inorganic nitrogen (NOx) and silicate (b) phosphate.

Figure 4.
Activities of 224Ra vs. 223Ra (a) and 228Ra vs. 226Ra (b) of Sanya Bay water, the lower Sanya River estuary water, and nearby groundwater in February 2012.
Figure 4.
Activities of 224Ra vs. 223Ra (a) and 228Ra vs. 226Ra (b) of Sanya Bay water, the lower Sanya River estuary water, and nearby groundwater in February 2012.

Figure 5.
Activity ratio of 224Ra/228Ra (a) and apparent water age (τ) (b) in Sanya Bay in February 2012.
Figure 5.
Activity ratio of 224Ra/228Ra (a) and apparent water age (τ) (b) in Sanya Bay in February 2012.

Figure 6.
Nutrient budget in Sanya Bay. Unit is in mol d−1.

Table 1.
Sampling stations and data for surface water in Sanya Bay and the lower Sanya River estuary collected in February 2012 and data at an offshore station.
Table 1.
Sampling stations and data for surface water in Sanya Bay and the lower Sanya River estuary collected in February 2012 and data at an offshore station.
| Station | Latitude | Longitude | Water Depth (m) | Temp (°C) | Salinity | 223Ra | σ | 224Ra | σ | 226Ra | σ | 228Ra | σ |
|---|---|---|---|---|---|---|---|---|---|---|---|---|---|
| dpm 100 L−1 | |||||||||||||
| J1 | 18.2718 | 109.4565 | 8 | 22.80 | 33.60 | 1.79 | 0.20 | 33.86 | 0.36 | 10.81 | 0.45 | 33.73 | 1.30 |
| J2 | 18.2623 | 109.4423 | 9 | 22.66 | 33.62 | 0.80 | 0.13 | 21.52 | 0.68 | 10.50 | 0.39 | 31.74 | 1.09 |
| J3 | 18.2531 | 109.4298 | 12 | 22.70 | 33.64 | 1.56 | 0.16 | 30.04 | 0.38 | 10.91 | 0.50 | 37.95 | 1.44 |
| J4 | 18.2409 | 109.4118 | 11 | 22.81 | 33.70 | 0.60 | 0.14 | 11.92 | 0.40 | 10.78 | 0.39 | 28.24 | 1.02 |
| J5 | 18.2261 | 109.3909 | 15 | 22.90 | 33.70 | 0.52 | 0.15 | 17.61 | 0.89 | 10.19 | 0.41 | 28.02 | 1.10 |
| W1 | 18.2555 | 109.4832 | 5 | 23.12 | 33.70 | 1.36 | 0.23 | 26.66 | 0.39 | 12.04 | 0.49 | 30.35 | 1.23 |
| W2 | 18.2466 | 109.4672 | 12 | 22.93 | 33.72 | 0.83 | 0.13 | 12.88 | 0.32 | 10.92 | 0.41 | 26.22 | 1.02 |
| W3 | 18.2306 | 109.4413 | 16 | 22.97 | 33.89 | 0.59 | 0.13 | 11.93 | 0.53 | 10.63 | 0.43 | 23.11 | 1.06 |
| W4 | 18.2154 | 109.4244 | 5 | 23.12 | 33.70 | 0.52 | 0.11 | 12.82 | 0.30 | 10.73 | 0.39 | 24.03 | 0.98 |
| P1 | 18.2355 | 109.4940 | 5 | 22.98 | 33.62 | 1.22 | 0.19 | 42.60 | 0.85 | 11.93 | 0.54 | 28.87 | 1.34 |
| P2 | 18.2296 | 109.4797 | 11 | 23.01 | 33.67 | 0.97 | 0.17 | 23.57 | 0.34 | 10.56 | 0.49 | 31.94 | 1.27 |
| P3 | 18.2213 | 109.4660 | 16 | 22.75 | 33.84 | 0.54 | 0.13 | 15.49 | 0.59 | 10.99 | 0.41 | 24.26 | 1.08 |
| P4 | 18.2105 | 109.4464 | 12 | 22.71 | 33.89 | 0.77 | 0.11 | 15.32 | 0.36 | 10.83 | 0.32 | 28.14 | 0.85 |
| P5 | 18.1931 | 109.4296 | 26 | 22.69 | 33.81 | 1.38 | 0.11 | 18.51 | 0.65 | 10.95 | 0.33 | 28.90 | 0.89 |
| L1 | 18.2219 | 109.4812 | 7 | 22.76 | 33.84 | 0.65 | 0.10 | 13.65 | 0.40 | 9.71 | 0.42 | 26.42 | 1.15 |
| L2 | 18.2193 | 109.4812 | 11 | 22.81 | 33.85 | 0.74 | 0.11 | 22.99 | 0.67 | 11.98 | 0.44 | 26.33 | 1.16 |
| L3 | 18.2201 | 109.4749 | 12 | 22.79 | 33.84 | 0.78 | 0.11 | 14.49 | 0.28 | 9.77 | 0.41 | 25.24 | 1.06 |
| L4 | 18.2105 | 109.4674 | 20 | 22.76 | 33.85 | 0.70 | 0.11 | 13.82 | 0.42 | 10.59 | 0.42 | 25.53 | 1.13 |
| L5 | 18.2111 | 109.4582 | 21 | 22.74 | 33.85 | 1.17 | 0.13 | 17.63 | 0.33 | 11.27 | 0.38 | 25.90 | 0.96 |
| L6 | 18.1965 | 109.4694 | 23 | 22.79 | 33.82 | 0.84 | 0.12 | 16.34 | 0.38 | 10.21 | 0.43 | 23.77 | 0.95 |
| L7 | 18.1966 | 109.4601 | 32 | 22.83 | 33.86 | 0.84 | 0.18 | 14.26 | 0.76 | 10.53 | 0.41 | 26.03 | 1.08 |
| L8 | 18.1964 | 109.4476 | 25 | 22.78 | 33.88 | 0.43 | 0.15 | 12.18 | 0.40 | 9.58 | 0.43 | 27.01 | 1.20 |
| H1 | 18.2348 | 109.4977 | nd * | 22.88 | 31.70 | 1.69 | 0.50 | 64.75 | 0.74 | 15.45 | 0.70 | 43.75 | 1.85 |
| LE01 | 18.0000 | 110.0000 | 96 | 29.62 | 33.33 | nd | nd | nd | nd | 5.92 | 0.42 | 11.70 | 1.42 |
* nd—not determined.
Table 2.
Parameters used in the mass balance Equation (1) of 226Ra and 228Ra.
| Parameter | Value | Unit | Reference | ||
|---|---|---|---|---|---|
| Estuary | FR | River discharge | 0.88 | m3 s−1 | [24,25] |
| 226RaR | Estuary water 226Ra | 15.5 ± 0.7 | dpm 100 L−1 | This study | |
| 228RaR | Estuary water 228Ra | 43.8 ± 1.9 | |||
| CTSM | Concentration of total suspended matter | 25.33 | mg L−1 | ||
| fd | Fraction of desorbed radium from particles | 0.43 | - | [37] | |
| 226Rap | 226Ra on particles | 2.5 | dpm g−1 | [36] | |
| 228Rap | 228Ra on particles | 2.09 | |||
| Sediment | 228Fsed | 228Ra diffusive flux | 2.1 | dpm m−2 d−1 | |
| 226Fsed | 226Ra diffusive flux | 0.27 | [8] | ||
| Groundwater | 226RaGW | Groundwater 226Ra | 246 ± 36 | dpm 100 L−1 | This study |
| 228RaGW | Groundwater 228Ra | 435 ± 18 | |||
| Sanya Bay | 226RaB | Bay water 226Ra | 10.75 ± 0.66 | ||
| 228RaB | Bay water 228Ra | 27.81 ± 3.59 | |||
| VB | Volume of the bay investigated | 1.04 × 10⁹ | m3 | ||
| AB | Surface area of the bay investigated | 6.49 × 10⁷ | m2 | ||
| τ | Residence time | 7.2 ± 3.2 | day | ||
| Ocean | 226RaO | Ocean water 226Ra | 5.92 ± 0.42 | dpm 100 L−1 | |
| 228RaO | Ocean water 228Ra | 11.70 ± 1.42 | |||
Table 3.
Sources and sinks of long-lived radium (226Ra and 228Ra) in Sanya Bay.
| Radium | Formula in Equation (1) | Value | Unit | ||
|---|---|---|---|---|---|
| 226Ra | Sources | Sanya River | FR·226RaR | 1.17 × 10⁷ | dpm d−1 |
| FR·fd·226Rap·CTSM | 2.07 × 10⁶ | ||||
| Sediment diffusion | AB·226Fsed | 4.24 × 10⁷ | |||
| Groundwater | FSGD·226RaGW | 6.87 × 10⁹ | |||
| Sink | Mixing | VB·(226RaB − 226RaO)/τ | 6.93 × 10⁹ | ||
| 228Ra | Sources | Sanya River | FR·228RaR | 3.32 × 10⁷ | |
| FR·fd·228Rap·CTSM | 1.73 × 10⁶ | ||||
| Sediment diffusion | AB·228Fsed | 1.01 × 10⁹ | |||
| Groundwater | FSGD·228RaGW | 2.21 × 10¹⁰ | |||
| Sink | Mixing | VB·(228RaB − 228RaO)/τ | 2.31 × 10¹⁰ | ||
Table 4.
The submarine groundwater discharge (SGD) flux in Sanya Bay compared with SGD rates in other embayments and along the eastern Hainan Island.
Table 4.
The submarine groundwater discharge (SGD) flux in Sanya Bay compared with SGD rates in other embayments and along the eastern Hainan Island.
| Region | SGD Rate (cm d−1) | References |
|---|---|---|
| Manila Bay, Philippines | 0–26 | [38] |
| Jamaica Bay, USA | 1.5–17 | [39] |
| Masan Bay, Korea | 6.1–7.1 | [40] |
| Yeogil Bay, Korea | 20 | [41] |
| Eastern coast of Hainan Island, China | 10–29 | [42] |
| Sanya Bay, China | 4.3 ± 2.1–7.8 ± 4.1 | This study |
© 2018 by the authors. Licensee MDPI, Basel, Switzerland. This article is an open access article distributed under the terms and conditions of the Creative Commons Attribution (CC BY) license (http://creativecommons.org/licenses/by/4.0/).
Share and Cite
MDPI and ACS Style
Wang, G.; Wang, S.; Wang, Z.; Jing, W. Significance of Submarine Groundwater Discharge in Nutrient Budgets in Tropical Sanya Bay, China. Sustainability 2018, 10, 380. https://0-doi-org.brum.beds.ac.uk/10.3390/su10020380
AMA Style
Wang G, Wang S, Wang Z, Jing W. Significance of Submarine Groundwater Discharge in Nutrient Budgets in Tropical Sanya Bay, China. Sustainability. 2018; 10(2):380. https://0-doi-org.brum.beds.ac.uk/10.3390/su10020380
Chicago/Turabian StyleWang, Guizhi, Shuling Wang, Zhangyong Wang, and Wenping Jing. 2018. "Significance of Submarine Groundwater Discharge in Nutrient Budgets in Tropical Sanya Bay, China" Sustainability 10, no. 2: 380. https://0-doi-org.brum.beds.ac.uk/10.3390/su10020380
Note that from the first issue of 2016, this journal uses article numbers instead of page numbers. See further details here.