Life Cycle Assessment Application to the Wine Sector: A Critical Review


Department of Industrial Engineering, University of Salerno, Via Giovanni Paolo II, 132, 84084 Fisciano (Sa), Italy
*
Author to whom correspondence should be addressed.
Sustainability 2018, 10(2), 395; https://0-doi-org.brum.beds.ac.uk/10.3390/su10020395
Submission received: 10 January 2018
/
Revised: 30 January 2018
/
Accepted: 31 January 2018
/
Published: 2 February 2018
(This article belongs to the Section Sustainable Engineering and Science)
Abstract
:Life Cycle Assessment (LCA) is a powerful tool that allows evaluation of the environmental performances of a product, service or process considering the whole life cycle or a part of it. In the wine sector, the application of LCA has grown significantly in recent years and several studies have been carried out about this topic that are similar to other research fields. Nowadays, LCA is an important and acknowledged environmental assessment tool but its application to the wine sector is still in a developing phase. For this reason, the present study proposes a critical review of papers dealing with both the wine sector and LCA. The critical review points out that the main wine hotspots are the viticulture phase (mainly due to fuel, fertilizer and pesticides consumption) and the wine primary packaging production (due to glass bottles). Furthermore, the papers taken into consideration have a wide variability in the system boundaries definition as well as a shortage of availability of original and site-specific inventory data. Such key factors are sensitive aspects that have a huge influence on the results of a study and they are also affected by a wide variability: these issues need further scientific contribution through future studies.
1. Introduction
Wine is an ancient drink, loved and revered over the centuries. It has always been a source of inspiration in art and literature. The wine production constitutes one of the most ancient economic sectors [1], and, nowadays, it is still one of the most important agricultural activities throughout the world [2]. In 2016, indeed, about 27 billion liters of wine were produced, while the agricultural area destined for vineyards was about 7.5 million hectares worldwide [3]. In economic terms, the international wine trade is worth 29 billion euros in 2016 [3].
Grapes grow from temperate to tropical regions, ranging from 50° N to 43° S, with the most concentrated vineyards in Europe [4]. Therefore, more wine is produced in European countries.
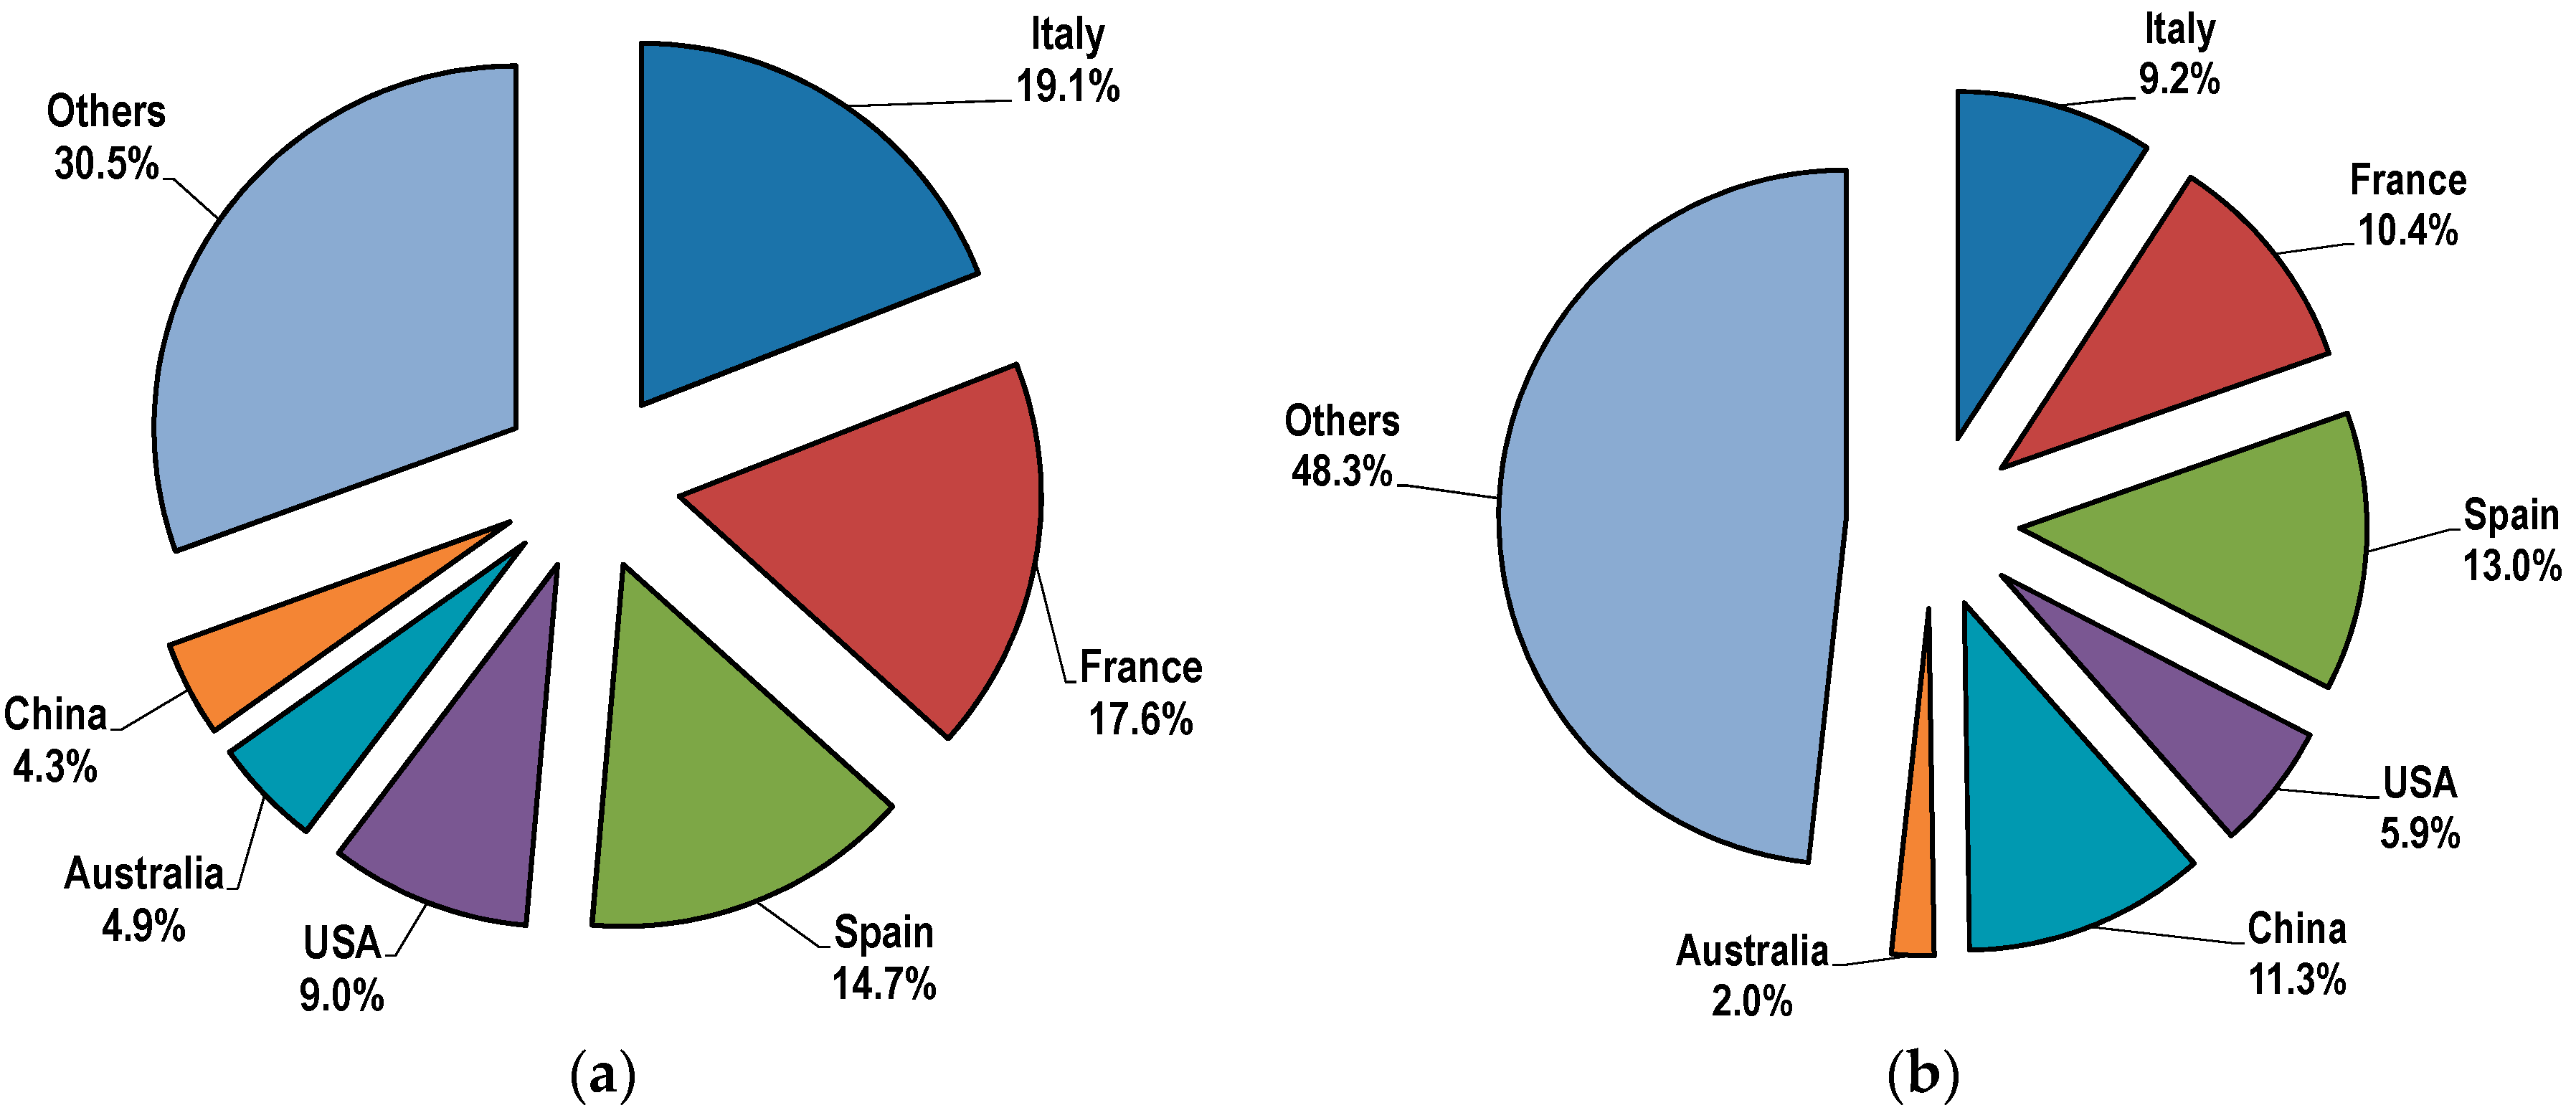
Italy, France and Spain, indeed, produce more than 50% of the world’s wine production (Figure 1a), representing about 33% of the world vineyards (Figure 1b).
Considering its importance in economic, social and cultural terms, it is important to evaluate wine production from an environmental point of view. Such an evaluation is crucial in order to ensure that the wine industry remains not only economically but also environmentally sustainable, both now and in the future [5].
In the light of the environmental sustainability perspective, the Life Cycle Assessment (LCA) methodology is a very useful and powerful tool [6]. LCA, indeed, allows evaluation of the environmental performance of alternative systems considering both the whole life cycle (i.e., from cradle to grave) and only some parts [7,8].
LCA standards are contained in the International Standards Organization (ISO) 14000 series. The ISO 14040 and 14044 standards [9,10] define a general methodology but are not designed to define the details for each field in which the method is used [11].
In recent years, LCA has gained popularity as evidenced by the rapidly increasing number of publications and databases supporting its implementation [11]. Also in the wine sector, the application of LCA has grown a lot in recent years and several studies have been carried out about this topic. Nowadays, LCA is an important and acknowledged environmental assessment tool but its application to the wine sector is still in a developing phase.
For this reason, most of the studies published on the topic have been analyzed in this paper in order to conduct a critical review useful to point out the most important results achieved until now as well as the main environmental hotspots of the wine production. Furthermore, the analysis of the considered studies was carried out from a methodological point of view (concerning the application of LCA) to point out strengths and weaknesses of the assessment procedures adopted.
The study has considered thirty-four papers. They are the result of a careful research on the main scientific databases (e.g., Science Direct, ISI Web of Knowledge, Scopus, Mendeley, etc.) and direct research in the archives of international scientific journals, using the following keywords: Life Cycle Assessment; LCA; wine; sustainability; industrial ecology; viticulture; wine grape; vinification; environmental impacts; carbon footprint. The keywords were used in combinations of two-three with the “AND” Boolean operator.
Table 1 shows the main characteristics of the studies considered in this review. More information about these studies is reported in the supplementary data (Table S1).
2. LCA Application to the Wine Sector: A Practical Point of View
The environmental issues of wine industries have been largely unexplored for a long time [5]. In fact, the environmental evaluations of wine production have appeared only in recent years. Several studies have been published, mainly from 2013 onward.
The geographical location of the studies is the first aspect that comes out: about 61% of them focused on Italian production systems, 12% focused on Spanish systems and, finally, the remaining 27% of the studies evaluated systems of other parts of the world. This is not surprising since Italy and Spain are two of the main wine-producing countries in the world [3].
Instead, studies that evaluate French wine products in environmental terms are absent, although this country is the second-biggest wine producer in the world after Italy [3].
Another important aspect concerns the definition of the studies’ objectives. The main aim of most of the reviewed studies (about 68%) is the evaluation of the environmental performances of certain wine types; of these, about 52% focused on a specific type of wine, considering noted appellations and, therefore, specific grape varieties and specific production processes. Such choice comes from the fact that wine production processes can vary a lot for different types both in viticulture and vinification phases and this consequently affects the environmental performances of the considered products [44]. The remaining part of the considered studies focused on the comparison of different wine types.
Since the agricultural phase is one of the most impactful steps, about 23% of the reviewed papers focused on the viticulture. Usually, the studies were carried out comparing different cultivation practices or different wine grapes types.
Finally, 9% of the studies focused on different aspects such as the wine packaging phase or the wine organic waste treatment.
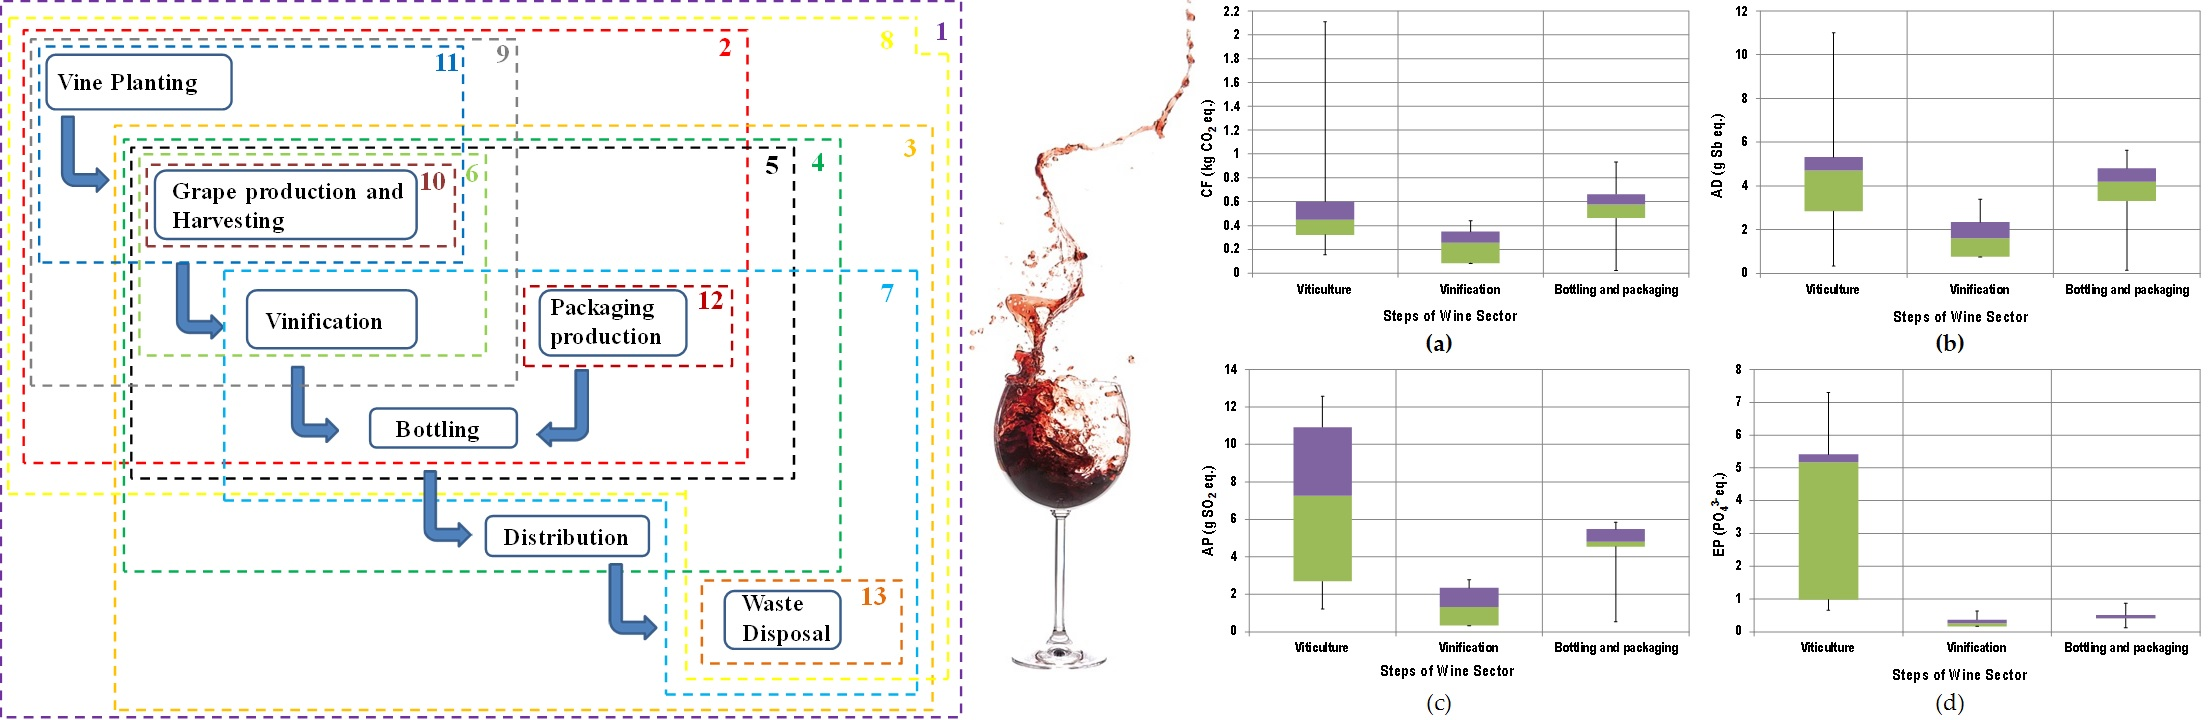
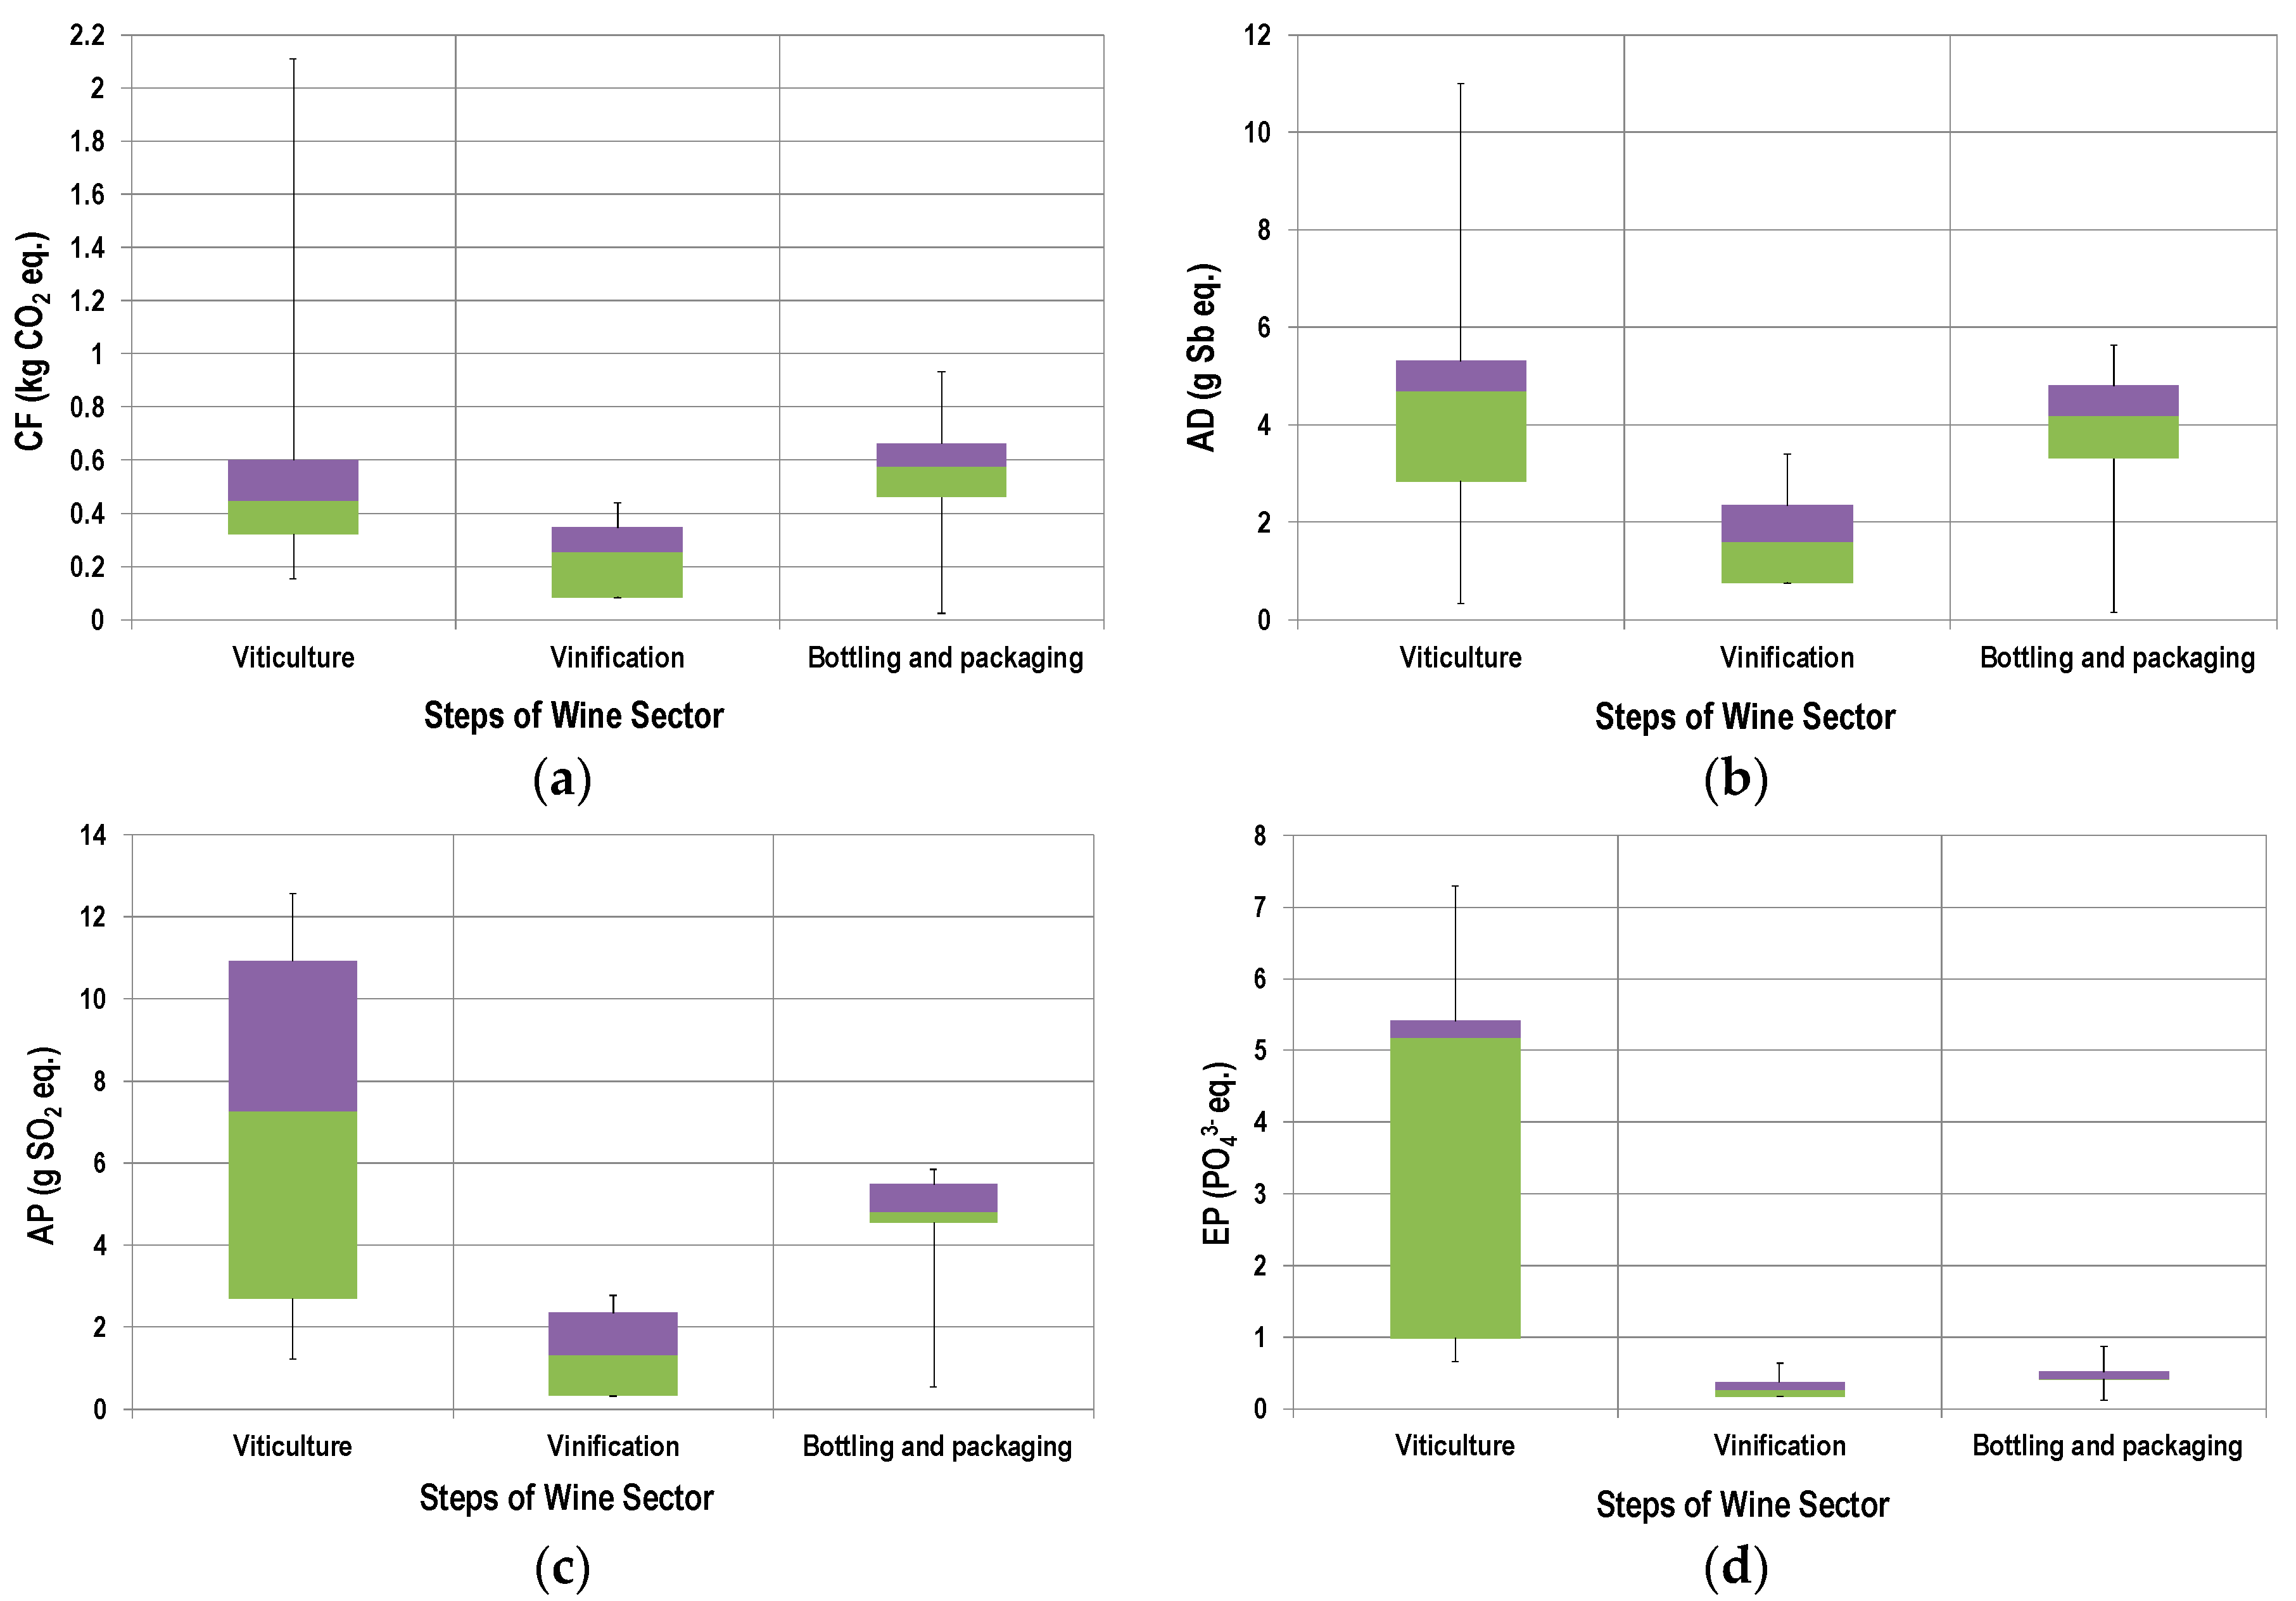
The main results of the papers that consider all the life cycle phases are reported in Figure 3 in terms of the environmental impact category considered and the wine sector phase. In particular, four environmental impact categories were common to all the studies: Carbon Footprint (CF), Abiotic Depletion (AD), Acidification Potential (AP) and Eutrophication Potential (EP) (more details about the impact categories are in Section 3.3) Three main wine phases have been considered: viticulture, vinification and bottling/packaging.
Each main wine phase consists of many steps, whose inputs (in terms of chemicals, energy, water, fuel, raw materials, infrastructures, etc.) and outputs (in terms of co-products, emissions, waste, etc.) have to be considered.
The viticulture includes all the field phase steps: vine planting, grape production and harvesting. For each step, all input (as water, fertilizers and pesticides, energy, etc.) and output (pollutants emissions and waste) flows have been considered. However, due to the huge variation in the system boundaries’ definitions, not all the studies considered the vine-planting phase.
The vinification phase, instead, includes all the steps needed for the wine production starting from grape: transport of grape to winery; destemming and crushing; fermentation and filtering. All the reviewed studies considered all these steps.
Finally, the bottling/packaging phase includes, in addition to the bottling steps, all the production processes of the wine primary packaging components (glass bottle, cork, label) and all the papers considered these steps.
In Figure 3, the sample size used for the representation varies with the impact categories considered on the basis of the data availability provided by the reviewed papers (22 samples for CF and 6 samples for the others categories).
The types of graphs in Figure 3 are box plots. These statistic representations are used to provide a synthetic description of a data distribution and are based on 5 numbers: minimum, first quartile (q1), median, third quartile (q3) and maximum. The purple rectangle represents the distance between q3 and median, while the green rectangle is the distance between q1 and median. The interquartile range (q3–q1) is a measure of the distribution dispersion. 50% of the observations lie between these two values. The bars (“whiskers”) above and below the box show the locations of the minimum and maximum. The lengths of the two bars and the heights of the two rectangles provide information on the symmetry of the distribution: this is more symmetrical as the lengths of the bars are similar to each other and the heights of the two rectangles are similar to each other.
Figure 3 shows that viticulture phase has the greatest results variation range for all the impact categories considered.
Furthermore, packaging production and viticulture are the most impactful steps of the wine life cycle. Most reviewed studies reported the impact results of packaging with the results of the bottling. Nevertheless, the reviewed studies specified that the highest impact value (for all the impact categories considered) was due to the production of primary packaging especially to the glass bottle production.
EP is the only impact category for which the viticulture is clearly the highest impacting phase from an environmental point of view; for the other impact categories, the environmental load of the two phases is not very different. In fact, for EP the average incidence of the different phases on the total impact are 71.9% for viticulture, 20.7% for bottling and packaging, and 7.4% for vinification. For CC, viticulture weights 45.8%, bottling and packaging 41.1%, and vinification 13.1%. For AD, the incidences are 44.3% for viticulture, 41.0% for bottling and packaging, and 14.8% for vinification. Finally, for AP, the percentage incidence for viticulture is 46.2%, 44.8% for bottling and packaging, and 9.0% for vinification.
In all the studies taken into consideration, the vinification phase showed lower environmental impacts compared to other phases, for all the impact categories considered. Therefore, the differences in the vinification processes of the different wine types do not cause such high variations in the environmental impacts to compete with the impacts produced by the other phases.
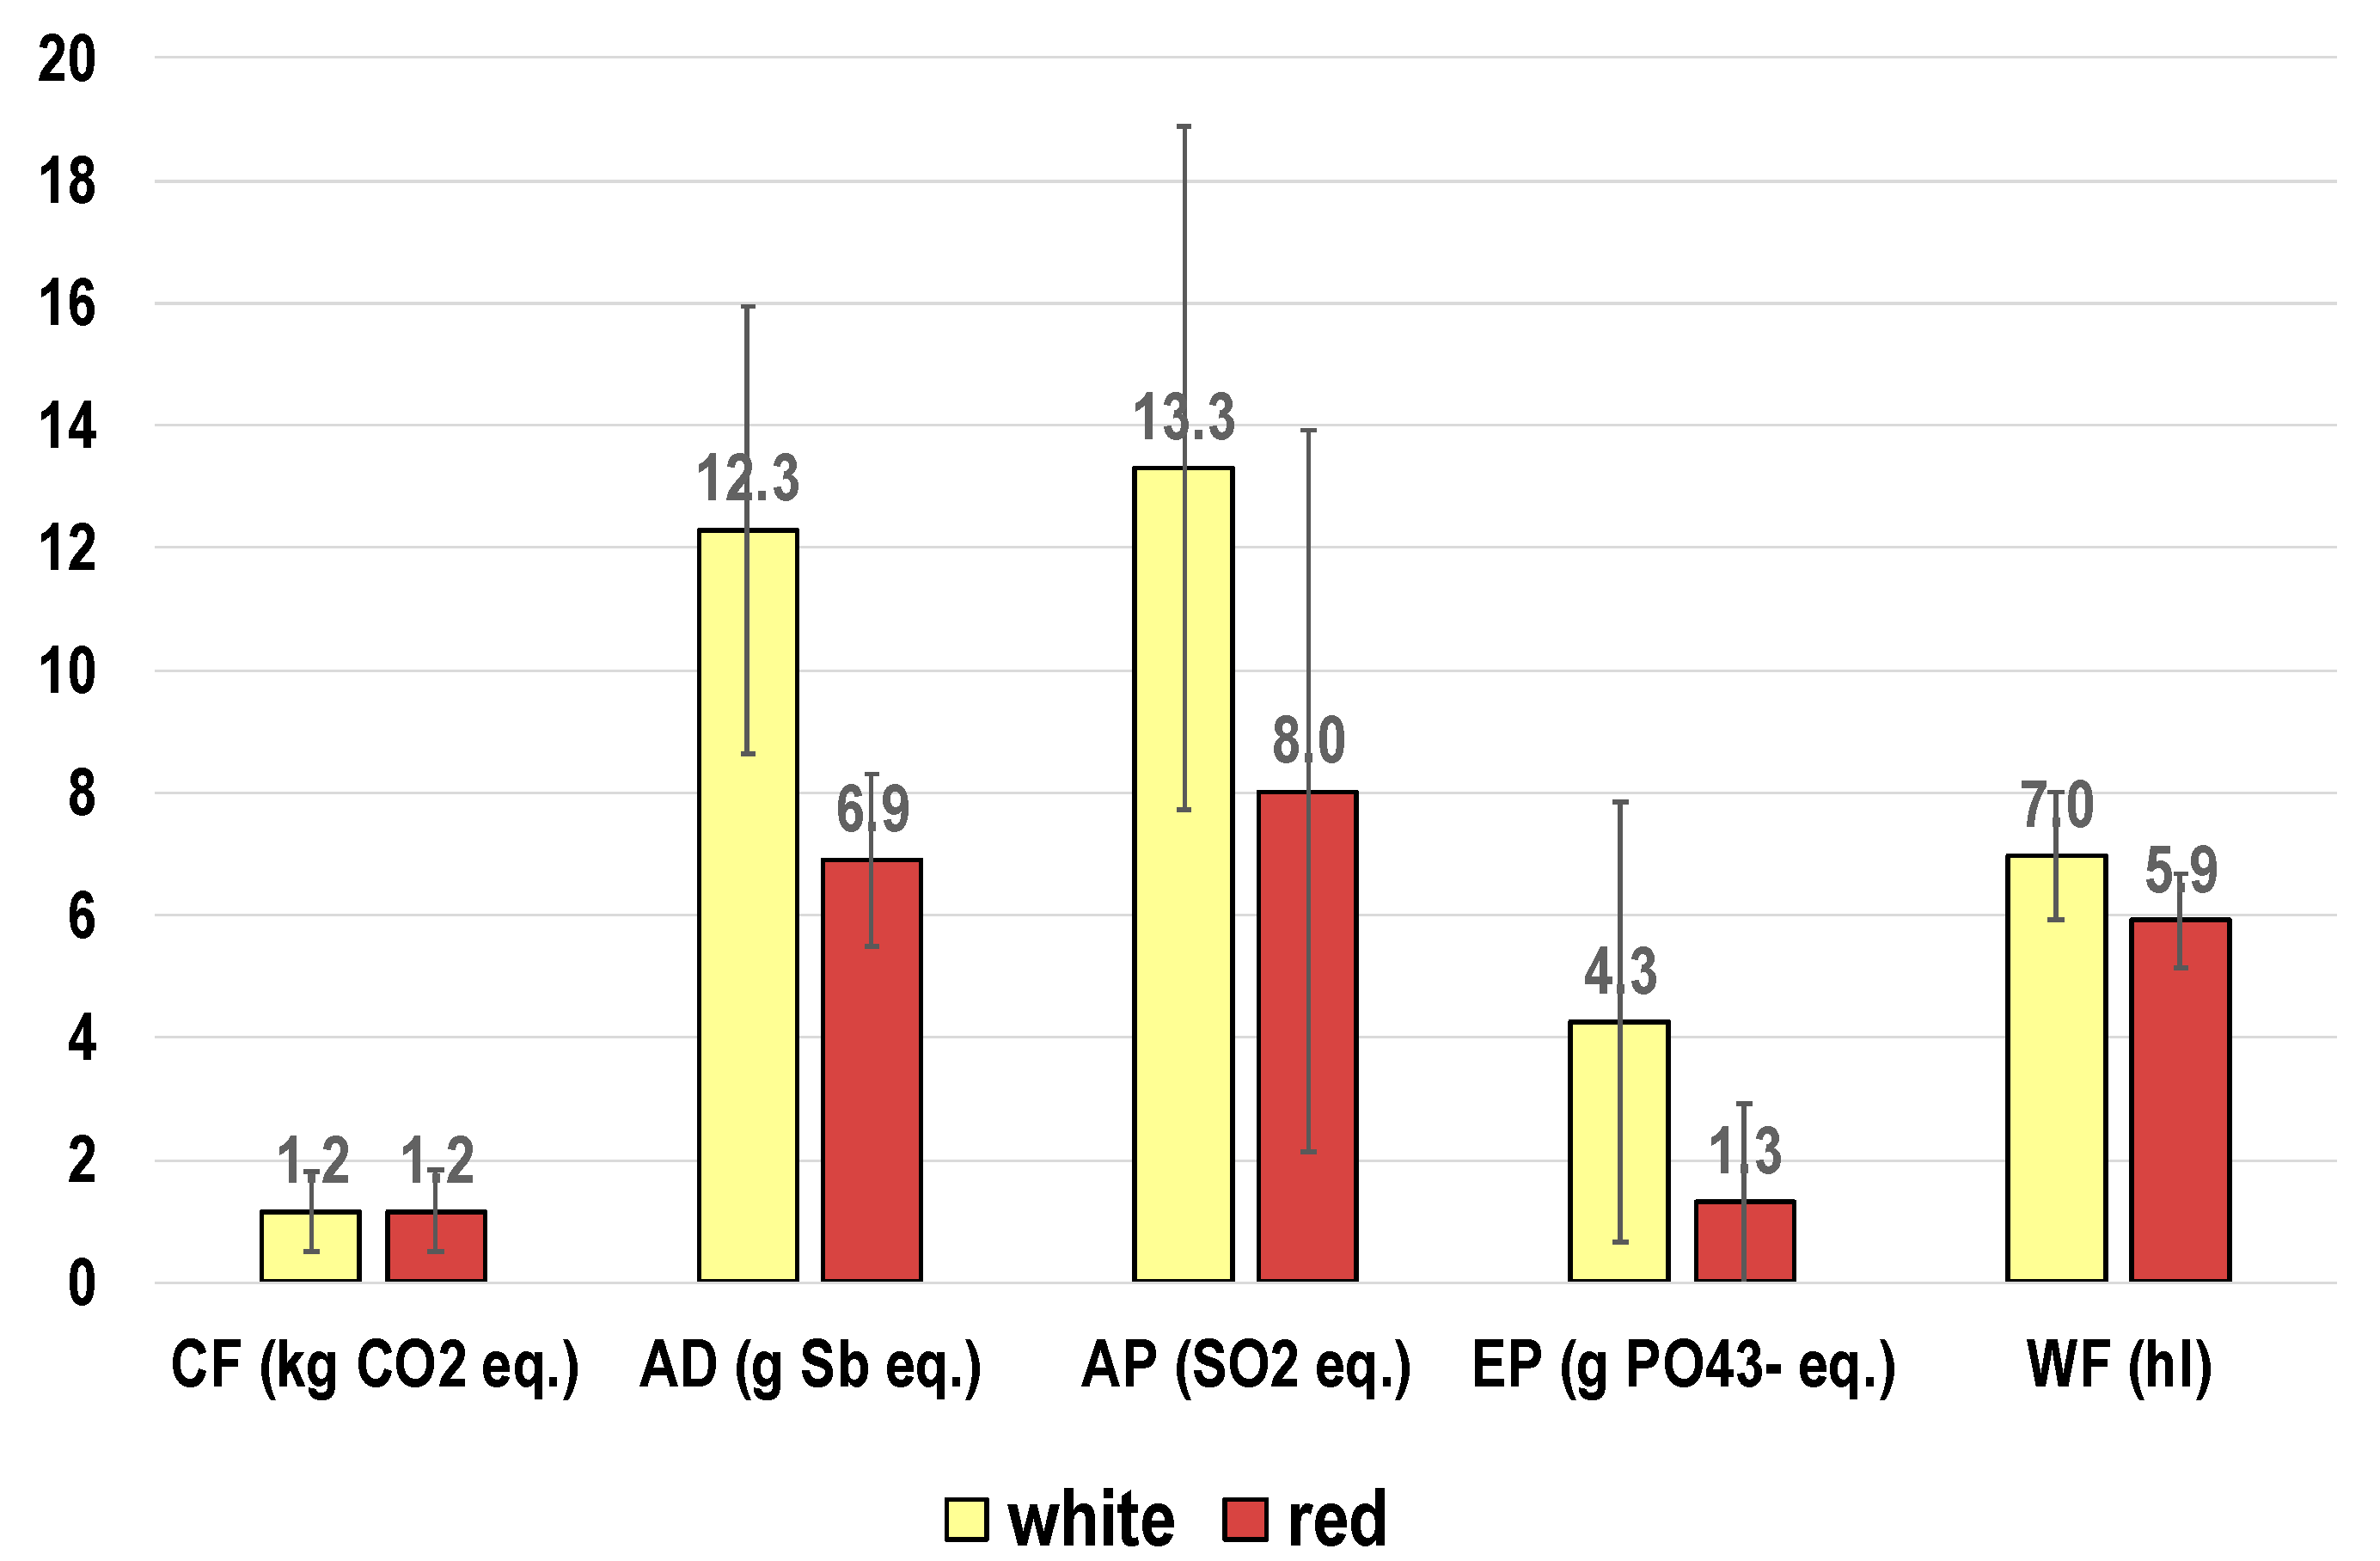
Among the studies that assessed the environmental impacts of some wine type production, about 64% considered red wines, and, consequently, about 36% measured the environmental performances of white wines.
Figure 4 shows the environmental impacts of red and white wine for different categories. The bars are the medium values of the findings reported in the reviewed studies, while the error bars represent the deviation of the values from the medium value.
The sample size is not the same for each impact category (28 samples for CF; 6 for AD; 7 for AP and EP; and 10 for WF).
Regarding WF calculation, the papers used different methodologies (more details about that are in Section 3.3).
Although for the carbon footprint, the environmental performances of the two wine types are very similar, for the other impact categories this is not true (Figure 4). In fact, for the other impact categories, the red wines seem to be more environmentally sound. Nevertheless, the results of the studies are affected by a very high variability. Therefore, it is difficult to define what type of wine is more sustainable from an environmental point of view. The results’ variability for a single wine type (as shown in Figure 4 by error bars) is greater than the difference between the environmental performances of white and red wines (Figure 4) and the different authors do not agree.
In fact, some authors state that white wines have a slightly better performance in terms of CF than red wines and this is due mainly to the use of the wooden barrels for ageing of red wine during the storage time in the vinification stage [44]. The production processes of the wooden barrels, indeed, are responsible for higher impact.
On the other hand, the vinification stage of white wine usually requires lower process temperatures (for example during the cooling process “cold stabilization” in order to remove the crystals, due to tartrates precipitation, before wine bottling) and this involves a greater consumption of energy.
This aspect needs further scientific insights also in order to define and argue the main key factors responsible for the variations in the environmental performance of white and red wines.
2.1. Viticulture
The analysis of the reviewed studies showed that the viticulture is one of the highest impacting phases of the wine life cycle in environmental terms. The authors of the considered papers agree that the key factors responsible for the high environmental impacts are: the fossil fuel consumption needed for agricultural machinery in field operations [15,32]; the soil management [24,32]; and the use of fertilizers and pesticides that generate high polluting emissions both during their production and during their subsequent application in the field [26,31,34]. The contribution of these key factors to the total impacts of viticulture varies with the impact category and the paper considered; in terms of CF, for example, the production and use of fertilizers can provide a contribution from 85 to 30% to the viticulture impact, while the fuel consumption can contribute from 40 to 20%.
Some authors also assessed any improvement opportunities of viticulture environmental performances considering, for example, the use of biodiesel for field operations [15], the use of pesticides with lower potential toxicity [42] and the optimization of fertilizer use [37,46].
Moreover, viticulture is the phase with the widest variability of results. The causes of this variability are many. The first discriminating factor seems to be the agricultural practices. Cultivation systems alternative to the conventional system, such as the organic or biodynamic, can reduce significantly (up to 50%) the environmental impacts of the viticulture [45] because such practices avoid using synthetic fertilizers and pesticides. On the contrary, with the application of organic fertilizer, the soil structure improves and closes the organic matter cycle [40]. However, not all authors agree with that aspect.
The study of Falcone et al. [23] shows that combining conventional practices with the espalier training system allows the obtaining of the best environmental performance due to higher yield per hectare. The espalier is a type of vine training system, which consists of growing the vines in rows, made of wooden poles on which two or more galvanized steel wires are fixed in tension. On these rows, the vine can be raised through different pruning techniques.
Therefore, the authors highlight that the results are influenced by the definition of the functional unit.
On the other hand, however, the authors state that the study does not consider some environmental and economic benefits generated from organic farming such as the increase of biodiversity, soil quality improvement and the increase of the organic components of soils [23].
In the LCA of agricultural systems, the evaluation of the changes in soil carbon stocks is an important factor that can affect the results; some studies carefully modeled this aspect [45].
Regarding the issue of the FU definition, in the comparison between conventional and organic practices, other authors claim that the choice of the functional unit is a key factor. In fact, Tuomisto et al. [47], who performed a review about the studies comparing environmental impacts of organic and conventional farming in Europe, state that the conventional agriculture could be the best environmental choice if the product yield is considered (i.e., if all data are normalized in terms of an amount of harvested grapes). On the contrary, the organic agriculture could be preferable if the results per hectare are taken into consideration (i.e., if all data are normalized in terms of a number of hectares) [47].
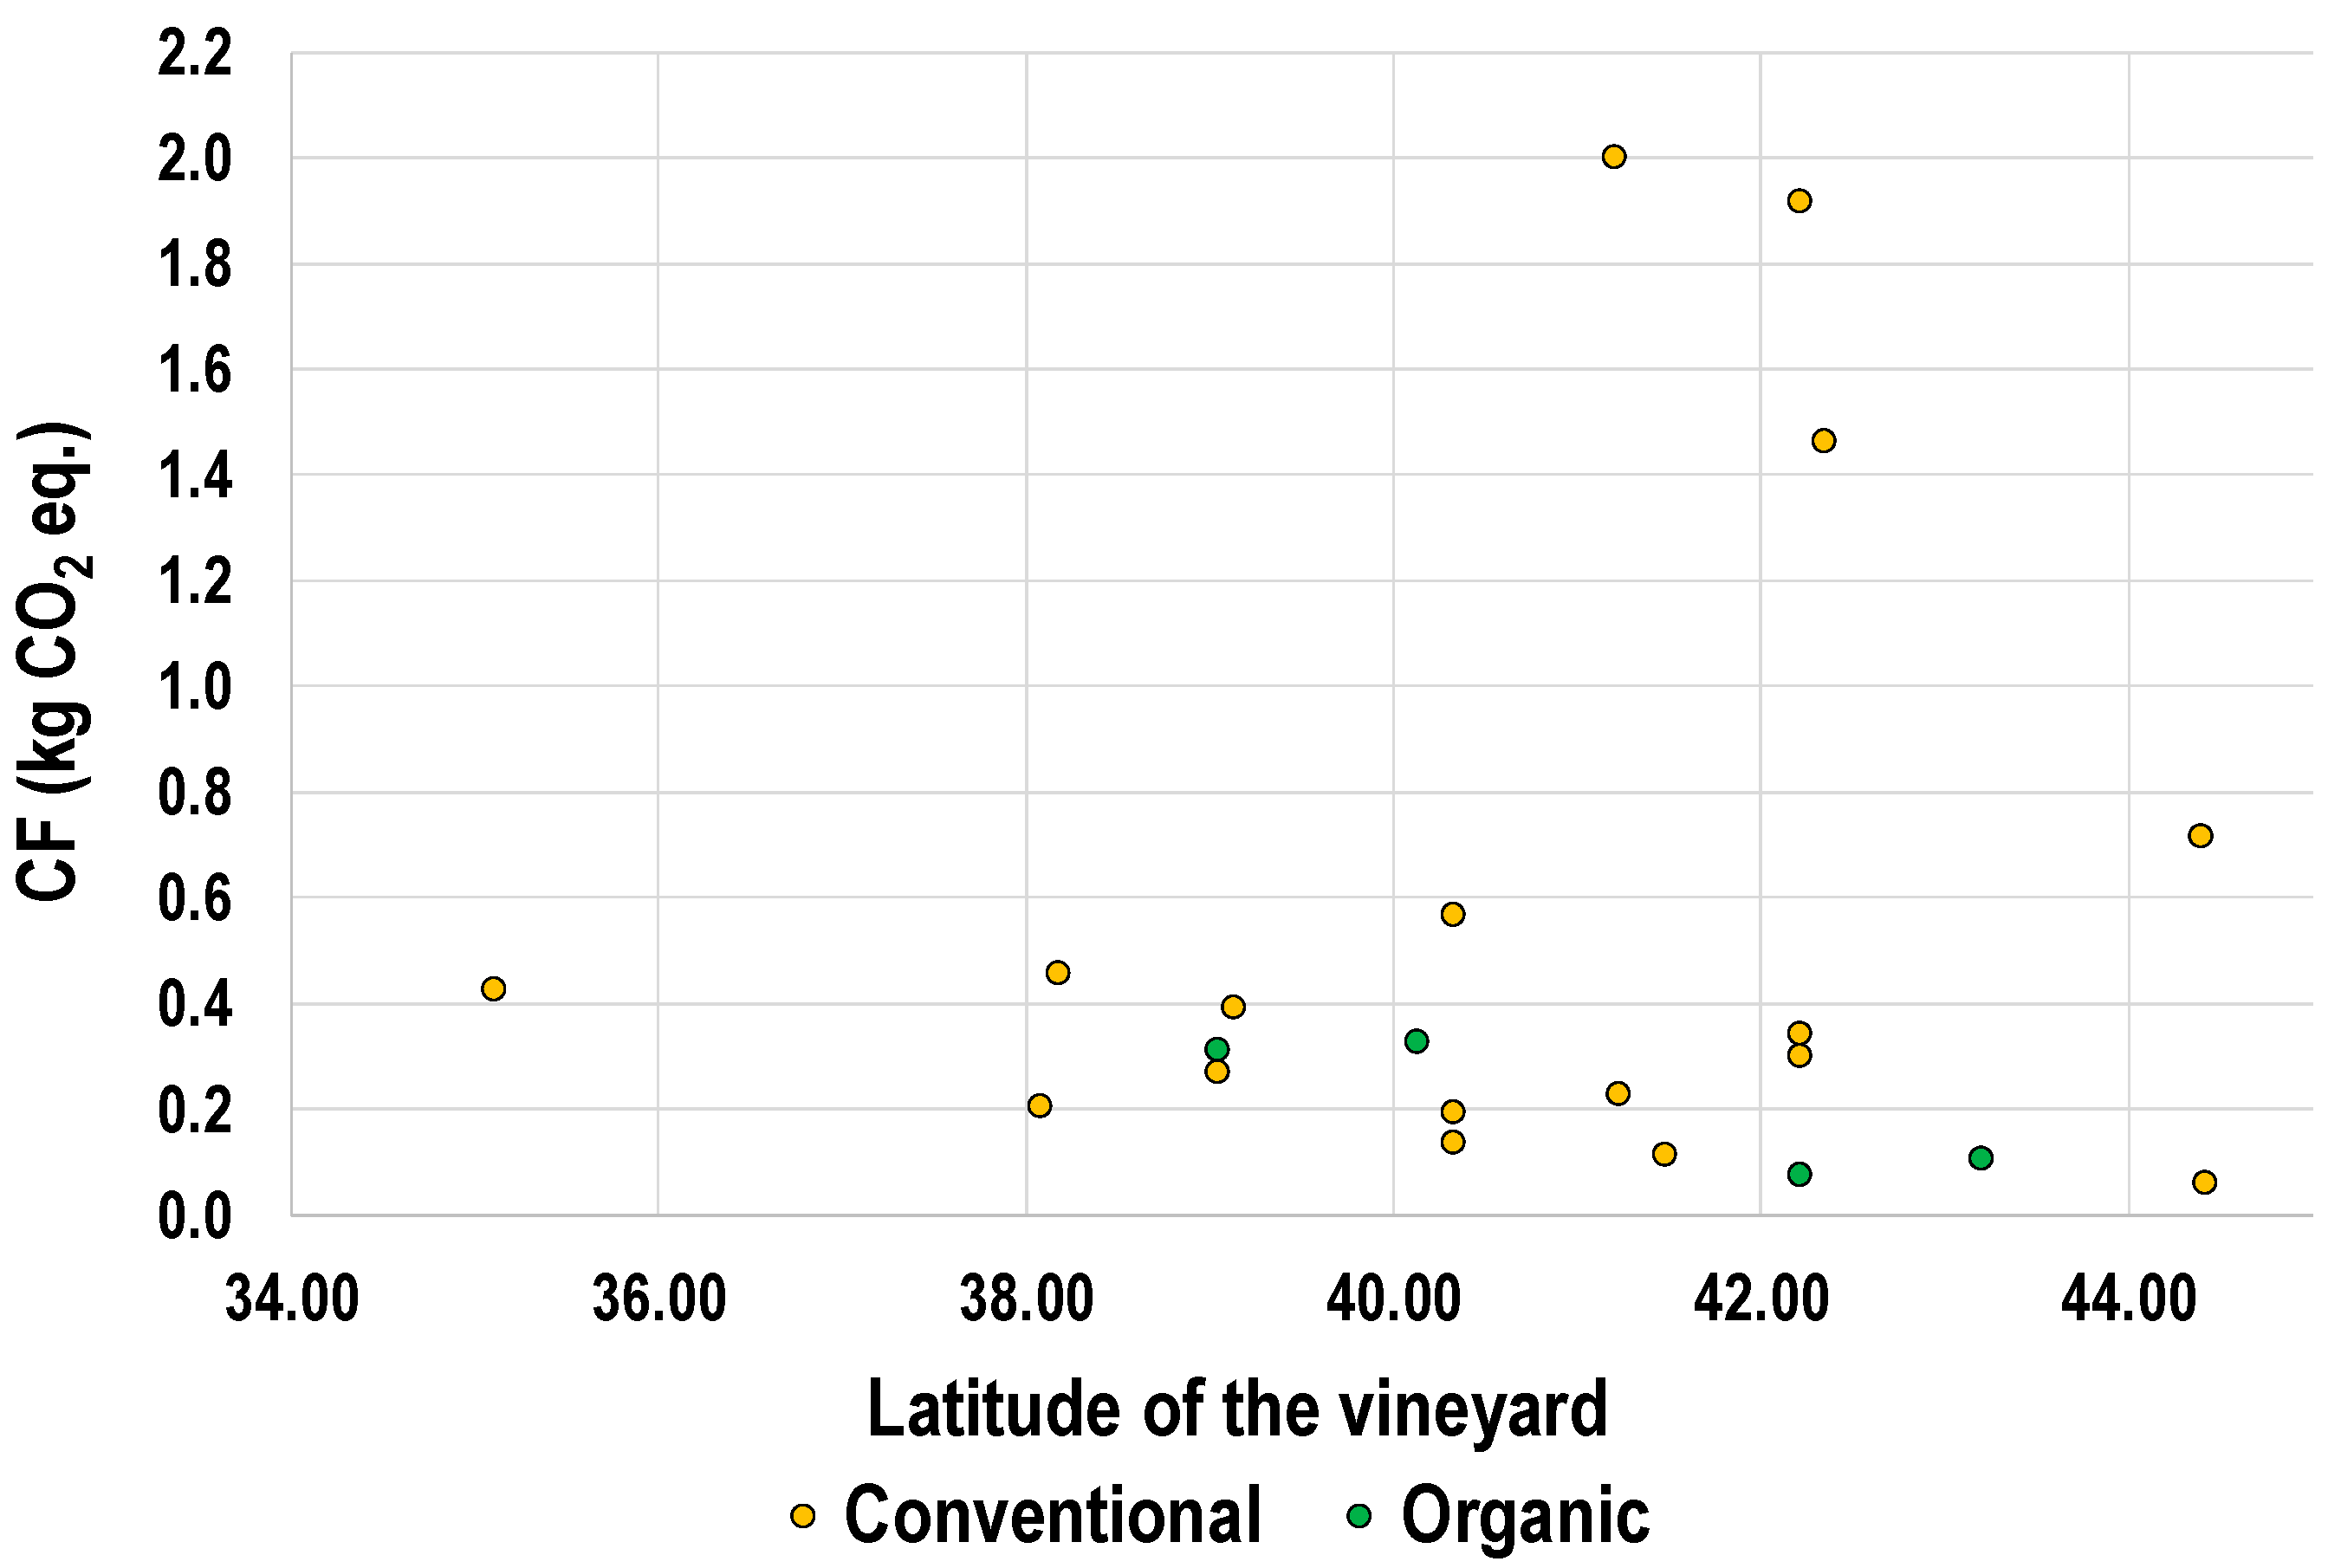
The high variability of the results for the viticulture phase cannot be justified only by the type of agricultural practice. Indeed, other factors affect the results such as the grape variety (that influences also the yield), the soil characteristics and the local climate conditions [32]. The microclimatic conditions, such as the local temperature, the sun exposition and the annual precipitation rate, affect the quantity of pesticides and fertilizers to be applied in field. It would have been very interesting to evaluate the correlation between these factors and the environmental impacts of the vineyards in terms of CF, but enough data were not available in the papers for such analysis.
As shown in Figure 5, the geographical position of vineyards in terms of latitude, instead, does not seem to be a factor that can affect the environmental performances of the viticulture phase with regard to the greenhouse gas emissions.
2.2. Vinification
The vinification processes produce fewer environmental impacts in comparison with the viticulture and packaging phases (Figure 3). Nevertheless, the energy consumption is the key factor that affects the environmental performance of this phase the most [28]. In fact, this phase can even contribute up to 93% of the total impact [42].
The treatment of the organic waste produced during the vinification processes is another key factor [42]. Wine wastes consist of grape pomace, lees, stalks, and wastewater in percentages variable by winery and wine type [48].
Many studies, indeed, evaluated different alternatives of management and valorization of wine waste and wastewater. For instance, Ruggieri et al. [40] proposed the composting for the recovery of stalk and wastewater sludge to produce a sanitized organic amendment. That alternative was the better choice from both economic and environmental points of view [40]. Furthermore, the compost produced from wine waste can replace the synthetic fertilizers and can be used as an adsorbent for heavy metals [49].
Another alternative is the wine waste valorization for the production of valuable goods for the cosmetics and food industry. Wine waste, indeed, could be an alternative source in order to obtain natural antioxidants, which are considered completely safe in comparison with synthetic antioxidants [49]. Furthermore, fermentation of grape marc, trimming vine shoot or vinification lees produces lactic acid, biosurfactants, xylitol, ethanol and other compounds. Furthermore, vinasse contains tartaric acid that can be extracted and commercialized [2].
Finally, the production of grape marc pellets can also be a useful choice. In fact, Benetto et al. [50] show that grape marc pellets are always superior to alternative fuels in environmental terms.
Regarding wastewater, some authors claim that treated wastewater may have suitable characteristics for irrigation, thus representing a potential additional source of water [48].
2.3. Bottling and Packaging
The very high environmental impact of the bottling and packaging phase (mainly due to the glass bottles production processes that, for CF category, can contribute from 40 to 90% to total impact of bottling and packaging phase) was pointed out by all the studies that assessed this life cycle phase.
In order to improve the environmental performances of this wine phase, some authors evaluated the environmental effects of different improvement opportunities. For instance, Meneses et al. [33] focused on the end of life of glass bottles and highlighted that with an increase in the glass-recycling rate from 60 to 85%, the global warming potential could be reduced by 11.1%.
Regarding glass recycling, another important aspect evaluated is the glass bottle production with an amount of recycled glass. The study of Amienyo et al. [12] points out that increasing the recycled glass content (in the order of 10%) in a bottle allows savings in environmental impacts.
The use of lighter glass bottles is another improvement opportunity taken into consideration [12,37]. In fact, the adoption of glass bottles 30% lighter than those currently used by wineries could result in reductions between 2% and 10% for all the impacts associated with the life cycle of a wine bottle [37]. These environmental advantages are due to lower energy and material consumption for the glass bottle production as well as reduced impacts from transporting less glass [12].
Finally, some authors focused on the environmental assessment of glass substitution with different materials for the wine packaging.
Clearly et al. [22] considered two alternatives to the glass bottles for the wine packaging: polyethylene terephthalate bottles and aseptic cartons. The study results showed that the aseptic carton has the lowest environmental impacts, with as much as 87% impact reductions (related to the packaging life cycle) compared with the conventional glass container [22].
Furthermore, other studies suggest that the substitution of glass bottles with other alternatives of wine packaging, such as the aseptic carton, could significantly improve the environmental performances of wine bottles [12,25,33].
Nevertheless, in the main wine-producing countries, such as Italy and France, the wine is mainly packaged in glass bottles. This is due to the fact that many stakeholders in the wine sector claim that the glass bottle is the only packaging suitable to contain good-quality wine. Regarding that, the study of Ghidossi et al. [51] assessed the evolution of wine quality in different packaging configurations performing a sensory analyses and monitoring oenological parameters including gas content (O2, CO2) and specific oxidation compounds over an 18-months period. The wine packaging alternatives considered were glass bottles, bag-in-a-box, and polyethylene terephthalate bottles. The study results show that no significant differences were noted for red wine [51].
3. LCA Application to Wine Sector: Methodological Point of View
This section presents a detailed analysis of the reviewed studies from a methodological point of view in order to identify the different methodological approaches followed, pointing out the key aspects on the basis of the LCA main phases (Goal and scope definition; Inventory Analysis; Life cycle Impact Assessment; Interpretation).
3.1. Goal and Scope Definition
In this phase, the functional unit and systems boundaries are defined and any assumptions are discussed.
The choice of the functional unit changes depending on the specific objective of the reviewed studies (Table 1).
The most commonly used functional unit is a volume unit of produced wine (73% of the papers used 0.75 L or 1 L of wine). Only 23% of the papers that focused on the viticulture phase defined the FU as a quantity by weight of grape (kg or tons of grape). Some authors affirm that the FU choice is a key aspect when the study scope is the environmental evaluation of agriculture, because defining the FU as a yield of harvested product will benefit the intensive cultivation systems [23,47].
Other types of FU are defined if the aim of the study is different. For instance, Ruggieri et al. [40] focused on the comparison among different alternatives of wine organic waste management: they defined the FU as 1 kg of nitrogen provided to the vineyard soil.
However, only one study evaluated the results’ variation depending on the time considered. The environmental performances of a wine bottle can vary a lot among different years [42]. Therefore, in the definition of the functional unit, it would be preferable to declare the specific year taken into account for the environmental assessment.
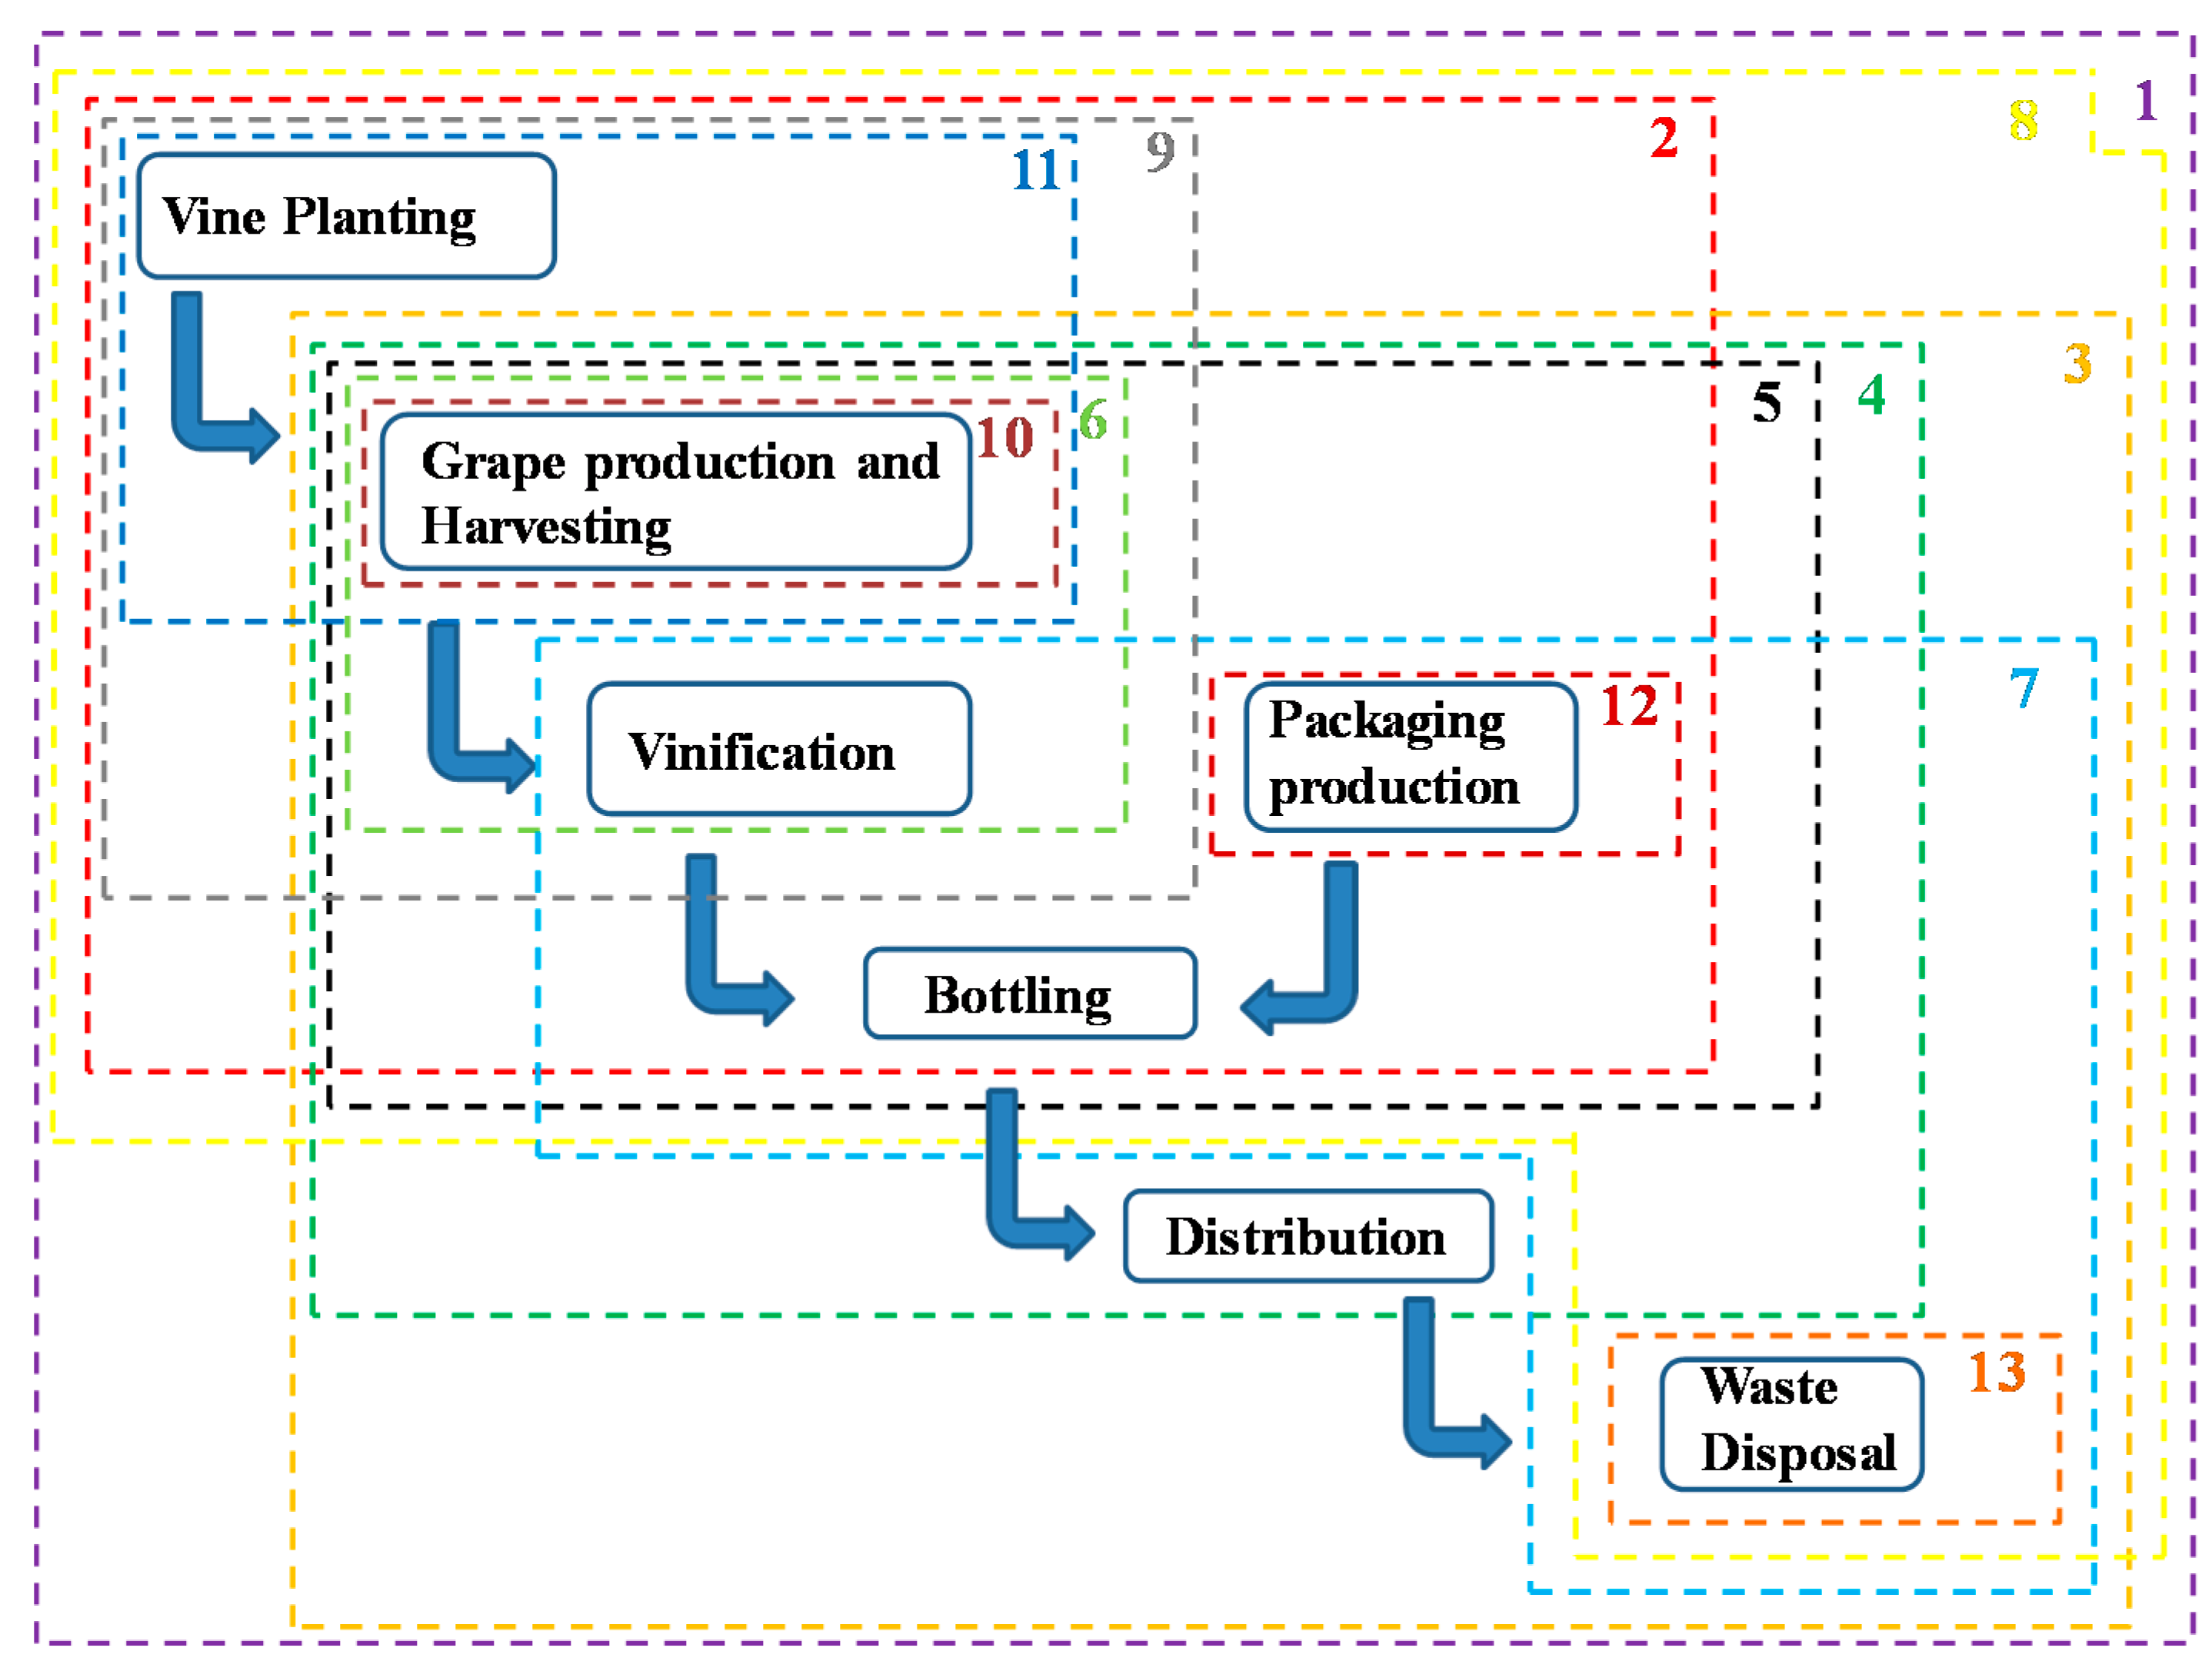
Another important aspect of this LCA phase is the system boundaries’ definitions. The analysis of the considered studies pointed out that this is an aspect affected by a high variability (Figure 2).
Among the reviewed studies that considered the viticulture phase (91%), the major part (64%) accounted also for the environmental burdens of vine planting in addition to those due to the grape production. This aspect can affect the environmental results of the viticulture because vine planting is not a negligible sub-phase due to diesel fuel consumption [15,25].
Other important aspects that can affect the results are the distribution and the end of life (bottle disposal and/or wine organic waste treatment). However, only 40% of the papers considered these phases.
3.2. Inventory Analysis
The inventory analysis is the LCA phase that mostly affects the quality level of a study. The authors have to deal with the problem of data availability and data quality. The primary inventory data is collected from wineries, direct measurement and specific documents, while background data is normally provided by LCI database.
As for other fields, even for the LCA application to the wine sector the authors have many difficulties finding primary data of good quality. The causes of this problem could be more than one: the wine producers often ignore the environmental consequences of their activity [5] and, therefore, they have a lack of useful information from an environmental point of view.
Furthermore, the wine producers often provide corporate data, because it is easier for companies to obtain them rather than product data [1]; this leads the authors to face data allocation problems.
The majority of the papers (about 70%) provided primary data used in the study (Table S1) completely, while the remaining part (about 30%) provided partial information or none at all. This aspect is very important in order to ensure the transparency of the study and make the results obtained reproducible.
Regarding the background data, some studies (35%) did not report which specific database was used. Among the remaining papers, about 85% used the Ecoinvent database. Other LCI databases used were Gabi, EDIP, LCA Food, etc. (Table S1).
Finally, another important aspect is the specific software tool used for the modeling and calculation steps. More than half of the studies (65%) reported the software tool used. Among these, 68% used SimaPro and 32% used GaBi (Table S1).
3.3. Life Cycle Impact Assessment
In the third LCA phase, the environmental impacts are calculated starting from the results of the inventory analysis.
Among the considered studies, only two of them did not develop this LCA phase. All the other papers declared the specific impact evaluation method that they used (Table S1). About 65% of the studies adopted a method that considers more than one impact category: CML was the most preferred option (in 55% of the cases) [52]. This method was developed by the Center of Environmental Science (CML) of Leiden University in the Netherlands and considers impact categories related to climate change, abiotic depletion, ecotoxicity, eutrophication, etc. [53].
On the contrary, 35% of the studies considered only one impact category (Table S1), simply evaluating the carbon footprint (65%) or the water footprint (35%).
The carbon footprint (CF), which is the impact category related to climate change, is related to emissions of greenhouse gases to air and can result in adverse effects upon ecosystem health, human health and material welfare. The characterization model as developed by the Intergovernmental Panel on Climate Change (IPCC) is selected for development of characterization factors. Factors are expressed as Global Warming Potential for time horizon 100 years (GWP100), in kg carbon dioxide/kg emission. CF was evaluated mainly with the IPCC method [54].
The water footprint (WF) of a product is defined as the consumptive water use associated to the entire life cycle and is defined as the sum of three water volumes (WF = WFblue + WFgreen + WFgrey) [17]. In the reviewed studies, WF was evaluated using different methods.
The blue water footprint (WFblue) is the volume of surface and ground freshwater withdrawn and consumed by the process [17]. It was mainly evaluated from the Ecoinvent Database. The green water footprint (WFgreen) is the volume of rainwater evapotranspirated and incorporated by the process [17]. The most used method for its calculation is FAO methodology, which is the standard procedure for calculating crop evapotranspiration [39]. Both WFblue and WFgreen are real volumes.
The grey water footprint (WFgrey) is an estimate of the freshwater needed to dilute the load of pollutants and is a virtual volume [17]. Some studies have developed new procedures for its estimation [16,39].
Other papers, instead, have used different methodologies for WF calculation of a wine bottle in order to compare the obtained results. WF methods used were: Water Footprint Network (WFN) method; life cycle assessment (LCA)-based methods (e.g., Freshwater ecosystem impact and Freshwater depletion) and hydrological water balance method [27].
The other most adopted impact categories are the following:
Abiotic depletion is related to extraction of minerals and fossil fuels due to inputs in the system. This category is expressed as kg Sb equivalents/kg extraction.
Acidification Potential considers the action of acidifying substances that cause a wide range of impacts on soil, groundwater, surface water, organisms, ecosystems and materials (buildings). AP is expressed as kg SO2 equivalents/kg emission. Eternity is the time span, while the geographical scale varies between local scale and continental scale.
Eutrophication Potential, instead, includes all impacts due to excessive levels of macronutrients in the environment caused by emissions of nutrients to air, water and soil. It is expressed as kg PO43− equivalents/kg emission.
Excluding the studies that calculated WF, no paper considered whether the choice of one specific LCIA method could influence the LCA results.
CF was the most recurrent impact category taken into consideration by almost all the studies, confirming the general attention to the global warming issue.
3.4. Interpretation
Interpretation of the results is the last phase of an LCA study. It should also include sensitivity analysis as well as a discussion about the robustness and completeness of the results and the limitations of the study.
Most of the considered papers did not provide all numerical values of the environmental results and this aspect makes it very difficult to perform a comparison of the obtained results. As a matter of fact, only 29% of the reviewed studies performed the sensitivity analysis in order to verify how the assumptions and the sensitive parameters affect the results.
4. Conclusions
This paper presented a critical review on the application of LCA to the wine sector in order to highlight the most important results achieved until now as well as the main environmental hotspots for wine production. Furthermore, the analysis of the considered studies was carried out from a methodological point of view (regarding the LCA application) in order to point out strengths and weaknesses of the procedures adopted.
From a practical point of view, the analysis showed that the viticulture phase (mainly due to diesel, fertilizer and pesticides consumption) and the wine primary packaging production (due to glass bottle production) are the most impactful phases.
The values of the environmental impacts for the viticulture phase have a wide variability that cannot only be justified on the basis of different types of agricultural practice (conventional or organic). In fact, other factors affect the results, such as the grape variety, the soil characteristics and the local climate conditions.
Some authors evaluated the environmental effects of an increase in glass recycling rate and the use of lighter glass bottles as improvement opportunities for wine primary packaging. Very few studies evaluated the glass substitution with different materials, mainly because many stakeholders in the wine sector claim that the glass bottle is the only packaging suitable to contain good-quality wine. Nevertheless, some studies assessed the evolution of wine quality in different packaging configurations and showed that no significant differences were noted for red wine. Therefore, the focus on the wine packaging phase needs further research in the future.
From a methodological point of view, the identified hotspots concern the wide variability in the system boundaries’ definitions as well as the shortage of availability of original and site-specific inventory data. Furthermore, in the definition of the functional unit, it would be preferable to report the specific year taken into account for the analysis, because the environmental performances of a wine bottle can vary a lot among different years.
Such key factors are sensitive aspects that have a huge influence on the results of a study. They are also affected by a wide variability. These issues, therefore, need further scientific contribution through future studies.
Supplementary Materials
Supplementary data related to this paper are in Table S1 and can be found https://0-www-mdpi-com.brum.beds.ac.uk/2071-1050/10/2/395/s1. Table S1: Detailed information about references used for the critical review.
Acknowledgments
This article was produced as part of a Ph.D. research project about “The application of the Industrial Ecology to the wine sector”.
Author Contributions
All authors contributed equally to this paper.
Conflicts of Interest
The authors declare no conflict of interest.
Abbreviations
| AD | Abiotic Depletion |
| AP | Acidification Potential |
| B | Bottling |
| CF | Carbon Footprint |
| CO2 | Carbon dioxide |
| D | Distribution |
| EP | Eutrophication Potential |
| FU | Functional Unit |
| GP | Grape Production |
| GWP | Global Warming Potential |
| hl | hectoliters |
| IPCC | Intergovernmental Panel on Climate Change |
| ISO | International Standards Organization |
| LCA | Life Cycle Assessment |
| LCI | Life Cycle Inventory |
| LCIA | Life Cycle Impact Assessment |
| OIV | International Organization of Vine and Wine |
| PO43− | Phosphate Ion |
| PP | Packaging Production |
| Sb | Antimony |
| SO2 | Sulfur dioxide |
| V | Vinification |
| VP | Vine planting |
| WD | Waste Disposal |
| WF | Water footprint |
| WFN | Water Footprint Network |
References
- Navarro, A.; Puig, R.; Fullana-i-Palmer, P. Product vs. corporate carbon footprint: Some methodological issues. A case study and review on the wine sector. Sci. Total Environ. 2017, 581–582, 722–733. [Google Scholar] [CrossRef]
- Devesa-Rey, R.; Vecino, X.; Varela-Allende, J.; Barral, M.T.; Cruz, J.M.; Moldes, A.B. Valorization of winery waste vs. the costs of not recycling. Waste Manag. 2011, 3, 2327–2335. [Google Scholar] [CrossRef]
- The International Organisation of Vine and Wine. 2016. Available online: http://www.oiv.int (accessed on 1 February 2018).
- Cunha, M.; Ribeiro, H.; Abreu, I. Pollen-based predictive modelling of wine production: Application to an arid regional. Eur. J. Agron. 2016, 73, 42–54. [Google Scholar] [CrossRef]
- Christ, K.L.; Buritt, R.L. Critical environmental concerns in wine production: An integrative review. J. Clean. Prod. 2013, 53, 232–242. [Google Scholar] [CrossRef]
- De Feo, G.; Ferrara, C. Investigation of the environmental impacts of municipal wastewater treatment plants through a Life Cycle Assessment software tool. Environ. Technol. 2017, 38, 1943–1948. [Google Scholar] [CrossRef]
- Curran, M.A. Life cycle assessment. Encycl. Ecol. 2008, 3, 2168–2174. [Google Scholar]
- Buccino, C.; Ferrara, C.; Malvano, C.; De Feo, G. LCA of an ice cream cup of Polyethylene Coated Paper: How does the choice of the end-of-life affect the results? Environ. Technol. 2017. [Google Scholar] [CrossRef]
- International Organization for Standardization (ISO 14040). Environmental Management—Life Cycle Assessment—Principles and Framework: International Standard 14040; International Organization for Standardization: Geneva, Switzerland, 2006. [Google Scholar]
- International Organization for Standardization (ISO 14044). Environmental Management—Life Cycle Assessment—Requirements and Guidelines; International Organization for Standardization: Geneva, Switzerland, 2006. [Google Scholar]
- Corominas, L.; Foley, J.; Guest, J.S.; Hospido, A.; Larsen, H.F.; Morera, S.; Shaw, A. Life cycle assessment applied to wastewater treatment: State of the art. Water Res. 2013, 47, 5480–5492. [Google Scholar]
- Amienyo, D.; Camilleri, C.; Azapagic, A. Environmental impacts of consumption of Australian red wine in the UK. J. Clean. Prod. 2014, 72, 110–119. [Google Scholar] [CrossRef]
- Ardente, F.; Beccali, G.; Cellura, M.; Marvuqlia, A. POEMS: A Case Study of an Italian Wine-Producing Firm. Environ. Manag. 2006, 38, 350–364. [Google Scholar] [CrossRef]
- Arzoumanidis, I.; Raggi, A.; Petti, L. Considerations When Applying Simplified LCA Approaches in the Wine Sector. Sustainability 2014, 6, 5018–5028. [Google Scholar] [CrossRef]
- Benedetto, G. The environmental impact of a Sardinian wine by partial Life Cycle Assessment. Wine Econ. Policy 2013, 2, 33–41. [Google Scholar] [CrossRef]
- Bonamente, E.; Scrucca, F.; Asdrubali, F.; Cotana, F.; Presciutti, A. The Water Footprint of the Wine Industry: Implementation of an Assessment Methodology and Application to a Case Study. Sustainability 2015, 7, 12190–12208. [Google Scholar] [CrossRef]
- Bonamente, E.; Scrucca, F.; Rinaldi, S.; Merico, M.C.; Ardrubali, F.; Lamastra, L. Environmental impact of an Italian wine bottle: Carbon and water footprint assessment. Sci. Total Environ. 2016, 560–561, 274–283. [Google Scholar] [CrossRef]
- Bosco, S.; Di Bene, C.; Galli, M. Greenhouse gas emissions in the agricultural phase of wine production in the Maremma rural district in Tuscany, Italy. Ital. J. Agron. 2011, 6–15, 93–100. [Google Scholar]
- Bosco, S.; Di Bene, C.; Galli, M.; Remorini, D.; Massai, R.; Bonari, E. Soil organic matter accounting in the carbon footprint analysis of the wine chain. Int. J. Life Cycle Assess. 2013, 18, 973–989. [Google Scholar] [CrossRef]
- Chiusano, L.; Cerutti, A.K.; Cravero, M.C.; Bruun, S.; Gerbi, V. An Industrial Ecology approach to solve wine surpluses problem: The case study of an Italian winery. J. Clean. Prod. 2015, 91, 56–63. [Google Scholar] [CrossRef]
- Cichelli, A.; Pattara, C.; Petrella, A. Sustainability in mountain viticulture. The case of the Valle Peligna. Agric. Agric. Sci. Procedia 2016, 8, 65–72. [Google Scholar] [CrossRef]
- Clearly, J. Life cycle assessments of wine and spirit packaging at the product and the municipal scale: A Toronto, Canada case study. J. Clean. Prod. 2013, 44, 143–151. [Google Scholar] [CrossRef]
- Falcone, G.; De Luca, A.I.; Stillitano, T.; Strano, A.; Romeo, G.; Gulisano, G. Assessment of Environmental and Economic Impacts of Vine-Growing Combining Life Cycle Assessment, Life Cycle Costing and Multicriterial Analysis. Sustainability 2016, 8, 1–34. [Google Scholar] [CrossRef]
- Ferrari, A.M.; Pini, M.; Sassi, D.; Zerazion, E.; Neri, P. Effects of grape quality on the environmental profile of an Italian vineyard for Lambrusco red wine production. J. Clean. Prod. 2018, 172, 3760–3769. [Google Scholar] [CrossRef]
- Fusi, A.; Guidetti, R.; Benedetto, G. Delving into the environmental aspect of a Sardinian white wine: From partial to total life cycle assessment. Sci. Total Environ. 2014, 472, 989–1000. [Google Scholar] [CrossRef]
- Gazulla, C.; Raugei, M.; Fullana-i-Palmer, P. Taking a life cycle look at crianza wine production in Spain: Where are the bottlenecks? Int. J. Life Cycle Assess. 2010, 15, 330–337. [Google Scholar] [CrossRef]
- Herath, I.; Green, S.; Horne, D.; Singh, R.; Mclaren, S.; Clothier, B. Water footprinting of agricultural products: Evaluation of different protocols using a case study of New Zealand wine. J. Clean. Prod. 2013, 44, 159–167. [Google Scholar] [CrossRef]
- Iannone, R.; Miranda, S.; Riemma, S.; De Marco, I. Improving environmental performances in wine production by a life cycle assessment analysis. J. Clean. Prod. 2015, 111, 172–180. [Google Scholar] [CrossRef]
- Kounina, A.; Tatti, E.; Humbert, S.; Pfister, R.; Pike, A.; Menard, J.-F.; Loerincik, Y.; Jolliet, O. The Importance of Considering Product Loss Rates in Life Cycle Assessment: The Example of Closure Systems for Bottled Wine. Sustainability 2012, 4, 2673–2706. [Google Scholar] [CrossRef]
- Lamastra, L.; Suciu, N.A.; Novelli, E.; Trevisan, M. A new approach to assessing the water footprint of wine: An Italian case study. Sci. Total Environ. 2014, 490, 748–756. [Google Scholar] [CrossRef]
- Litskas, V.D.; Irakleous, T.; Tzortzakis, N.; Starvrinides, M.C. Determining the carbon footprint of indigenous and introduced grape varieties through Life Cycle Assessment using the island of Cyprus as a case study. J. Clean. Prod. 2017, 156, 418–425. [Google Scholar] [CrossRef]
- Marras, S.; Masia, S.; Duce, P.; Spano, D.; Sirca, C. Carbon footprint assessment on a mature vineyard. Agric. For. Meteorol. 2015, 214–215, 350–356. [Google Scholar] [CrossRef]
- Meneses, M.; Torres, C.M.; Castells, F. Sensitivity analysis in a life cycle assessment of an aged red wine production from Catalonia, Spain. Sci. Total Environ. 2016, 562, 571–579. [Google Scholar] [CrossRef]
- Neto, B.; Dias, A.C.; Machado, M. Life cycle assessment of the supply chain of a Portuguese wine: From viticulture to distribution. Int. J. Life Cycle Assess. 2013, 18, 590–602. [Google Scholar] [CrossRef]
- Pattara, C.; Raggi, A.; Cichelli, A. Life Cycle Assessment and Carbon Footprint in the Wine Supply-Chain. Environ. Manag. 2012, 49, 1247–1258. [Google Scholar] [CrossRef]
- Pizzigallo, A.C.I.; Granai, C.; Borsa, S. The joint use of LCA and emergy evaluation for the analysis of two Italian wine farms. J. Environ. Manag. 2008, 86, 396–406. [Google Scholar] [CrossRef]
- Point, E.; Tyedmers, P.; Naugler, C. Life cycle environmental impacts of wine production and consumption in Nova Scotia, Canada. J. Clean. Prod. 2012, 27, 11–20. [Google Scholar] [CrossRef]
- Quinterio, P.; Dias, A.C.; Pina, L.; Neto, B.; Ridoutt, B.G.; Arroja, L. Addressing the freshwater use of a Portuguese wine (‘vinho verde’) using different LCA methods. J. Clean. Prod. 2014, 68, 46–55. [Google Scholar] [CrossRef]
- Rinaldi, S.; Bonamente, E.; Scrucca, F.; Merico, M.C.; Asdrubali, F.; Cotana, F. Water and Carbon Footprint of Wine: Methodology Review and Application to a Case Study. Sustainability 2016, 8, 621. [Google Scholar] [CrossRef]
- Ruggieri, L.; Cadena, E.; Martìnez-Blanco, J.; Gasol, C.M.; Rieradevall, J.; Gabarrell, X.; Gea, T.; Sort, X.; Sanchez, A. Recovery of organic wastes in the Spanish wine industry. Technical, economic and environmental analyses of the composting process. J. Clean. Prod. 2009, 17, 830–838. [Google Scholar] [CrossRef]
- Steenwerth, K.L.; Strong, E.B.; Greenhut, R.F.; Williams, L.; Kendall, A. Life cycle greenhouse gas, energy, and water assessment of wine grape production in California. Int. J. Life Cycle Assess. 2015, 20, 1243–1253. [Google Scholar] [CrossRef]
- Vázquez-Rowe, I.M.; Villanueva-Rey, P.; Moreira, M.T. Environmental analysis of Ribeiro wine from a timeline perspective: Harvest year matters when reporting environmental impacts. J. Environ. Manag. 2012, 98, 73–83. [Google Scholar] [CrossRef]
- Vázquez-Rowe, I.; Villanueva-Rey, P.; Iribarren, D.; Teresa Moreira, M.; Feijoo, G. Joint life cycle assessment and data envelopment analysis of grape production for vinification in the Rías Baixas appellation (NW Spain). J. Clean. Prod. 2012, 27, 92–102. [Google Scholar] [CrossRef]
- Vázquez-Rowe, I.; Rugani, B.; Benetto, E. Tapping carbon footprint variations in the European wine sector. J. Clean. Prod. 2013, 43, 146–155. [Google Scholar] [CrossRef]
- Villanueva-Rey, P.; Vázquez-Rowe, I.; Moreira, M.T.; Feijoo, G. Comparative life cycle assessment in the wine sector: Biodynamic vs. conventional viticulture activities in NW Spain. J. Clean. Prod. 2014, 65, 330–341. [Google Scholar] [CrossRef]
- Longbottom, M.L.; Petrie, P.R. Role of vineyard practices in generating and mitigating greenhouse gas emissions. Aust. J. Grape Wine Res. 2015, 21, 522–536. [Google Scholar] [CrossRef]
- Tuomisto, H.L.; Hodge, I.D.; Riordan, P.; Macdonald, D.W. Does organic farming reduce environmental impacts?—A meta-analysis of European research. J. Environ. Manag. 2012, 112, 309–320. [Google Scholar] [CrossRef]
- Oliveira, M.; Duarte, E. Integrated approach to winery waste: Waste generation and data consolidation. Front. Environ. Sci. Eng. 2016, 10, 168–176. [Google Scholar] [CrossRef]
- Arvanitoyannis, I.S.; Ladas, D.; Mavromatis, A. Potential uses and applications of treated wine waste: A review. Int. J. Food Sci. Technol. 2006, 41, 475–487. [Google Scholar] [CrossRef]
- Benetto, E.; Kneip, G.; Jury, C.; Vázquez-Rowe, I.; Huck, V.; Frank, M. Life cycle assessment of heat production from grape marc pellets. J. Clean. Prod. 2015, 87, 149–158. [Google Scholar] [CrossRef]
- Ghidossi, R.; Poupot, C.; Thibon, C.; Pons, A.; Darriet, P.; Riquier, L.; De Revel, G.; Peuchot Mietton, M. The influence of packaging on wine conservation. Food Control 2012, 23, 302–311. [Google Scholar] [CrossRef]
- Guinèe, J. Handbook on life cycle assessment—Operational guide to the ISO standards. Int. J. Life Cycle Assess. 2001, 6, 225. [Google Scholar]
- CML-IA Characterisation Factors. Universiteit Leiden. 2018. Available online: http://cml.leiden.edu/software/data-cmlia.html (accessed on 24 January 2018).
- PRé. SimaPro Database Manual Methods Library. 2015. Available online: http://www.pre-sustainability.com/download/DatabaseManualMethods.pdf (accessed on 14 August 2015).
Figure 1.
Wine production countries in the world in terms of wine amount produced (a) and Vineyards surface in wine production countries (b) (elaborated from OIV [3] data).
Figure 1.
Wine production countries in the world in terms of wine amount produced (a) and Vineyards surface in wine production countries (b) (elaborated from OIV [3] data).

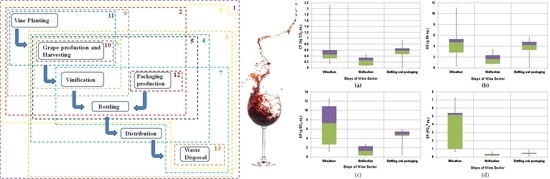
Figure 2.
System boundaries of the reviewed studies. The numbers 1–13 indicate the different system boundaries of the studies reported in Table 1.
Figure 2.
System boundaries of the reviewed studies. The numbers 1–13 indicate the different system boundaries of the studies reported in Table 1.

Figure 3.
Environmental impacts of the main wine sector steps calculated as Carbon Footprint (a); Abiotic Depletion (b); Acidification Potential (c); and Eutrophication Potential (d).
Figure 3.
Environmental impacts of the main wine sector steps calculated as Carbon Footprint (a); Abiotic Depletion (b); Acidification Potential (c); and Eutrophication Potential (d).

Figure 4.
Environmental impacts of red and white wine types evaluated in the papers in terms of: Carbon Footprint (kg CO2 eq.); Abiotic Depletion (g Sb eq.); Acidification Potential (g SO2 eq.); Eutrophication (g PO43−) and Water Footprint (hl).
Figure 4.
Environmental impacts of red and white wine types evaluated in the papers in terms of: Carbon Footprint (kg CO2 eq.); Abiotic Depletion (g Sb eq.); Acidification Potential (g SO2 eq.); Eutrophication (g PO43−) and Water Footprint (hl).

Figure 5.
Carbon Footprint of the viticulture phase in function of the vineyards latitude (elaborated from the results of the papers reported in Table 1).
Figure 5.
Carbon Footprint of the viticulture phase in function of the vineyards latitude (elaborated from the results of the papers reported in Table 1).


Table 1.
Main characteristics of the papers considered in the review (details of the boundaries, related to the assigned number, are shown in Figure 2).
Table 1.
Main characteristics of the papers considered in the review (details of the boundaries, related to the assigned number, are shown in Figure 2).
| References | Wine Type | Location | Objective c | F.U. | BOUNDARIES d |
|---|---|---|---|---|---|
| Amienyo et al., 2014 [12] | Red | Australia | LCA of a wine type | 0.75 L of wine | 3 (GP, V, PP, B, D, WD) |
| Ardente et al., 2006 [13] | Red | Italy | LCA of a wine type | 0.75 L of wine | 4 (GP, V, PP, B, D) |
| Arzoumanidis et al., 2014 [14] | Red | Italy | LCA of a wine type | 0.75 L of wine | 4 (GP, V, PP, B, D) |
| Benedetto, 2013 [15] | White | Italy | LCA of a wine type | 0.75 L of wine | 2 (VP, GP, V, PP, B) |
| Bonamente et al., 2015 [16] | Red | Italy | LCA of a wine type (WF) | 0.75 L of wine | 3 (GP, V, PP, B, D, WD) |
| Bonamente et al., 2016 [17] | Red | Italy | LCA of a wine type (CF; WF) | 0.75 L of wine | 3 (GP, V, PP, B, D, WD) |
| Bosco et al., 2011 [18] | White, red | Italy | LCA of different wine types (CF) | 0.75 L of wine | 1 (VP, GP, V, PP, B, D, WD) |
| Bosco et al., 2013 [19] | Red | Italy | LCA of a wine type (CF) | 0.75 L of wine | 1 (VP, GP, V, PP, B, D, WD) |
| Chiusano et al., 2015 [20] | Red | Italy | LCA comparison of grapes use only for wine production and grapes use also for fruit juice production | 1 L of wine | 9 (VP, GP, V) |
| Cichelli et al., 2016 [21] | Red | Italy | LCA of a wine grape (CF) | 1 t of grape | 6 (GP, V) |
| Cleary 2013 [22] | n.s. a | Canada | LCA of different types of wine packaging | 1 L of wine | 12 (PP) |
| Falcone et al., 2016 [23] | n.a. b | Italy | LCA and LCC of different wine-growing | 1 kg of grape | 11 (VP, GP) |
| Ferrari et al., 2017 [24] | n.a. b | Italy | LCA of a wine grape | 566 t of grape | 11 (VP, GP) |
| Fusi et al., 2014 [25] | White | Italy | LCA of a wine type | 0.75 L of wine | 1 (VP, GP, V, PP, B, D, WD) |
| Gazulla et al., 2010 [26] | Red | Spain | LCA of a wine type | 0.75 L of wine | 3 (GP, V, PP, B, D, WD) |
| Herath et al., 2013 [27] | n.s. a | New Zealand | LCA of different wine types (WF) | 0.75 L of wine | 6 (GP, V) |
| Iannone at al., 2015 [28] | White, Red | Italy | LCA of different wine types | 0.75 L of wine | 7 (V, PP, B, D, WD) |
| Kounina et al., 2012 [29] | n.s. a | n.sa | LCA of wine production in function of product loss rates | 0.75 L of “drinkable” wine | 1 (VP, GP, V, PP, B, D, WD) |
| Lamastra et al., 2014 [30] | White, red | Italy | LCA of different wine types (WF) | 1 L of wine | 5 (GP, V, PP, B) |
| Litskas et al., 2017 [31] | n.a. b | Cyprus | LCA of different wine grapes (CF) | 1 kg of grape | 10 (GP) |
| Marras et al., 2015 [32] | n.a. b | Italy | LCA of a wine grape | 1 kg of grape | 10 (GP) |
| Meneses et al., 2016 [33] | Red | Spain | LCA of a wine type | 0.75 L of wine | 8 (VP, GP, V, PP, B, WD) |
| Neto et al., 2013 [34] | White | Portugal | LCA of a wine type | 0.75 L of wine | 4 (GP, V, PP, B, D) |
| Pattara et al., 2012 [35] | Red | Italy | LCA of a wine type (comparison of LCA results and new CF methodology results) | 0.75 L of wine | 4 (GP, V, PP, B, D) |
| Pizzigallo et al., 2008 [36] | Red | Italy | LCA and emergy of different wine types | 1 t of wine | 8 (VP, GP, V, PP, B, WD) |
| Point et al., 2012 [37] | n.s. a | Canada | LCA of a wine type | 0.75 L of wine | 3 (GP, V, PP, B, D, WD) |
| Quinteiro et al., 2014 [38] | White | Portugal | LCA of a wine type (freshwater use evaluation) | 0.75 L of wine | 9 (VP, GP, V) |
| Rinaldi et al., 2016 [39] | White, red | Italy | LCA of different wine types (CF; WF) | 0.75 L of wine | 3 (GP, V, PP, B, D, WD) |
| Ruggieri et al., 2009 [40] | n.a. b | Spain | LCA of different alternatives to manage wine organic waste | 1 kg of nitrogen provided to vineyard lands | 13 (WD) |
| Steenwerth et al., 2015 [41] | n.a. b | USA | LCA of different wine-growing | 1 t of grape | 10 (GP) |
| Vázquez-Rowe et al., 2012 [42] | White | Spain | LCA of a wine type | 0.75 L of wine | 5 (GP, V, PP, B) |
| Vázquez-Rowe et al., 2012b [43] | n.a. b | Italy | LCA of a wine grape | 1.1 kg of grape | 10 (GP) |
| Vázquez-Rowe et al., 2013 [44] | White, red | Italy, Spain, Luxembourg | LCA of different wine types (CF) | 0.75 L of wine | 2 (VP, GP, V, PP, B) |
| Villanueva-Rey et al., 2014 [45] | n.a. b | Spain | LCA of a wine grape type | 1 kg of grape | 10 (GP) |
a n.s. = not specified; b n.a. = not applicable; c WP = Water Footprint; CF = Carbon Footprint; d VP = Vine Planting; GP = Grape Production and harvesting; V = Vinification; PP = Packaging Production; B = Bottling; D = Distribution; WD = Waste Disposal.
© 2018 by the authors. Licensee MDPI, Basel, Switzerland. This article is an open access article distributed under the terms and conditions of the Creative Commons Attribution (CC BY) license (http://creativecommons.org/licenses/by/4.0/).
Share and Cite
MDPI and ACS Style
Ferrara, C.; De Feo, G. Life Cycle Assessment Application to the Wine Sector: A Critical Review. Sustainability 2018, 10, 395. https://0-doi-org.brum.beds.ac.uk/10.3390/su10020395
AMA Style
Ferrara C, De Feo G. Life Cycle Assessment Application to the Wine Sector: A Critical Review. Sustainability. 2018; 10(2):395. https://0-doi-org.brum.beds.ac.uk/10.3390/su10020395
Chicago/Turabian StyleFerrara, Carmen, and Giovanni De Feo. 2018. "Life Cycle Assessment Application to the Wine Sector: A Critical Review" Sustainability 10, no. 2: 395. https://0-doi-org.brum.beds.ac.uk/10.3390/su10020395
Note that from the first issue of 2016, this journal uses article numbers instead of page numbers. See further details here.