Resilience with Mixed Agricultural and Urban Land Uses in Tokyo, Japan


1
Graduate Program in Sustainability Science—Global Leadership Initiative, Graduate School of Frontier Sciences, The University of Tokyo, Chiba 277-8563, Japan
2
Department of Natural Environmental Studies, Graduate School of Frontier Sciences, The University of Tokyo, Chiba 277-8563, Japan
3
Department of Urban Engineering, School of Engineering, The University of Tokyo, Tokyo 113-8656, Japan
*
Author to whom correspondence should be addressed.
Sustainability 2018, 10(2), 435; https://0-doi-org.brum.beds.ac.uk/10.3390/su10020435
Submission received: 11 December 2017
/
Revised: 20 January 2018
/
Accepted: 5 February 2018
/
Published: 7 February 2018
(This article belongs to the Special Issue Assessing the Sustainability of Urban Agriculture: Methodological Advances and Case Studies)
Abstract
:Urban agriculture can enhance the resilience of neighborhoods by providing fresh food in times of natural disasters; however, there is little empirical evidence to support this. Therefore, this study proposes a methodology to identify patterns of agricultural production in urban areas by quantifying self-sufficiency rates in vegetable weight and key nutrients. A spatial grid cell analysis using a geographic information system (GIS) identifies the current and potential self-sufficiency of each land use pattern in Tokyo. In a total of 1479 grid cells, the dominant land use and locations of 49,263 agricultural plots led to the categorization of six distinguishable land use patterns. The results showed that Tokyo has a fruit and vegetable self-sufficiency of 4.27% and a potential of 11.73%. The nutritional self-sufficiency of selected nutrients was the highest in vitamin K (6.54%), followed by vitamin C (3.84%) and vitamin A (1.92%). Peri-urban areas showed the highest resilience in relation to aggregated risks and population density because of the mixture in agricultural and urban land uses.
Keywords:
urban agriculture; resilience; land use; vacant land; neighborhood; food security; dietary nutrition1. Introduction
In 2015, the world population reached 7.3 billion people [1], 54% of whom lived in urban areas. Urban populations are projected to increase by 66% before 2050 [2]. With many countries experiencing rapid urbanization and urban areas often facing many complex problems related to governance and decision-making, governments continue searching for sustainable solutions to improve the resilience of urban areas [3]. At the same time, local governments face problems with the maintenance of public spaces because of high costs [4]. This situation is expected to exacerbate in the future due to aging society [5].
Urban agriculture (UA) may be one affordable alternative for the maintenance of public green spaces [6]. In the present study, UA is defined as production of fruits and vegetables within or in proximity of an urban area [7]. Historically, cities transformed agricultural lands for more profitable land uses, and sustainable food systems were integrated into the New Urban Agenda to ensure sustainability of urban development [8]. To pursue this agenda, more research is needed to identify current and potential agricultural production in urban areas and meet the demands of the urbanites; UA is one way to address food security in cities.
UA plays different roles for food security in developed and developing countries. In developed countries, UA improves nutrient intake in food deserts for underserved populations and serves as a general source of healthy, locally-sourced food, closing the loop of the circular economy [9]. In developing countries, UA can be the main source of food amidst challenges of rapid urbanization for low-income populations [10]. It can also provide income to enable purchases of other foods [11]. UA has also provided common benefits to developed and developing countries, e.g., in the aftermath of a disaster in Haiti [12] where survivors were temporarily cut off from conventional sources of food.
Research shows that UA farmers specialize in small-scaled practices that provide greater diversity and fresher crops compared to those of rural farmers [13]. The main reason for this is that urban farmers are disadvantaged in production areas, making it difficult for them to compete in the wholesale market. Rather, UA farmers tend to focus on direct and local sales (e.g., farmers’ markets) that require greater varieties of crops to meet the local demand [14]. Although there are exceptions, urban farmers plant high-quality, labor-intensive, perishable crops, instead of staple crops in order to differentiate themselves in competition with rural farmers [15].
UA has already been proven to address many urban challenges (such as food security, access to fresh food, resilience, dietary diversity, nutrition intake, social inclusion, heat island effect, and a source of income for urban poor [16]). It has also been said that UA can be practiced on land of any size or shape [17], making it a land use type that can easily be adapted on underutilized lands, such as vacant lands that are often unsuitable for other purposes because they are small in size and irregular in shape. Furthermore, UA can be practiced on floodplains and land with earthquake risks [6], improving the resilience of the population. These benefits show that UA contributes to the sustainability of urban areas, especially by developing underutilized land. However, few empirical studies focus on the spatial distribution of UA or its nutritional contribution to cities.
Fresh food is important for public health [18]. However, more than 60% of urban areas are prone to earthquakes, floods, and tropical cyclones, which can affect the food supply from other areas [19]. Increasing urban resilience through disaster preparedness and adaptation strategies, especially in relation to the social, environmental, and economic infrastructure, has been a critical agenda item for governments [20]. One example, Japan, is a country prone to natural disasters, but with densely-populated cities, narrow roads, and complex utility systems. The Japanese government has developed a system that solicits UA farmers to register their lands as disaster prevention cooperation farmland [21]. Registered farmers agree to have affected populations temporarily evacuate to their farmlands, and permit the construction of temporary shelters where emergency food is distributed. This is an UA strategy with co-benefits of overcoming temporary food crises after a natural disaster and securing space for temporary shelters contributing to public safety. Indeed, recent studies report on the health benefits of UA activities due to improved access to fresh produce [22] and dietary nutrition [23] in the context of natural disasters.
Current emergency relief mainly consists of carbohydrates, and case studies of cities struck by large earthquakes have reported the need for more nutritious diets [24]. For example, increases in health issues (e.g., cardiovascular disease) caused by deficiency in nutrients, such as vitamin C, were reported by previously-healthy people after the Great East Japan Earthquake [25]. Increased intake of fresh fruits and vegetables from UA has been linked to the prevention of cardiovascular diseases, cancer, and other dietary-related health problems [26]. In this context, UA has been discussed as one source of disaster preparation food. Although current emergency food fulfills its purpose of providing sufficient energy, UA can help to provide nutrients lacking in post-disaster situations (e.g., [24,27]).
UA also has benefits beyond emergency food. Lifestyle habits and health have been linked in several food studies (e.g., food desert studies) [28,29]. One study in New York City found that participation in community-supported agriculture increased people’s vegetable consumption, induced positive changes in dietary pattern, and increased consumption of seasonal, local foods [30]. This study also demonstrated that participation in UA was associated with increases in physical activity. Another study, in Milan, found that hobby farmers are aware of these health benefits, as their main motivations for engaging in UA was their conviction that growing one’s own food is healthier than buying it in the market [31]. One study in the Netherlands showed that participants of all age categories experienced health benefits, and that older participants experienced the greatest benefits [32]. These studies indicate that UA can provide coupled psychological and physical health benefits, and that these benefits may be especially useful in combatting the health challenges reported in emergency situations [33].
There are, however, differences in the availability of UA land. Duany and colleagues [34] categorized UA zones based on the gradient of land uses of the city from urban core to the nature zone. Their classification scheme was adapted and modified for the present study to quantify how UA can better local food security through land use pattern analysis. At present, there are no studies combining spatial and self-sufficiency analysis of UA despite the heavy dependency of self-sufficiency rates on yield, availability of agricultural land [35,36,37], and local demand. To assess the potential contributions of UA to food security, it is necessary to understand how produce from UA can contribute to food self-sufficiency in different parts of the city.
The rationale for this research is that previous studies have highlighted the lack of evidence on the potential contributions of fruits and vegetable production from UA to nutritious diets [23]. This study proposes a methodology to identify the spatial distribution of different UA types in the urban area of Tokyo and to quantify the contributions of fruit and vegetable weight and nutritional self-sufficiency according to each land use pattern. Two scenarios lead to policy recommendations for the protection of UA and transformation of un-utilized land for agricultural production. The linkage between regional spatial analysis and assessment of post-disaster nutritional availability provide quantitative evidence on the importance of UA. The results support the importance of UA for resilience, contribute scholarly knowledge on UA practices in Tokyo, and may be further developed into an assessment tool for the spatial distribution of UA.
2. Materials and Methods
2.1. Study Design
This study is designed with a mixed-method approach combining spatial data and quantifications in five steps: (1) spatial analysis was conducted to identify the farmlands in the study area; (2) grid structure was applied to the case study and a land use categorization was made to identify different land use patterns; (3) reference consumption and production was estimated; (4) self-sufficiency based on the population for each grid cell was quantified; (5) nutritional self-sufficiency of a selection of nutrients was quantified; and (6) representative grid cells were selected from each urban category. Furthermore, the discussion section was designed around the land uses and the corresponding results from the other sections in the study.
2.2. Empirical Case Study
Tokyo is one of the world’s 35 large megacities (a city with more than 10 million inhabitants) [20], and is located in the most earthquake-exposed community of the world [19]. The administrative area of Tokyo has a population of 13.51 million people and a population density of 6168 people per km2 (2015). Residential migration to the city has caused a reported increase in the population of 2.7% from the year 2010 to 2015 [38], indicating its growth in contrast to the general population decline caused by a super-aging society (the total population of Japan in 2004 peaked at 128 million and is projected to shrink to 75% of its peak size by 2050. In total, one in three people by 2030 will be over 65 years old) [5] in Japan. The city has a history of large earthquakes with devastating impact. Therefore, the Tokyo Metropolitan Government (TMG) invests into the preparedness and predictions of the impact of such events. A simulation predicted that a magnitude 7.3 earthquake under Tokyo Bay North Area would kill approximately 9700 people, injure 147,600 and destroy 304,300 buildings. There would be some 3,390,000 evacuees by the next day and, in total, 5,170,000 people would be isolated [39]. The impact of such magnitude shows that food distribution is an important factor in the emergency preparedness and response.
UA has been a fundamental part of the Tokyo city region since the Edo Period (a period of relative stability and well established environmental ethics under the rule of the Tokugawa family (1603–1868) [40]). Namely, samurai households maintained their own vegetable gardens [41]. This presence provides a pre-existing potential of food for the affected populations. However, no studies have incorporated the different land use patterns of the city and their corresponding self-sufficiency from UA considering the different land use patterns in Tokyo. Despite a high population density, the Census of Agriculture and Forestry (2015) reported that there are 11,222 farm households [38] farming a total of 71.30 km2 of UA lands. Of those lands, 68.60 km2 are non-paddy fields and 2.77 km2 are paddy fields [38], which hold potential for food security during emergency situations as previously described. In the present study as shown in Figure 1, island municipalities were excluded from the analysis because of their geographical locations far away from the mainland and different socio-cultural and economic conditions (e.g., a lower population density and have tourism as the main industry). The study was conducted in the remaining 53 municipalities totaling 1778.09 km2 [42].
2.3. Step 1: Identification of Farmlands
UA land uses in this study were selected based on literature studies and field observations (2015–2016). The selection was categorized according to professional and hobby UA. Professional UA has similar characteristics to rural agriculture. A professional farmer owns the land and conducts the agricultural activities to make a profit. Hobby UA has two variations in ownership and maintenance. On the one hand there are allotment farms that have different types of ownership (e.g., government), but are fully maintained by hobby farmers. On the other hand, there are experience farms. In this case, a professional farmer owns the farm while a hobby farmer pays to experience farming. Professional UA was previously documented in literature and governmental statistics. However, there was no pre-existing data on hobby UA. Having a distinction between the UA types was considered important because each type has its own techniques, choices in crops, and engagement by the farmer [43], resulting in different yields, consequently influencing self-sufficiency rates. In Tokyo, four types of UA were identified for the production of fruits and vegetables as shown in Table 1 [37,43]. Existing studies have also discussed the potential to transform vacant lots for agricultural purposes [44,45]. In this study, a vacant lot is defined as an open plot of land of which the plot contains no building structure or only a small structure [45]. TMG’s land use data [42] includes vacant lots, however, some are merely temporary vacant. To estimate the potential from these vacant lots in the present case study, a selection of stable vacant land was made. Stable vacant land is defined as a vacant lot that has not been changed from another land use since 2010 to 2015 as shown in Table 1.
2.3.1. Current Urban Agricultural Land Use
Professional UA land uses have been documented by the land use section of TMG [42] and are updated every five years. However, hobby UA data is not documented by TMG. The dataset on professional UA (vegetable fields and orchards) was retrieved (2015) and primary data of the spatial locations and areas of hobby UA types was developed in the present study. This was conducted according to the method developed by Sioen et al. [23,37] and described below, updated, and refined according to the latest satellite imagery (2015–2016) and objective of the present study.
Firstly, online hobby farm databases of each municipality were accessed in order to retrieve their locations. In total 46 of 53 municipalities had an official database, of which 27 listed their allotment farms and 19 their experience farms. The location of each farm retrieved from the databases was then identified and documented with Google Earth Pro (ver. 7.1.8, Mountain View, California, USA) satellite imagery to give up data about the location and characteristics. Each type has their own characteristics, resulting in different visual aspects and crops. Experience farms are owned by professionals and grown by hobby farmers. Professional farmers looking for alternative farming styles developed experience farming within the existing policy framework. This is because urban areas are heavily taxed and fall under the city-planning act (1968). For farmers, there is a tax reduction scheme called Productive Green Land Act [48] that was introduced in 1974 and revised in 1992, stating that, among other conditions, a professional farmer must cultivate the land. Respecting this act, a group of creative farmers led by Mr. Shirashi [49] developed experience farms, where professional farmers rent out small portions of their land to hobby farmers to experience farming. The professional farmers help these urban residents by providing crop plans, and help them throughout the farming processes. This resulted in plots of land with visually similar crops and patterns. Additionally, hobby farmers rent allotment farms; however, because there is no guidance by professionals, no homogenous visual pattern can be identified. They have a disordered appearance due to the high diversity of crop combinations and are located on a variety of land types.
Next, an accuracy assessment was conducted confirming the existence and type of farm by utilizing Google Street View (Mountain View, California, USA) [37]. When the location of the farm was not detailed enough or the location could not be confirmed, the surrounding area was visually scanned and nearby plots were analyzed according to the criteria set in the visual description of Table 1.
Secondly, identification of the non-registered hobby UA was conducted with the help of a 1 km2 grid structure that was drawn over the case study area. The satellite imagery inside each grid cell was carefully scanned for remaining farms and their locations were documented and assessed, as detailed in the first step.
Thirdly, the locations were superimposed over the governmental UA land use data in a geographic information system (GIS) (ArcGIS ver. 10.3, Redlands, CA, USA). To improve the accuracy, their spatial characteristics were shaped according to the plot characteristics of the dataset and given a separate identification code. In case of situation A: hobby UA overlaying professional agricultural land uses; and Situation B: hobby UA located on vacant lands or other land uses. In case of Situation A, the identification code of the existing land use data set was modified to a hobby UA type. In case of Situation B, a new polygon with a corresponding identification code was added to the existing shapefile. Finally, all UA types were combined into one shapefile that had corresponding codes identifying the type of UA. This was then utilized for land use categorization and production estimates as detailed in step two (Section 2.4).
2.3.2. Potential for Urban Agricultural Land Use
Vacant land was identified as a land use that is unutilized in comparison to other land uses in Tokyo. A previous study in Oakland, California indicated the potential of vacant land to be utilized for UA purposes [44]. Additionally, previous self-sufficiency studies utilized vacant lots in their scenarios [35,50,51]. For the estimation in the present study it was decided to use the allotment indicator because of three reasons: (1) shrinking group of professional farmers [52]; (2) vacant lots are numerous and small in size [42], making it difficult for professional farmers to supervise; (3) allotments have the most flexibility to be applied on plots of different size or shape [17]. However, in Tokyo, many vacant lands are currently used as parking areas or other undocumented land uses. Additionally, they include temporary vacant lands. Therefore, for the development of the potential scenario in the present study, a selection of stable vacant lands was made. To do so, the shapefile was retrieved from the land use section of TMG [42]. Stable vacant lands were identified with the attribute table of the shapefile. Namely, polygons in the shapefile that were modified from the previous land use survey (2010) received a number indicating the land use modification. Only the polygons that had not been modified were selected for the estimation of potential UA land uses in the present study as it ensures their long-term vacancy.
2.4. Step 2: Land Use Categorization
The land use dominance in the present study is analyzed to classify the different land use patterns. Furthermore, the presence of farmlands was analyzed within those patterns because the aim is to estimate the self-sufficiency from present farmlands in contrast to the potential from other land uses. These land use patterns were developed by measuring the area of certain land uses: (1) farmlands as developed in Step one; (2) forests; (3) open spaces e.g., parks, vacant lands; and (4) urban land uses. Road infrastructure and water bodies were excluded from the analysis as these can have either urban or rural characteristics. Similarly, open spaces can be found in the urban areas, as well as the rural areas, therefore, these were analyzed separately. The definitions of the patterns for the present study are described in Table 2.
Additionally, a lower population density can be observed compared to type A and type B. Type D is dominated by open spaces and contains farmlands. Other than the presence of farmlands this category is similar to type C. Type E is dominated by farmland and contains urban land uses. This can be considered as a rural area, thus, not a core focus of the present study on UA. Type F is dominated by forest and does not contain farmland.
Each type in Tokyo was systematically analyzed to identify the land use patterns and mixtures in land uses. To do so, a grid structure (1 × 1 km) was superimposed over the case study area, equally dividing it into sub-areas. The grid cells covering neighboring prefectures were excluded because, while land use policies in Japan are drawn on the macro level by the national government, they are interpreted on the prefectural and municipal levels. This meant that local differences could have affected the land use patterns. A total of 1480 individual grid cells remained. Within the grid cells, the number of plots and total land area of each UA type was collected. Based on the location of the center points, each plot was given the identification code of the grid cell it was located in. The total area for each UA type and number of individual plots was then calculated in each grid cell. Furthermore, the developed data was utilized for the classification according to the land use pattern definitions described in this section above.
2.5. Step 3: Reference Consumption and Production
The reference consumption of the population, UA production, and corresponding self-sufficiency were quantified within each grid cell developed in step two.
2.5.1. Reference Consumption
The reference consumption of the nighttime population in each grid cell was estimated. The nighttime-daytime population distinction is common in many Asian cities because of the transit-oriented cities [53]. In the case of a disaster, which can happen at any time of day, survivors, when possible, return to their homes, making the nighttime population most relevant. The reference consumption is defined as the recommended intake of fruits and vegetables multiplied by the population. The current daily consumption of fruits and vegetables in Japan is 282 g per capita and is lower than the targeted per capita daily intake of 350 g per capita set by the Japanese Ministry of Health, Labor, and Welfare (MHLW) [54]. Both rates are lower than the recommended minimum intake of 400 g proposed by the World Health Organization [55]. To better understand the role UA can have in the case study while considering increases in fruits and vegetables intake towards the target set by MHLW the targeted rate was chosen to develop the reference consumption. The targeted per capita daily intake of fruits and vegetables is used to determine the reference intake of the population in each grid cell. The population in each grid cell was available from the land use section of TMG (2015) [42].
The nutritional reference consumption was estimated with the latest data on the daily dietary reference intake for Japan (2015), which was retrieved from the Japanese MHLW [56]. The recommended dietary allowance was chosen, or if unknown, the adequate intake of the selected nutrients by gender [56] as shown in Table 3. The population in each grid cell was also retrieved as described in with the reference consumption of fruits and vegetables. Since the population data of the grid cells excluded age, the estimation was conducted with the age group that has the highest intake of nutrients, namely adult between 30 and 49 years old [56]. Depending on the nutrient, younger populations would have required less intake, meaning that the present study is still an underestimation of the actual self-sufficiency. Next, the total requirements for the remaining nutrients were calculated for each gender by multiplying the reference intakes for Japan with the population residing in a grid cell.
2.5.2. Production
The focus on the production of fruits and vegetables varies according to the municipalities because of historical, practical, and cultural factors. Previous studies with spatial production estimations assumed a homogeneous production in each region. The yields of professional UA were estimated based on governmental survey data available for each municipality. To date, the authors found only one study (in Japanese) documenting the production of the two hobby UA types. Therefore, to determine the production yield for each UA plot, the methodology was divided according to professional and hobby UA.
Professional UA
Every five years TMG conducts an Agricultural Products Production Survey in the municipalities that have professional UA [57]. The survey documents the area [are] and production [ton] of fruit and vegetables of professional farms over a one-year period. The latest data (2015) documenting UA activity in 40 out of 53 selected municipalities was retrieved. The results of this data set (ton) were then equally spread over the UA area in each municipality. This showed that the total production per vegetable varied in each municipality.
The harvest for each professional UA type within each grid cell was calculated by multiplying the area per type of UA plot with its corresponding yield factor according to the municipality in which it was located. To obtain the harvest in the municipalities not covered by the survey (13 out of 53), the average yield per fruit or vegetable product was utilized. These averages were then multiplied by the area of each professional UA type in each grid cell.
Hobby UA
A previous study conducted by Tahara et al. (2011) quantified the production of vegetables in the two hobby UA types in the Tokyo Metropolitan Area over a one-year period [43]. The study randomly selected five allotment plots in Inagi, Chiba, and five experience plots in Nerima, Tokyo, of which the participants were asked to record weights of each harvest over a one year time period. The results were retrieved, specifying the types of vegetables. Between the different users of each type of UA, the production did not vary significantly as shown in Appendix A. However, a range in the results of allotment UA was observed. The users in experience farms were under the strict guidance of a professional farmer and harvest schedule, which meant a similar harvest for each hobby user. Different scenarios for the present study are possible by using the ideal case results, the average, or the least ideal. However, hobby UA has only a minor influence on the total UA production in the city. Therefore, the average productions per square meter and UA type were utilized for the present study as detailed in Appendix A Figure A1. Additionally, the presence of each vegetable in a square meter was estimated based on the average percentage of representation of that vegetable in the study conducted by Tahara et al. (2011) [43]. This provides the data necessary to estimate the nutrient content per square meter. To estimate the total hobby UA production by grid cell, the average yield per square meter of each type of land was multiplied by the area of that type. Finally, the results of professional and hobby UA were combined providing an estimation of the total harvest in each grid cell. The total harvest () per fruit or vegetable () for grid cell () was estimated by combining the harvest from professional () and hobby farms () as follows:
where:
- is the field area per farm type for fruit or vegetable in grid cell (m2);
- is the yield per farm type for fruit or vegetable in grid cell (kg/m2); and
- is the vegetable production percentage for hobby farms as estimated from [43] (-).
2.6. Step 4: Self-Sufficiency of Fruits and Vegetables
The outcome of the previous section shows the harvests of fruits and vegetables for each grid cell. However, before consumption, fruits and vegetables are cleaned and the parts not suitable for consumption, hereafter referred to as the refuse rate, were removed. The Kagawa Nutrition University Publishing Division documented the mean refuse rates for Japanese cooking standards [58]. The list indicates the refuse for each type of fruit and vegetable. The latest data was retrieved from the 7th edition of the Tables of Food Composition (2016) in Japanese. Next, the refuse for each product was subtracted from the harvest in each grid cell.
The self-sufficiency () for grid cell () was obtained as follows:
where:
- is the refusal rate or non-edible percentage per fruit or vegetable (-); and
- is the reference consumption of fruits and vegetables for the population in grid cell (kg).
2.7. Step 5: Nutritional Self-Sufficiency
The nutritional self-sufficiency was estimated in each grid cell utilizing the production results from Step Three. The total nutrient content in each grid cell for each fruit and vegetable species was estimated with data provided by The Kagawa Nutrition University Publishing Division [58]. The dataset provided the mean nutrient content according to fruit and vegetable in Japan. The Ministry of Health, Labor and Welfare (MHLW) conducts a yearly survey of the food sources of dietary nutrients in Japan [59]. A selection of nutrients that provide more than 50% from fruits and vegetables was made and retrieved from the 2015 results for the present study.
The nutritional self-sufficiency () for grid cell () of nutrient () was obtained as follows:
where:
- is the refusal rate or non-edible percentage per vegetable (-); and
- is the reference consumption of each nutrient for the population in grid cell (kg).
Finally, two representative grid cells for each land use pattern were selected and their corresponding results from each step are listed for in-depth discussion on a neighborhood scale.
2.8. Step 6: Representative Grid Cells
To improve the understanding of what a grid cell in each of the four urban categories represents, a random selection of each type was made. The shapefile containing UA land uses is highlighted in colors according to UA type and superimposed on the satellite imagery. Furthermore, a table lists the results of each representative grid cell according to the methods described above.
3. Results
3.1. Identified Farmlands
Vegetable fields, orchards, allotments, and experience UA lands were identified and documented according to their current and potential use in Tokyo (Table 4). The total of the current productive UA land is 54,862,092 m2. An increase of 45% to 79,635,198 m2 potential UA land surfaces could be achieved when including stable vacant lots. Despite the lack of current UA production in many municipalities, the shortage can potentially be eliminated with stable vacant lands, as is shown in Figure 2.
3.2. Land Use Categorization
A total of 1479 individual grid cells are shown in Figure 3. The eastern part of Tokyo (23 special wards of Tokyo), which is mostly urban, shows two main variations in land uses. Type A, which is in the center core of the city and type B, a suburban belt of urban area surrounding the core of the city mixed with farmlands as a mosaic. These areas were mostly developed during the rapid population growth in the 1960s and did not follow strict planning codes. These areas have been described as Japanese sprawl. Despite of the mixture in land uses, type B has some of the highest population density in Tokyo. The open spaces in this area are found to be public parks (e.g., Shibuya Park) and fields along the rivers (e.g., Arakawa River and Sumida River) belonging to type C and type D. Other areas towards the northwest of central Tokyo (North Tama area) also contain a large number of parks (e.g., Showa Kinen Park) that are represented in the grid cells. These areas still contain a high population density but simultaneously have a great number of farmlands (Figure 1). The southwest of Tokyo (South Tama area) has areas that are similar to the urban core of East Tokyo but still contains a great number of open spaces. This is because the area had been designated for the development of Tama New Town to meet the housing demand during the rapid expansion of the city in the sixties. Tama New Town is developed according to strict design concepts with condominiums and open spaces. The western part of Tokyo (West Tama area) is mostly types E and F because of the hilly typography with very low population density in the forest area. The farmland that is present in these areas can mostly be considered as rural agriculture because of the low population density and the lack of other types of land uses in the area.
3.3. Reference Consumption and Production
The reference consumption (kg) has a total demand of 1,521,809,100 kg from fruits and vegetables in Tokyo. The grid cell analysis in Figure 4 shows that the demand for fruit and vegetables is concentrated in land use patterns A and B, which is dominantly urban, representing the cities inner core and surrounding suburban area.
The production (kg) of fruit and vegetables in Tokyo is distributed over different areas, as shown in Figure 5. There is an annual production of 71,560,533 kg from professional UA and 3,472,208 kg from hobby UA. The grid cells that were categorized as types B, D, and E in Figure 3 showed the highest production by grid cell. However, because of the cultivation and combinations of different fruits and vegetables, there are differences in the production by grid cell depending on the type and species grown in the municipality it is located in.
The potential production from stable vacant lands shows a considerable increase of 126,884,116 kg in production (Figure 6) in addition to the current production. Furthermore, the grid cells identified as Type A, which includes many vacant lands, show some potential compared to the result of the current situation.
3.4. Self-Sufficiency of Fruits and Vegetables
The self-sufficiency in Tokyo followed similar trends as the results in Figure 5 and Figure 6. The total population covered in the grid cells was 11,912,400 people, of which 5,889,811 are male and 6,022,589 are female. The current self-sufficiency estimated for the entire city region was 4.27% and the potential self-sufficiency was 11.73%. It was found that the median self-sufficiency was zero in Type A, Type C, and Type F of the current production scenario. From relevant types the mean self-sufficiency of the current situation is the lowest in Type B (3%), higher in Type D (6%), and the highest in Type F (105%) with varying increases in the potential scenario as shown in Figure 7 and detailed in Table 5.
To represent the self-sufficiency of UA, types A–D were selected because of their urban land uses. These are mostly located inside the 23 special wards of Tokyo (and suburban areas surrounding the inner core), as well as the populated areas of the Tama region, as shown in Figure 8. The areas surrounding the urban core had, despite having a high population density, a considerable presence of UA (Types B and D), which contributed to the self-sufficiency of the area. Similar trends were found in areas with the same type of land uses. A total of 4.22% fruit and vegetable self-sufficiency was found in the urban areas of Tokyo of which hobby UA contributed 0.20%.
The potential scenario focusing on UA in urban areas was found to have 11.68% self-sufficiency (Figure 9). In the current scenario, both Types A and C contain no UA, however, in the potential scenario, stable vacant lots contributed 7.45% to the self-sufficiency of urban Tokyo.
3.5. Nutritional Self-Sufficiency
Vitamin A, vitamin K, and vitamin C were selected because of their intrinsic need from fruits and vegetables in the Japanese diet. Their levels of self-sufficiency were then plotted according to the current scenario shown in Figure 10 and potential scenario in Figure 11.
The spatial distribution of the nutritional self-sufficiency of each selected nutrient per grid cell has similar patterns as the self-sufficiency shown in Figure 6 and Figure 7. Overall, vitamin K has the highest self-sufficiency (6.54%) followed by vitamin C (3.84%) and vitamin A (1.92%) (Table 6). Depending on the land use pattern, vitamin K contains higher rates in the current scenario; however, vitamin C has higher rates in the potential scenario because of variations in vegetables in hobby UA.
3.6. Representative Grid Cells
For each land use pattern two representative grid cells were selected (Figure 12) to analyze the details and characteristics of the land use patterns.
The randomly-selected representative grid cells provide details on the land uses (Figure 13). Furthermore, population according to gender, fruit and vegetable production, fruit and vegetable self-sufficiency, and nutritional self-sufficiency of selected nutrients are calculated (Table 7). The results show the trends in population density and the relationship with the categorization of land use patterns, as well as the corresponding gradation and mixture in land uses. Especially, the potential self-sufficiency scenario, which was designed with stable vacant lands, shows potential to increase the resilience and DRR of the population. In addition, the maps of each selected grid cell show the gradation in land uses from categories A to D.
4. Discussion
4.1. Land Use Patterns
In the present case study, UA practices were found to have a profound impact on the self-sufficiency of communities in each grid cell. In particular, the two land use types that contain a mixture of urban and open spaces with farmlands (Types B and D) showed high rates of self-sufficiency. These two types contained a mosaic of urban or open spaces with farmlands. The roles of UA in each land use pattern remain the same; however, their contributions differ based on the types, locations, and areas, also influencing the resilience. Other land use patterns (Type A) have little or no self-sufficiency in the present scenario. Stable vacant lands impacted core urban areas (Types A and B), open spaces (Types C and D), and the forestry areas (Types E and F).
Different models of urban growth within Tokyo are represented in the urban land use pattern. Areas exhibiting organic urban growth (Japanese sprawl) contained more vacant lands [61]. Regions that were formally developed according to modern planning concepts [62] showed less presence of both vacant lands and UA and, thus, contained less possibility for transformation into UA land uses or their utilization without compromising other land uses. Since UA land uses were considered to be rural land uses, these planned regions only exceptionally contained UA lands. For example, Tama New Town was planned with condominiums and a high population density in response to the housing demand of the 1960s [63] in Type C. In preparation for earthquakes, wider roads and open spaces (e.g., squares, and parks) surrounding the condominiums were provided for evacuation purposes.
Land use patterns dominated by forestry land uses (Types E and F) showed diverse results. Some grid cells were unoccupied, which made it impossible to conduct a self-sufficiency study. Having excluded these grid cells, remaining areas could be categorized further into regions with low population densities and high self-sufficiency, and regions with low population densities and low self-sufficiency. The reason is because there were no agricultural activities found that met the criteria of this study. In reality, households located in these areas often maintain homestead gardens [64] as a potential source of additional emergency food. Additionally, wildlife, and wild plants (e.g., mushrooms [65] or nuts [66]) in the forests can help provide the populations with nutrients until the normal distribution processes are recovered.
The rapid growth of the case study occurred during the 1960s [53]. However, because of this expansion and a lack of formal planning policies [53], this led to informal scattered sprawl (creating a mixture between urban and agricultural land uses). These areas remain vulnerable today and were often built up with low-quality housing (e.g., wooden rental houses—Moku-chin, in Japanese), lacking infrastructure, and with narrow roads [61]. Local municipalities (e.g., Nerima ward) have been exploring the potential to utilize the remaining UA in these areas for low-cost disaster preparedness purposes (evacuation and food provisioning) [23].
TMG (2013) created an aggregated risk assessment of Tokyo as means to inform its residents and to implement policies to protect the lives and assets from earthquake damages (Figure 14). The assessment is conducted by aggregating the risks of: (a) collapsing of buildings; (b) spread of fire; (c) the combination of building collapse and spread of fire; and (d) difficulty for emergency responses. The data is collected on “Cho Cho Moku” level boundaries, which is the smallest unit of spatial analysis in Japan. As shown in Figure 14, the greatest aggregated risk is found in the suburban area surrounding the inner core of the city. This is distributed around Ring Road No. 7, which represents the areas from Shitamachi to Yamanote (during the Edo Period) [67]. The surrounding suburban area is similar to the areas discussed above where Moku-chin buildings were constructed with the lack of urban planning policies, which means that there is a lack of infrastructure that can help prevent the spread of fire (e.g., wide open roads).
In the current food system [68,69], urban areas depend on rural areas for food production [70]. This dependency makes urban areas more sensitive to external shocks and leaves its residents at risk. Current policies are unable to protect UA lands in peri-urban areas (Types B–D) from conversion to other land uses, which would compromise the resilience of both the peri-urban community and the urban core (Type A). Analysis of the city region’s food system demonstrates the importance of the productivity of peri-urban UA in providing nutrients to the urban core during disaster situations. At the same time, stable vacant lots are small in size, and as shown in this study, may not be able to provide sufficient nutrients to the local population. It is crucial that agricultural activities in peri-urban areas be protected given the current locations of UA and the need to increase the resilience of the urban core [23,71,72,73].
4.2. The Contribution from Urban Agriculture in Land Use Planning
There is a mismatch between the best-case location of the population’s reference consumption (Figure 4) and that of production (Figure 5). On the one hand, the results show that especially urban areas (Types A and B) have a high demand of fruits and vegetables. On the other hand, these areas have no production or the lowest production. Similarly, areas that had more open spaces (Types C and D) had a relatively lower demand because of a lower population density, but have a high self-sufficiency when UA was present. When it comes to self-sufficiency from fruits and vegetables, the present study proves that in the inner core of the city, without the presence of farmlands, and with little potential for conversion from other land uses, UA is insignificant. However, areas where there is a larger presence of UA in combination with a lower urban population density, UA can contribute a considerable amount of fruits and vegetables containing valuable dietary nutrition. These factors can still vary depending on the type of fruits and vegetables that are grown on the UA lands. For example, the potassium content found in cabbage has a mean content of 200 mg per 100 g [58], while species such as spinach or taro contain over two times more potassium. Cabbage is the main vegetable grown in Nerima ward, therefore, to maximize the availability of potassium, other species would be recommended to increase the nutritional self-sufficiency on a local scale.
The results of this research are conceptually combined in Figure 15 to illustrate the production, reference consumption, self-sufficiency, and aggregated risk from urban to rural area. It is shown that the importance of UA changes according to location. The peri-urban zone, which contains a mixture in urban and rural land uses, contains the highest self-sufficiency in relationship to the aggregated risk compared to other areas. The characteristics of this unplanned zone with UA ensure a higher resilience compared to the homogenous urban core of the city. The rural areas contain more natural zones where there is a low population and farm density, consequently resulting in low or no self-sufficiency. The study is conducted based on nighttime population, which means that the urban core of the city, which contain fewer residential houses than businesses, have a lower population density and corresponding reference consumption despite its greater aggregated risk.
Research on the contributions of urban planning with UA to public health is emerging [74]. For example, urban planning studies discuss nutrition-sensitive agriculture and the positive psychological influences of UA [75]. This is because urban farmers have to meet the demands of urbanites with diverse, quality crops, leading to healthier urban environments and lifestyles [76]. Additionally, UA activities can produce co-benefits with other important activities. A study of high school students in Japan concluded that experiencing an earthquake alone did not increase awareness; active learning steps had to be taken for lasting effects for improved disaster preparedness [77]. UA can be utilized towards this end by enhancing users’ diets and familiarizing them with farmers, other local residents, and neighborhood evacuation spaces. These integrated benefits place greater emphasis on the health benefits of UA in urban planning [78].
4.3. Strategies to Increase Self-Sufficiency
Olsson et al. (2016) discussed the need to re-couple urban and rural regions food production from a resilience point of view [79]. The European case studies all experienced a reduction in agricultural land uses over recent years within their city regions, consequently reducing food availability. Local municipalities reacted to the loss of these lands by organizing “food councils”. However, they concluded that without the implementation of binding policies the agricultural lands will continue to decline [79]. The present case study of Tokyo faces similar challenges. UA land uses are declining under the current policies and it is expected that this trend will increase in the future with a negative impact on the presence of greenery in the city [80] and self-sufficiency.
Viljoen and Bohn (2009) discussed the essential long-term infrastructure of UA and reflected on the role UA has as “ornament” in a compact city [81]. Viljoen and Howe (2012) later suggested productive urban landscapes in the form of UA [82]. Tokyo fits the description by Viljoen and Howe (2012) about the long-term presence of UA land uses in a variety of forms, offering different functions, such as food production, dietary nutrition, and agriculture experiences for urban residents. They suggested to implement UA in between existing urban land uses for the improvement of general urban sustainability [83]. Type A in the present study, which contains no UA and functions as the urban core of Tokyo, can adopt such strategies to increase its self-sufficiency rates and corresponding resilience in by transforming stable vacant lands to hobby farms, either temporary or permanently.
As a field, urban food planning has been emerging [84] since its absence from contemporary planning was identified [85]. Urban food planning can help to secure food on a local scale and to create greener cities [85], and international discussions have been held among city mayors for the adoption and promotion of UA [86]. A recent study on city regions in Europe suggested economic indicators to evaluate whether the agricultural production was meeting consumer needs [87]. Despite the attempt to make amends for the lack of integration [88], empirical evidence on the role of UA in comparison to other land uses is still lacking, making it difficult for policy-makers to make calculated decisions [3].
Nonetheless, UA feeds the hungry in developing countries and enhances the sustainability of cities in developed countries [88]. The mere presence of UA in cities around the world confirms the need for suitable policies. In the case of Tokyo, the absence of a comprehensive food policy has led to a lack of coordination amongst ward strategies. Regardless, local wards are increasingly recognizing the importance of UA, subsidizing local production and consumption, and even organizing UA-related community events (e.g., Nerima ward, Tokyo) [89,90]. The Japan Agriculture Organization (JA) could play a central role in coordinating such endeavors because of its expertise and networks. Given the findings of this study on the potential of UA for food security in disaster situations, TMG would benefit from an integrated food planning policy to increase self-sufficiency and the creation of a provisioning strategy that supplements the existing systems of rations and relief.
4.4. Limitations and Future Work
The present study has several limitations. The nutritional self-sufficiency results are considered to be an underestimation because the harvests from professional UA production can only be quantified by what is sold to the market. Self-consumption and direct sales are not documented in these results despite previous studies reporting the importance of non-market based food sharing in Japan [64]. The lack of demographic data in the spatial grids did not allow us to quantify the reference consumption according to age group leading to an overestimation of the consumption in the present study resulting in an underestimation of the actual self-sufficiency. The production from hobby UA is considered to be an overestimation as well; only one study in Japan has been found on the production from hobby UA, and this study was conducted among pioneering hobby UA farms. In addition, nutrient contents in fruits and vegetables vary per season, by year, and according to weather conditions. However, because there was insufficient data available for all the products used in the present study, standard values from the data source were utilized. Furthermore, when a disaster occurs and survivors evacuate to agricultural lands, the productivity of these lands will be affected. At present, there is no data on the potential damage to such lands; therefore, this factor could not be considered in the study.
The present study has applicability to other cities with similar land uses around the world, especially in Asia. For example, Jakarta Metropolitan Area, contains a great number of UA land uses. These regions with mixed land uses have been widely described in literature as Desakota regions [91]. Furthermore, other cities in Asia and the Pacific do not strictly divide their boundary between urban and rural areas. Rather, the development of both urban and rural areas are interrelated [86].
Future research should estimate how many agricultural lands would be required as evacuation spaces in addition to the existing and what impact that may have on the production during an emergency situation. It must also seek deeper understanding of the potential of different land uses in the urban area of Tokyo, and identify additional land uses that are suitable for transformation into agricultural uses. The transformation might be different in each context; therefore, a comparative study would identify opportunities and challenges. Lastly, the social willingness and economic impacts of the transformation should be estimated.
Acknowledgments
The authors would like to acknowledge the Graduate Program in Sustainability Science—Global Leadership Initiative from The University of Tokyo for the platform and resources it provided that allowed for this multidisciplinary research to take place. Furthermore, S.G.B acknowledges the support by The Ministry of Education, Culture, Sports, Science, and Technology from the Japanese Government (Monbukagakusho: MEXT), for its Scholarship program.
Author Contributions
Y.M., T.T. and S.G.B designed the research; T.T. and S.G.B. framed and conducted the spatial component; S.M. and S.G.B. framed and conducted the nutrient research; S.G.B. wrote the manuscript and had primary responsibility over the content; and all authors read and approved the final manuscript.
Conflicts of Interest
The authors declare no conflict of interest. The Graduate Program in Sustainability Science—Global Leadership Initiative and The School of Frontier Sciences, both from The University of Tokyo, provided the software used to conduct this research. The land use planning section of Tokyo Metropolitan Government (application number: 29022) provided the spatial data. The sponsors had no role in the design of the study; in the collection, analyses, or interpretation of data; in the writing of the manuscript; or in the decision to publish the results.
Appendix A
Figure A1.
Yield per square meter of hobby UA in a previous study (n per type = 5) [43].
Figure A1.
Yield per square meter of hobby UA in a previous study (n per type = 5) [43].

References
- United Nations. World Population Prospects 2015—Data Booklet; United Nations: New York City, NY, USA, 2015; p. 20. [Google Scholar]
- United Nations. World Urbanization Prospects 2014; United Nations Department of Economic and Social Affairs: New York City, NY, USA, 2015; p. 493. [Google Scholar]
- UN-Habitat. Planning Sustainable Cities: Global Report on Human Settlements 2009; Global Report; Earthscan: London, UK, 2009; p. 338. [Google Scholar]
- UNEP & CNRD. The Ecosystem-Based Disaster Risk Reduction: Case Study and Exercise Source Book; United Nations Environment Programme and Center for Natural Resources and Development: New York, NY, USA, 2014. [Google Scholar]
- Muramatsu, N.; Akiyama, H. Japan: Super-Aging Society Preparing for the Future. Gerontologist 2011, 51, 425–432. [Google Scholar] [CrossRef] [PubMed]
- De Zeeuw, H.; Van Veenhuizen, R.; Dubbeling, M. The role of urban agriculture in building resilient cities in developing countries. J. Agric. Sci. 2011, 149, 153–163. [Google Scholar] [CrossRef]
- Smit, J.; Nasr, J.; Ratta, A. Urban Agriculture Food, Jobs and Sustainable Cities. In Urban Agriculture Food, Jobs and Sustainable Cities: Cities That Feed Themselves; United Nations Pubns: New York City, NY, USA, 2001; p. 328. [Google Scholar]
- United Nations. New Urban Agenda; United Nations: Quito, Ecuador, 2016; p. 30. [Google Scholar]
- Donkers, H. Local Food for Global Future; Scholars’ Press: Saarbrucken, Germany, 2015; p. 244. [Google Scholar]
- Deelstra, T.; Girardet, H. Urban agriculture and sustainable cities. In Growing Cities, Growing Food. Urban Agriculture on the Policy Agenda; Bakker, N., Dubbeling, M., Gündel, S., Sabel-Koshella, U., de Zeeuw, H., Eds.; Zentralstelle für Ernährung und Landwirtschaft: Feldafing, Germany, 2000; pp. 43–65. [Google Scholar]
- Binns, T.; Lynch, K. Feeding Africa’s growing cities into the 21st Century: The potential of urban agriculture. J. Int. Dev. 1998, 793, 777–793. [Google Scholar] [CrossRef]
- FAO. Food, Agriculture and Cities: Challenges of Food and Nutrition Security, Agriculture and Ecosystem Management in an Urbanizing World. Available online: http://www.fao.org/fileadmin/templates/FCIT/PDF/FoodAgriCities_Oct2011.pdf (accessed on 20 May 2011).
- Orsini, F.; Kahane, R.; Nono-Womdim, R.; Giorgio, G. Urban agriculture in the developing world: A review. Agron. Sustain. Dev. 2013, 33, 695–720. [Google Scholar] [CrossRef]
- Aubry, C.; Kebir, L. Shortening food supply chains: A means for maintaining agriculture close to urban areas? The case of the French metropolitan area of Paris. Food Policy 2013, 41, 85–93. [Google Scholar] [CrossRef]
- Van Veenhuizen, R.; Danso, G. Profitability and Sustainability of Urban and Periurban Agriculture; FAO: Rome, Italy, 2007; p. 95. [Google Scholar]
- Warren, E.; Hawkesworth, S.; Knai, C. Investigating the association between urban agriculture and food security, dietary diversity, and nutritional status: A systematic literature review. Food Policy 2015, 53, 54–66. [Google Scholar] [CrossRef]
- Mogk, J.E.; Kwiatkowski, S.K.; Weindorf, M.J. Promoting urban agriculture as an alternative land use for vacant properties in the city of Detroit: Benefits, problems and proposals for a regulatory framework for successful land use integration. Wayne Law Rev. 2011, 56, 1521. [Google Scholar]
- Morgan, K. Nourishing the city: The rise of the urban food question in the Global North. Urban Stud. 2015, 52, 1379–1394. [Google Scholar] [CrossRef]
- Sundermann, L.; Schelske, O.; Hausmann, P. Mind the Risk A Global Ranking of Cities under Threat from Natural Disasters; Reichenmiller, P., Feh, K., Eds.; Swiss Re: Zurich, Switzerland, 2014; p. 13. [Google Scholar]
- UN-Habitat. Urbanization and Development: Emerging Futures; United Nations Human Settlements Programme (UN-Habitat): Nairobi, Kenya, 2016; p. 262. [Google Scholar]
- Komatsu, H.; Kitazawa, T. Problems and Prospects of Disaster Prevention Agreement Agricultural Land in Tokyo. Kogakuin Univ. Res. Rep. Kogakuin Univ. 2010, 108, 105–112. [Google Scholar]
- FAO. Adapting to An Urban World Urban Case Study: Port au Prince Adapting to an Urban World Port au Prince Case Study. Available online: https://reliefweb.int/sites/reliefweb.int/files/resources/adapting_to_an_urban_world_port_au_prince_report_en.pdf (accessed on 20 January 2018).
- Sioen, G.B.; Sekiyama, M.; Terada, T.; Yokohari, M. Post-Disaster Food and Nutrition from Urban Agriculture: A Self-Sufficiency Analysis of Nerima. Int. J. Environ. Res. Public Health 2017, 14, 748. [Google Scholar] [CrossRef] [PubMed]
- The World Bank. Promoting Nutrition Security in Haiti: An Assessment of Pre- and Post-Earthquake Conditions for the Way Forward; The World Bank: Washington, DC, USA, 2010; p. 74. [Google Scholar]
- Amagai, T.; Ichimaru, S.; Tai, M.; Ejiri, Y.; Muto, A. Nutrition in the Great East Japan Earthquake Disaster. Nutr. Clin. Pract. 2014, 29, 585–594. [Google Scholar] [CrossRef] [PubMed]
- Slavin, J.L.; Lloyd, B. Health benefits of fruits and vegetables. Adv. Nutr. 2012, 3, 506–516. [Google Scholar] [CrossRef] [PubMed]
- UNICEF. Nepal Earthquake Humanitarian Situation Report: Three Months Review; UNICEF Nepal Country Office: Kathmandu, Nepal, 2015; p. 15. [Google Scholar]
- Hendrickson, D.; Smith, C.; Eikenberry, N. Fruit and vegetable access in four low-income food deserts communities in Minnesota. Agric. Hum. Values 2006, 23, 371–383. [Google Scholar] [CrossRef]
- Beaulac, J.; Kristjansson, E.; Cummins, S. A systematic review of food deserts. Prev. Chronic Dis. 2009, 6, A105. [Google Scholar] [PubMed]
- Wilkins, J.L.; Farrell, T.J.; Rangarajan, A. Linking vegetable preferences, health and local food systems through community-supported agriculture. Public Health Nutr. 2015, 18, 2392–2401. [Google Scholar] [CrossRef] [PubMed]
- Ruggeri, G.; Mazzocchi, C.; Corsi, S. Urban Gardeners’ Motivations in a Metropolitan City: The Case of Milan. Sustainability 2016, 8, 1099. [Google Scholar] [CrossRef]
- Van den Berg, A.E.; van Winsum-Westra, M.; de Vries, S.; van Dillen, S.M.E. Allotment gardening and health: A comparative survey among allotment gardeners and their neighbors without an allotment. Environ. Health 2010, 9, 74. [Google Scholar] [CrossRef] [PubMed]
- Inoue, T.; Nakao, A.; Kuboyama, K.; Hashimoto, A.; Masutani, M.; Ueda, T.; Kotani, J. Gastrointestinal symptoms and food/nutrition concerns after the great East Japan earthquake in March 2011: Survey of evacuees in a temporary shelter. Prehosp. Disaster Med. 2014, 29, 303–306. [Google Scholar] [CrossRef] [PubMed]
- Duany, A.; Robert, D.; Elizabet, P.-Z. Garden Cities: Theory & Practice of Agrarian Urbanism; Duany Plater Zybrek & Company: Miami, FL, USA, 2012; p. 85. [Google Scholar]
- Grewal, S.S.; Grewal, P.S. Can cities become self-reliant in food? Cities 2011, 29, 1–11. [Google Scholar] [CrossRef]
- Kim, K.; Burnett, K.; Ghimire, J. Assessing the potential for food and energy self-sufficiency on the island of Kauai, Hawaii. Food Policy 2015, 54, 44–51. [Google Scholar] [CrossRef]
- Sioen, G.B.; Terada, T.; Yokohari, M. Neighborhood self-sufficiency in Tokyo: How much can hobby farms contribute? In Growing in Cities; Tappert, S., Ed.; University of Applied Sciences: Basel, Switzerland, 2016; pp. 440–453. [Google Scholar]
- Statistics Bureau of Japan Ministry of Internal Affairs and Communications. Statistical Handbook of Japan 2016; Statistics Bureau of Japan Ministry of Internal Affairs and Communications: Tokyo, Japan, 2016; p. 197.
- Tokyo Metropolitan Government. Tokyo Metropolitan Government Disaster Prevention Guide Book; Tokyo Metropolitan Government: Tokyo, Japan, 2016; p. 60.
- Ishikawa, E. Japan in the Edo Period—An Ecologically-Conscious Society [O-edo Ecology jijo]; Kodansha Publishing Company: Tokyo, Japan, 2000. [Google Scholar]
- Brown, S.A. Just Enough: Lessons in Living Green from Traditional Japan; Kodansha International: Tokyo, Japan, 2009; p. 231. [Google Scholar]
- Tokyo Metropolitan Government. Land Use Data, Tokyo 2015; Tokyo Metropolitan Government: Tokyo, Japan, 2016.
- Tahara, S.; Shioyama, S.; Kurita, H.; Terada, T. A quantitative assessment of agricultural production from allotment gardens. J. Jpn. Inst. Landsc. Archit. 2011, 74, 685–688. [Google Scholar] [CrossRef]
- McClintock, N.; Cooper, J.; Khandeshi, S. Assessing the potential contribution of vacant land to urban vegetable production and consumption in Oakland, California. Landsc. Urban Plan. 2013, 111, 46–58. [Google Scholar] [CrossRef]
- Yamada, C.; Terada, T.; Tanaka, T.; Yokohari, M. Directions for Vacant Lot Management in the Outer Suburbs of the Tokyo Metropolitan Region. Urban Reg. Plan. Rev. 2016, 3, 66–84. [Google Scholar] [CrossRef]
- Shiraishi, B.M. The Preservation and Use of Scarce Agricultural Land in Suburban Areas; NLI Research Institute: Tokyo, Japan, 2001; pp. 18–27. [Google Scholar]
- MacNair, E. The Garden City Handbook: How to Create and Protect Community Gardens in Greater Victoria; University of Victoria: Victoria, BC, Canada, 2002; p. 28. [Google Scholar]
- Tsubota, K. Urban Agriculture in Asia: Lessons from Japanese Experience; Food and Fertilizer Technology Center: Taipei, Taiwan, 2007; p. 18. [Google Scholar]
- Shiraishi, Y. Tokai No Hyagusho Desu [I’m an Urban Farmer]; Commons: Tokyo, Japan, 2001; p. 217. (In Japanese) [Google Scholar]
- Hara, Y.; Murakami, A.; Tsuchiya, K.; Palijon, A.M.; Yokohari, M. A quantitative assessment of vegetable farming on vacant lots in an urban fringe area in Metro Manila: Can it sustain long-term local vegetable demand? Appl. Geogr. 2013, 41, 195–206. [Google Scholar] [CrossRef]
- Haberman, D.; Gillies, L.; Canter, A.; Rinner, V.; Pancrazi, L.; Martellozzo, F. The Potential of Urban Agriculture in Montréal: A Quantitative Assessment. ISPRS Int. J. Geo-Inf. 2014, 3, 1101–1117. [Google Scholar] [CrossRef] [Green Version]
- Tsubota, K. Food Security: The Dilemma of High Income Food Importing Countries in East Asia; Kyushu University Asia Center: Fukuoka, Japan, 2009; pp. 151–160. [Google Scholar]
- Okata, J.; Murayama, A. Megacities: Urban form, governance and sustainability. In Urban Morphology; Sorensen, A., Okata, J., Eds.; Springer: Tokyo, Japan, 2011; Volume 15, pp. 15–41. [Google Scholar]
- Ministry of Health Labour and Welfare of Japan Health Japan 21 (The Second Term): Analysis and Assessment Project. List of Target. Available online: http://www.mhlw.go.jp/seisakunitsuite/bunya/kenkou_iryou/kenkou/kenkounippon21/en/kenkounippon21/mokuhyou05.html (accessed on 1 February 2017).
- World Health Organization. Fruit and Vegetable Promotion Initiative: A Meeting Report; World Health Organization: Geneva, Switzerland, 2003; p. 29. [Google Scholar]
- Ministry of Health Labour and Welfare of Japan. Overview of Dietary Reference Intakes for Japanese (2015); Ministry of Health Labour and Welfare: Kasumigaseki, Japan, 2015; Volume 21, p. 42.
- Tokyo Metropolitan Government. Tokyo Metropolitan Agricultural Products Production Survey Results; TMG: Tokyo, Japan, 2015; p. 94.
- Kagawa, Y. Nanatei shokuhin seibun hyou [Tables of Food Composition], 7th ed.; Kagawa, Y., Ed.; Kagawa Nutrition University Publishing Division: Sakado, Japan, 2016; p. 984. (In Japanese) [Google Scholar]
- Ministry of Health Labour and Welfare of Japan. Outline of National Health and Nutrition Survey 2014; Ministry of Health Labour and Welfare: Kasumigaseki, Japan, 2015; p. 43.
- ESRI. World Satellite Imagery of Tokyo, Japan (May 2017). Available online: https://www.arcgis.com/home/item.html?id=10df2279f9684e4a9f6a7f08febac2a9 (accessed on 5 June 2017).
- Sorensen, A. Land readjustment and metropolitan growth: An examination of suburban land development and urban sprawl in the Tokyo metropolitan area. Prog. Plan. 2000, 53, 217–330. [Google Scholar] [CrossRef]
- Mumford, E. The CIAM Discourse on Urbanism, 1928–1960; MIT Press: Cambridge, MA; London, UK, 2002; p. 375. [Google Scholar]
- Ducom, E. Tama New Town, West of Tokyo: Analysis of a Shrinking Suburb. Landsc. Urban Plan. 2008, 2, 35. [Google Scholar]
- Kamiyama, C.; Hashimoto, S.; Kohsaka, R.; Saito, O. Non-market food provisioning services via homegardens and communal sharing in satoyama socio-ecological production landscapes on Japan’s Noto peninsula. Ecosyst. Serv. 2016, 17, 185–196. [Google Scholar] [CrossRef]
- Sadler, M. Nutritional properties of edible fungi. Nutr. Bull. 2003, 28, 305–308. [Google Scholar] [CrossRef]
- Ros, E. Health benefits of nut consumption. Nutrients 2010, 2, 652–682. [Google Scholar] [CrossRef] [PubMed]
- Tokyo Metropolitan Government. The Seventh Community Earthquake Risk Assessment Study: Your Community’s Earthquake Risk; Tokyo Metropolitan Government: Shinjuku, Tokyo, Japan, 2013; p. 24.
- Carey, J.; Hochberg, K. The Role of Private Sector in the Bristol (UK) City Region Food System; Joy Carey Sustainable Food Systems Planning and RUAF Foundation: Bristol, UK, 2016; p. 59. [Google Scholar]
- Dubbeling, M.; Carey, J.; Hochberg, K. The Role of Private Sector in City Region Food Systems; Analysis Report; RUAF Foundation: Leusden, The Netherlands, 2016; p. 121. [Google Scholar]
- Ellis, F.; Sumberg, J. Food production, urban areas and policy responses. World Dev. 1998, 26, 213–225. [Google Scholar] [CrossRef]
- Colding, J.; Barthel, S. The potential of “Urban Green Commons” in the resilience building of cities. Ecol. Econ. 2013, 86, 156–166. [Google Scholar] [CrossRef]
- Elmqvist, T.; Setälä, H.; Handel, S.; van der Ploeg, S.; Aronson, J.; Blignaut, J.; Gómez-Baggethun, E.; Nowak, D.; Kronenberg, J.; de Groot, R. Benefits of restoring ecosystem services in urban areas. Curr. Opin. Environ. Sustain. 2015, 14, 101–108. [Google Scholar] [CrossRef] [Green Version]
- UN-Habitat. Urban Resilience; United Nations Human Settlement Programme: Nairobi, Kenya, 2017; p. 172. [Google Scholar]
- Brown, K.H.; Jameton, A.L. Public Health Implications of Urban Agriculture. J. Public Health Policy 2000, 21, 20–39. [Google Scholar] [CrossRef] [PubMed]
- Gerster-Bentaya, M. Nutrition-sensitive urban agriculture. Food Secur. 2013, 5, 723–737. [Google Scholar] [CrossRef]
- Holloway, L.; Cox, R.; Venn, L.; Kneafsey, M.; Dowler, E.; Tuomainen, H. Managing sustainable farmed landscape through “alternative” food networks: A case study from Italy. Geogr. J. 2006, 172, 219–229. [Google Scholar] [CrossRef]
- Shaw, R.; Kobayashi, K.S.H.; Kobayashi, M. Linking experience, education, perception and earthquake preparedness. Disaster Prev. Manag. 2004, 13, 39–49. [Google Scholar] [CrossRef]
- Rydin, Y.; Bleahu, A.; Davies, M.; Davila, J.D.; Friel, S.; di Grandis, G.; Groce, N.; Hallal, P.C.; Hamilton, I.G.; Howden-Chapman, P.; et al. Shaping Cities for Health: The complexities of planning urban environments in the 21st century. Lancet 2012, 379, 2079–2108. [Google Scholar] [CrossRef]
- Olsson, E.; Kerselaers, E.; Søderkvist Kristensen, L.; Primdahl, J.; Rogge, E.; Wästfelt, A. Peri-Urban Food Production and Its Relation to Urban Resilience. Sustainability 2016, 8, 1340. [Google Scholar] [CrossRef]
- Yokohari, M.; Amati, M. Nature in the city, city in the nature: Case studies of the restoration of urban nature in Tokyo, Japan and Toronto, Canada. Landsc. Ecol. Eng. 2005, 1, 53–59. [Google Scholar] [CrossRef]
- Viljoen, A.; Bohn, K. Continuous Productive Urban Landscape (CPUL): Essential infrastructure and edible ornament. Open House Int. 2009, 34, 50–60. [Google Scholar]
- Viljoen, A.; Bohn, K.; Howe, J. Continuous Productive Urban Landscapes: Designing Urban Agriculture for Sustainable Cities; Architectural Press: New York City, NY, USA, 2005; p. 319. [Google Scholar]
- Viljoen, A.; Howe, J. Continuous Productive Urban Landscapes; Routledge: Oxford, UK, 2012; p. 280. [Google Scholar]
- Cassidy, A.; Bowen, P. Bridging food and planning. In Urban Food Planning: Seeds of Transition in the Global North; Ilieva, R.T., Ed.; Routledge Studies in Food, Society and the Environment; Taylor & Francis: Oxford, UK, 2016; pp. 71–95. [Google Scholar]
- Pothukuchi, K.; Kaufman, J.L. The food system—A stranger to the planning field. J. Am. Plan. Assoc. 2000, 66, 113–124. [Google Scholar] [CrossRef]
- UN-Habitat; ESCAP. The State of Asian and Pacific Cities 2015. Urban Transformations Shifting from Quantity to Quality; UN-Habitat: Nairobi, Kenya, 2015; p. 204. [Google Scholar]
- Monaco, F.; Zasada, I.; Wascher, D.; Glavan, M.; Pintar, M.; Schmutz, U.; Mazzocchi, C.; Corsi, S.; Sali, G. Food Production and Consumption: City Regions between Localism, Agricultural Land Displacement, and Economic Competitiveness. Sustainability 2017, 9, 96. [Google Scholar] [CrossRef]
- Morgan, K. Feeding the City: The Challenge of Urban Food Planning. Int. Plan. Stud. 2009, 14, 341–348. [Google Scholar] [CrossRef]
- Nerima Ward. Appealing Urban Agriculture in Our Community: Agriculture in Nerima; Nishinaka, K., Ed.; KINSEISHA Co., Ltd.: Nerima, Tokyo, Japan, 2010; p. 40. [Google Scholar]
- Yagasaki, N.; Nakamura, Y. Protection of Urban Farming and Farmland in Tokyo. In Local Environmental Movements: A Comparative Study of the United States & Japan; Pradyumna, P.K., Unryu, S., Eds.; The University Press of Kentucky: Tokyo, Japan, 2008; pp. 131–144. [Google Scholar]
- McGee, T.G. The Emergence of Desakota Regions in Asia: Expanding a Hypothesis; University of Hawaii Press: Honolulu, HI, USA, 1999; pp. 3–25. [Google Scholar]
Figure 1.
Identification of current and potential UA land uses in Tokyo. White dashed lines with names are the areas and black dotted lines with text are key local administrative areas referred to in this manuscript. Data source base map: administrative map of Tokyo’s municipalities and land use data [42].

Figure 2.
Identification of current (professional and hobby) and potential (stable vacant land) UA land uses in Tokyo and boundary of 23 special wards highlighted with a thick line (the latter is applied in each figure hereafter). Data source base map: administrative map of Tokyo’s municipalities and land use data [42].

Figure 3.
Land use classification with 1 × 1 km grid structure within the administrative area of Tokyo. Data source base map: administrative map of Tokyo’s municipalities and land use data [42].
Figure 3.
Land use classification with 1 × 1 km grid structure within the administrative area of Tokyo. Data source base map: administrative map of Tokyo’s municipalities and land use data [42].

Figure 4.
Reference consumption of fruit and vegetables within each 1 × 1 km grid cell of Tokyo. Data source base map: administrative map of Tokyo’s municipalities and land use data [36].
Figure 4.
Reference consumption of fruit and vegetables within each 1 × 1 km grid cell of Tokyo. Data source base map: administrative map of Tokyo’s municipalities and land use data [36].

Figure 5.
Current fruit and vegetable production within each 1 × 1 km grid cell of Tokyo. Data source base map: administrative map of Tokyo’s municipalities and land use data [36].
Figure 5.
Current fruit and vegetable production within each 1 × 1 km grid cell of Tokyo. Data source base map: administrative map of Tokyo’s municipalities and land use data [36].

Figure 6.
Potential fruit and vegetable production within each 1 × 1 km grid cell of Tokyo. Data source base map: administrative map of Tokyo’s municipalities and land use data [36].
Figure 6.
Potential fruit and vegetable production within each 1 × 1 km grid cell of Tokyo. Data source base map: administrative map of Tokyo’s municipalities and land use data [36].

Figure 7.
Box-plot of current and potential fruit and vegetable self-sufficiency within each land use pattern in Tokyo.
Figure 7.
Box-plot of current and potential fruit and vegetable self-sufficiency within each land use pattern in Tokyo.

Figure 8.
Current fruit and vegetable self-sufficiency within each 1 × 1 km grid cell of Tokyo from types A–D. Data source base map: administrative map of Tokyo’s municipalities and land use data [36].
Figure 8.
Current fruit and vegetable self-sufficiency within each 1 × 1 km grid cell of Tokyo from types A–D. Data source base map: administrative map of Tokyo’s municipalities and land use data [36].

Figure 9.
Potential fruit and vegetable self-sufficiency within 1 × 1 km grid cell of Tokyo from types A–D. Data source base map: administrative map of Tokyo’s municipalities and land use data [36].
Figure 9.
Potential fruit and vegetable self-sufficiency within 1 × 1 km grid cell of Tokyo from types A–D. Data source base map: administrative map of Tokyo’s municipalities and land use data [36].

Figure 10.
Box-plot of current fruit and vegetable nutritional self-sufficiency within each land use category in Tokyo.
Figure 10.
Box-plot of current fruit and vegetable nutritional self-sufficiency within each land use category in Tokyo.

Figure 11.
Box-plot of potential fruit and vegetable nutritional self-sufficiency within each land use category in Tokyo.
Figure 11.
Box-plot of potential fruit and vegetable nutritional self-sufficiency within each land use category in Tokyo.

Figure 12.
Selection of representative grid cells for each urban land use category of Tokyo. Data source base map: administrative map of Tokyo’s municipalities and land use data [36].
Figure 12.
Selection of representative grid cells for each urban land use category of Tokyo. Data source base map: administrative map of Tokyo’s municipalities and land use data [36].

Figure 13.
Selection of grid cells for each urban land use category of Tokyo. Data source base map: administrative map of Tokyo’s municipalities and land use data [42,60].

Figure 14.
Aggregated risk assessment of Tokyo. Data source base map: Administrative map of Tokyo’s municipalities (TMG, 2016a), adapted and modified from [67].
Figure 14.
Aggregated risk assessment of Tokyo. Data source base map: Administrative map of Tokyo’s municipalities (TMG, 2016a), adapted and modified from [67].

Figure 15.
Conceptual visualization where UA contributes according to the consumption and production in mixed land uses. (a) Concept drawing by authors; and (b) satellite imagery of Nerima ward’s land use mixture. Source: Google Earth image, 10 February 2016. (c) Experience farm in Nerima ward (By authors November 2016).


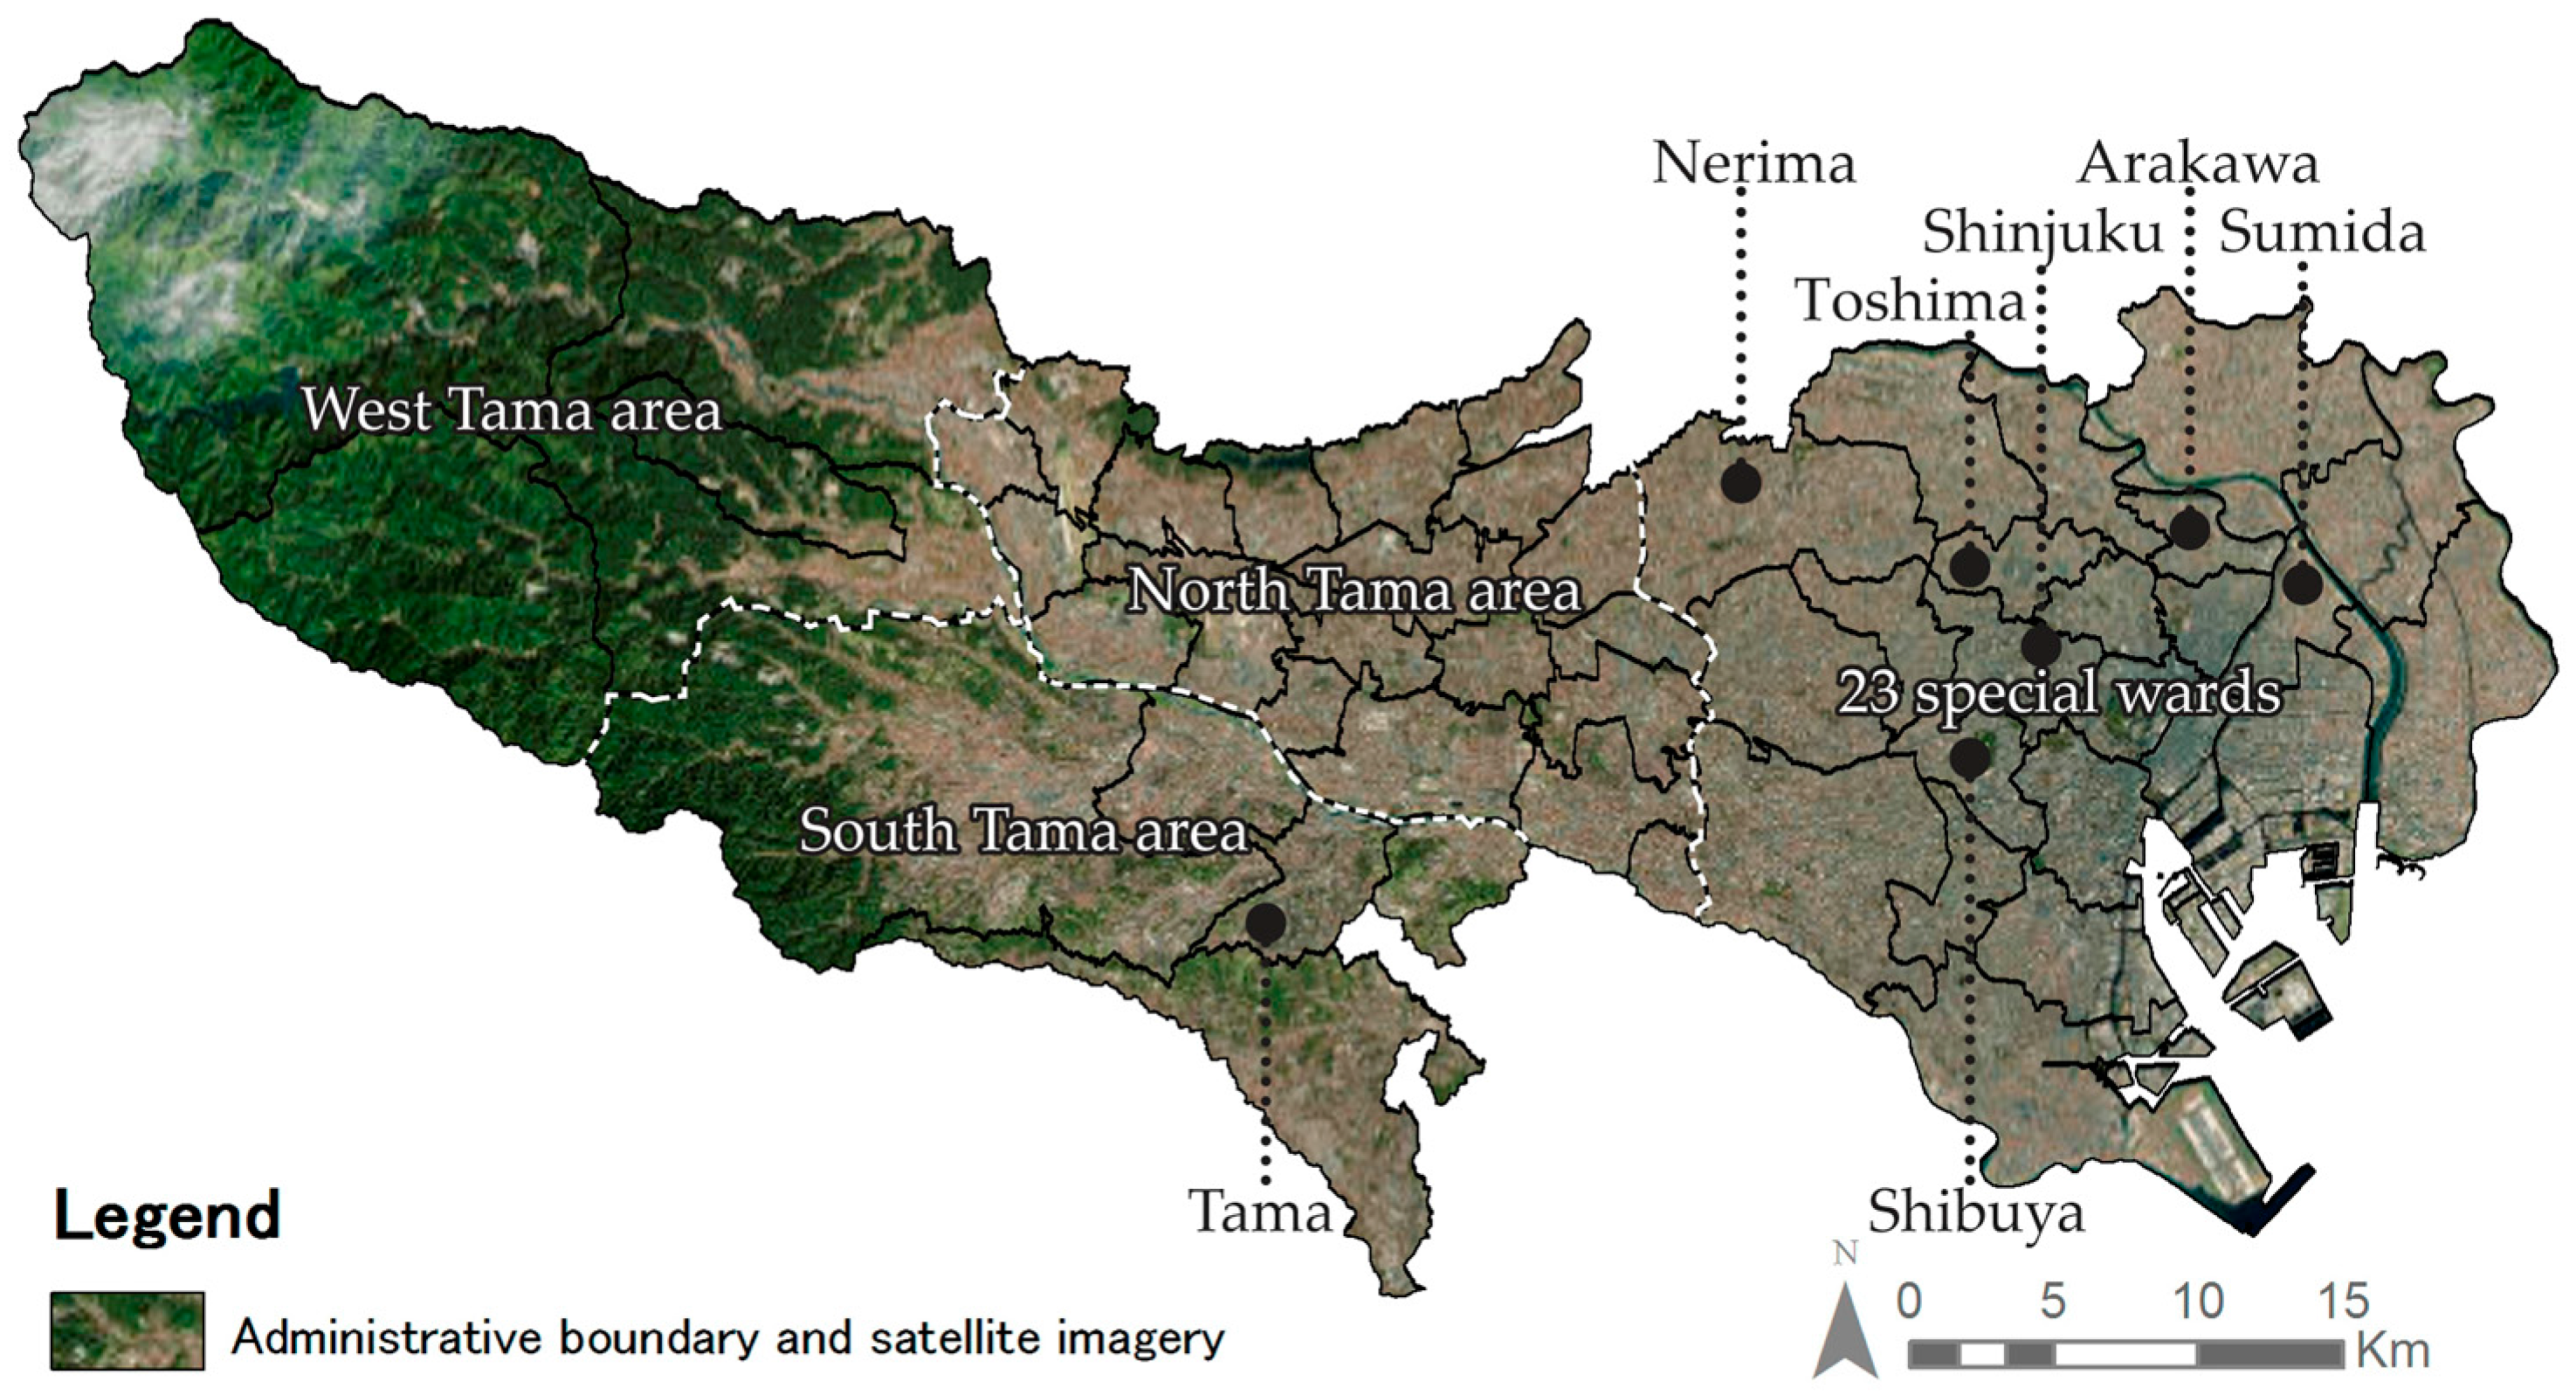
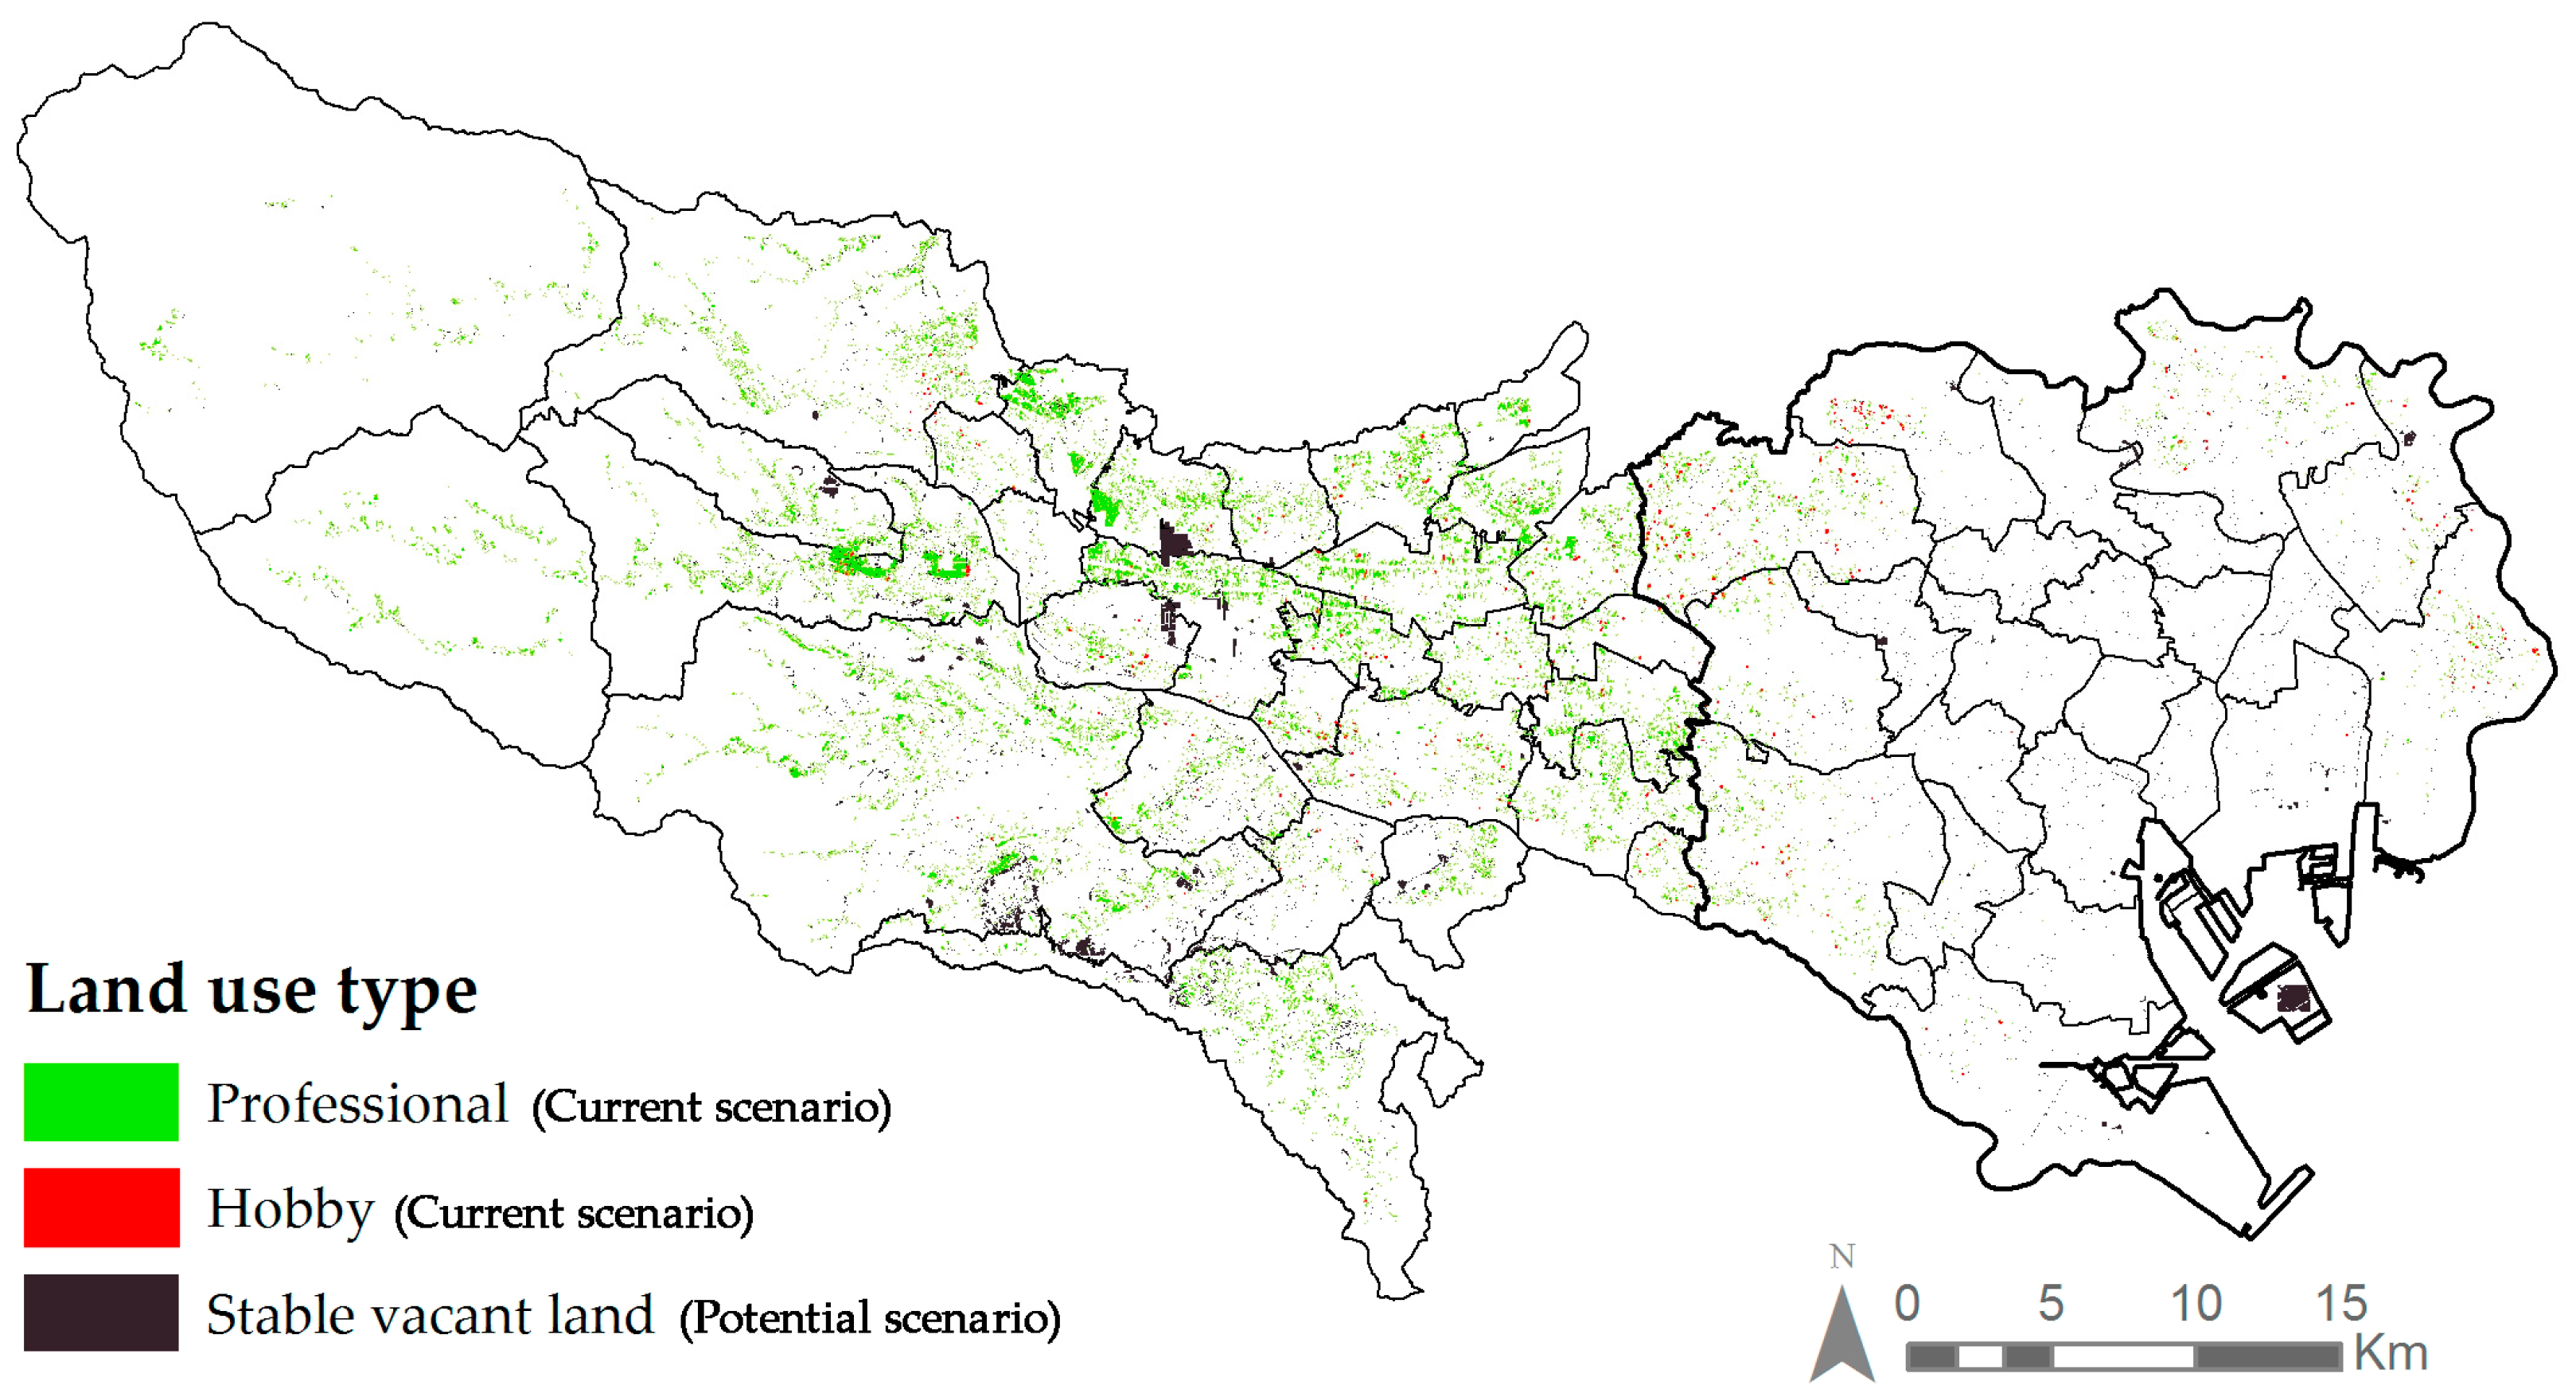
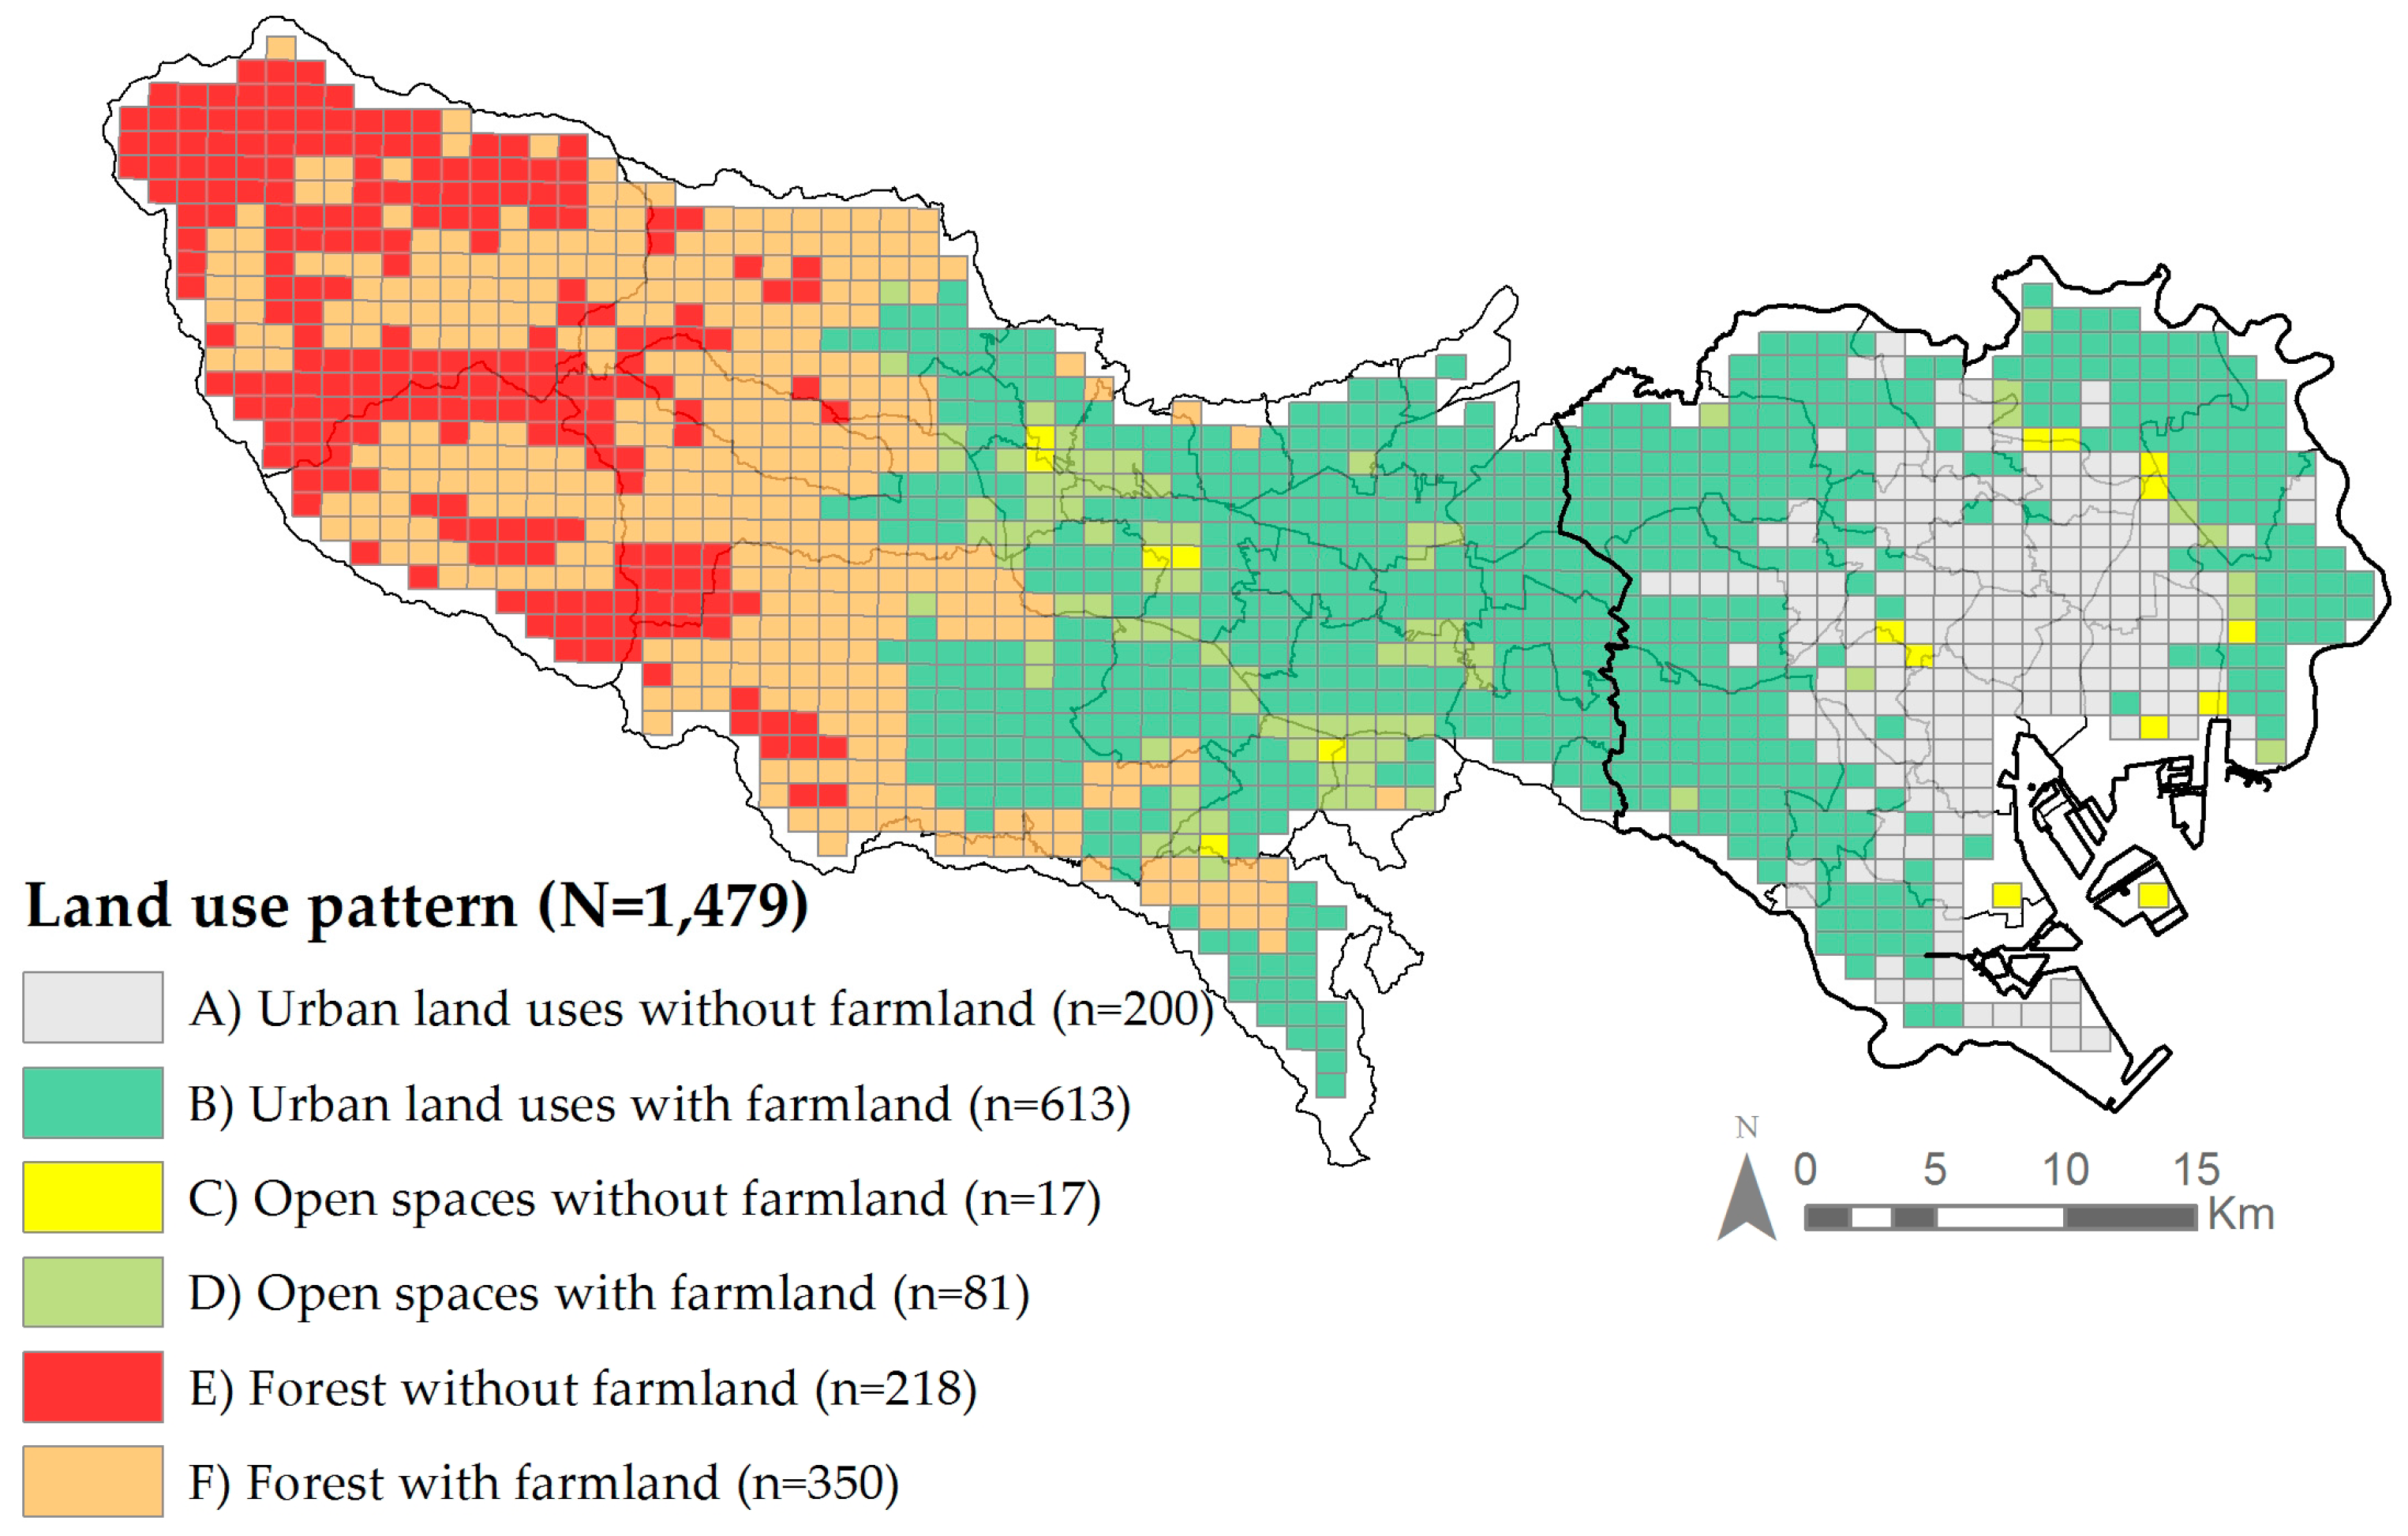
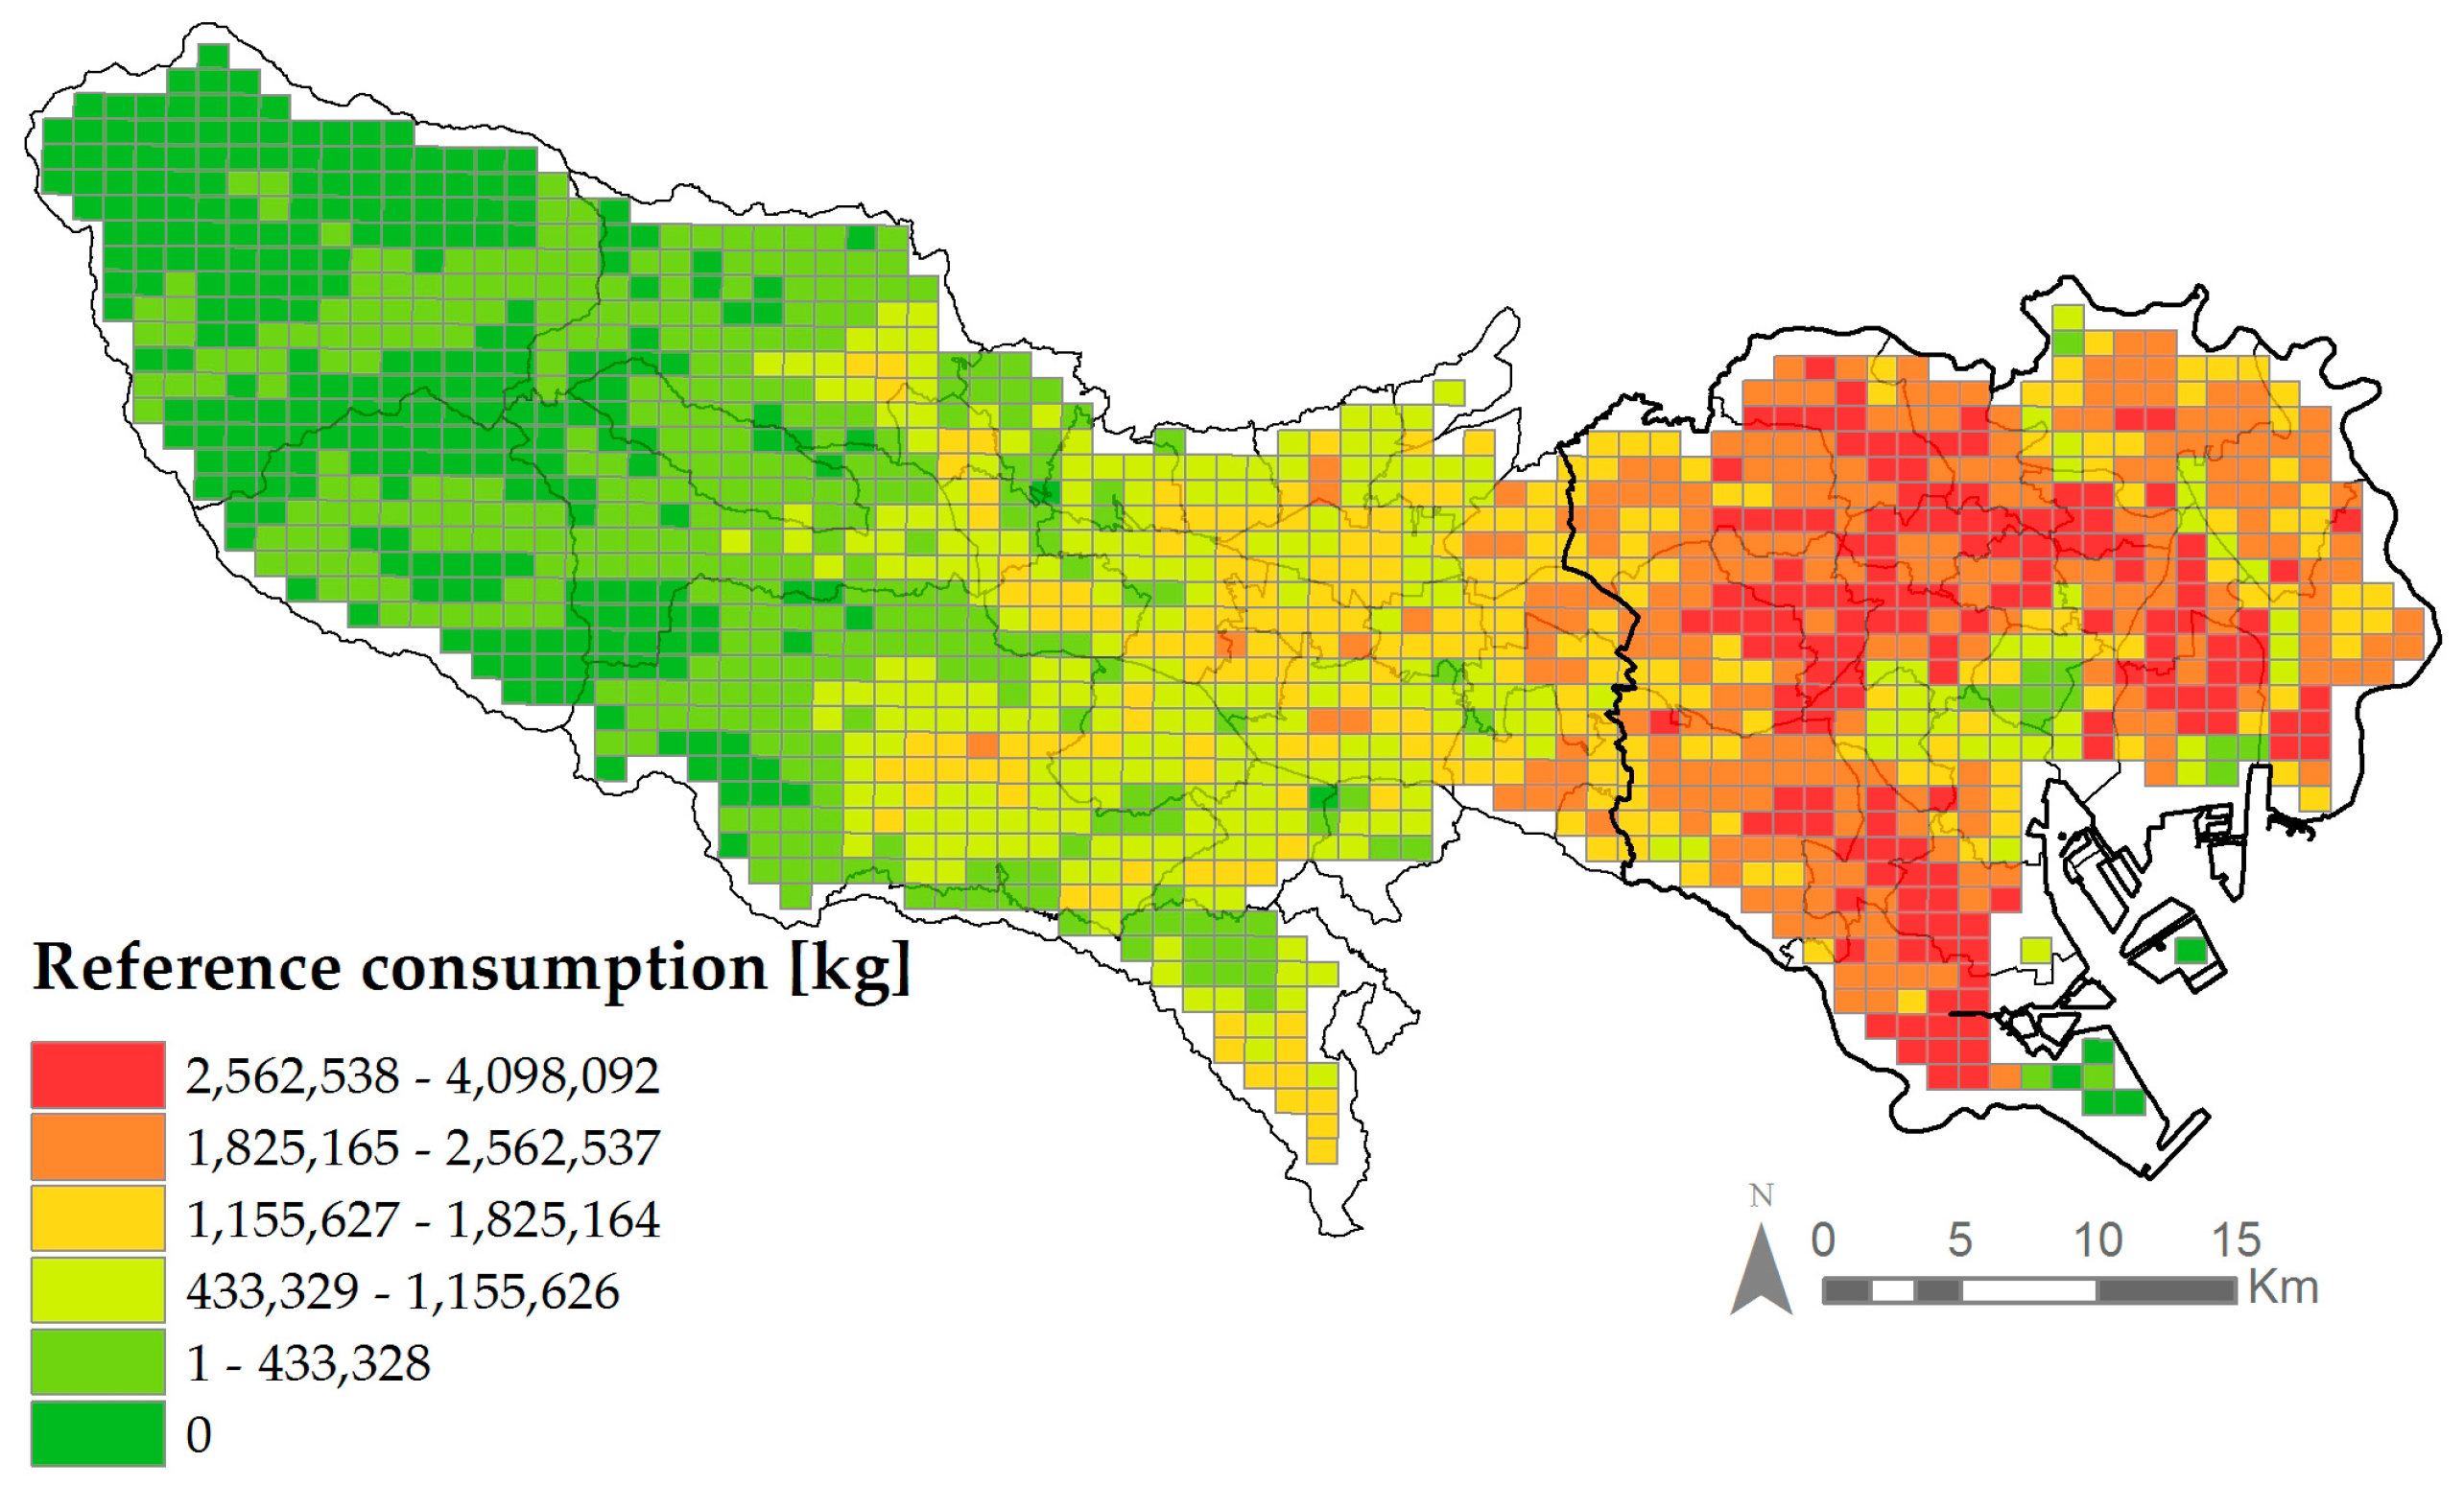
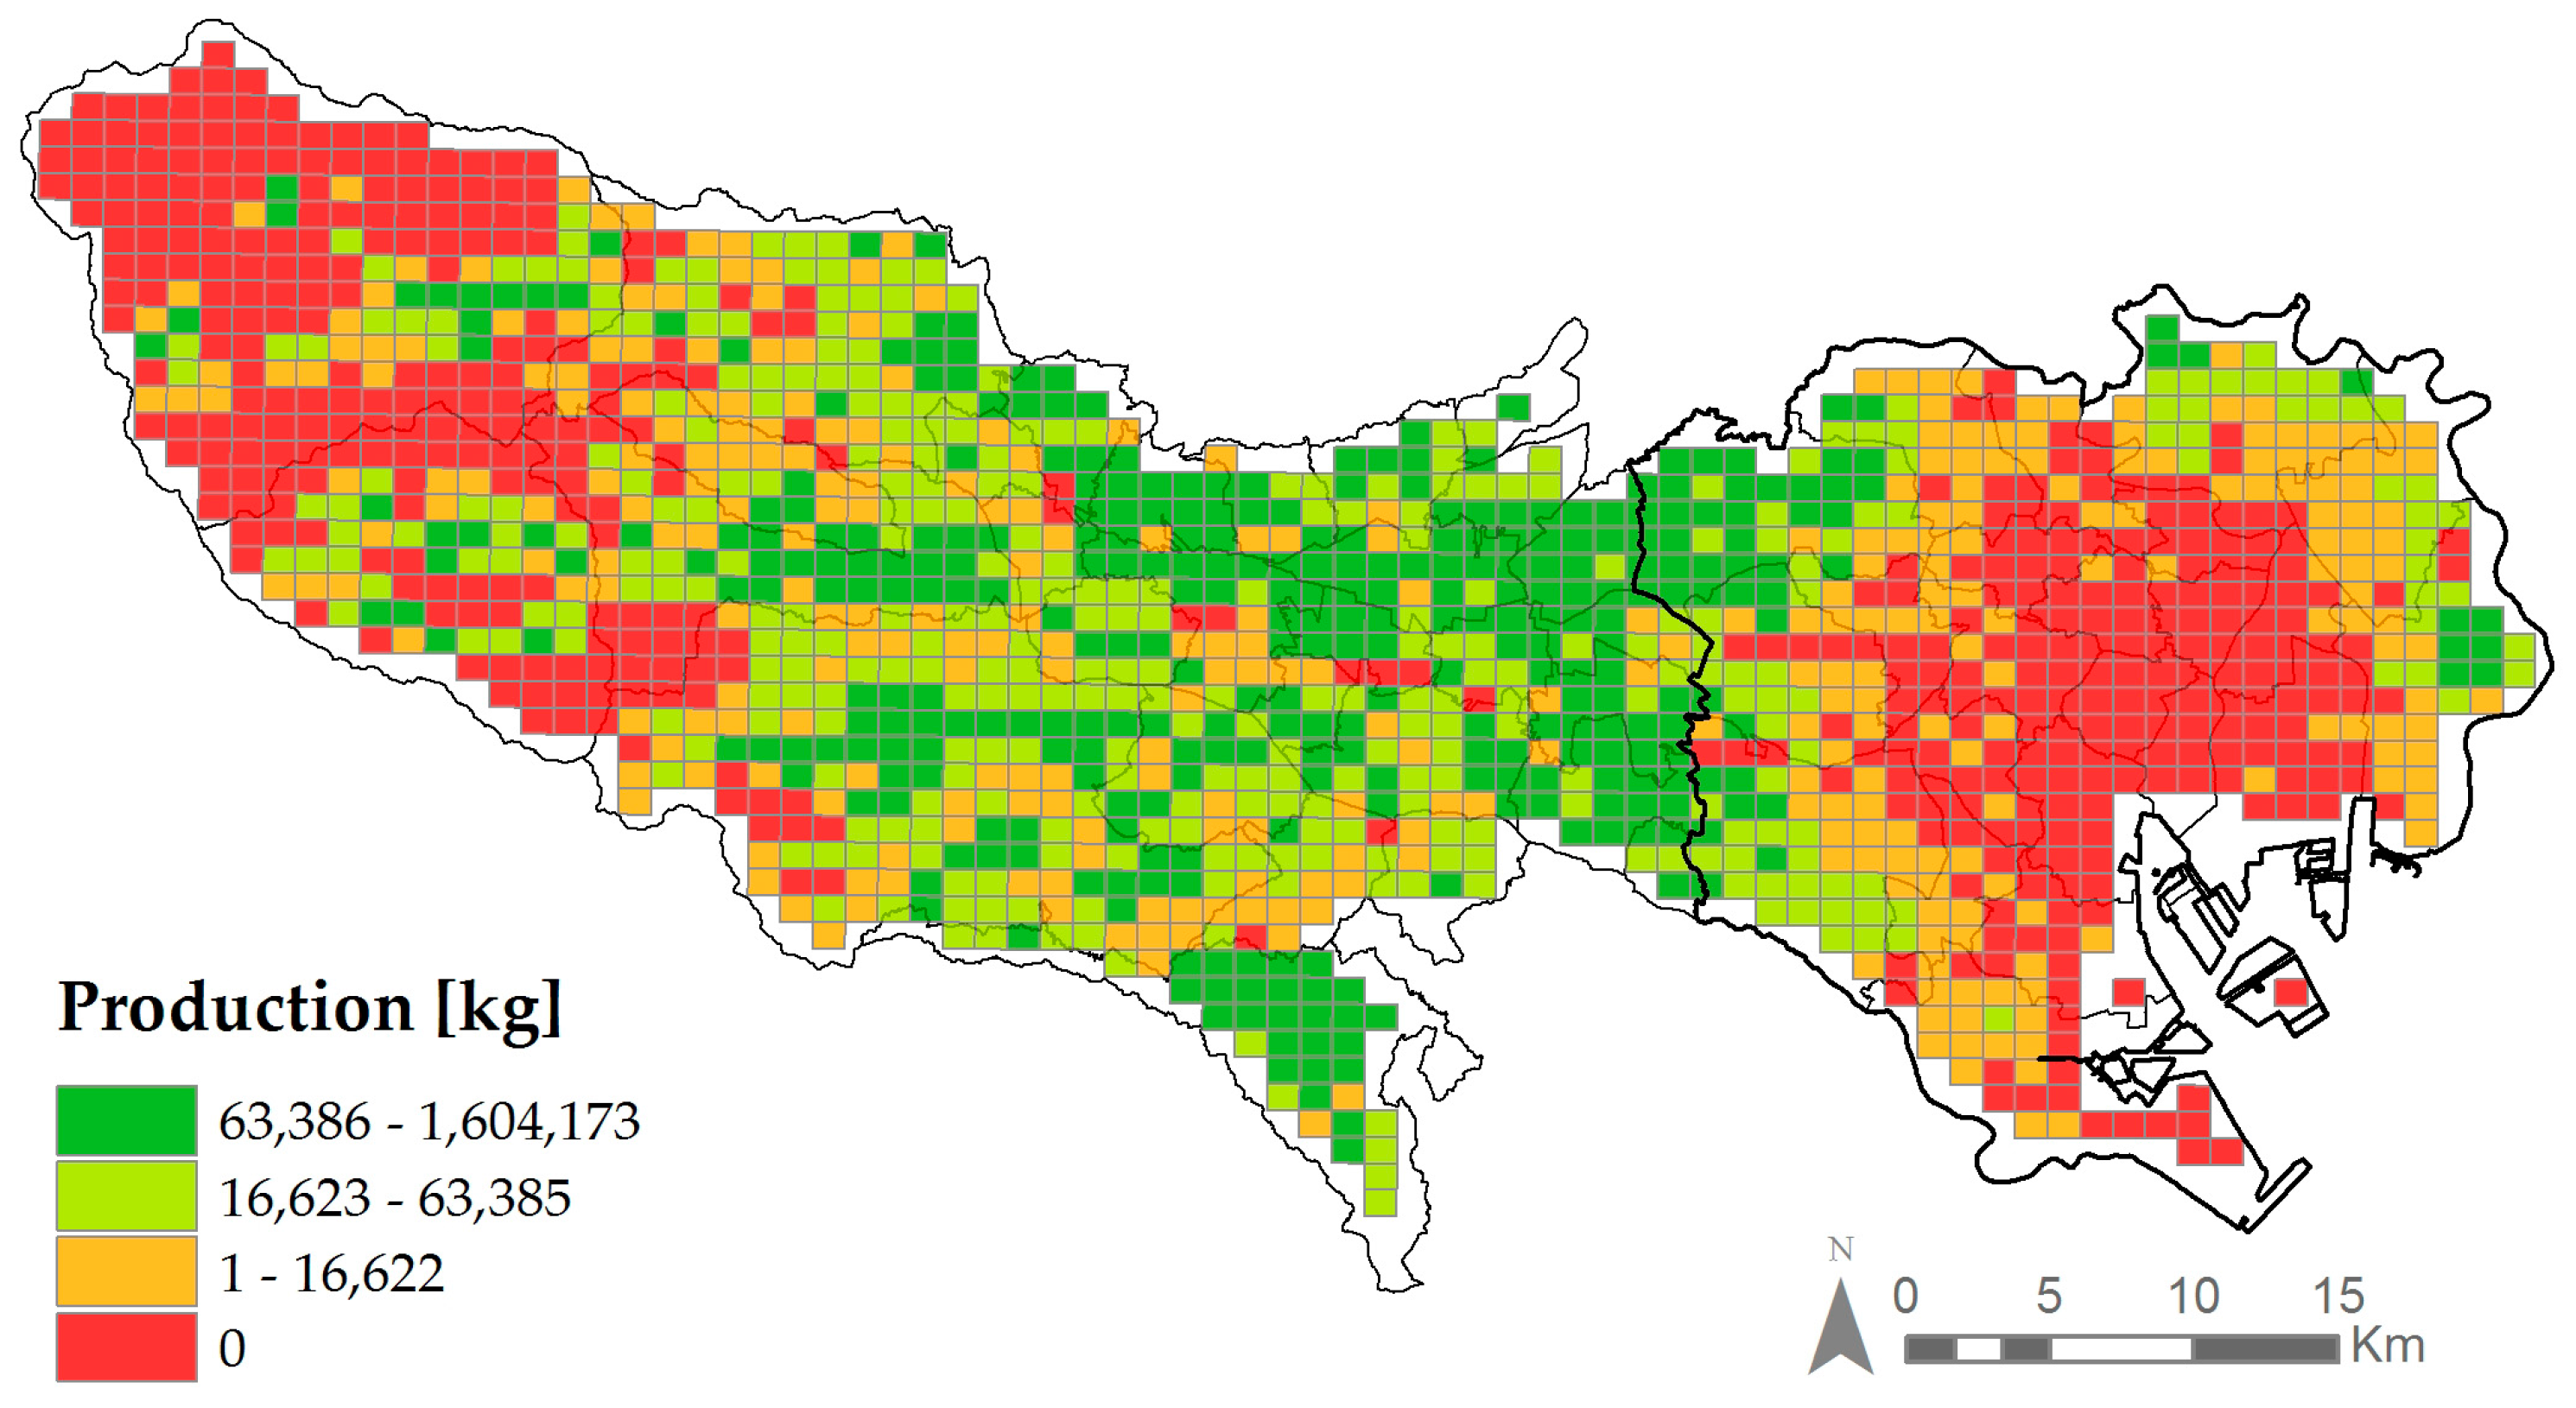
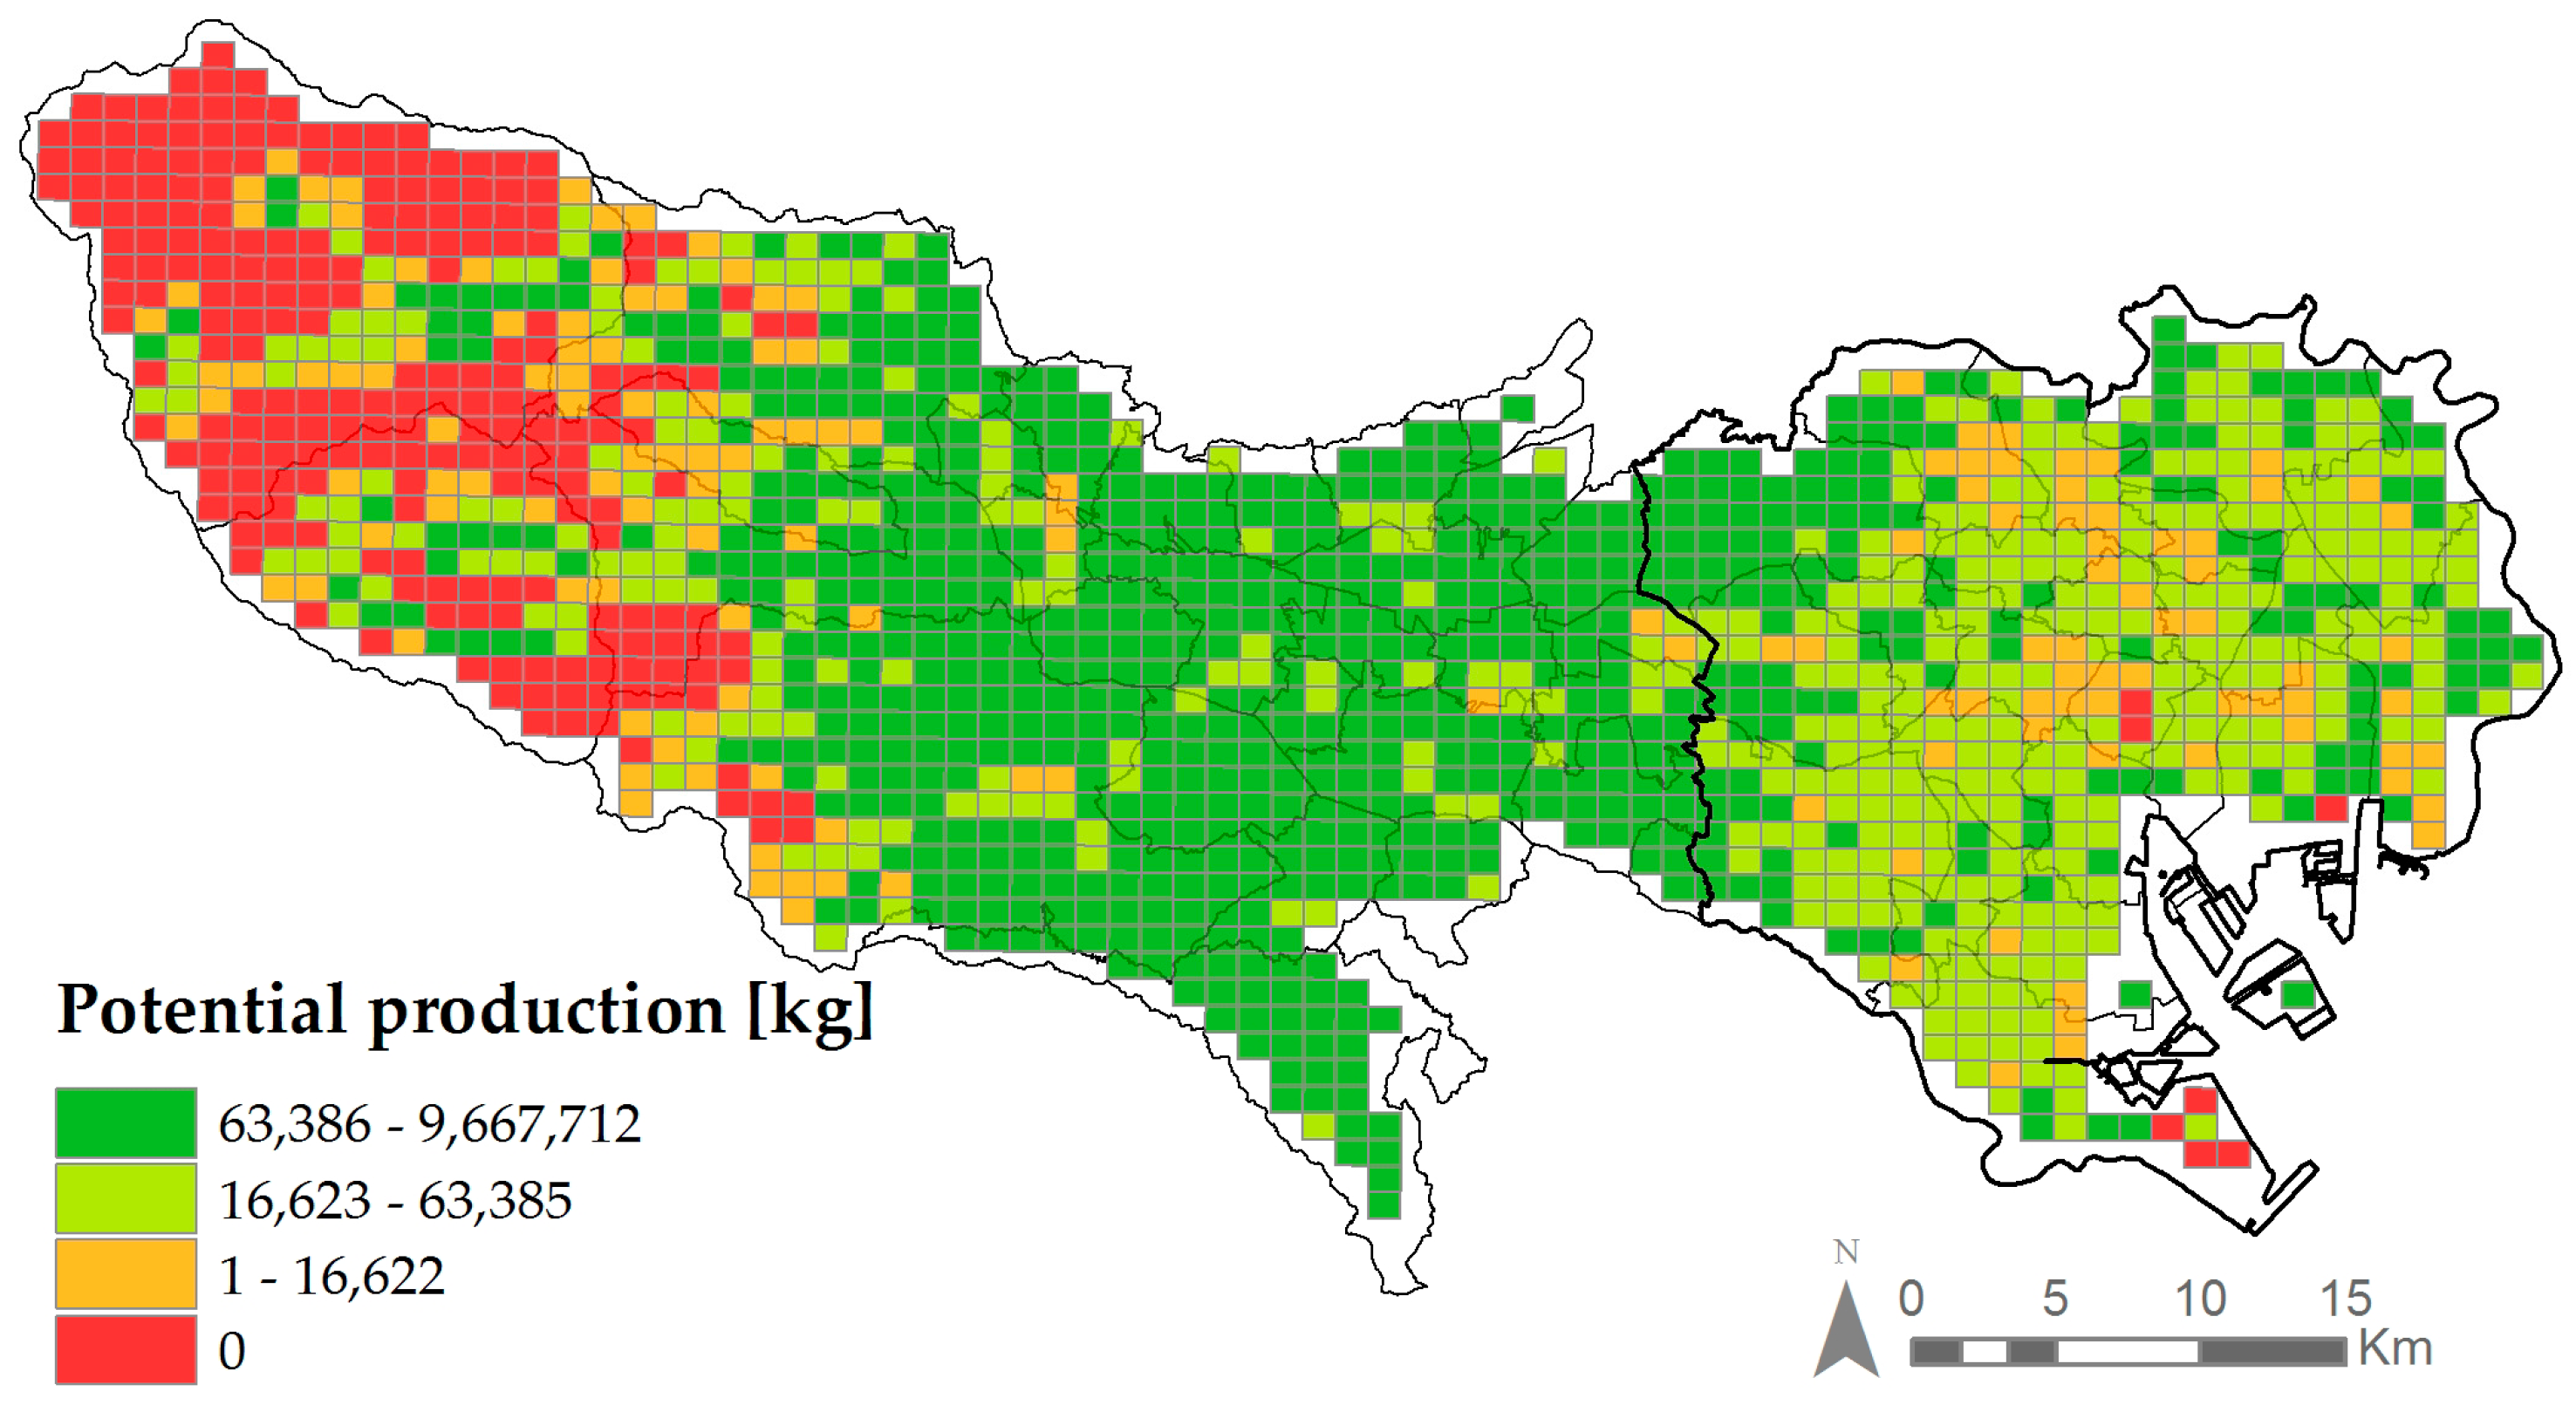
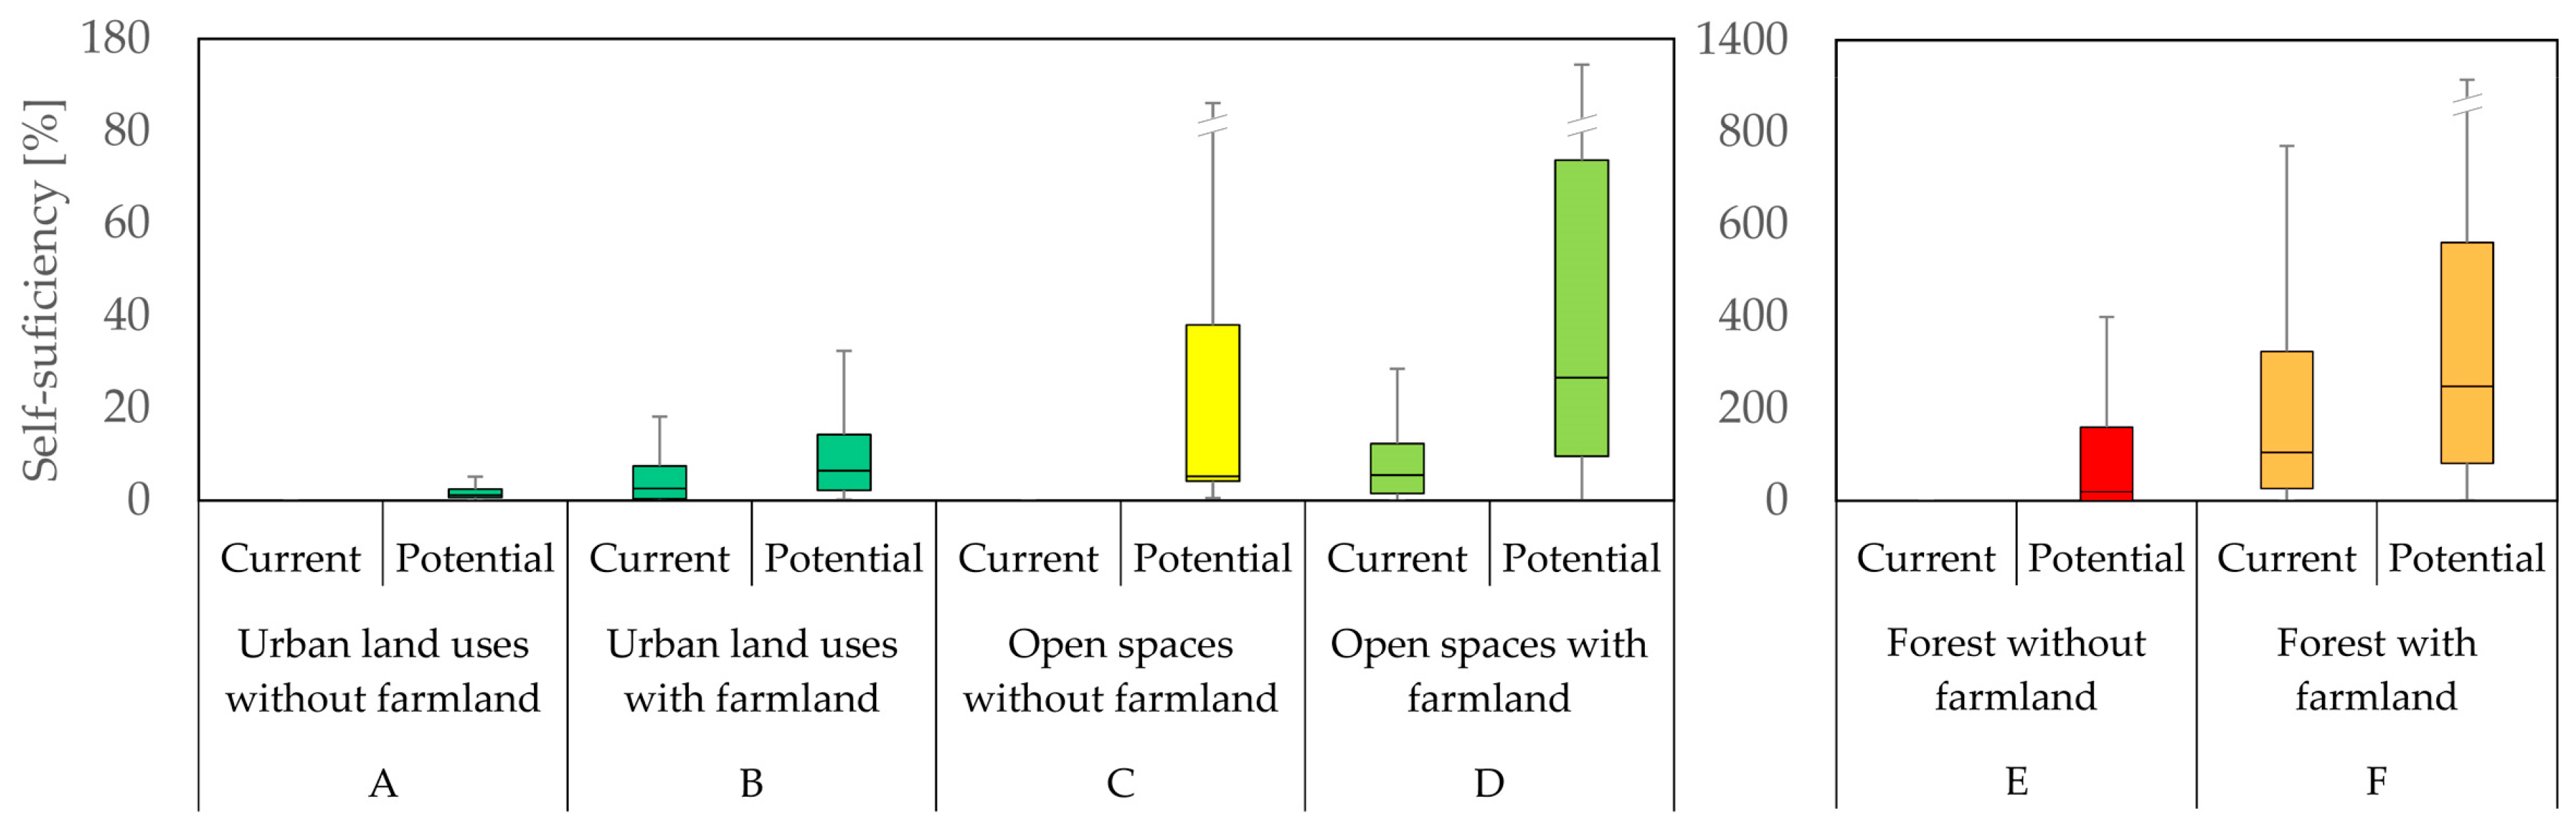
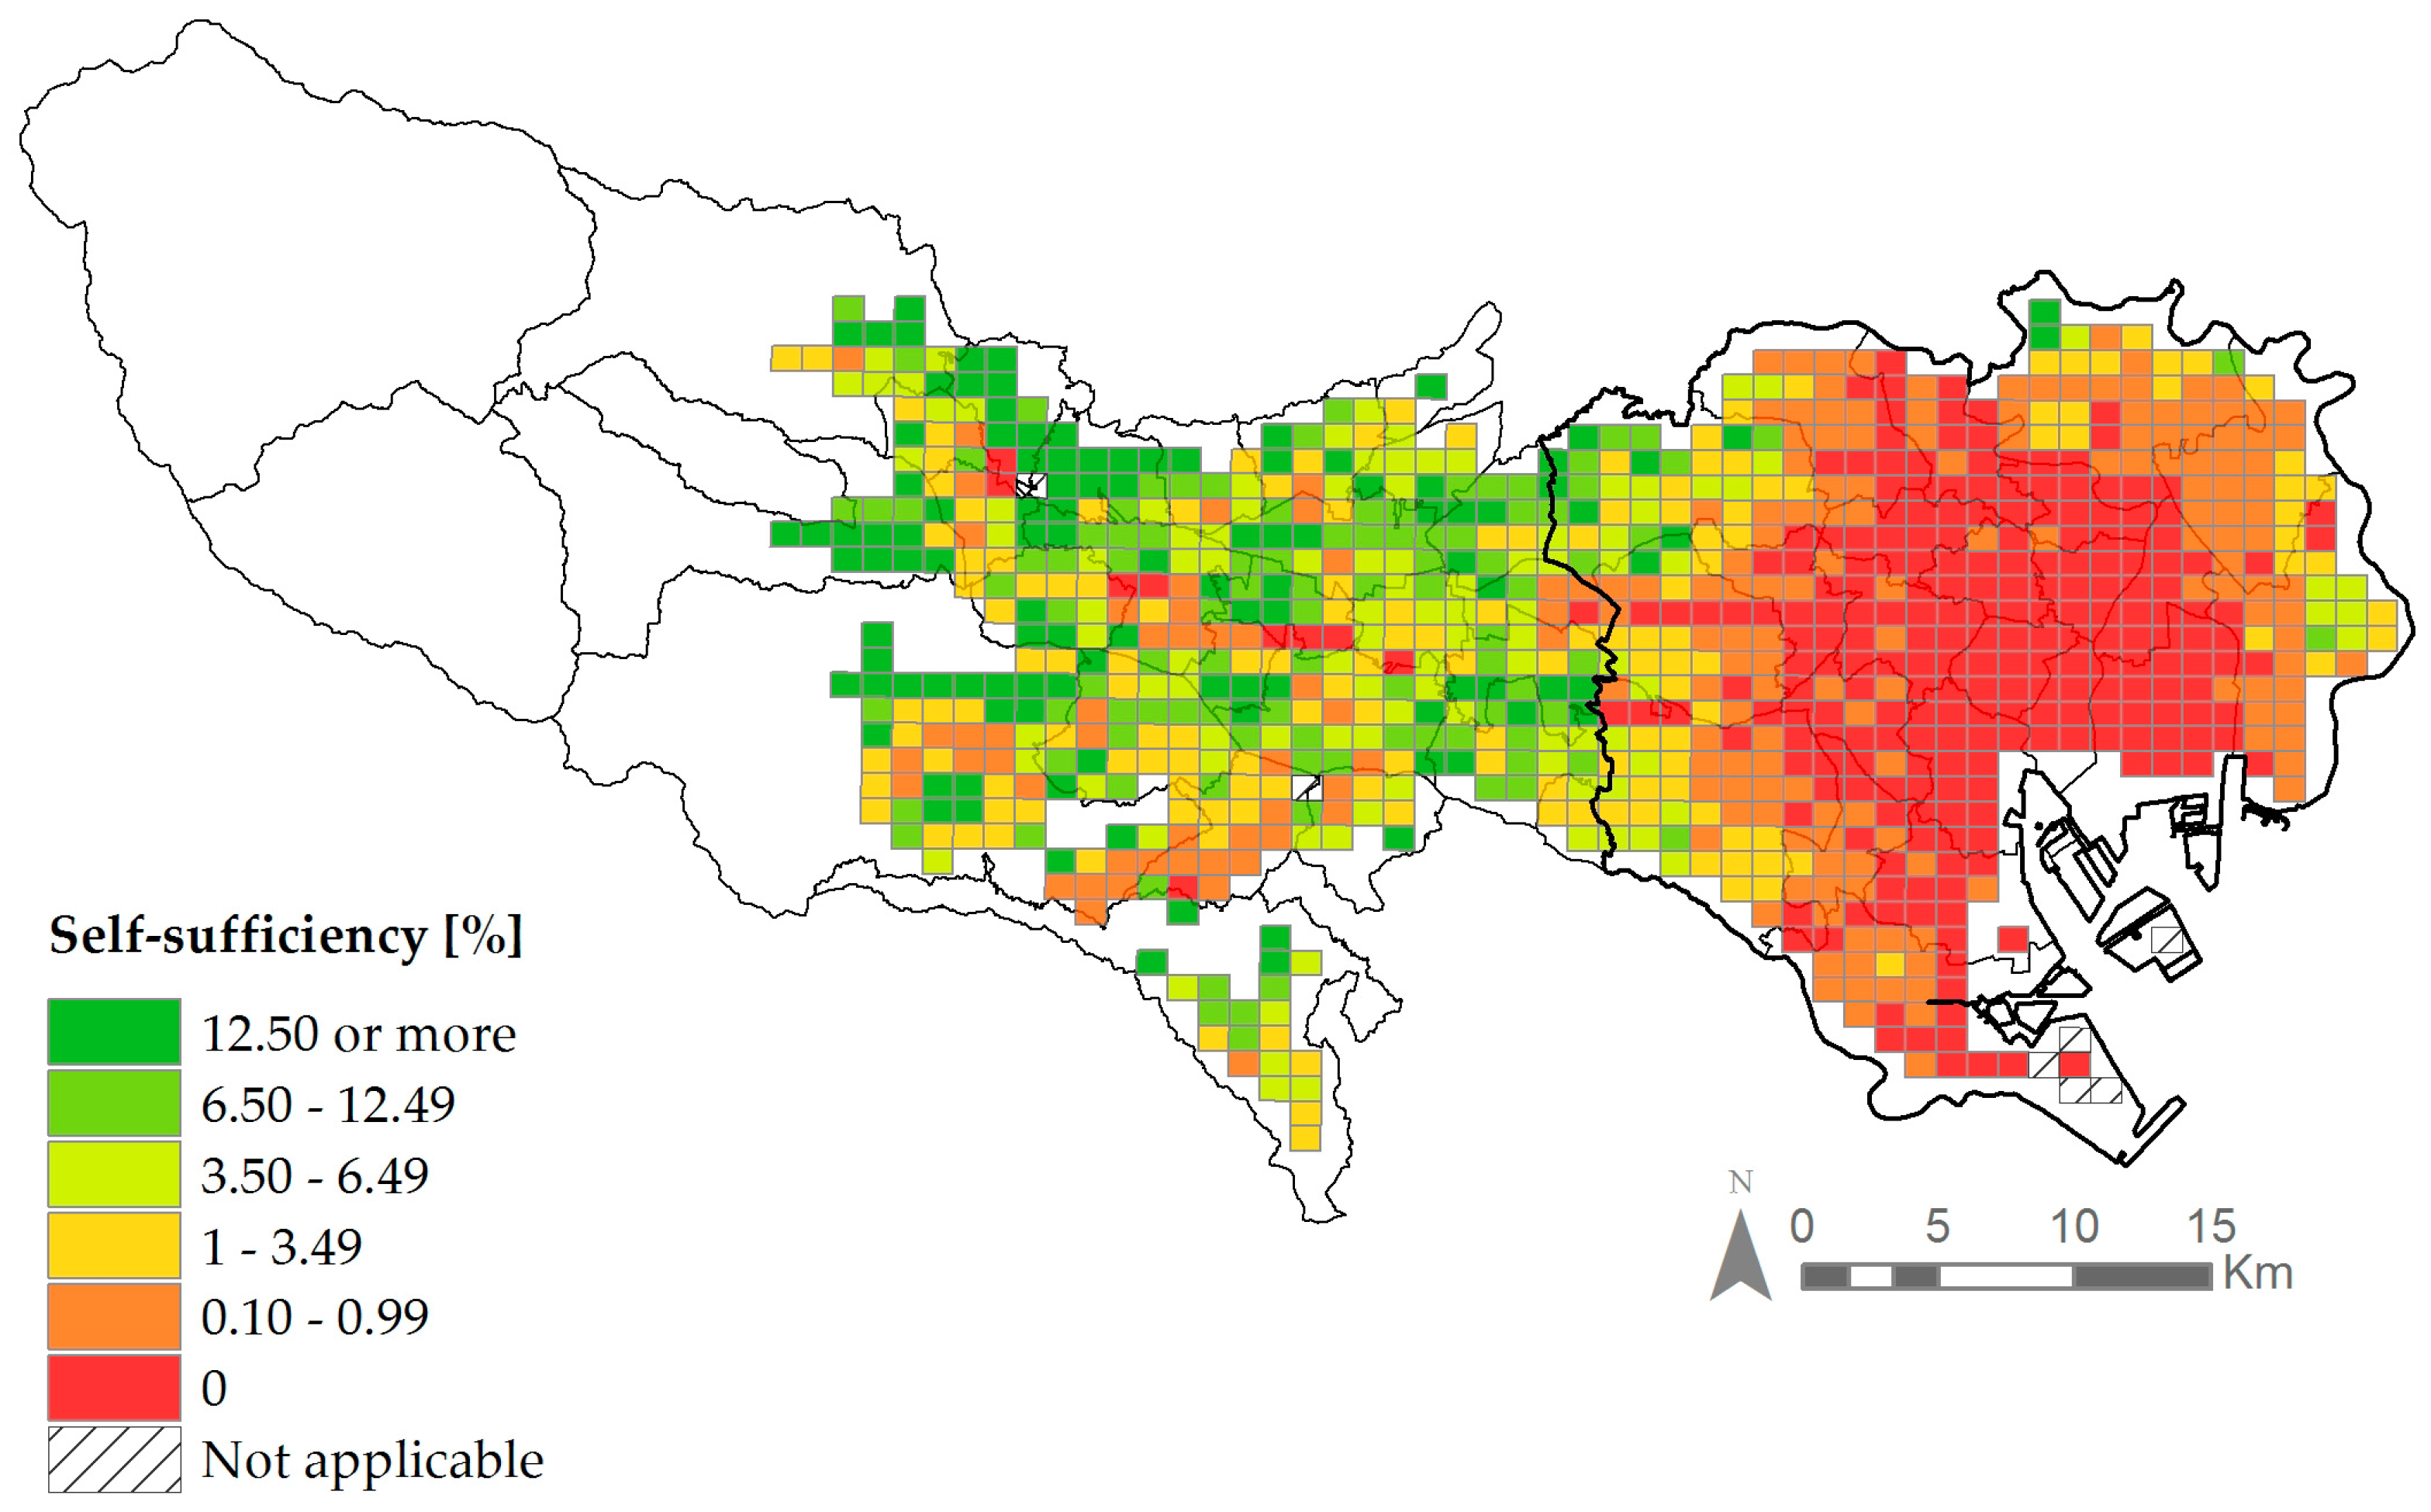
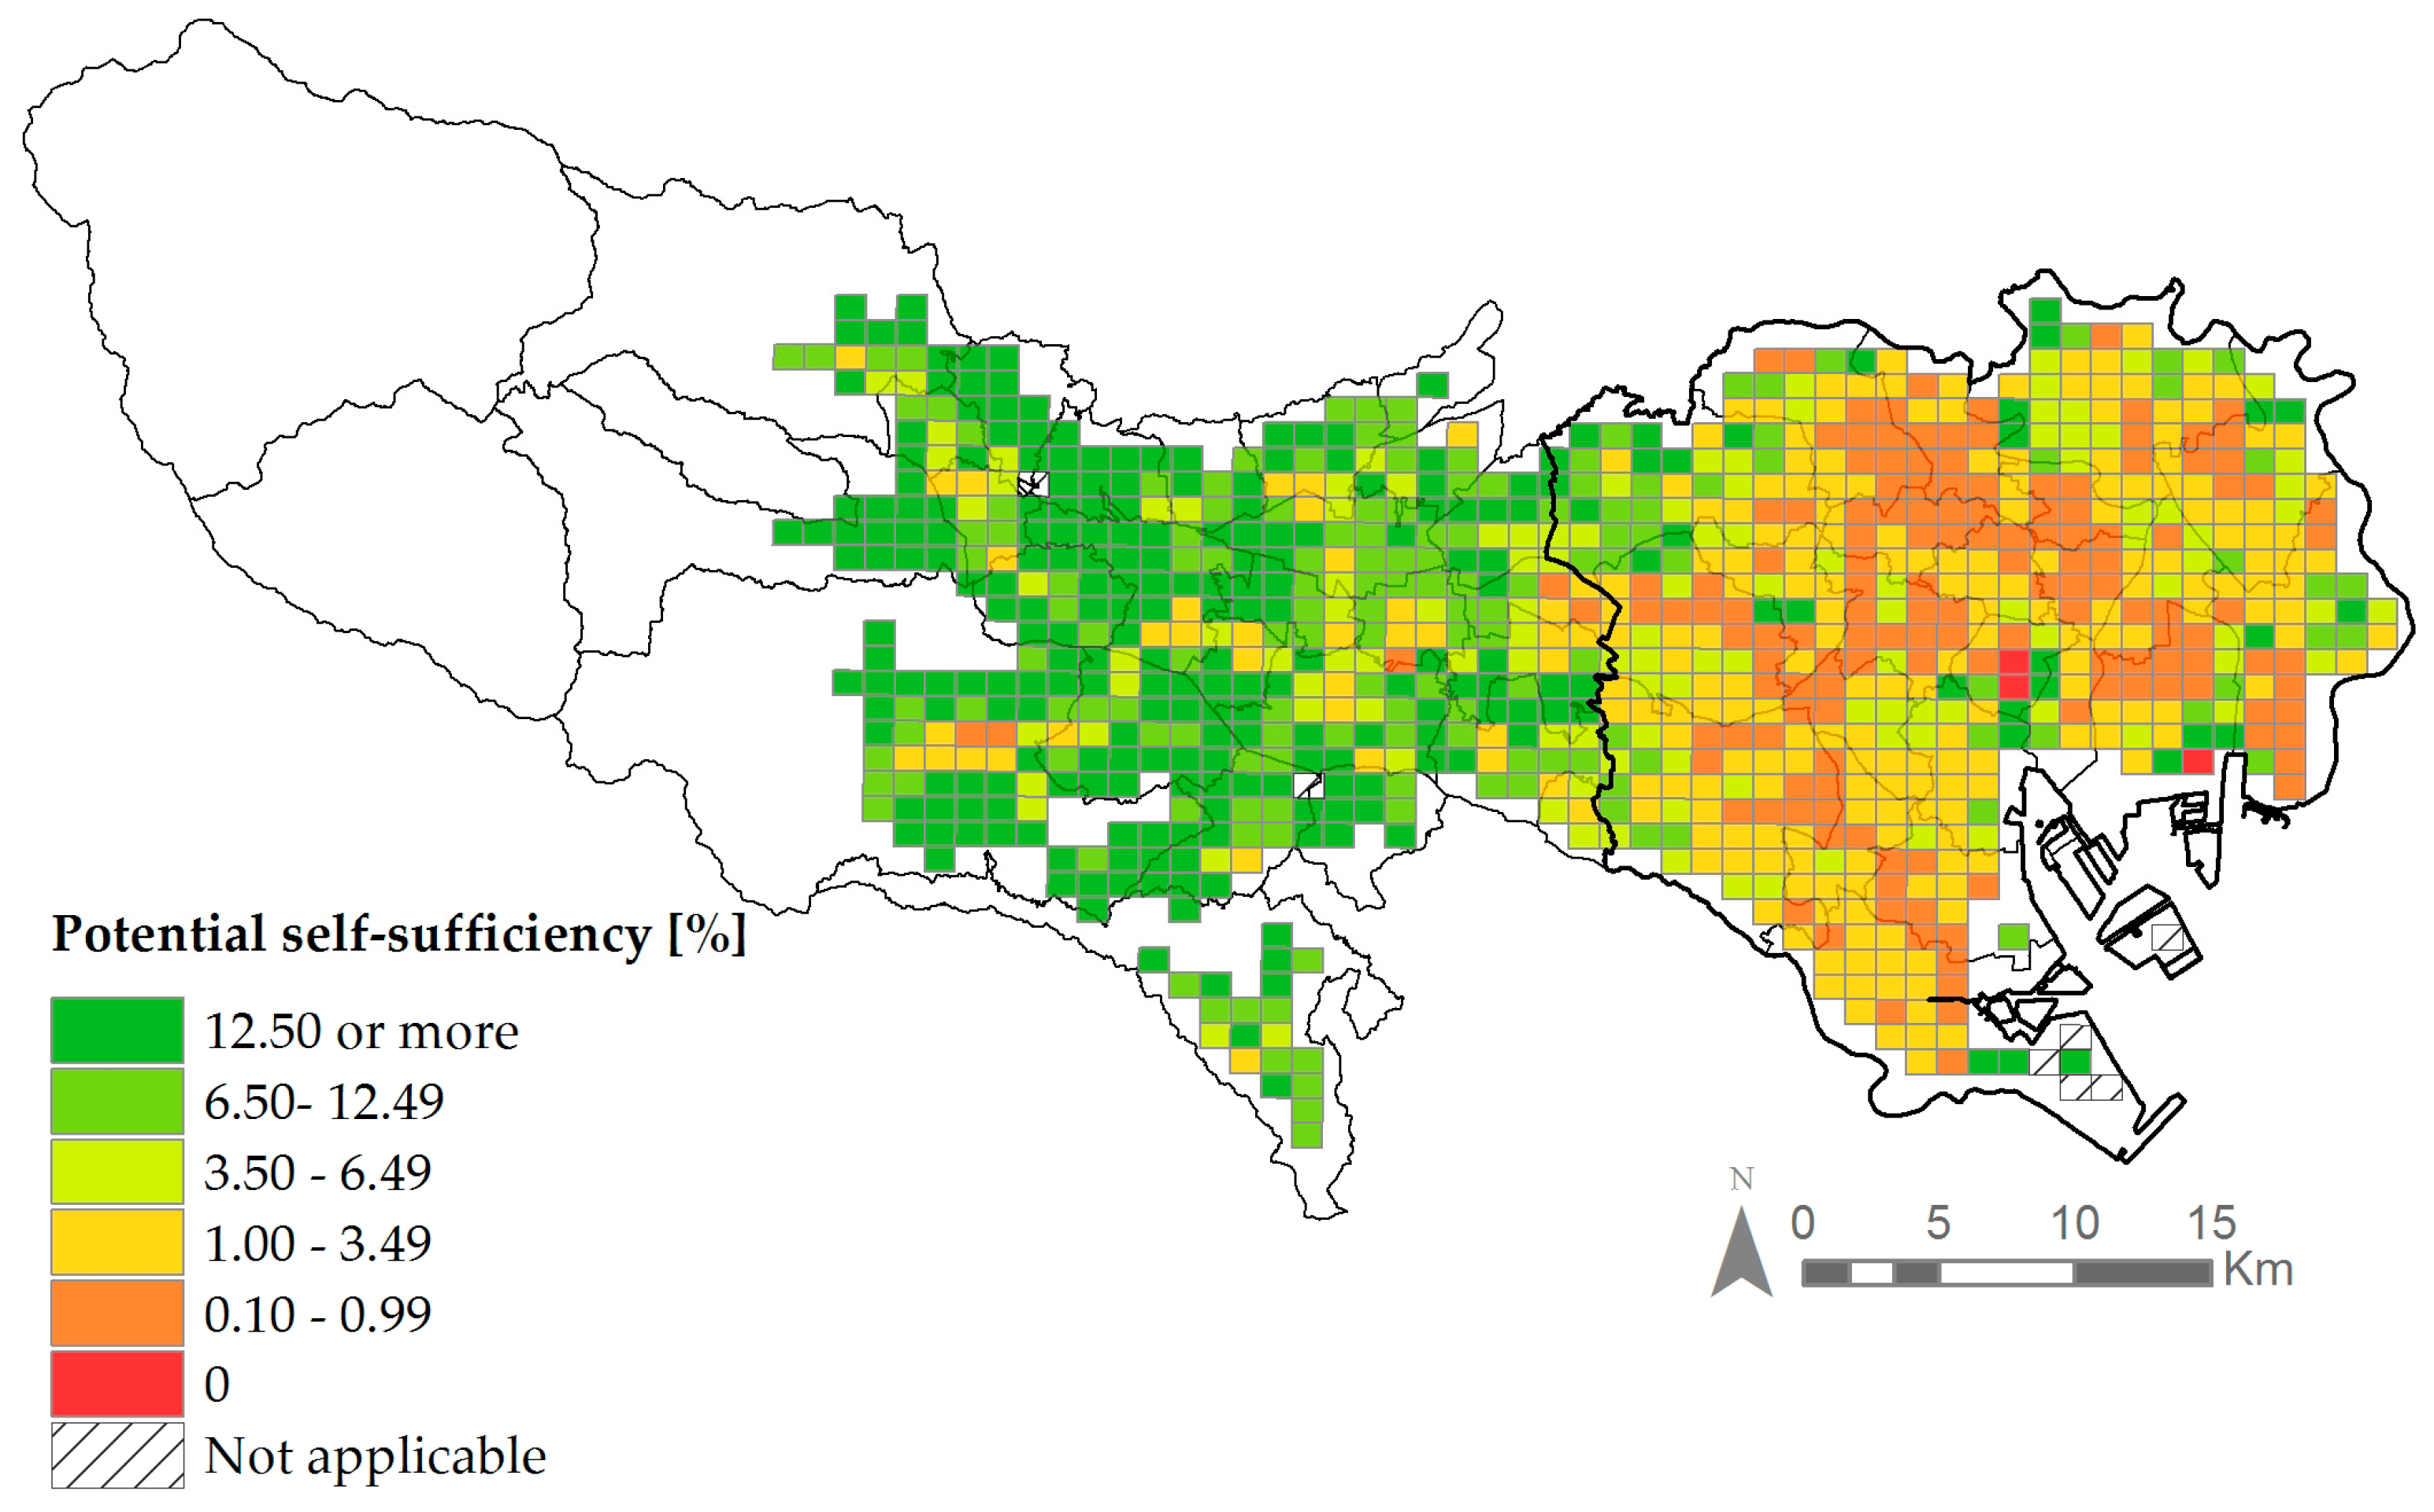
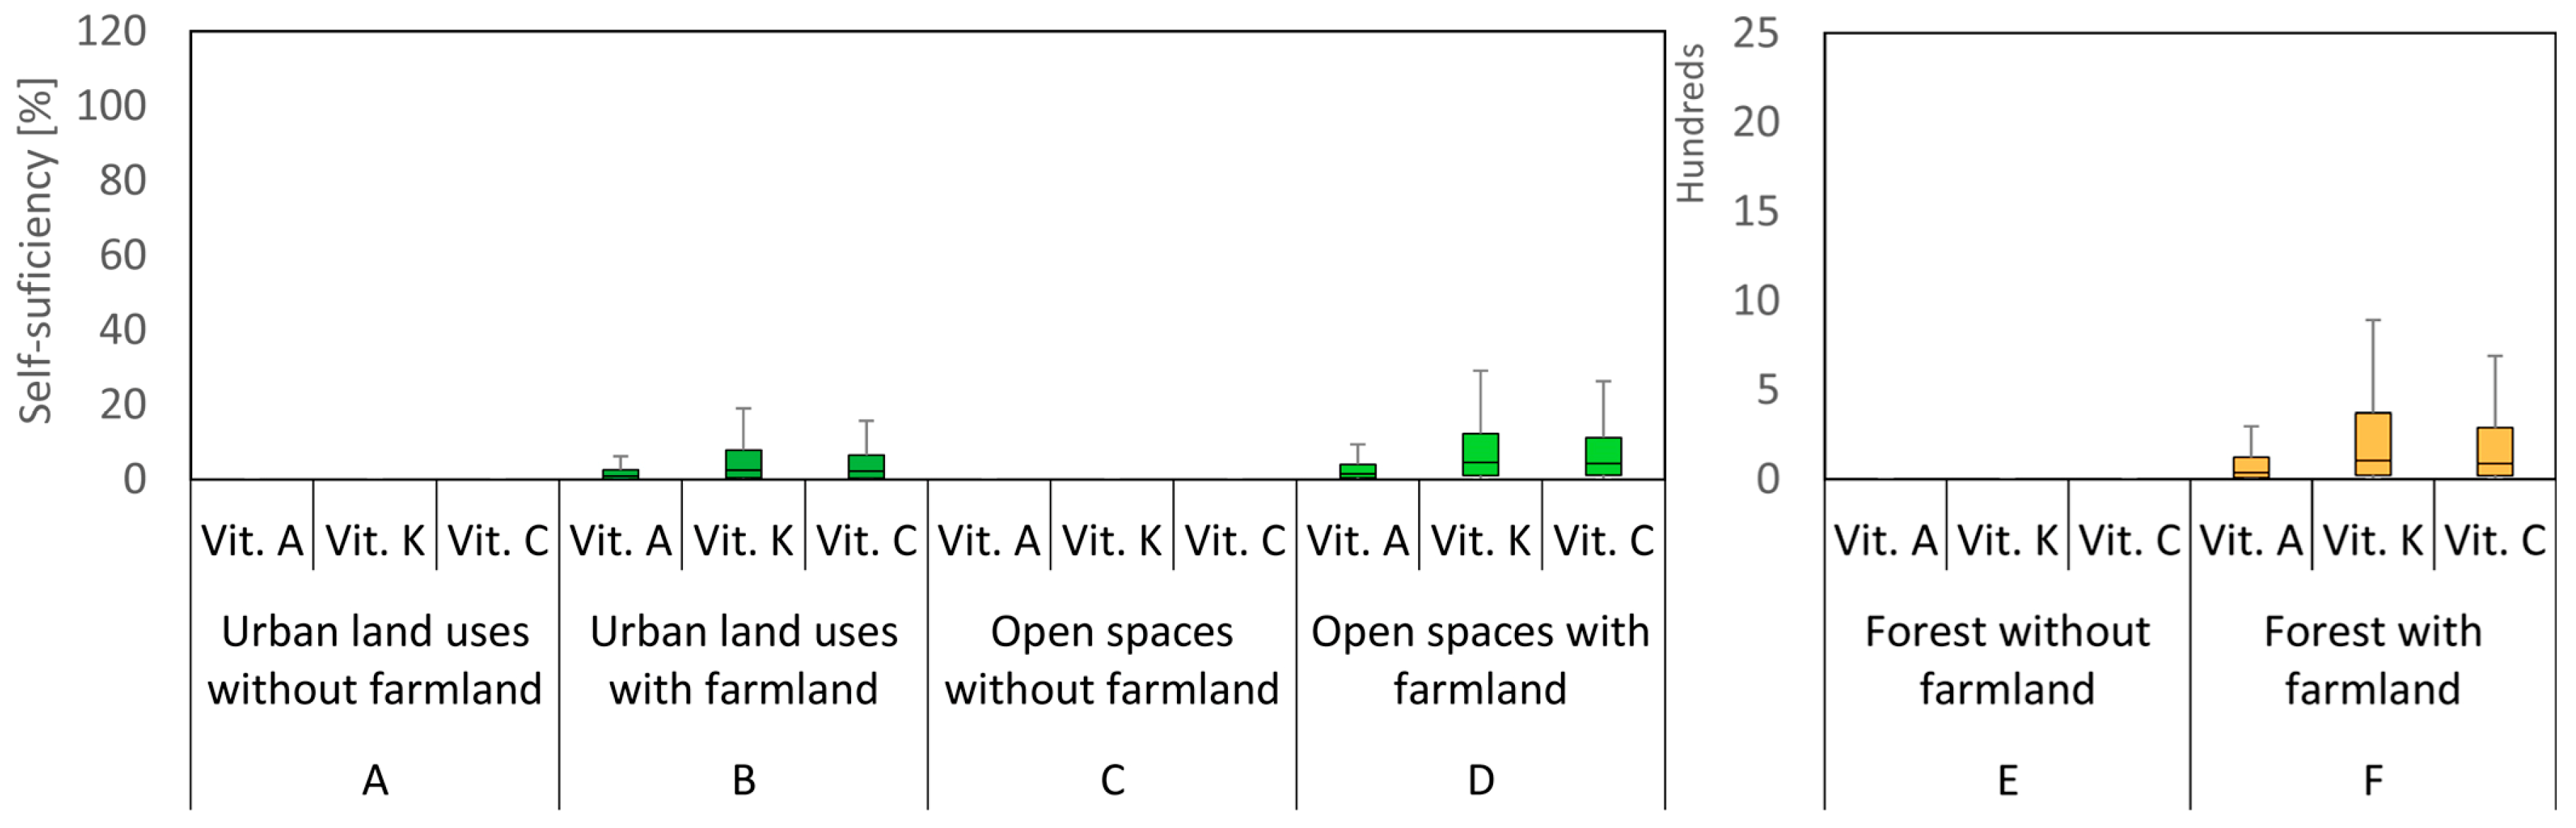
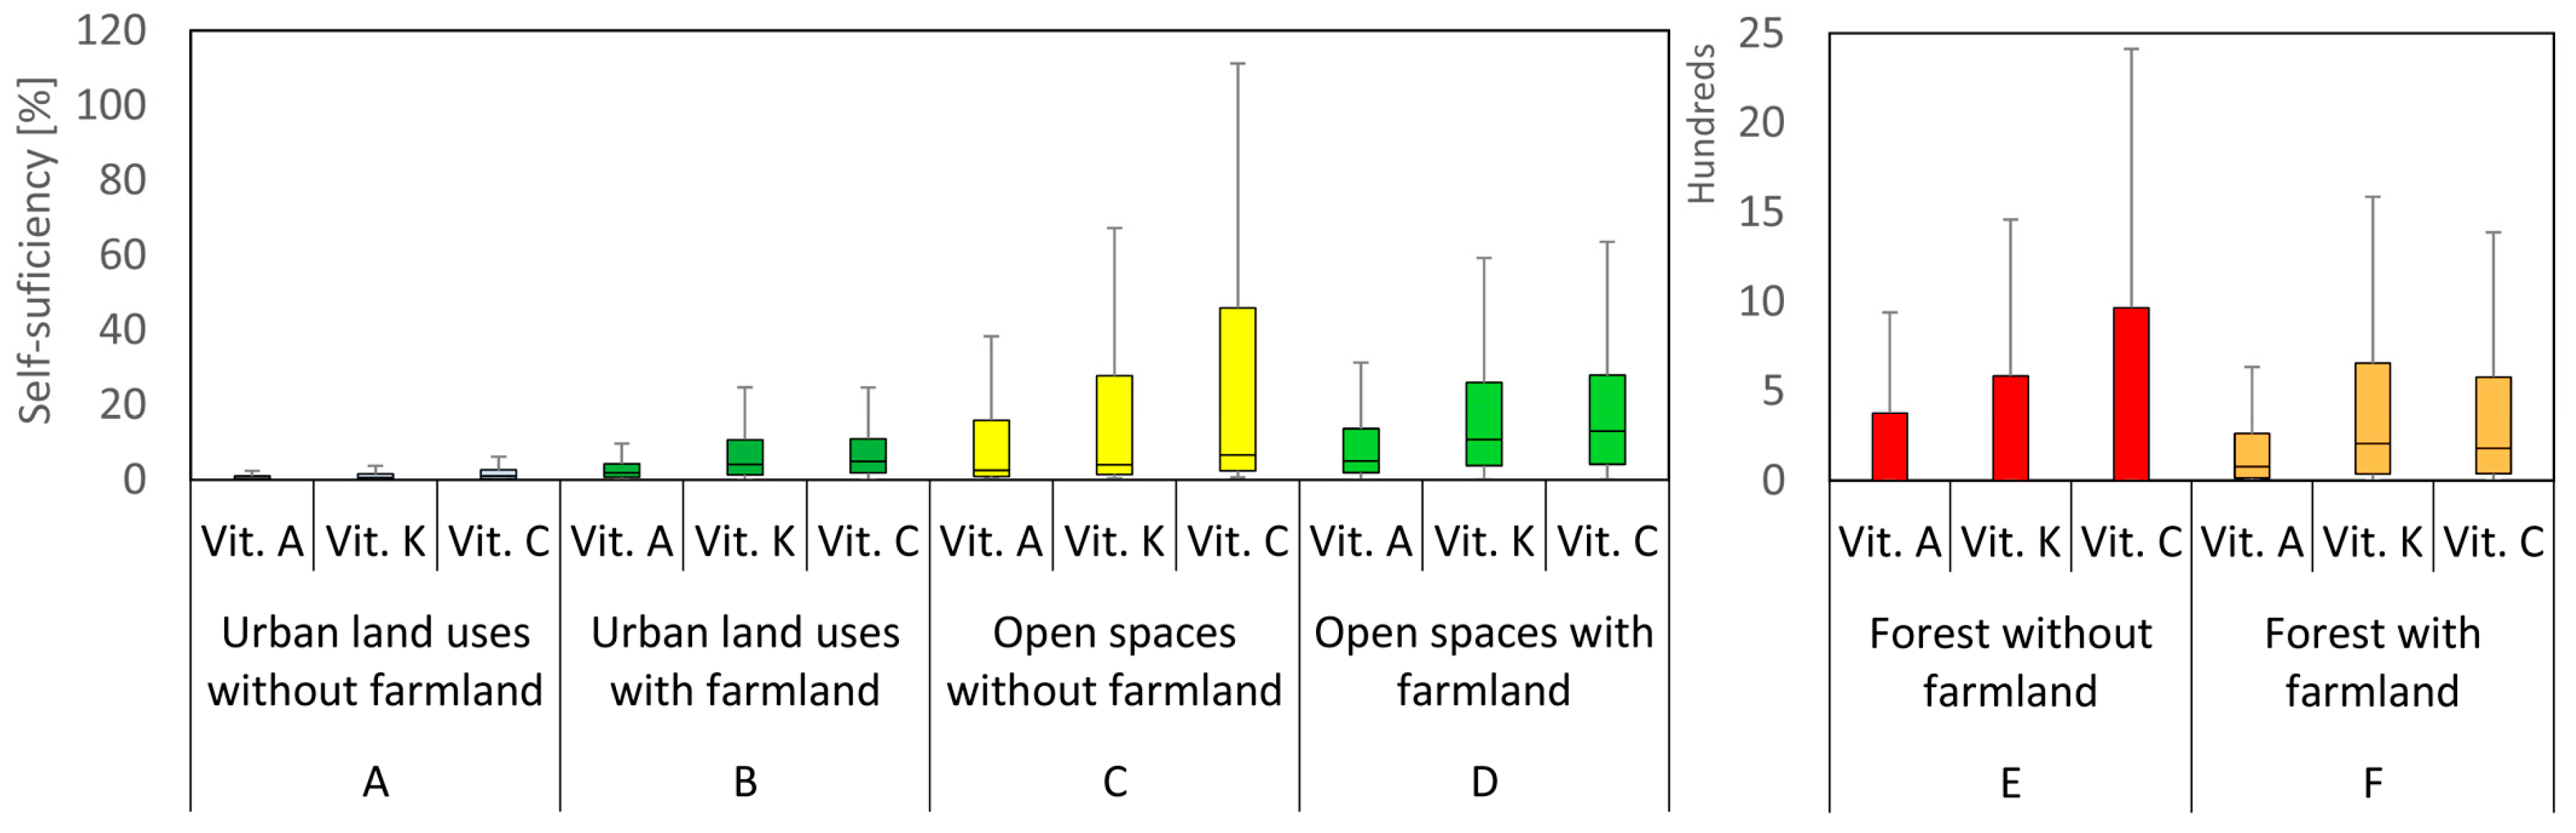
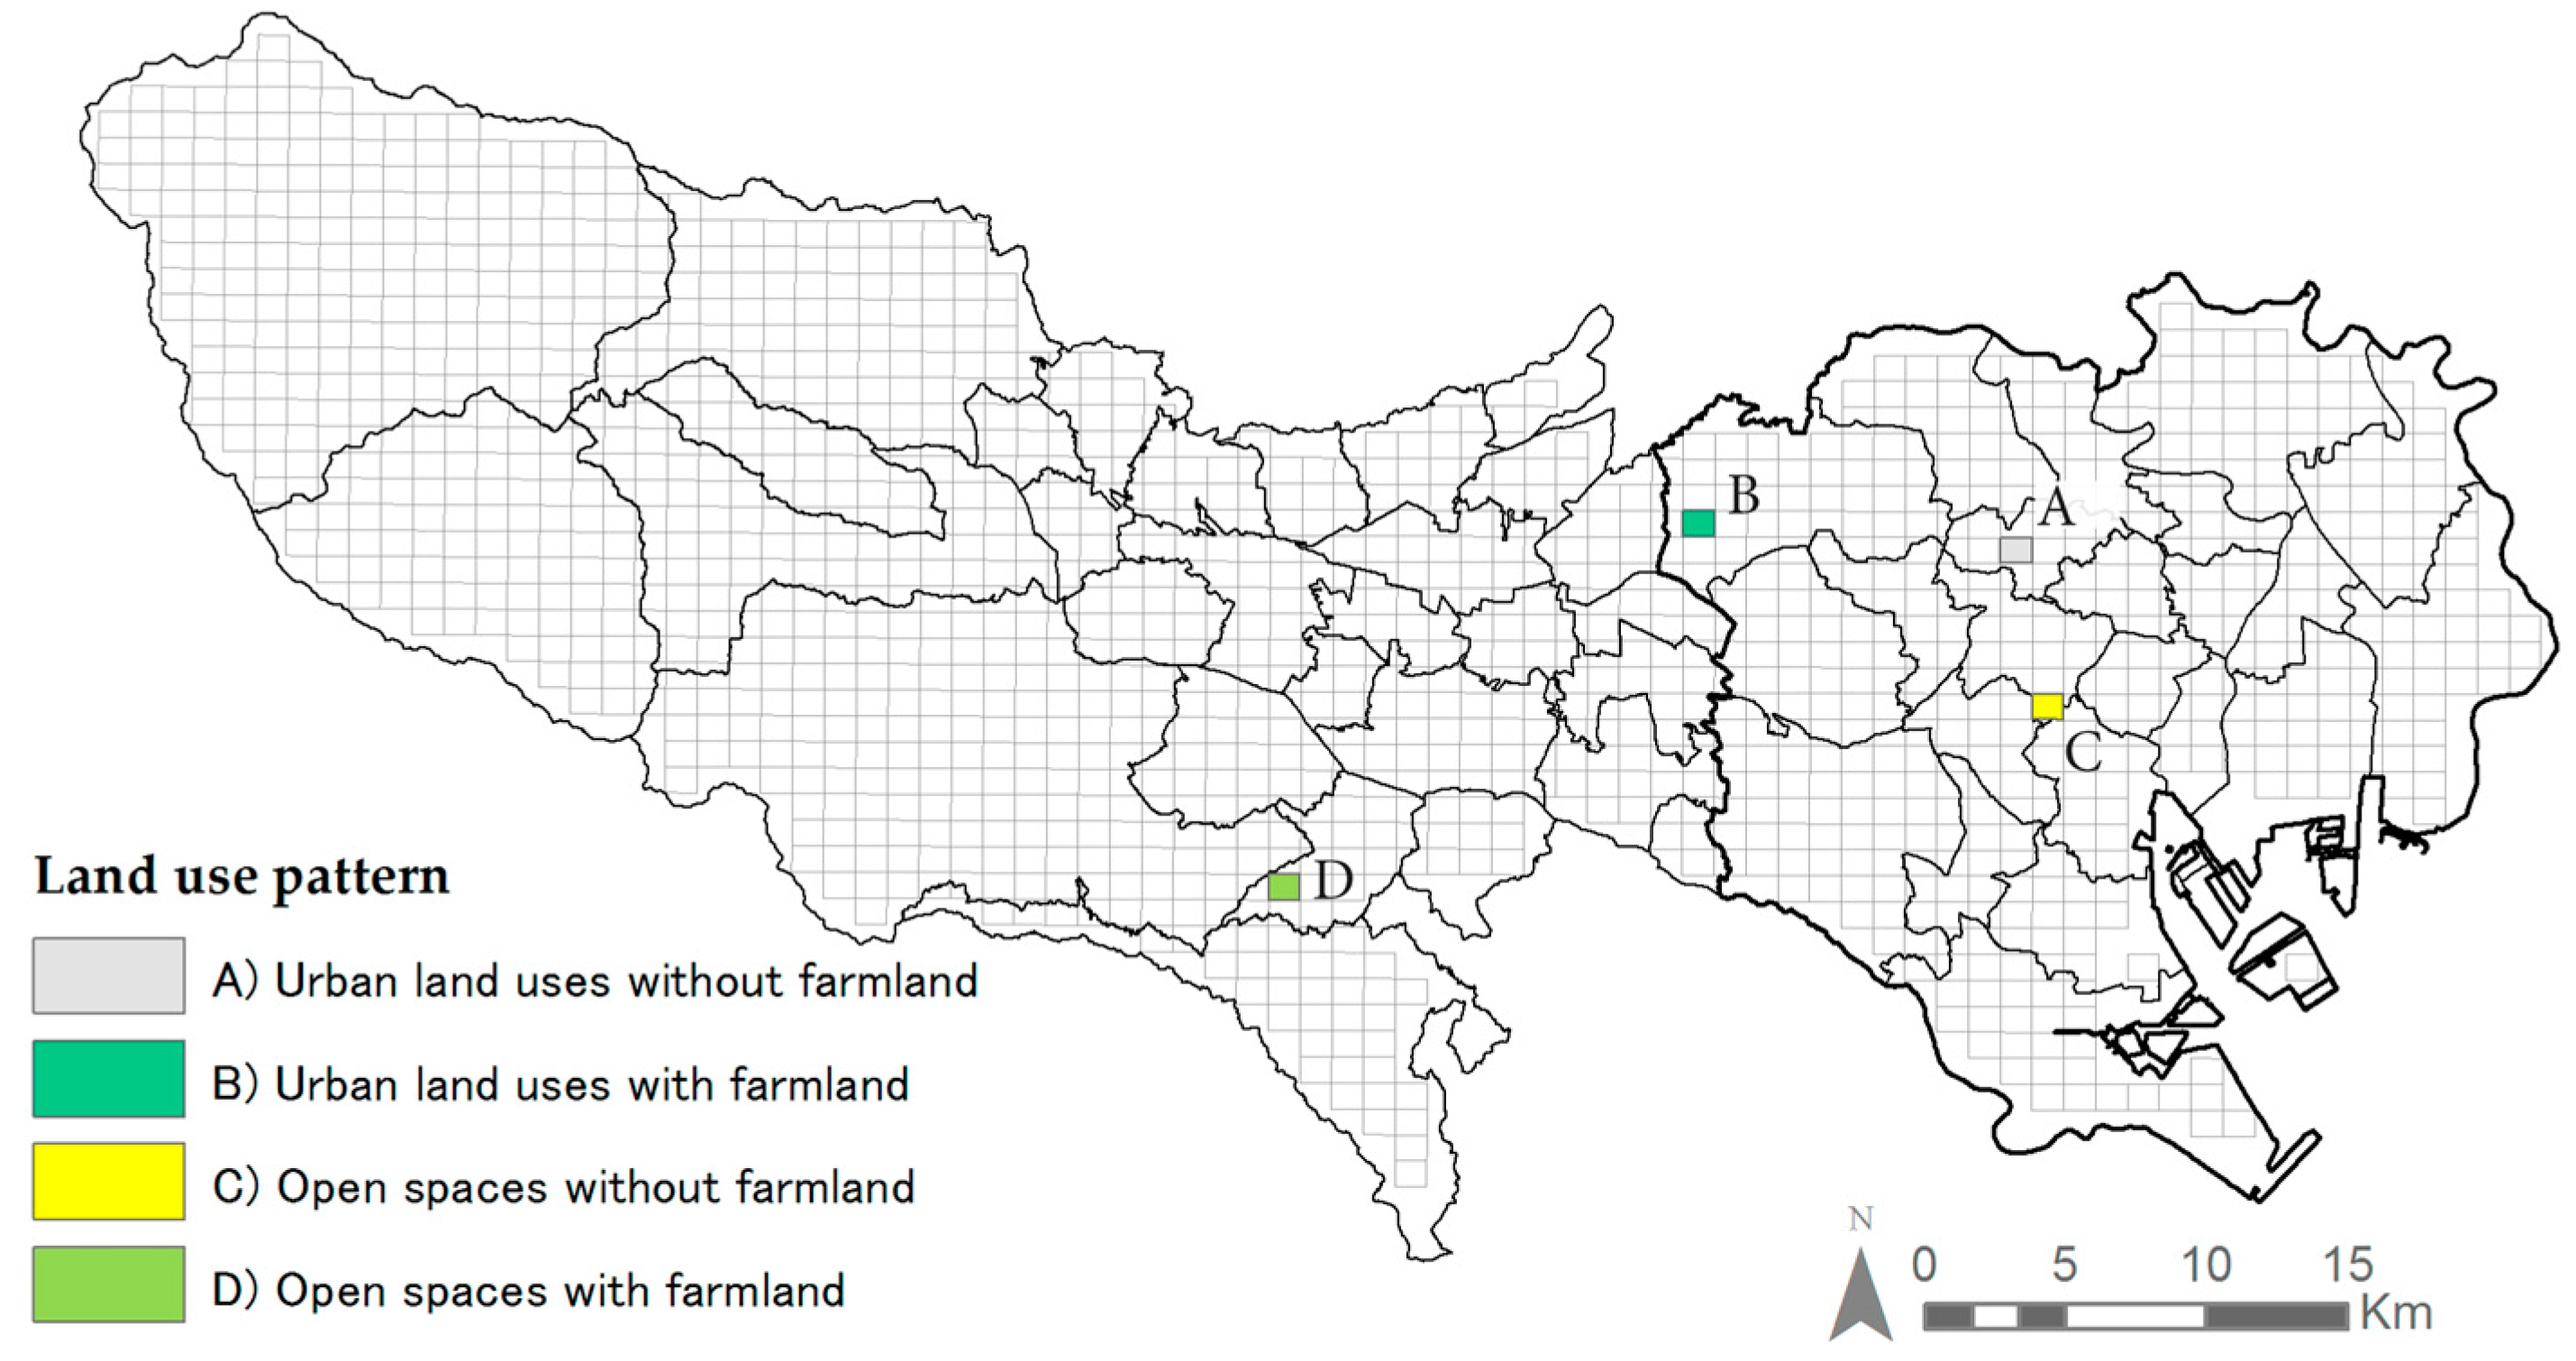
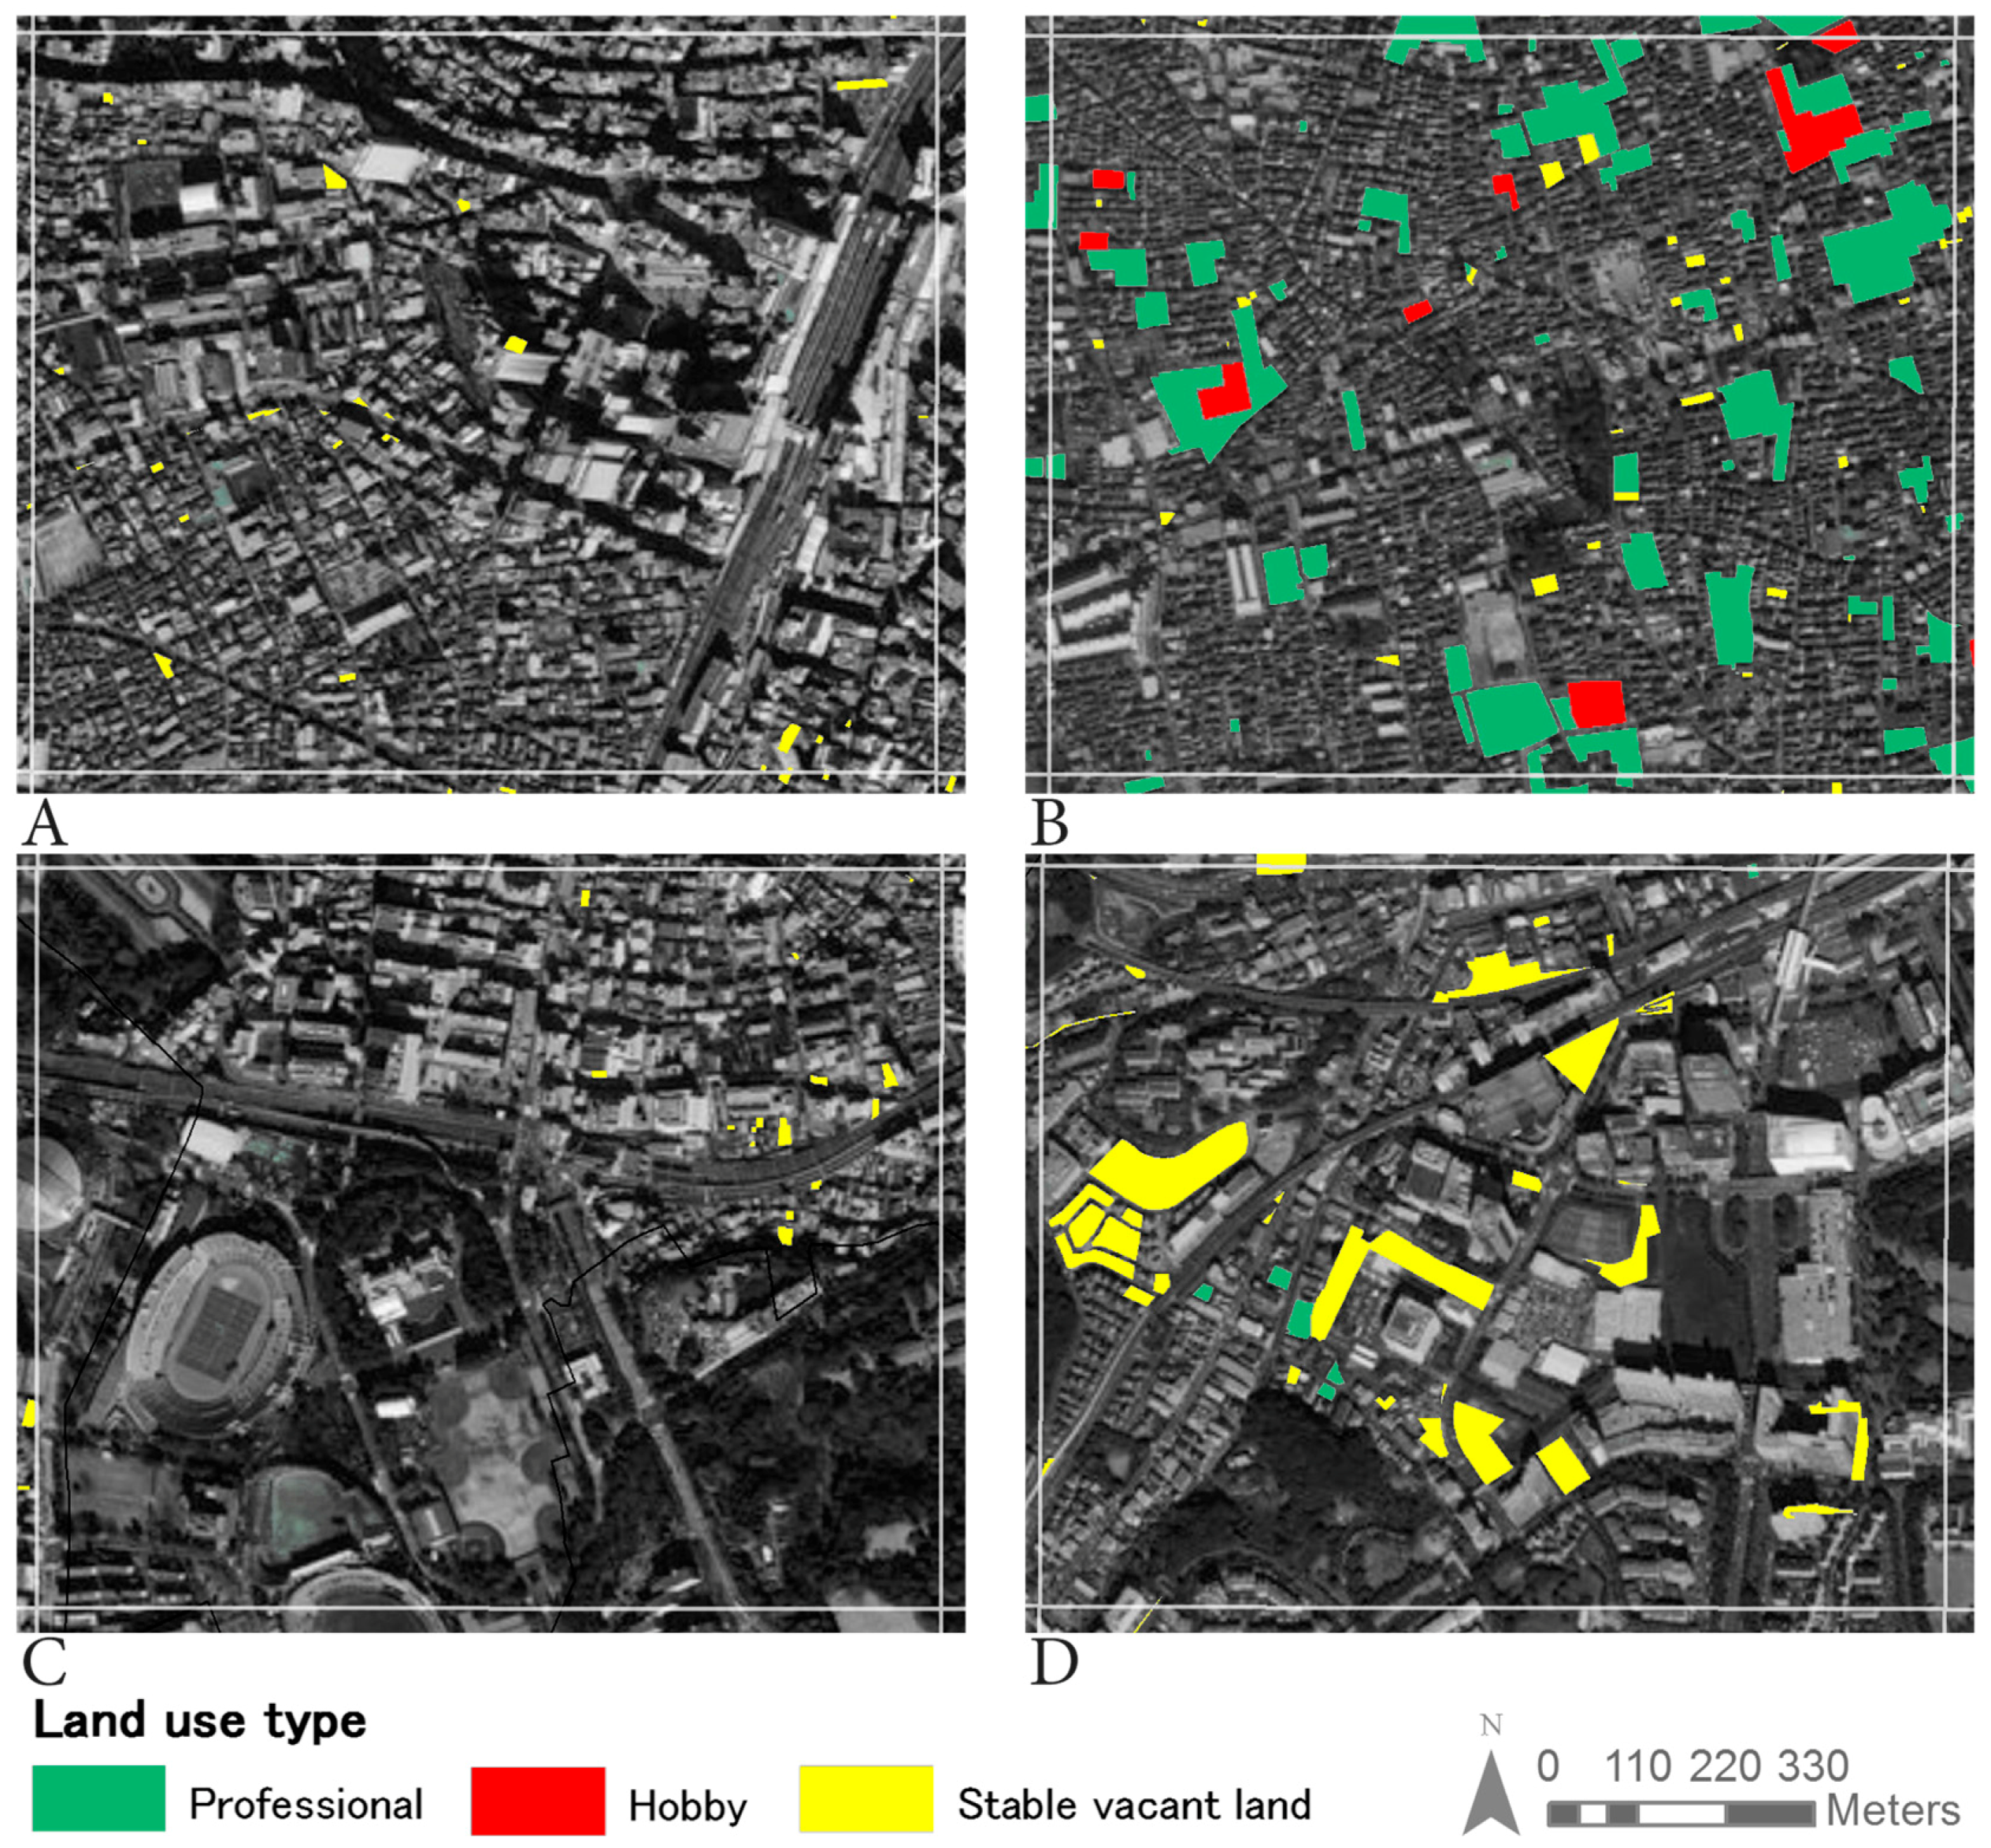
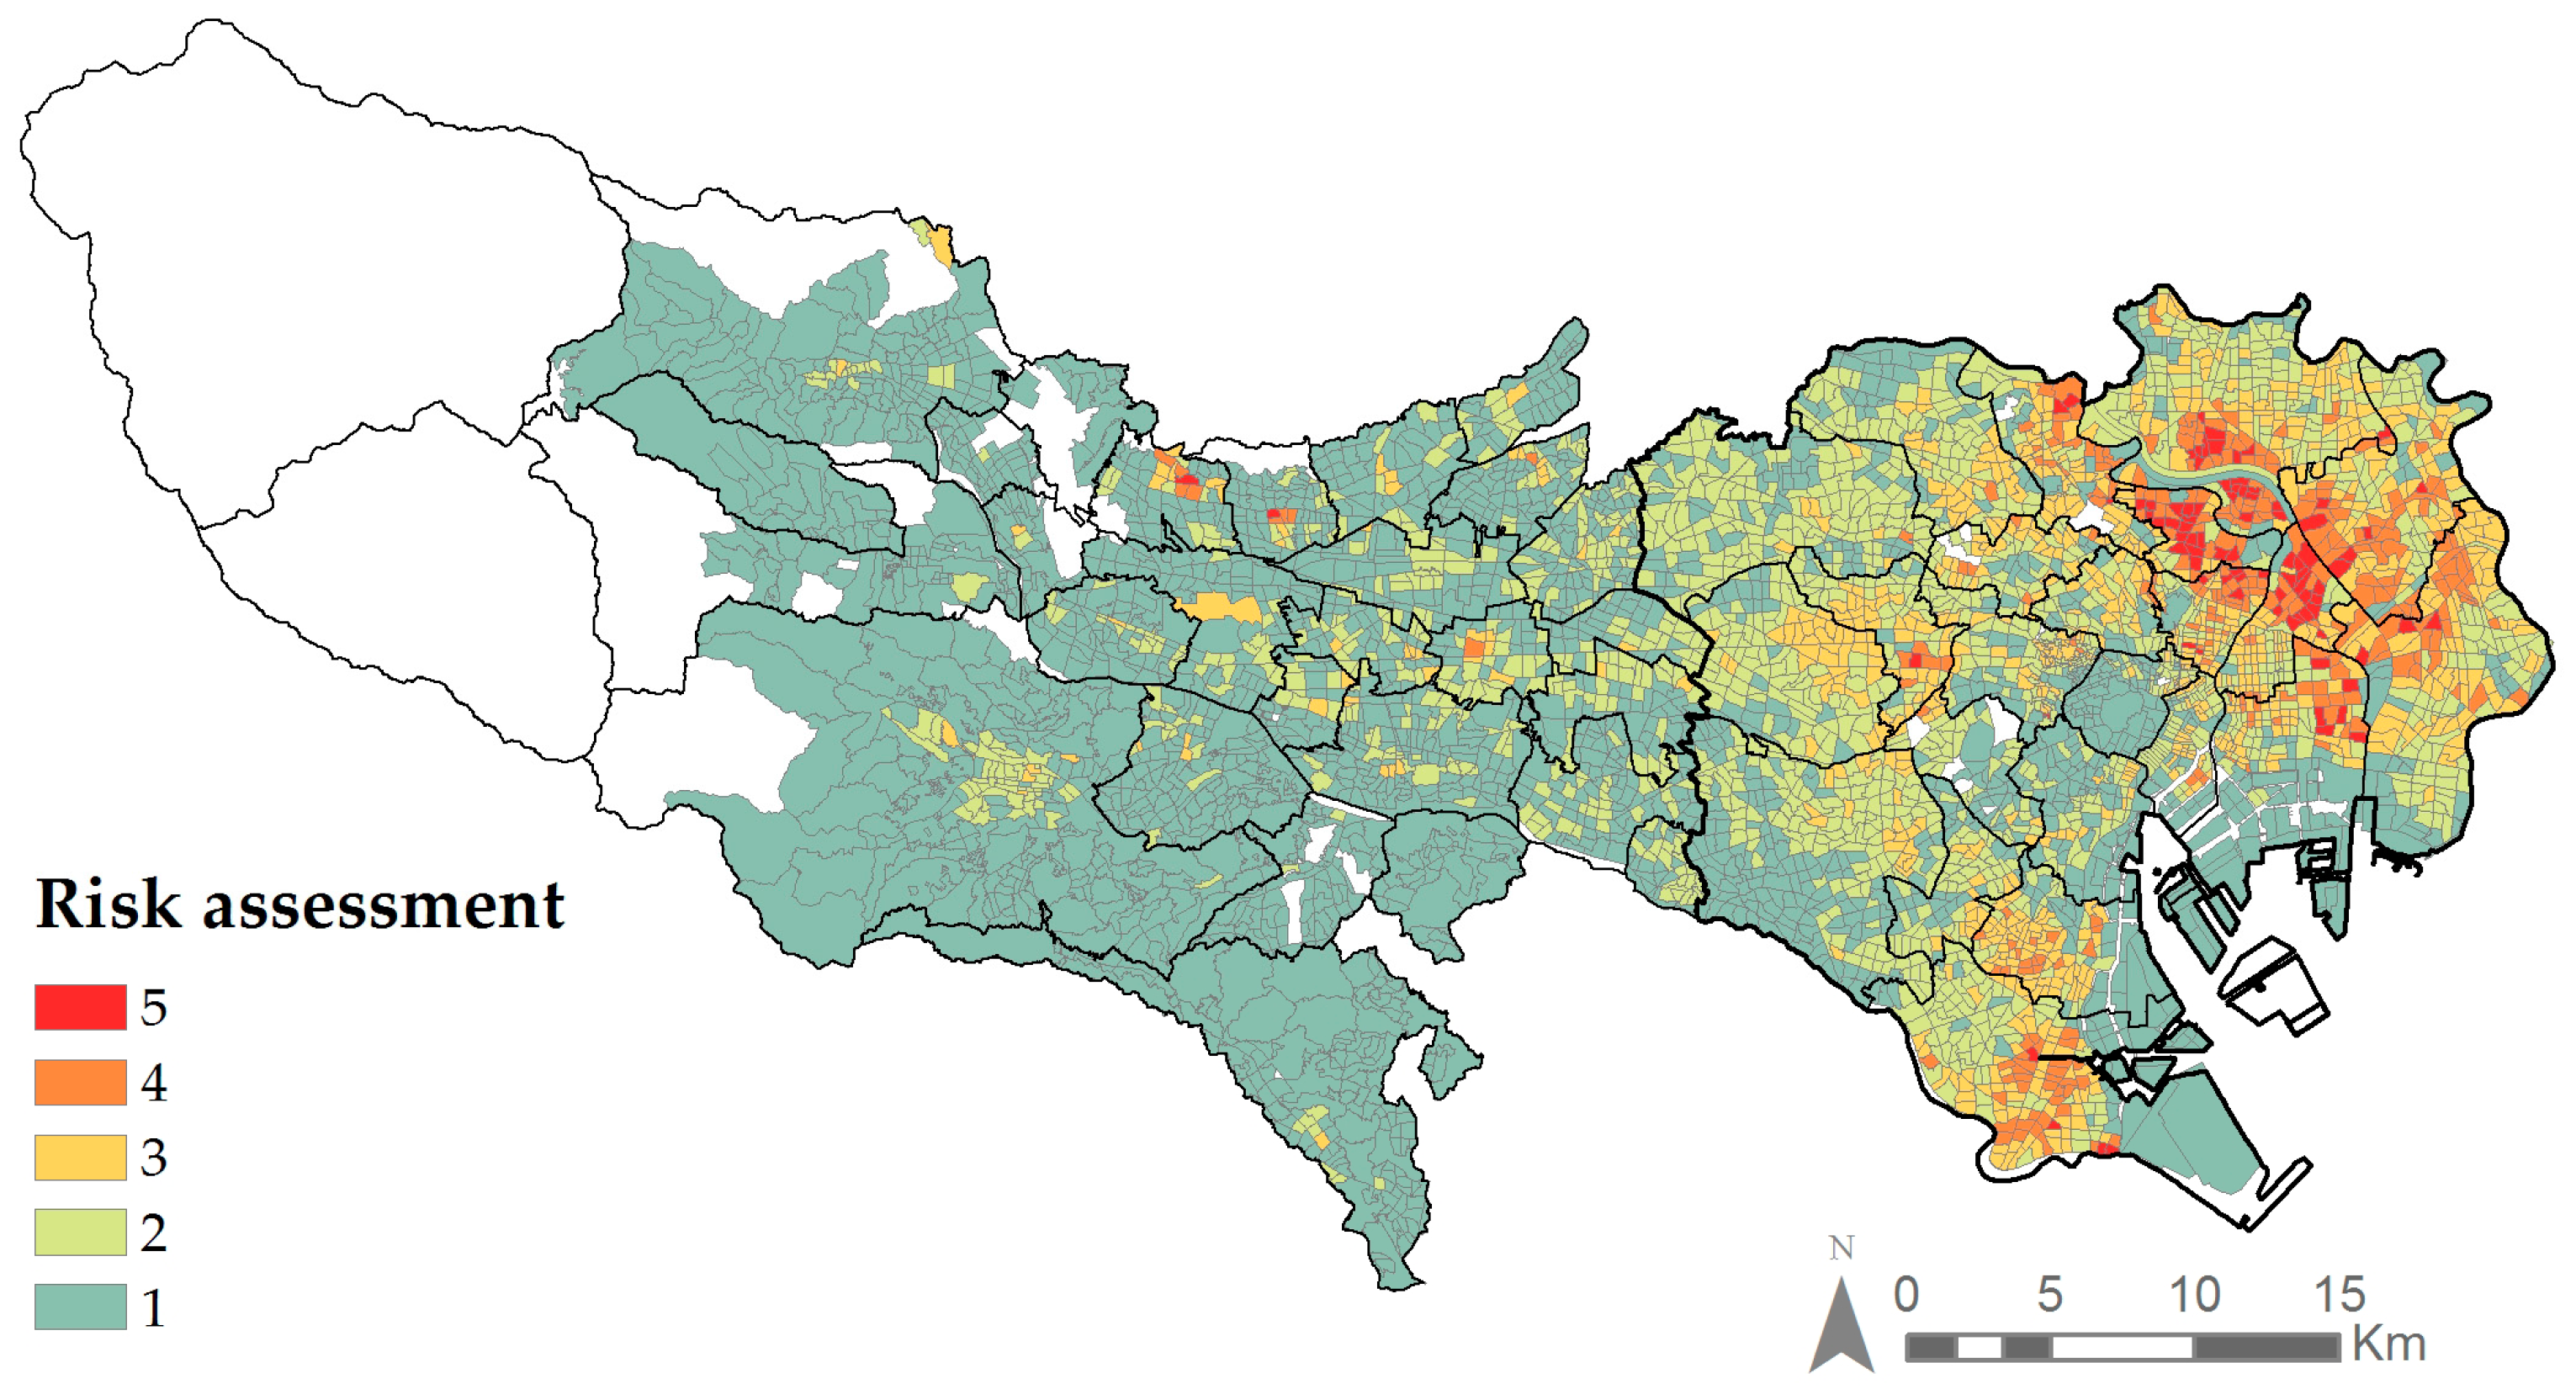
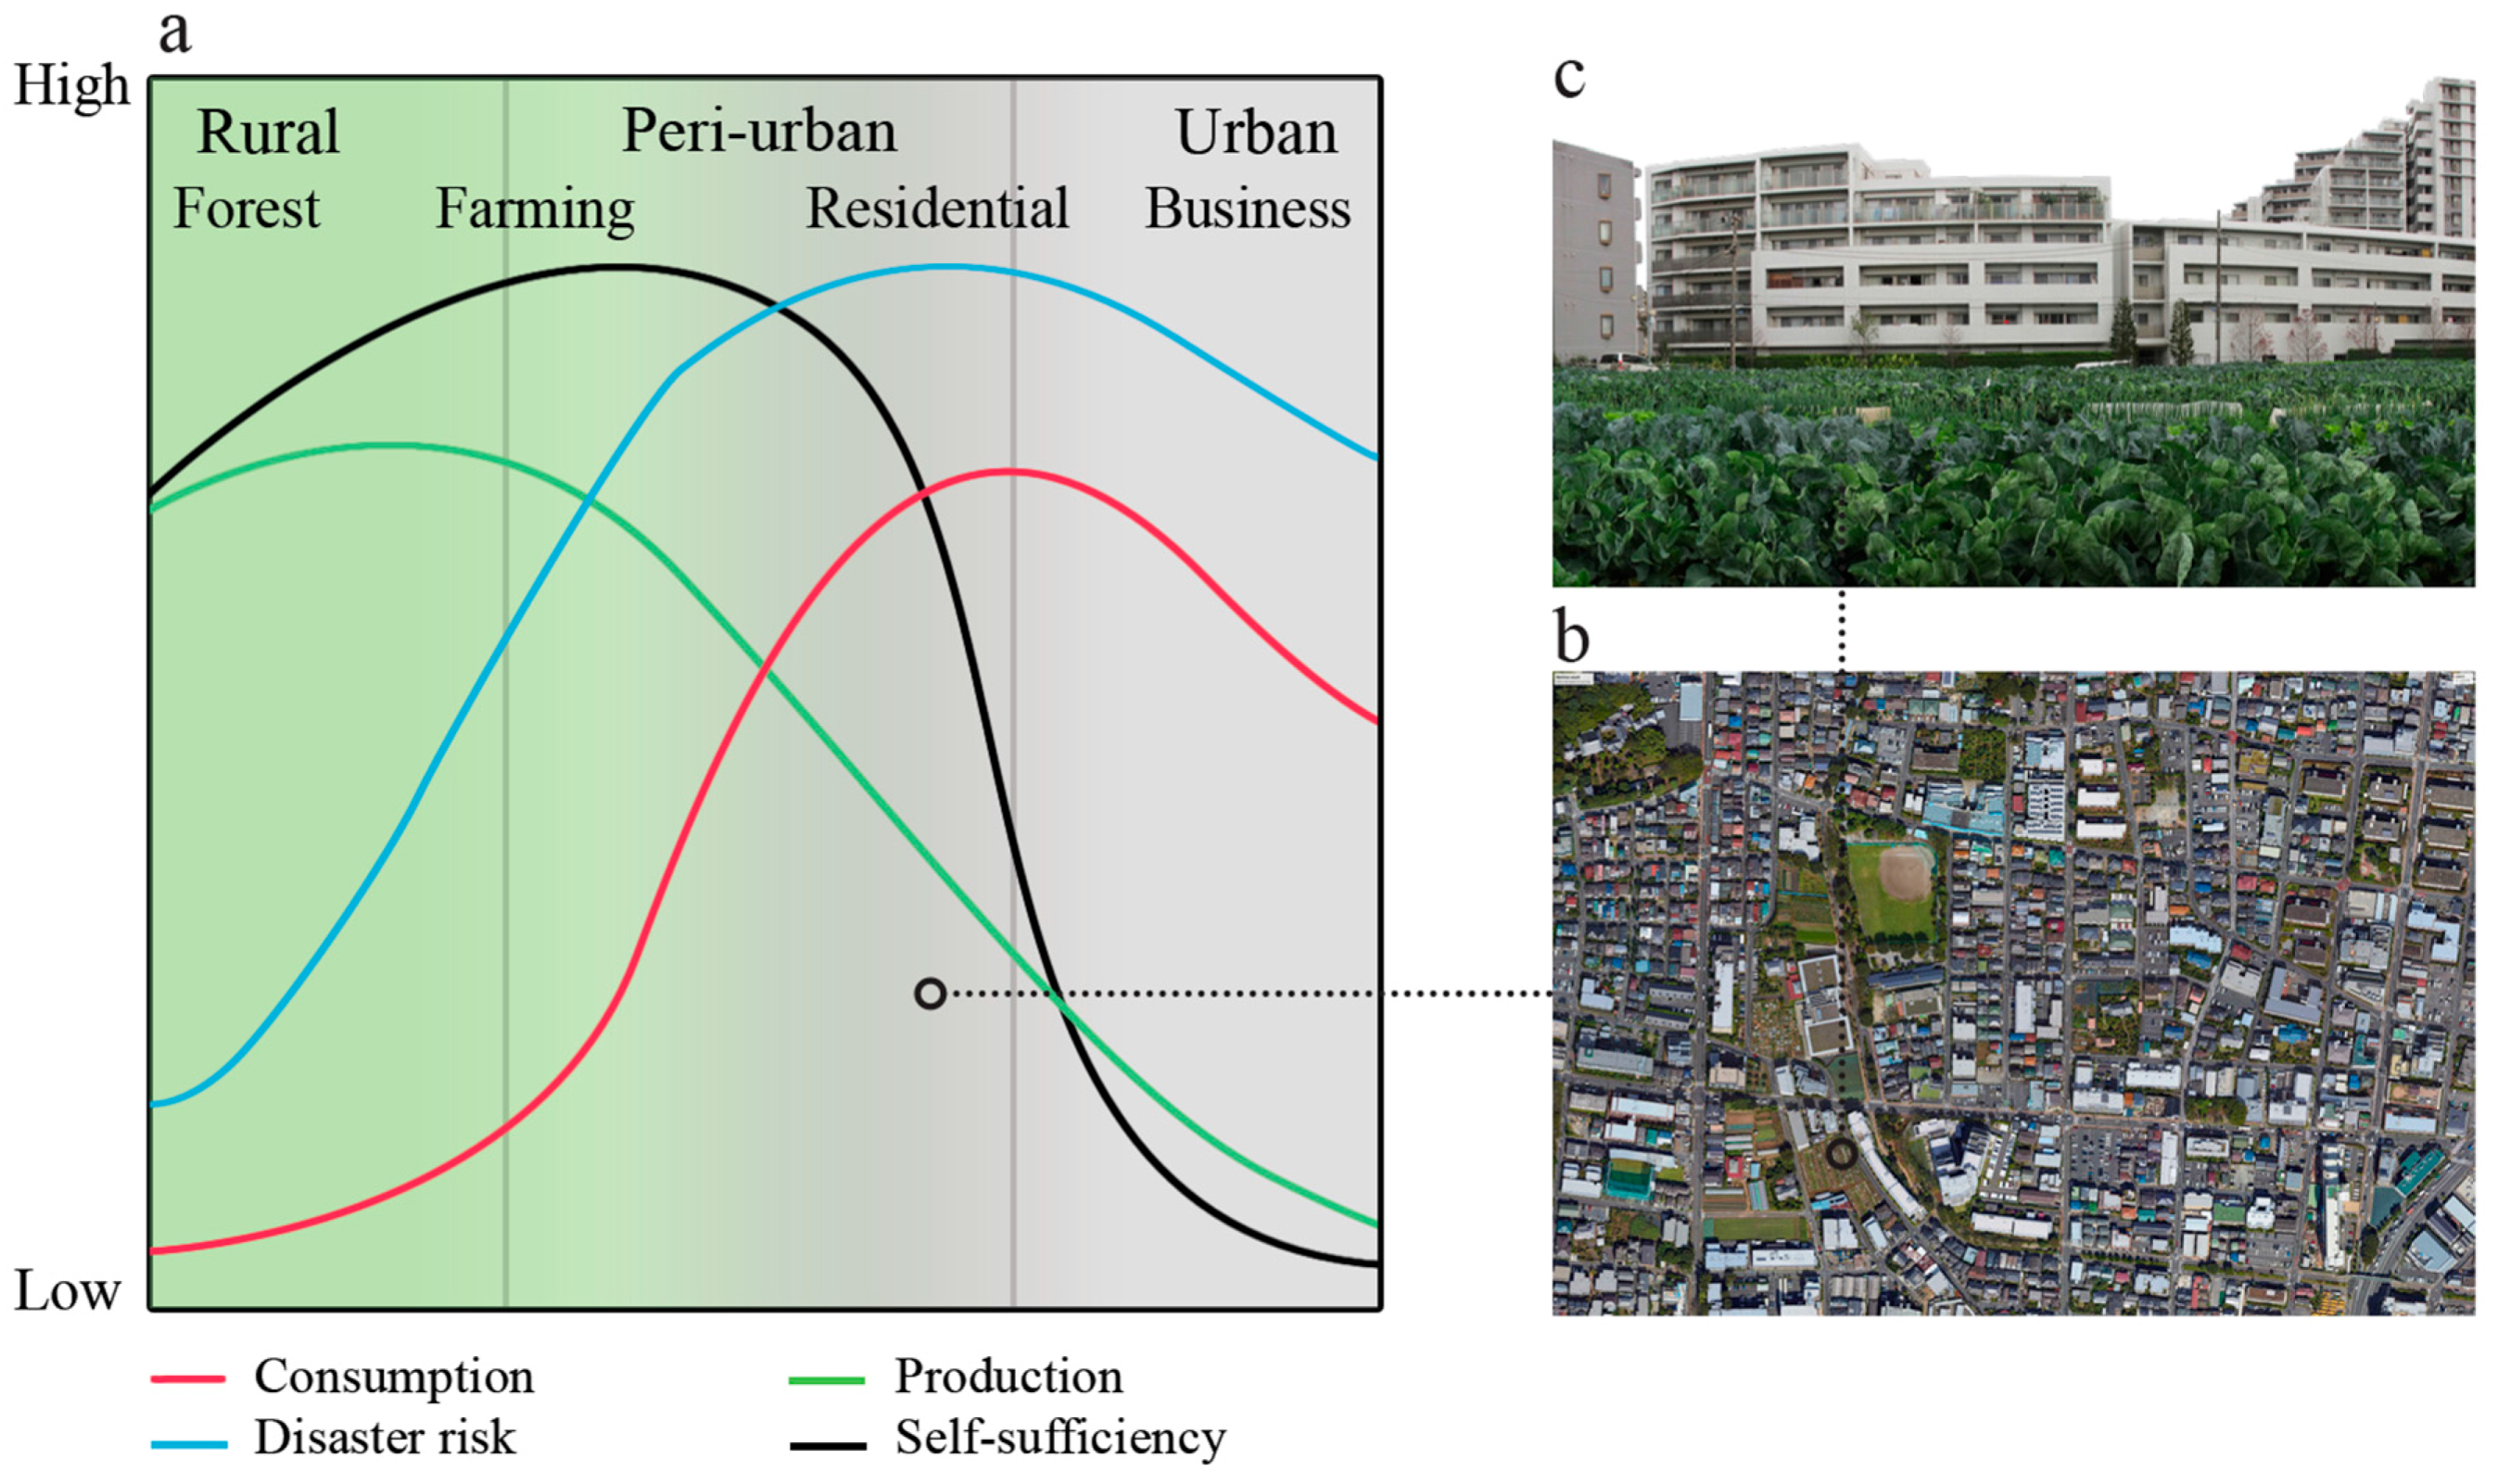
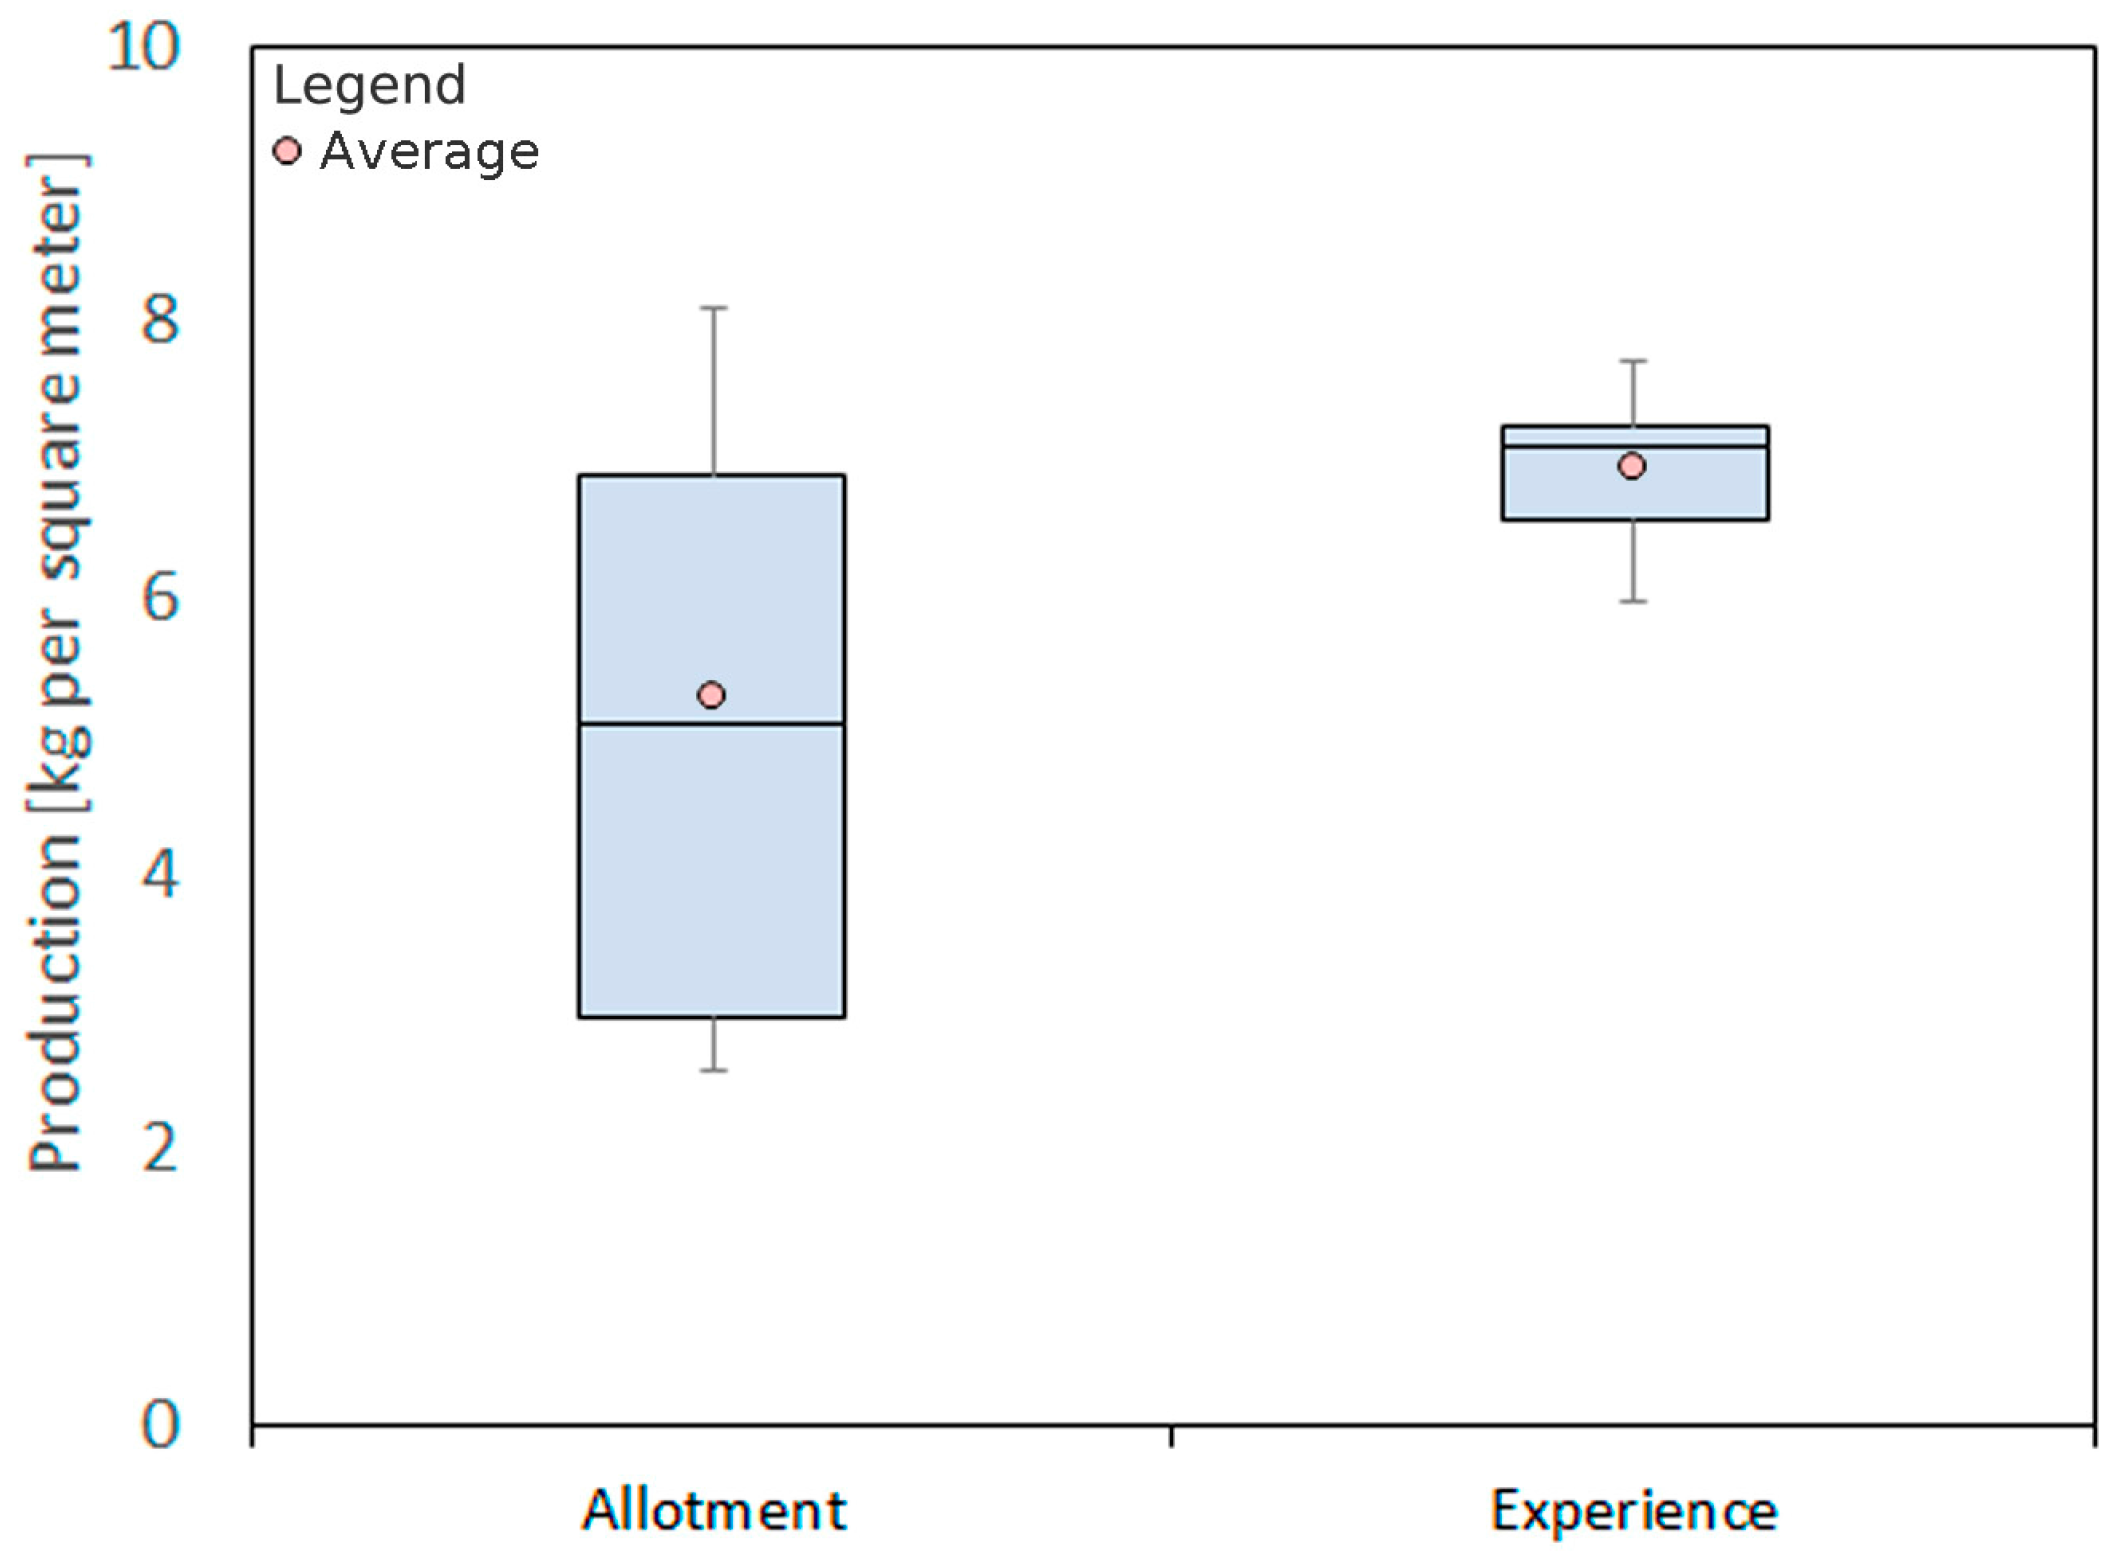
Table 1.
Description of selected land use types and their visual characteristics.
| No. | Producer | Land Use Type | Description [37,43,46,47] | Visual Characteristics |
|---|---|---|---|---|
| 1 | Professional | Vegetable field [42] * | Vegetable production similar to that of rural farmers but located in urban area | Field with a limited type of crops planted in long rows |
| 2 | Orchard [42] * | Fruit production from trees by professionals | Field with trees planted over regular distances | |
| 3 | Hobby | Allotment [37,43] | Land owner (e.g., government, private, farmer) rents out a plot of land to hobby farmers for the production of a variety of vegetables | Subdivided field of mostly rectangular small plots with a high variety of crops within each plot. No continuity in design with neighboring plots |
| 4 | Experience [37,43] | Cultivation by hobby farmer under guidance of professionals with fixed crop plan and maintenance scheme | Subdivided field with rectangular designed plots that have regular sizes and that contain a homogenous planting of crops similar over all individual plots | |
| 5 | Others (potential scenario) | Stable vacant land [42] * | This is a long-term vacant lot that has not been changed from another land use since 2010 to 2015 as documented by TMG | Vacant field that serves as open space. Each vacant lot has different visual characteristics such as temporary use as parking space, grassland, etc. |
* Professional UA (vegetable fields and orchards) and stable vacant lots were derived from the land use section of the Tokyo Metropolitan Government.
Table 2.
Land use categorization according to land use dominance and the presence of farmland.
| Type | Dominant Land Use | Farmland | Description |
|---|---|---|---|
| A | Urban | No | Residential houses, condominiums, or office buildings |
| B | Urban | Yes | Unplanned scattered development with a land uses mixture |
| C | Open space | No | Parks, vacant lands, or fields |
| D | Open space | Yes | Parks, vacant lands, or fields |
| E | Forest | No | Mountainous western area |
| F | Forest | Yes | Western area |
Table 3.
Selected per capita mean daily reference intakes of selected nutrients [56].
Table 3.
Selected per capita mean daily reference intakes of selected nutrients [56].
| Nutrient | Male | Female |
|---|---|---|
| Vitamin A (μg) | 900 | 700 |
| Vitamin K (μg) | 150 | 150 |
| Vitamin C (mg) | 100 | 100 |
Table 4.
Current and potential identified land uses in Tokyo for UA.
| Scenario | Land Use Type | Mean Size Per Plot [m2] | Plots [n] | Area [m2] | |
|---|---|---|---|---|---|
| Current (Figure 1) | Professional | Vegetable field | 571 | 34,607 | 39,455,099 |
| Orchard | 616 | 14,166 | 14,749,526 | ||
| Hobby | Allotment | 1115 | 415 | 496,172 | |
| Experience | 1949 | 75 | 161,295 | ||
| Potential (Figure 2) | Stable vacant land | 153 | 29,508 | 24,773,106 | |
| Total | 78,771 | 79,635,198 |
Table 5.
Fruit and vegetable self-sufficiency according to land use categorization.
| Factor | A | B | C | D | E | F | |
|---|---|---|---|---|---|---|---|
| Current | Min | 0 | 0 | 0 | 0 | 0 | 0 |
| Q1 | 0 | 0 | 0 | 2 | 0 | 27 | |
| Median | 0 | 3 | 0 | 6 | 0 | 105 | |
| Q3 | 0 | 8 | 0 | 12 | 0 | 324 | |
| Max | 0 | 599 | 0 | 298 | 0 | 12,739 | |
| IQR | 0 | 7 | 0 | 11 | 0 | 297 | |
| Upper Outliers | 1 | 51 | 0 | 9 | 0 | 32 | |
| Lower Outliers | 0 | 0 | 0 | 0 | 0 | 0 | |
| Potential | Min | 0 | 0 | 1 | 0 | 0 | 1 |
| Q1 | 1 | 2 | 4 | 10 | 0 | 82 | |
| Median | 1 | 7 | 5 | 27 | 20 | 249 | |
| Q3 | 2 | 15 | 38 | 74 | 160 | 561 | |
| Max | 27,132 | 764 | 8522 | 1120 | 651 | 13,775 | |
| IQR | 2 | 12 | 34 | 64 | 160 | 479 | |
| Upper Outliers | 20 | 59 | 3 | 11 | 1 | 32 |
Table 6.
Nutritional self-sufficiency according to land use categorization.
| Nutritional Self-Sufficiency [%] | ||||||||||
|---|---|---|---|---|---|---|---|---|---|---|
| Factor | Urban Land Uses without Farmland (A) | Urban Land Uses with Farmland (B) | Open Spaces without Farmland (C) | |||||||
| Vitamin | Vitamin | Vitamin | ||||||||
| A | K | C | A | K | C | A | K | C | ||
| Current | Min | 0 | 0 | 0 | 0 | 0 | 0 | 0 | 0 | 0 |
| Q1 | 0 | 0 | 0 | 0 | 0 | 0 | 0 | 0 | 0 | |
| Median | 0 | 0 | 0 | 1 | 3 | 2 | 0 | 0 | 0 | |
| Q3 | 0 | 0 | 0 | 3 | 8 | 7 | 0 | 0 | 0 | |
| Max | 0 | 0 | 0 | 308 | 861 | 525 | 0 | 0 | 0 | |
| IQR | 0 | 0 | 0 | 2 | 7 | 6 | 0 | 0 | 0 | |
| Upper * | 0 | 0 | 0 | 67 | 66 | 48 | 0 | 0 | 0 | |
| Lower * | 0 | 0 | 0 | 0 | 0 | 0 | 0 | 0 | 0 | |
| Potential | Min | 0 | 0 | 0 | 0 | 0 | 0 | 0 | 0 | 1 |
| Q1 | 0 | 0 | 0 | 1 | 1 | 2 | 1 | 1 | 2 | |
| Median | 0 | 1 | 1 | 2 | 4 | 5 | 3 | 4 | 7 | |
| Q3 | 1 | 2 | 3 | 4 | 11 | 11 | 16 | 28 | 46 | |
| Max | 19,589 | 34,238 | 56,625 | 311 | 866 | 533 | 104 | 162 | 269 | |
| IQR | 1 | 1 | 2 | 4 | 9 | 9 | 15 | 26 | 44 | |
| Upper * | 31 | 31 | 31 | 67 | 70 | 61 | 3 | 3 | 3 | |
| Lower * | 0 | 0 | 0 | 0 | 0 | 0 | 0 | 0 | 0 | |
| Factor | Open Spaces with Farmland (D) | Forest without Farmland (E) | Forest without Farmland (F) | |||||||
| Vitamin | Vitamin | Vitamin | ||||||||
| A | K | C | A | K | C | A | K | C | ||
| Current | Min | 0 | 0 | 0 | 0 | 0 | 0 | 0 | 0 | 0 |
| Q1 | 0 | 1 | 1 | 0 | 0 | 0 | 8 | 22 | 20 | |
| Median | 2 | 5 | 4 | 0 | 0 | 0 | 36 | 105 | 87 | |
| Q3 | 4 | 12 | 11 | 0 | 0 | 0 | 123 | 370 | 289 | |
| Max | 110 | 322 | 245 | 0 | 0 | 0 | 13,262 | 56,894 | 16,484 | |
| IQR | 4 | 11 | 10 | 0 | 0 | 0 | 116 | 348 | 268 | |
| Upper * | 12 | 11 | 9 | 0 | 0 | 0 | 31 | 37 | 30 | |
| Lower * | 0 | 0 | 0 | 0 | 0 | 0 | 0 | 0 | 0 | |
| Potential | Min | 0 | 0 | 0 | 0 | 0 | 0 | 0 | 0 | 0 |
| Q1 | 2 | 4 | 4 | 0 | 0 | 0 | 13 | 36 | 38 | |
| Median | 5 | 11 | 13 | 0 | 0 | 0 | 77 | 207 | 179 | |
| Q3 | 14 | 26 | 28 | 376 | 583 | 965 | 262 | 656 | 578 | |
| Max | 351 | 649 | 878 | 6,626 | 10,551 | 17,449 | 22,197 | 56,894 | 50,116 | |
| IQR | 12 | 22 | 24 | 376 | 583 | 965 | 248 | 620 | 539 | |
| Upper * | 9 | 9 | 9 | 2 | 2 | 2 | 37 | 34 | 38 | |
| Lower * | 0 | 0 | 0 | 0 | 0 | 0 | 0 | 0 | 0 | |
* Outliers.
Table 7.
In-depth results categorized according to each selected urban grid cell.
| Code | Municipality | Population [n] | Professional Production [kg] | Hobby Production [kg] | Self-Sufficiency [%] | Potential Self-Sufficiency [%] | |||||||||
|---|---|---|---|---|---|---|---|---|---|---|---|---|---|---|---|
| Male | Female | Vegetable | Fruit | All. | Exp. | Products | vit. A | vit. K | vit. C | Products | vit. A | vit. K | vit. C | ||
| A | Toshima-ku | 7792 | 7207 | 0 | 0 | 0 | 0 | 0 | 0 | 0 | 0 | 1.16 | 0.81 | 1.27 | 2.1 |
| B | Nerima-ku | 7694 | 7935 | 188,431.90 | 7216.99 | 18,533.84 | 89,166.25 | 13.29 | 5.15 | 14.5 | 9.01 | 14.68 | 7.38 | 18.97 | 14.79 |
| C | Shinjuku-ku | 2091 | 2641 | 0 | 0 | 0 | 0 | 0 | 0 | 0 | 0 | 2.39 | 1.06 | 1.63 | 2.7 |
| D | Tama-shi | 4679 | 4724 | 1817.04 | 28.74 | 0 | 0 | 0.13 | 0.02 | 0.08 | 0.12 | 24.3 | 5.28 | 8.25 | 13.63 |
© 2018 by the authors. Licensee MDPI, Basel, Switzerland. This article is an open access article distributed under the terms and conditions of the Creative Commons Attribution (CC BY) license (http://creativecommons.org/licenses/by/4.0/).
Share and Cite
MDPI and ACS Style
Sioen, G.B.; Terada, T.; Sekiyama, M.; Yokohari, M. Resilience with Mixed Agricultural and Urban Land Uses in Tokyo, Japan. Sustainability 2018, 10, 435. https://0-doi-org.brum.beds.ac.uk/10.3390/su10020435
AMA Style
Sioen GB, Terada T, Sekiyama M, Yokohari M. Resilience with Mixed Agricultural and Urban Land Uses in Tokyo, Japan. Sustainability. 2018; 10(2):435. https://0-doi-org.brum.beds.ac.uk/10.3390/su10020435
Chicago/Turabian StyleSioen, Giles Bruno, Toru Terada, Makiko Sekiyama, and Makoto Yokohari. 2018. "Resilience with Mixed Agricultural and Urban Land Uses in Tokyo, Japan" Sustainability 10, no. 2: 435. https://0-doi-org.brum.beds.ac.uk/10.3390/su10020435
Note that from the first issue of 2016, this journal uses article numbers instead of page numbers. See further details here.