Article

Carbon Chemistry in the Mainstream of Kuroshio Current in Eastern Taiwan and Its Transport of Carbon into the East China Sea Shelf

1
Key laboratory of Marine Ecology and Environmental Sciences, Institute of Oceanology, Chinese Academy of Sciences, Qingdao 266071, China
2
University of Chinese Academy of Sciences, Beijing 100049, China
3
Function Laboratory of Marine Ecology and Environmental Sciences, Qingdao National Laboratory of Marine Science and Technology, Qingdao 266237, China
*
Authors to whom correspondence should be addressed.
Sustainability 2018, 10(3), 791; https://0-doi-org.brum.beds.ac.uk/10.3390/su10030791
Submission received: 19 January 2018 / Revised: 6 March 2018 / Accepted: 7 March 2018 / Published: 13 March 2018
(This article belongs to the Special Issue Marine Carbon Cycles)

Abstract

:
Comprehensive carbon chemistry data were measured from the mainstream of Kuroshio, off eastern Taiwan, in May 2014. Results indicated that variations of pH@25 °C, POC, ΩCa, DIC, pCO2 and RF were closely related to the characteristics of various water types. Phytoplankton photosynthesis played important roles in DIC variation in Kuroshio Surface Water (KSW), whereas the DIC variation in Kuroshio Subsurface Water (KSSW) was probably influenced by the external transport of DIC-enriched water from the South China Sea. Vertical profiles of hydrological parameters and carbonate species indicated that the Kuroshio Current off eastern Taiwan could intrude into the ECS shelf as far as 27.9° E, 125.5° N in spring. What is more, the KSW, KSSW and Kuroshio Intermediate Water (KIW) could convey DIC into the East China Sea (ECS) with flux of 285, 305 and 112 Tg C/half year (1 Tg = 1012 g), respectively. The relevant flux of POC was 0.16, 2.93 and 0.04 Tg C/half year, respectively. Consequently, the intrusion of Kuroshio could probably exert a counteracting influence on the potential of CO2 uptake in the ECS, which needs further study.

1. Introduction

Human activities have produced a 45% increase of carbon dioxide (CO2) in the atmosphere, from 280 ppm in 1750 to 405 ppm in 2017. The ocean plays a significant role in uptaking anthropogenic CO2, since about one-third of anthropogenic CO2 is stored in the ocean [1]. Characteristics of continental shelves and/or marginal seas in the global carbon budget have been investigated substantially during recent decades, mainly because of their potential capacity for absorbing the ever-increasing atmospheric CO2 value and regulating the global CO2 inventory [1,2,3,4].
The East China Sea (hereafter referred to as ECS) is known as one of the largest temperate continental shelf seas in the world, which covers a shelf area (water depth < 200 m) of about 0.5 × 10⁶ km2. Being as the transition zone between the largest continent—Eurasia—and the biggest ocean—the Pacific—the ECS has always been considered a significant sink for atmospheric CO2 [5,6,7,8,9,10,11,12]. In the 1990s, Japanese scientists first reported the CO2 sink/source terms of ECS, based on their limited survey conducted in the “PN line” [13,14]. Thereafter, Chinese scientists launched large-scale field surveys to study the air-sea CO2 exchanging process in ECS [5,7,9,10,15,16]. After entering the 21st century, a series of achievements relating to the CO2 sink/source in ECS have been obtained, including understanding of the seasonal variation patterns and controlling factors of carbon cycling in the Changjiang estuary and its adjacent region [17,18,19,20,21], the difference of seawater carbonate conditions within the Yellow Sea [12,22], the potential evolution trends in ECS under increasing anthropogenic activities and the relevant influence for air-sea CO2 exchanging flux [7,15,23].
New insights into the air-sea CO2 exchanging process obtained in the ECS are of important guiding significance for exploring carbon cycling in various continental shelf seas of the world. For example, a study conducted in ECS in the summer revealed that the reason some heterotrophic marginal seas could act as significant CO2 sinks was because of high biological productivity and concurrent intensive seasonal stratification [8,24]. What is more, extrapolating from observations conducted in the ECS, Tusungai et al. (1999) proposed the concept of “continental shelf pump” to explain why the ECS could absorb atmospheric CO2 at a very high rate (2.92 mol C/m2/yr1) and suggested the continental shelf pump would account for a net oceanic uptake of CO2 in the flux of 1.0 Pg C/yr, if the whole global continental shelf could absorb atmospheric CO2 at the rate they obtained in the ECS [14].
Much research has already proven that the air-sea CO2 exchanging process and the CO2 source/sink pattern of the ECS are affected significantly by terrestrial material [17,25], which enters into the ECS substantially through the discharge of Changjiang River. The Changjiang River (also known as the Yangtze River), the world’s fourth largest river, empties into the northwest part of the ECS and brings abundant fresh water, sediment, nutrient and organic matter into the ECS shelf [26,27]. However, apart from terrestrial material, the ecological environment of the ECS is also regulated profoundly by geochemical dynamics from the open sea [28]. The Kuroshio Current, the boundary of subtropical gyre in the western Pacific Ocean, transports a massive amount of warm, saline water and nutrients (e.g., NO3, PO43− and SiO32−) into the ECS shelf and may serve as a major nutrient source for primary production in the ECS shelf [29,30,31]. Numerical studies have already proven that the nearshore Kuroshio branch current could even reach as far as the nearshore area within the 50m-isobath near 30.5° N and has affected the coastal ecosystem profoundly [31]. What is more, the intrusion of Kuroshio and its related variations are considered an important inducement for algal blooms and hypoxia in nearshore region of the ECS [31,32].
Enormous efforts have been made to study the effects of the Kuroshio Current on potential CO2 sequestration in the ECS, on the basis of multidisciplinary projects conducted in the sea surrounding Taiwan [16,33,34,35]. The latest study suggests that the northwardly flowing Kuroshio Current could transport about 6.5 × 10¹² g of biologically mediated DIC annually into the ECS [34], which accounted for about 22% to 50% of the CO2 uptake rate (13~30 × 1012 g C/yr) in the ECS [5]. It was estimated that this input of DIC would lead to an increase of DIC/TA and Revelle factor for 3% and 15.5%, respectively. Hence, the importing of the Kuroshio Current would exert a counteracting influence on the capacity of CO2 absorbance in the ECS [34]. However, the DIC flux evaluated in the above-mentioned research was derived totally in the summertime, when the intrusion of the Kuroshio into the ECS was most intensive. Yet the temporal variability of Kuroshio in other seasons and the fluxes for other species of carbonate parameters, such as particulate organic carbon (POC), were not considered [34].
The main purpose of this study is, therefore, to investigate the variations of diverse carbonate parameters (e.g., pH, pCO2, DIC and POC) and to assess the controlling effects of environmental factors on them in the mainstream of Kuroshio off eastern Taiwan. Moreover, we also determined the intrusion pattern of Kuroshio into the ECS shelf during spring time, when the intrusion of Kuroshio just began to appear [36], based on evidence from carbon chemistry and also estimated the transports of various carbonate parameters from the Kuroshio off eastern Taiwan into the ECS shelf during that time.

2. Materials and Methods

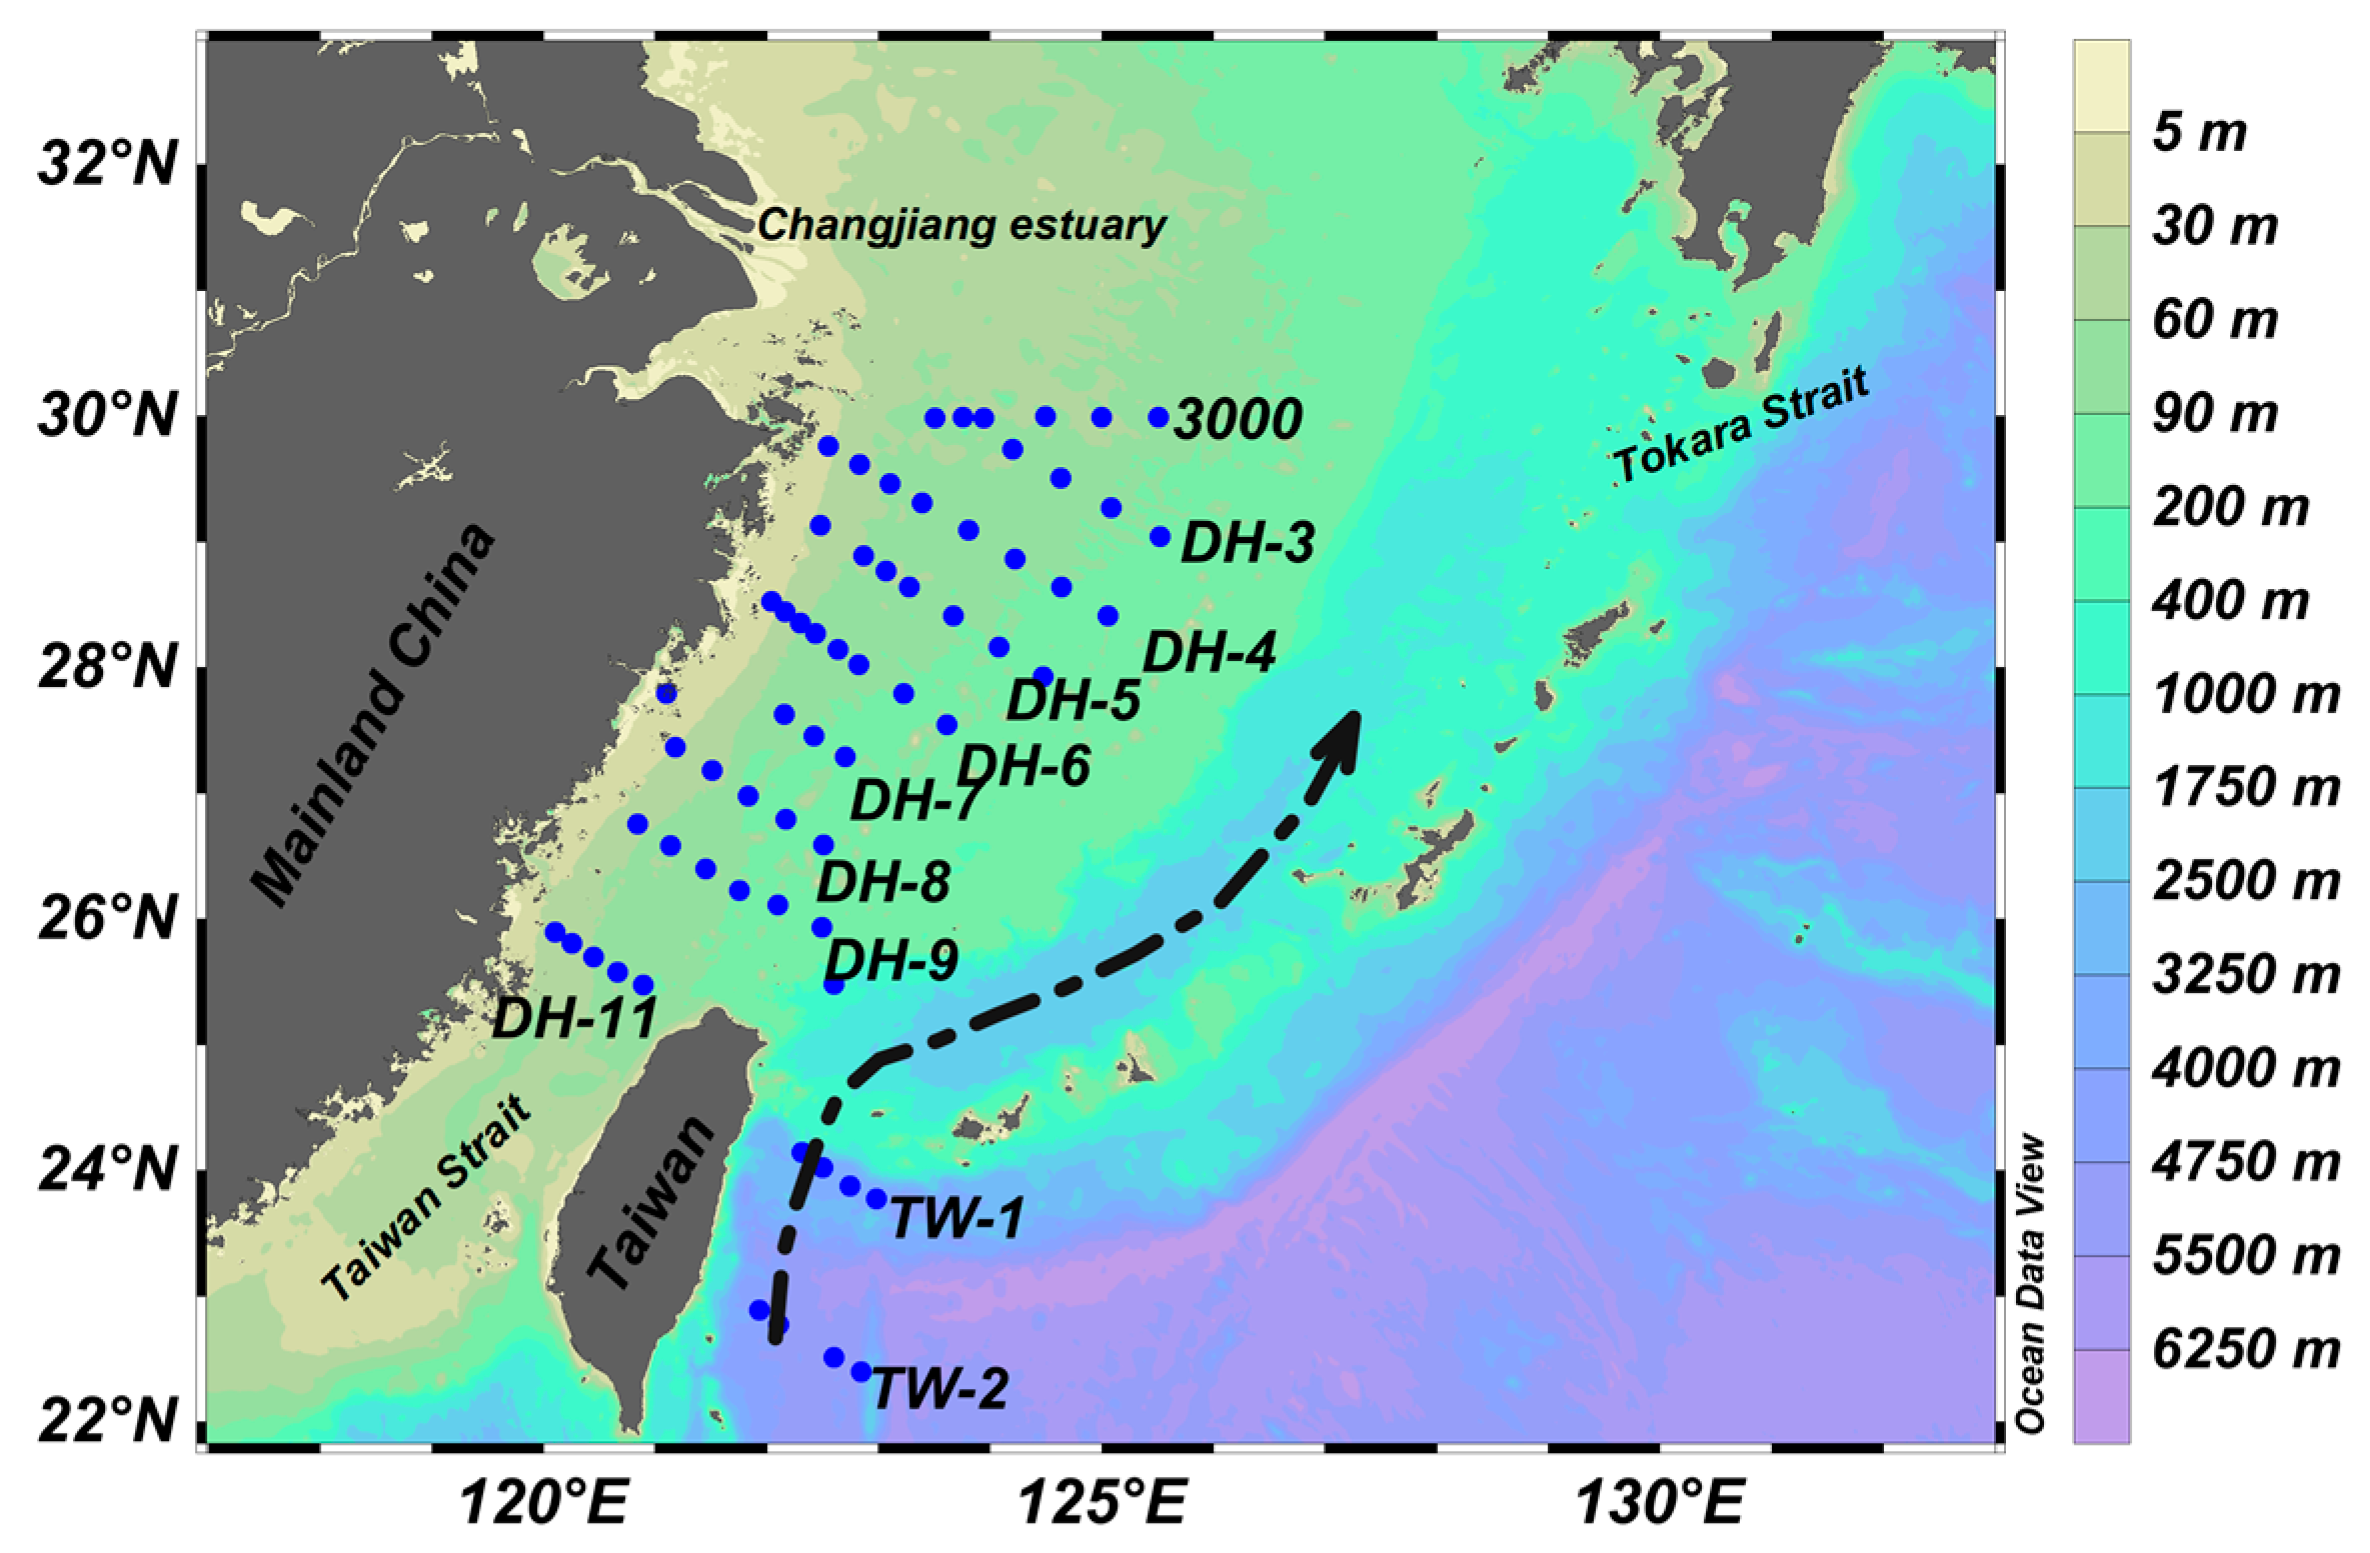
2.1. Study Area Description

The East China Sea (ECS, 23°00′–33°10′ N, 117°11′–131°00′ E) is a broad temperate continental marginal sea surrounded by Mainland China, Taiwan, South Korea, Kyushu and Ryukyu Islands, an area 66% of which is located on the flat continental shelf (Figure 1). It is one of the largest marginal seas located in the western Pacific and is an extremely dynamic sea that is influenced by various currents, such as the South China Sea (SCS) water passing through the Taiwan Strait (TS), the Yellow Sea (YS) water from the Yellow Sea Coastal Current (YSCC). The largest river of Asia, the Changjiang River, flows into the ECS with an annual average water discharge of about 940 km3/yr [37]. Moreover, the East Asian monsoon generally regulates the seasonal variation of precipitation and temperature of the ECS.
The Kuroshio Current primarily originates in the northward bifurcation of the North Equatorial Current off the east coast of the Philippines [38]. It enters into the ECS through the channel in the south of the Ryukyu Islands chain [39]. Influenced by the steep ECS continental slope, the mainstream of Kuroshio generally runs along the 200 m isobaths at a velocity of about 0.7~1.4 m/s [40] until it approaches the shoaling northern end of the Okinawa Trough, where it leaves from the shelf and turns east-southeastward. Finally, the mainstream of Kuroshio leaves from the continental margin around 129° E, 30.5° N and flows into the Pacific Ocean again through the Tokara Strait [41]. More importantly, model results indicated that there is a Kuroshio Bottom Branch Current to the northeast of Taiwan (KBBCNT), which upwells northwestward gradually from 300 m to 60 m in the region northeast of Taiwan, then turns northeast in the region around 27.5° N, 122° E and finally reaches 31° N off the Changjiang estuary following about 60 m isobaths, conveying saline, nutrient-rich Kuroshio Subsurface Water into the ECS shelf and even the Changjiang estuary [39].

2.2. Sampling and Analytical Methods

Field investigation was carried out in the continental shelf of the ECS and the eastern region of Taiwan on the R/V Kexue I from 18 May to 13 June 2014. A total of 55 investigation stations scattered evenly on the continental shelf of ECS and 8 stations located in the eastern of Taiwan, where the mainstream of Kuroshio flowed through (Figure 1). At each station, the recommended standard operating procedures described by Dickson et al. (2007) [42] and the methods of Chou et al. (2009a, 2009b) [7,8], Qu et al. (2017) and Zhai et al. (2014) [12,43] were adopted during the sampling and analytical processes. Generally, discrete seawater was sampled at seven to thirteen depths, with intervals of 10–500 m, using a rosette sampler with 10-liter Niskin sampling bottles, according to the bottom depth of each station. In the ECS, the sampling layers were 2 m (the surface layer), 10 m, 20 m, 30 m, 50m, 75 m, 100 m and 2 m above the seafloor (the bottom layer), while in eastern Taiwan, the sampling layers were 5 m (the surface layer), 30 m, 50 m, 75 m, 100 m, 150 m, 200 m, 300 m, 500 m, 800 m, 1000 m, 1500 m and 2000 m (the bottom layer).
The temperature (°C) and salinity (PSU) were recorded at each layer by a conductivity-temperature-depth (CTD) system (SBE-911 plus, Sea-Bird Electronics Inc., USA). The pH (the total hydrogen ion concentration scale) was measured on board at 25 ± 0.1 °C using a Orion Star™ and Star Plus meter (Thermo Electron, USA) with an Orion® Ross combination electrode (Thermo Fisher Scientific, USA), which was calibrated by buffers (2-amino-2-hydroxymethyl-1,3-propanediol (Tris) and 2-aminopyridine) prepared at a salinity of 35 [42]. The precision of the pH determination in this study was better than ±0.005 pH units [7,8] and the overall uncertainty was ±0.01 [43]. TA was measured using the method of Gran titration by way of an automatic potentiometric titrator (798 MPT Titrino, Metrohm, Switzerland), with a precision of 0.1–0.3% (±2 to ±6 μmol·kg−1). Certified reference material from Prof. Dickson was used for calibration and quality control in the TA measurements [42]. The determination of total chlorophyll a (Chl a) concentration was conducted using a Turner Designs Model 10 fluorometer [44]. Partial pressure of CO2 (pCO2), Revelle Factor (RF) and carbonate saturation state (ΩCa) were calculated from TA and pH by the CO2SYS program of Lewis and Wallace (1998) [45], adopting the carbonate dissociation constants proposed by Mehrbach et al. (1973) [46], which was refitted by Dickson and Millero (1987) [47]. What is more, the pH scale in our calculation process was adopted as the seawater scale. The value of KS, the dissociation constant for HSO4, was taken from Dickson (1990a) [48] and the value of KB (for boric acid) was taken from Dickson (1990b) [49]. The measurement of dissolved oxygen (DO) concentration was performed aboard using the Winkler titration method with a precision of 7 × 10⁻⁵ mg/L [50]. Particulate organic carbon (POC) in filtered particulate matter was determined with a C/N analyzer (Elementar, vario EL cube, German) after inorganic carbonate was removed with a precision of ±0.3 μmol/L [51].

3. Results

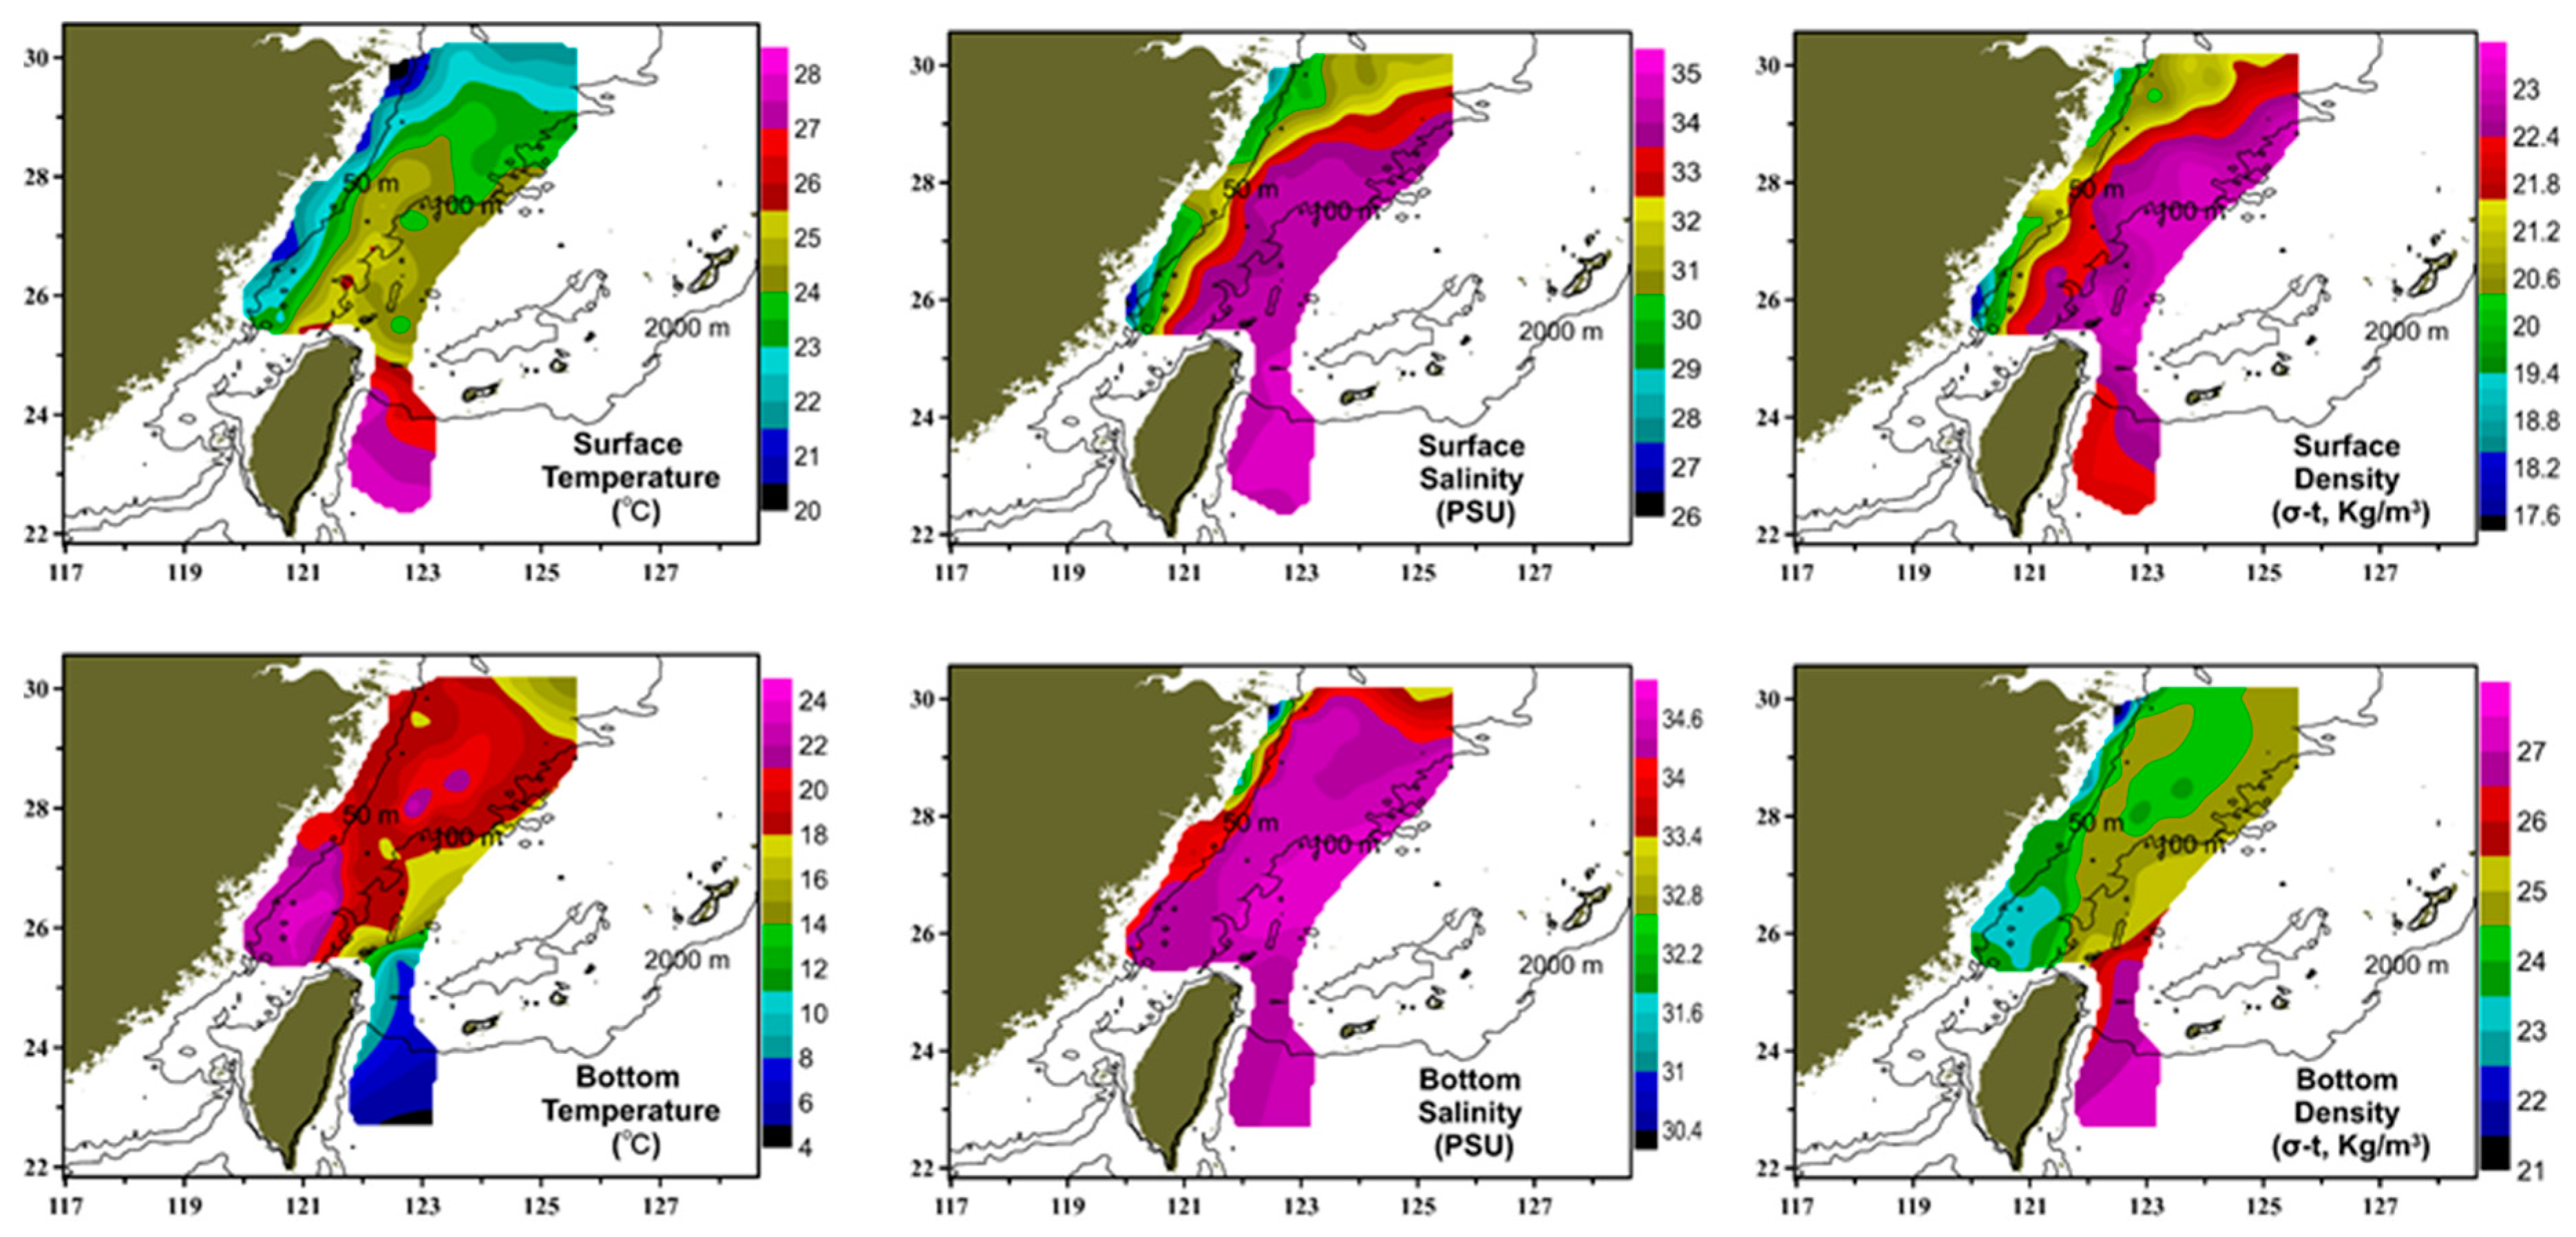
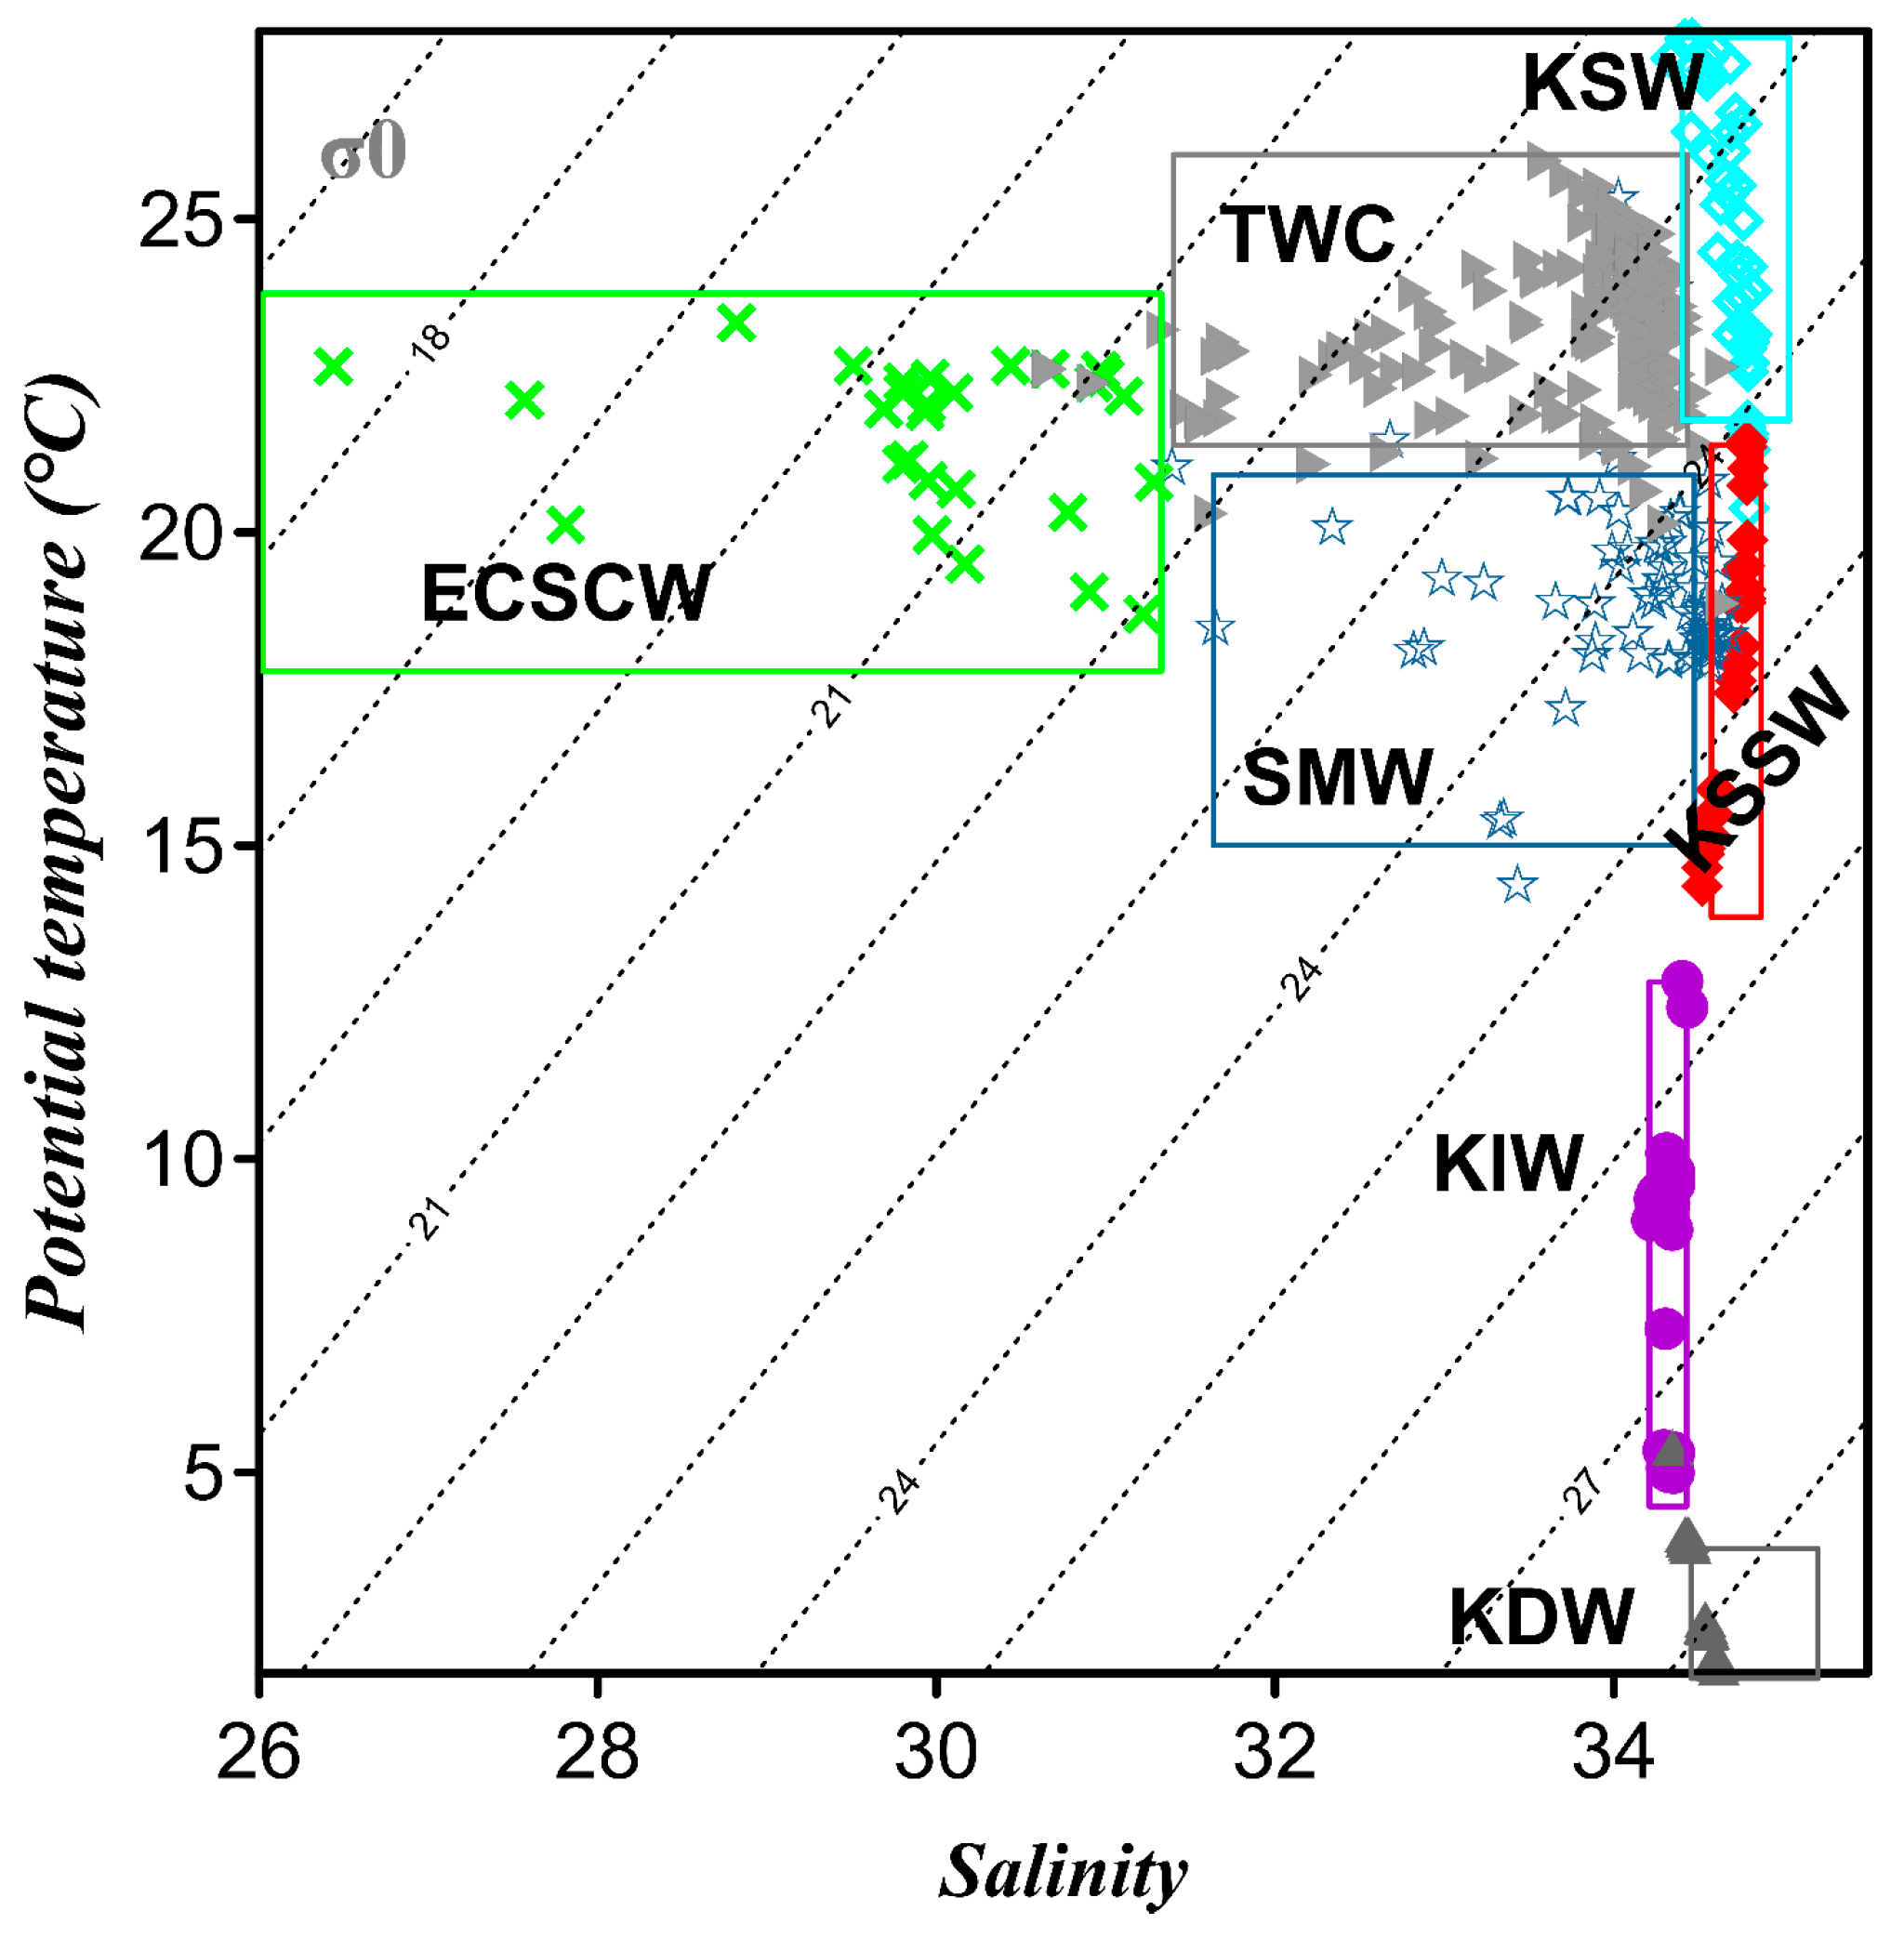
3.1. Hydrographic Characteristics and Water Types Classification

The spatial distributions of the hydrographic parameter (temperature, salinity and density (ρ)) in the surface and bottom water of the ECS shelf and the eastern Taiwan are presented in Figure 2. In the surface layer, low temperature (<22.0 °C), low salinity (<30.0 PSU) and low density (<20.5 kg/m3) water is confined to the nearshore region of the ECS (depth < 50 m). This kind of water is affected primarily by the Changjiang Diluted Water (CDW), which is created by the abundant freshwater discharged by Changjiang. The coverage of CDW could represent the impact strength of terrigenous input, to some extent. With increasing distance from the coastline, high temperature (>24.0 °C), high salinity (>33.0 PSU) and high density (>22.5 kg/m3) began to appear in the offshore shelf of the ECS (50 m < depth < 200 m) and eastern Taiwan (500 m < depth < 5000 m) (Figure 2). In the bottom layer, however, the nearshore area was provided with the highest temperature but the lowest salinity and density and the offshore shelf of the ECS had relatively higher temperature salinity and density. Bottom seawater in eastern Taiwan possessed the lowest temperature (0< T< 7 °C), highest salinity (about 34.0 PSU) and highest density (about 27 kg/m3) in our study area.
These above-mentioned variations of hydrographic parameters were closely related with the complicated circulation system of our studied region, which was basically composed of the Changjiang Diluted Water (CDW), the ECS Coastal Water (ECSCW), the Taiwan Warm Current (TWC) and the Kuroshio Current (KC) [52]. Based on the dataset of potential temperature (θ), salinity and potential density anomaly (σ0) we obtained, the water of the ECS and adjacent eastern Taiwan were categorized into seven water types (Figure 3 and Table 1 and Table 2). First of all, waters in the ECS were simply classified as the ECS Coastal Water (ECSCW), the Taiwan Warm Current (TWC) and the Shelf Mixed Water (SMW). The ECSCW usually possessed the lowest temperature (18.87 °C < T < 23.88 °C) and salinity (S ≤ 31) among the seven water masses because it was strongly affected by riverine fresh water from Changjiang. The TWC originated from the subtropics water and flowed into the southwest of the ECS through the Taiwan Strait. This water generally shared the same salinity scope (31.30 < S < 34.50) with the SMW but it was warmer than the SMW by about 5 °C on average (Figure 3 and Table 1). Waters off the eastern Taiwan were divided into four parts, including the Kuroshio Surface Water (KSW, water depth 0~100 m, similarly hereinafter) with the highest temperature and high salinity (averaged temperature and salinity was 25.68 °C and 34.62 respectively, similarly hereinafter), the Kuroshio Subsurface Water (KSSW, 100~300 m) with relatively lower temperatures and the highest salinity (19.12 °C and 34.75), the Kuroshio Intermediate Water (KIW, 400~800 m) with much lower temperatures and the lowest salinity (7.65 °C and 34.33) and the Kuroshio Deep Water (KDW, 1000~2000 m) with the lowest temperature and low salinity (2.86 °C and 34.53).

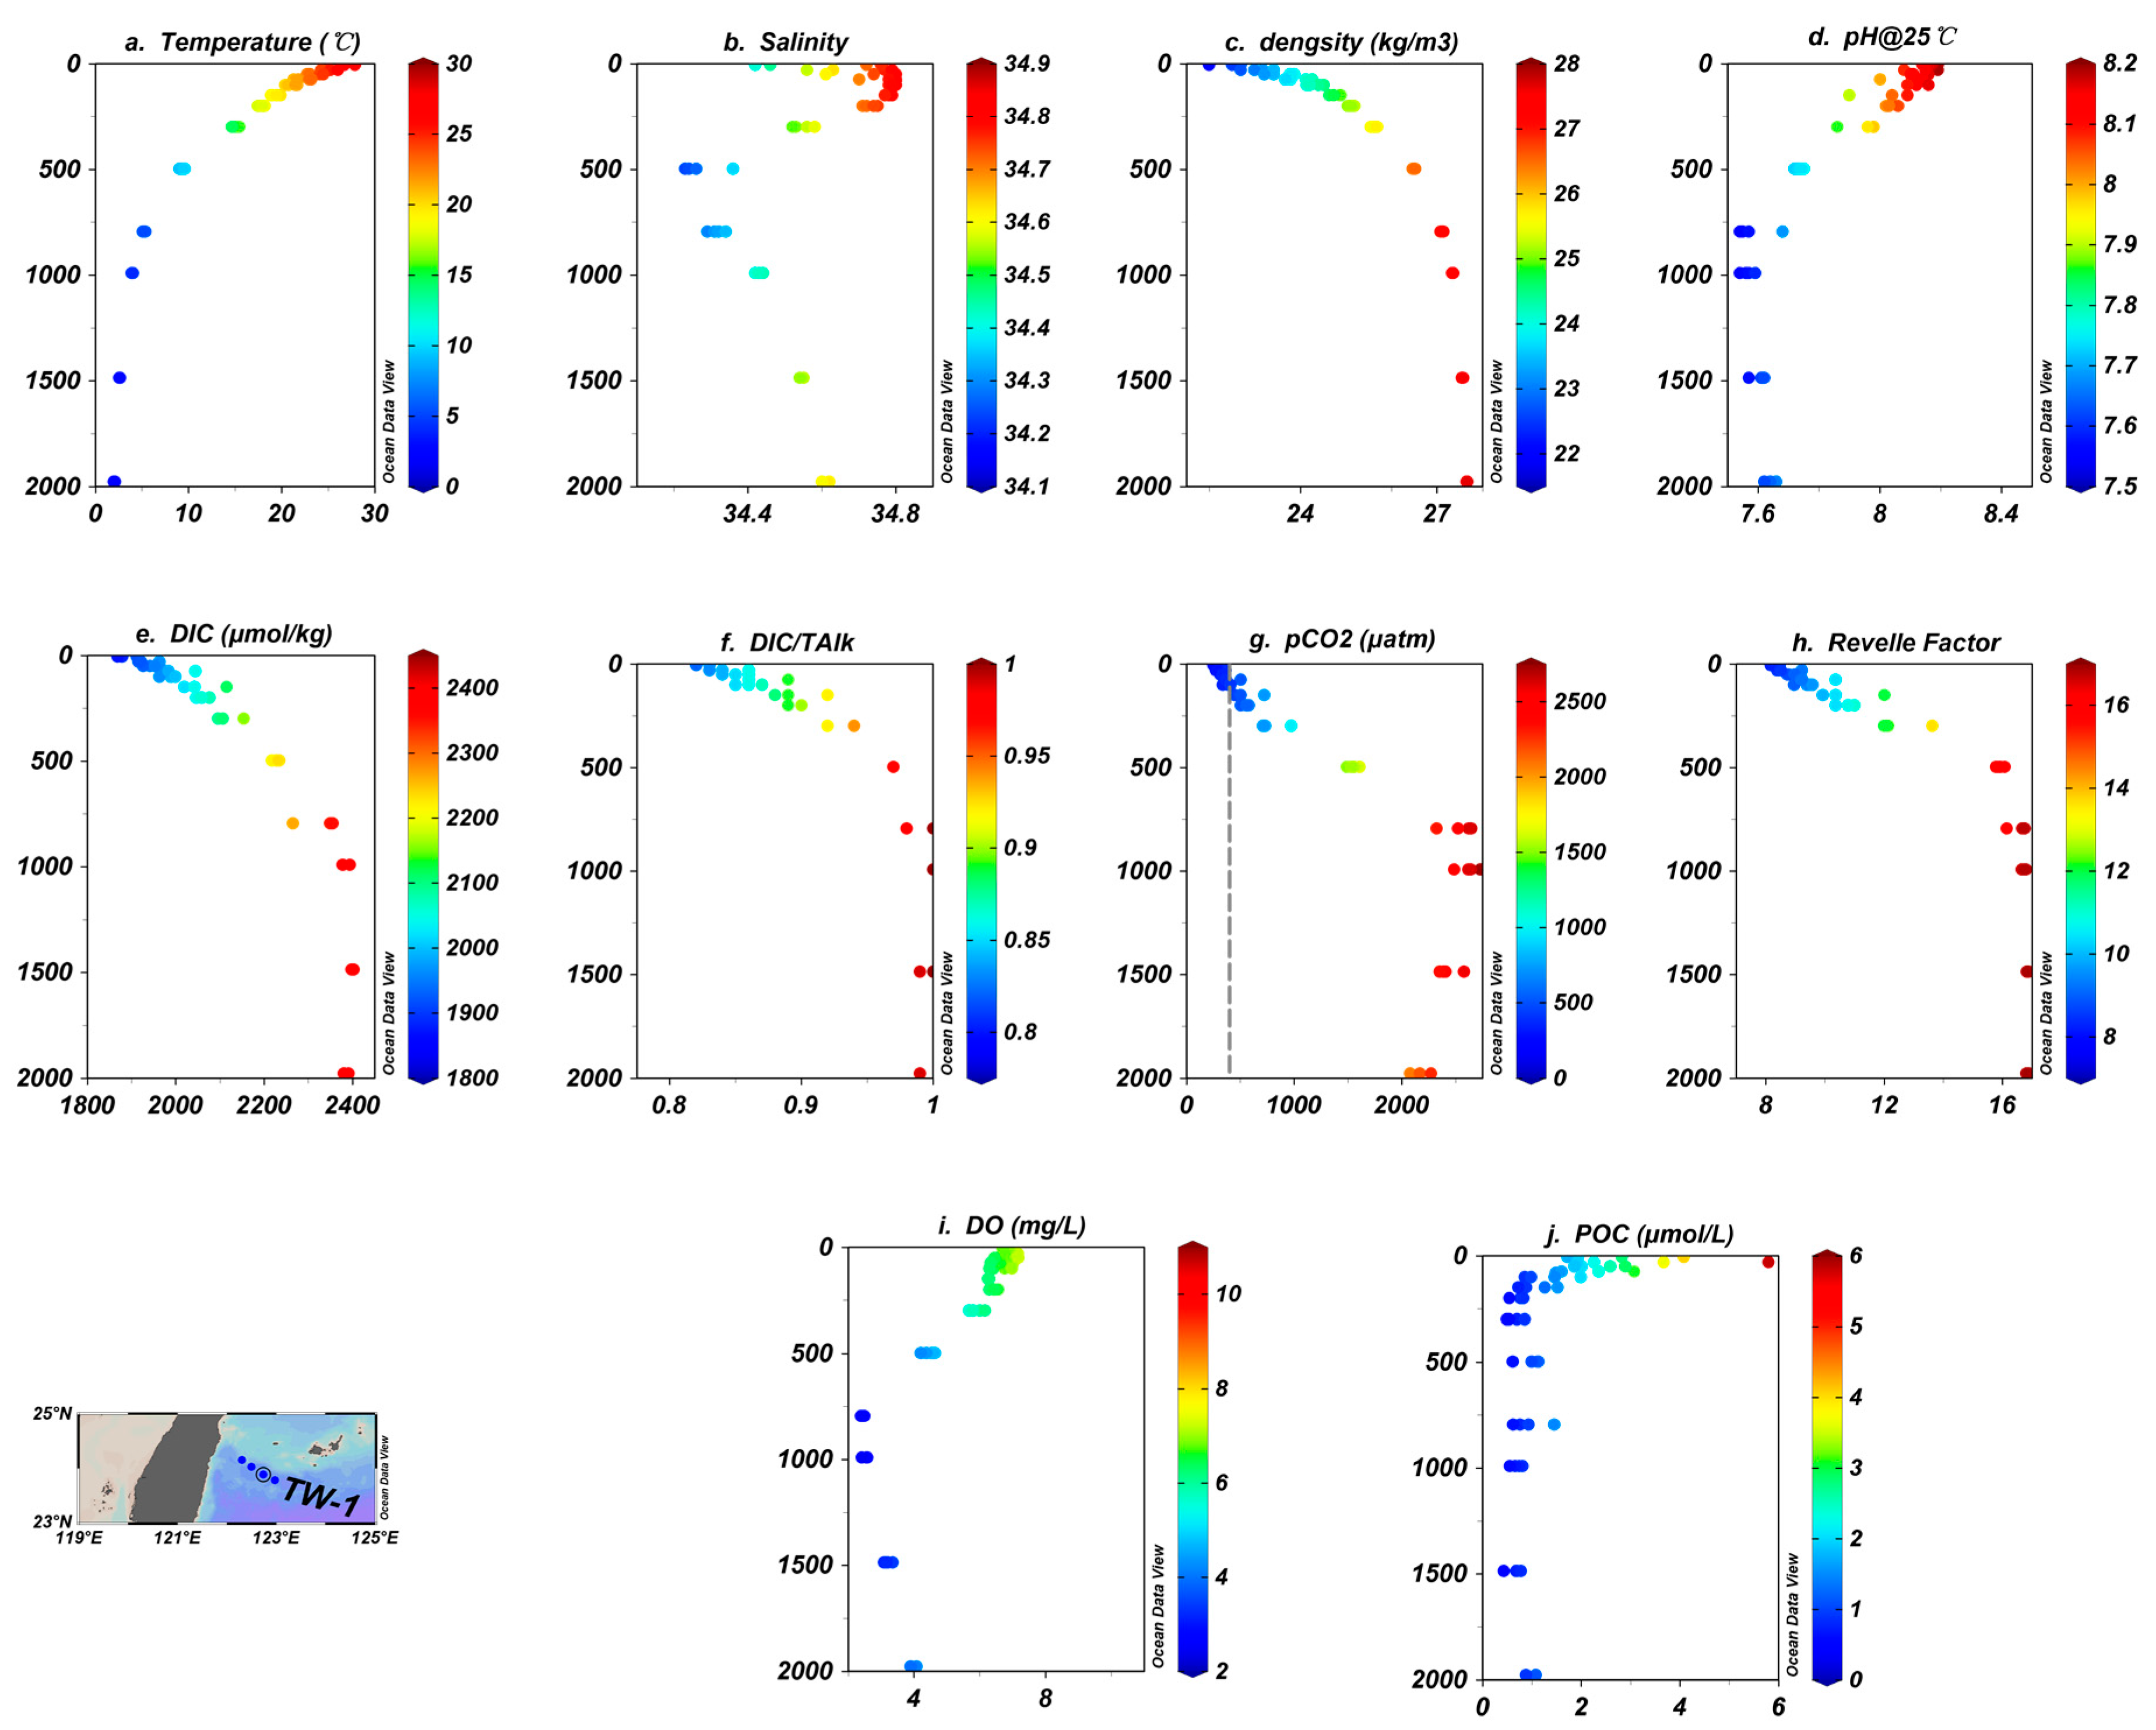
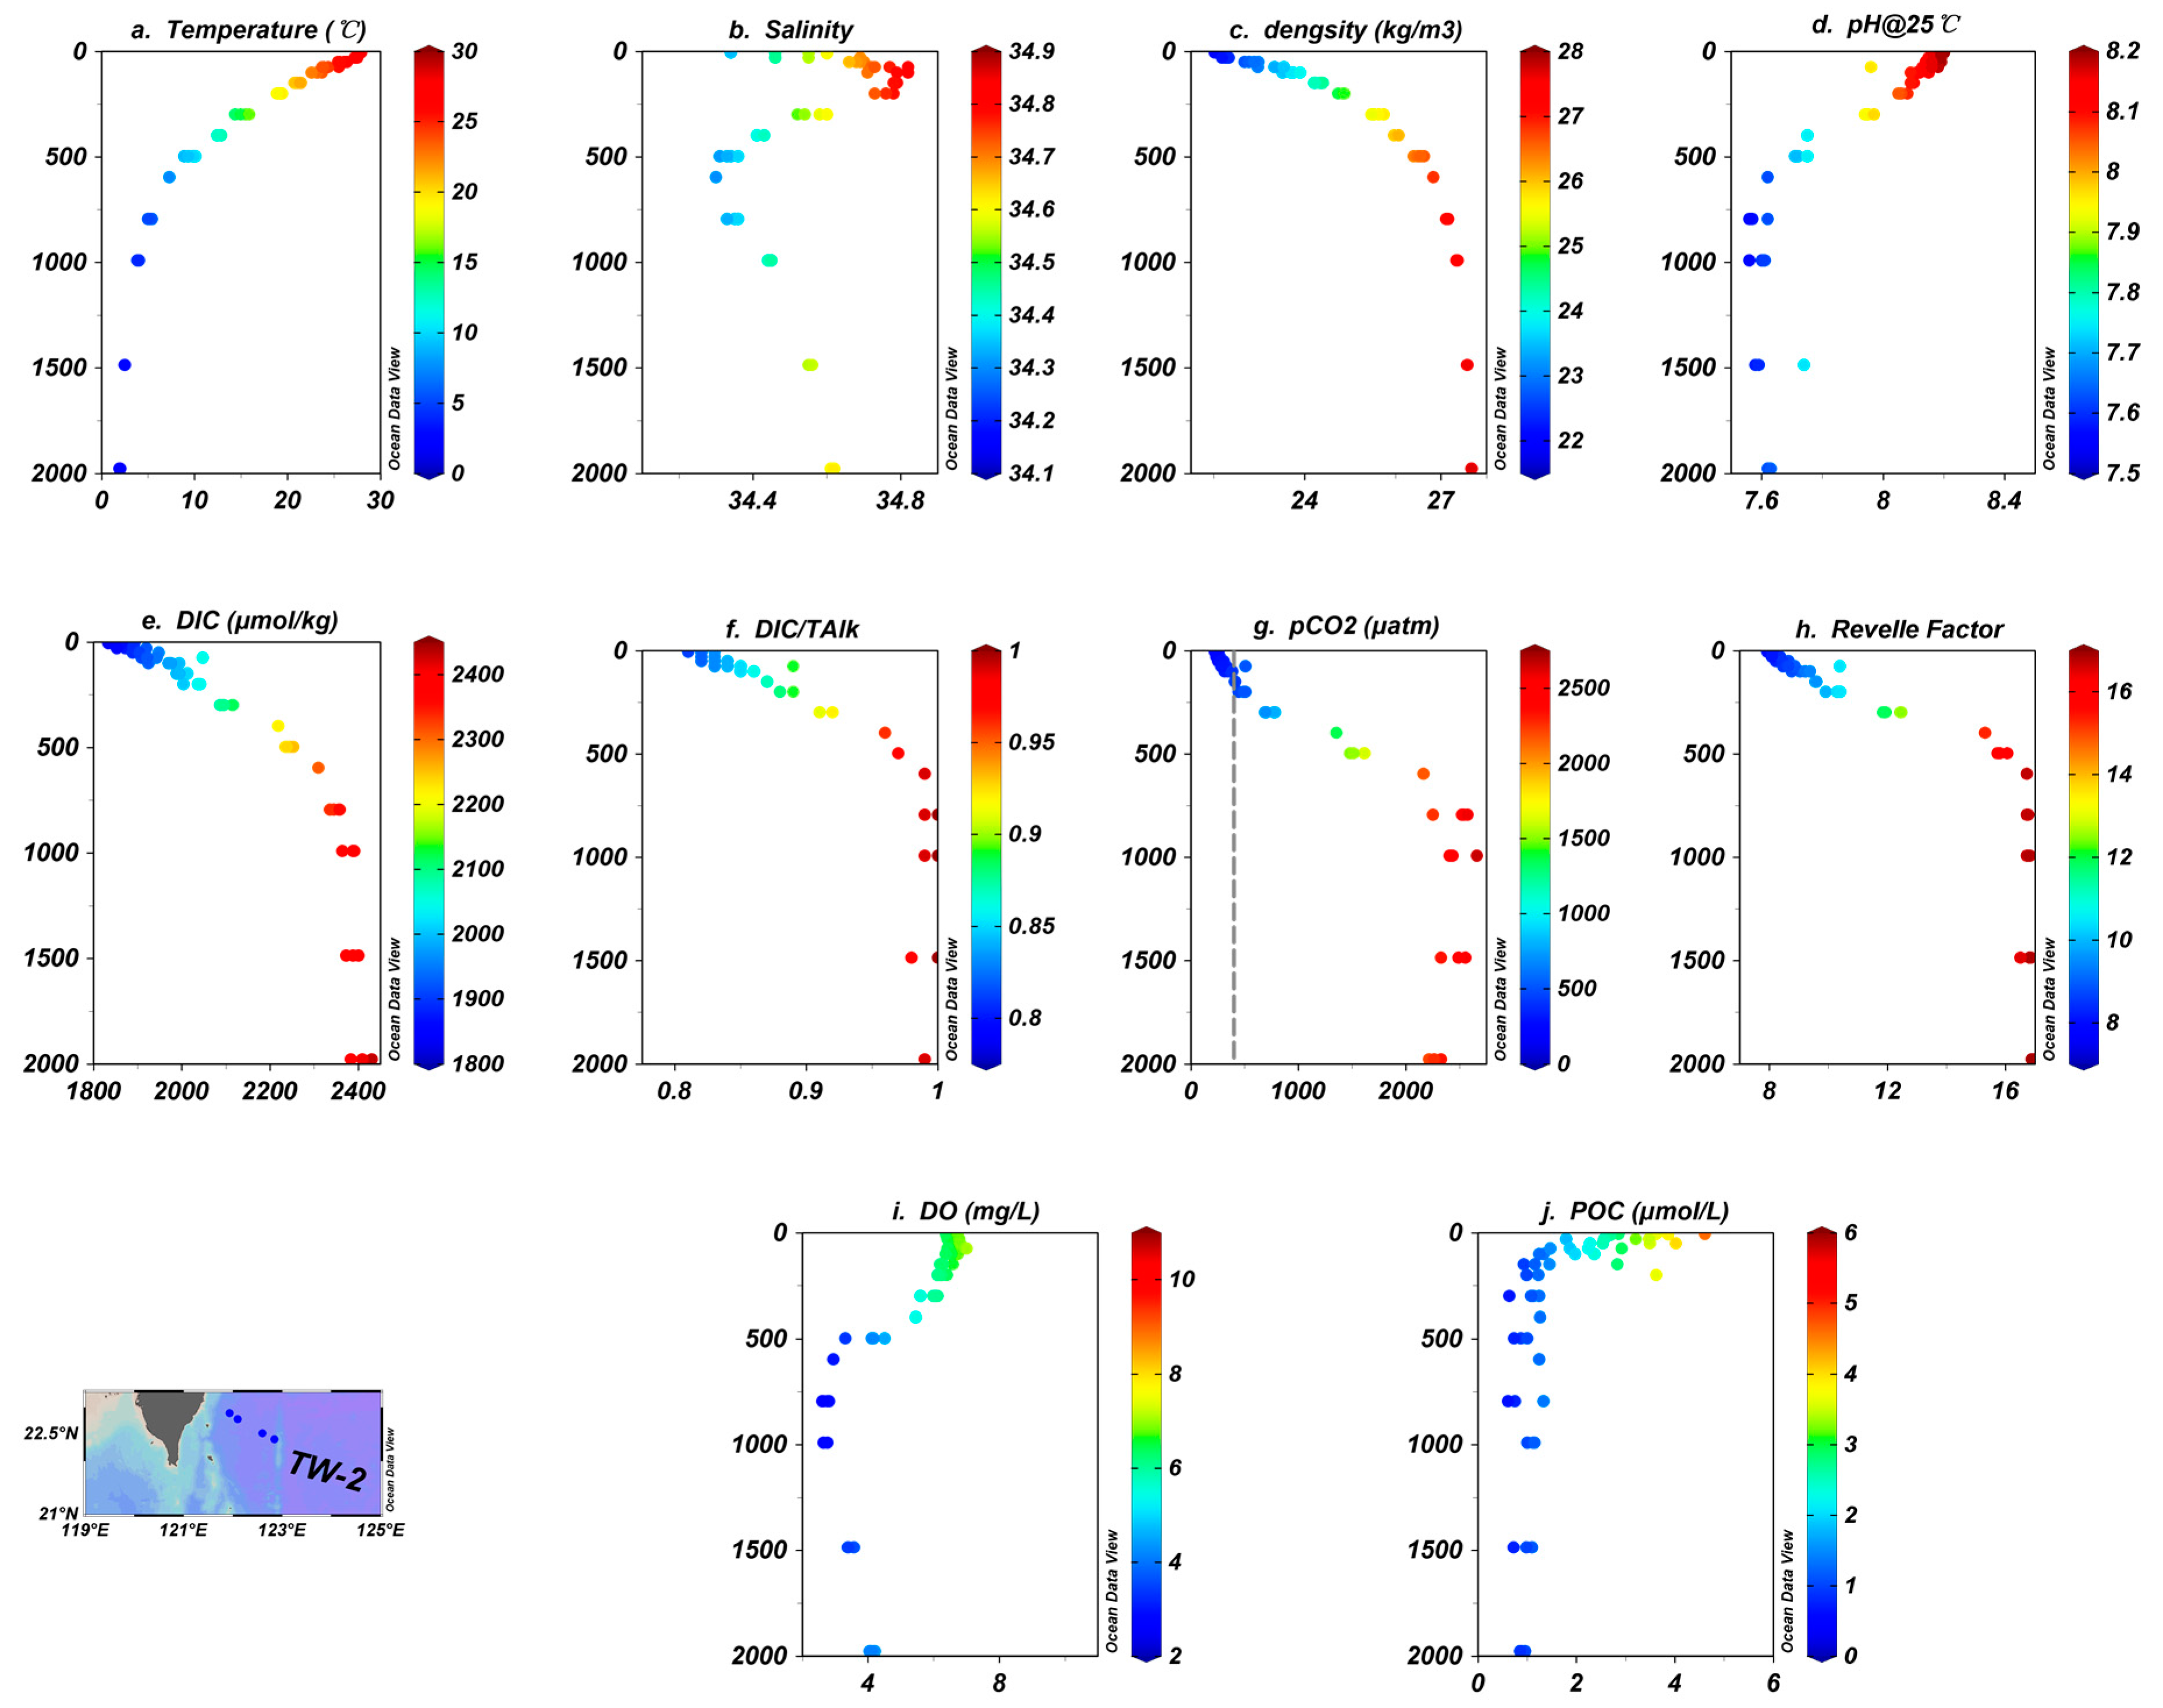
3.2. Profiles of Hydrological and Carbonate Parameters in Mainstream of Kuroshio off Eastern Taiwan

The continental margin off eastern Taiwan is the mainstream of the Kuroshio Current where it develops and intensifies to a strong western boundary current after leaving its source area east of Luzon Island. Due to the intensive island-continent collision, the seafloor topography in eastern Taiwan usually drops abruptly from the nearshore to more than 2000 m at a distance of only 40 to 50 km. Consequently, the concentration gradients of carbonate species across the mainstream of Kuroshio Current might be significantly. In the following paragraphs, we would present the vertical profiles of DIC (μmol/kg), pH@25 °C, DIC/TAlk, DO (mg/L), POC (μmol/L) and the calculated pCO2 (μatm) and Revelle Factor observed in the two transects of TW-1 and TW-2 (Figure 1). Together with the typical features of temperature (°C), salinity (PSU) and density (kg/m3), the carbonate characteristics in different parts of Kuroshio Current would be demonstrated.
As for the hydrological parameters, temperature, density and salinity ranged 1.88~27.95 °C, 22.03~27.68 kg/m3 and 34.24~34.83, respectively (Figure 4a–c and Figure 5a–c). Temperature decreased gradually with the increasing of water depth when it was shallower than 1000 m and basically held steady as the water was deeper than 1000 m. The density shown opposite vertical distribution pattern with temperature, which increased as the depth increased and also remained stable in water deeper than 1000 m. Salinity initially displayed an increasing trend in the above 150 m and then decreased in water column of 150~500 m. Furthermore, salinity turned to increase again when the water was deeper than 500 m.
Figure 4d and Figure 5d presented the profile of pH@25 °C (pH values normalized to 25 °C) measured at transect TW-1 and TW-2. Vertical distribution of pH@25 °C basically possessed similar pattern with that of temperature, namely the upper layer had relative high pH values (7.80~8.20) while the pH values in under layer were relative low (7.50~7.80) (Figure 4d and Figure 5d). In the case of DIC, DIC/TAlk, pCO2 and Revelle factor, similar vertical distribution structures were found in eastern Taiwan. In particular, DIC increased gradually from a consistent surface value of about 1860 μmol/kg to nearly 2400 μmol/kg at the depth of 2000 m (Figure 4e and Figure 5e). Thus, the increase of DIC from the surface to 2000 m was accompanied by a decrease of temperature and an increase of density. Our DIC results were comparable to those previous investigations conducted in this area [34,57]. The ratio of DIC/TAlk, which could serve as an indicator for pCO2, varied from 0.81 in the surface seawater to 0.99 in the bottom water (Figure 4f and Figure 5f). The relatively consistent DIC/TAlk below 500 m (0.97~1.00) indicated the stable inorganic carbonate condition for deep water column off eastern Taiwan. The calculated pCO2 (μatm) and Revelle Factor also displayed an increasing trend from the surface seawater to the bottom water. As for the pCO2, it was less than the atmospheric CO2 value (402 μatm) in the upper 100 m water column (Figure 4g and Figure 5g), accompanied by a relatively low Revelle Factor (about 8.0~9.0) (Figure 4h and Figure 5h). The difference of pCO2 between the atmosphere and the surface seawater was usually employed to calculate the air-sea CO2 exchange flux. It ranged from −182 μatm to −153 μatm with an average of −121 μatm in the surface seawater of stations off eastern Taiwan (Figure 4g and Figure 5g).
Based on Figure 4i and Figure 5i, the DO averaged about 6.5 mg/L at the surface water and then decreased rapidly to approximately 4.1 mg/L at 500 m. In the water column of 800~1000 m, there was an oxygen minimum zone (OMZ) with DO contents of 2.38~2.81 mg/L. This kind of DO profile in our study was consistent with those observed in the Atlantic and Pacific Ocean [58,59,60], implying the seawater off eastern Taiwan was equipped with specific characteristics of the open sea. Concentrations of POC in eastern Taiwan generally shared similar vertical profiles, which basically enriched the surface and upper column of seawater and remained at a relatively low level in the under layer water (Figure 4j and Figure 5j). Values of POC measured in this article were comparable to those reported in the northeastern Taiwan [61].

3.3. Summary for Carbonate Chemistry in the Mainstream of Kuroshio

According to the classification of water types conducted in the mainstream of Kuroshio (please see details in Section 3.1 and Figure 3), we summarized the average contents of various carbonate species for KSW, KSSW, KIW and KDW in Table 3. The results briefly indicated that the KSW had the highest biologically-related parameters such as pH, POC and ΩCa in the four water masses but the lowest DIC, pCO2 and RF. In particular, the average pCO2 value of this water mass (312 μatm) was lower than the level of atmospheric CO2 (402 μatm, data source: https://www.co2.earth/monthly-co2), which demonstrated the KSW could serve as an atmospheric sink during our investigating period. On account of the fact that the KSW was the only water located above the eutrophic layer, it could reasonably be deduced that biological activity was probably the important controlling factors for carbonate system in the KSW. The KIW and KDW possessed quite low contents of pH and ΩCa, yet high contents of DIC and pCO2. These results suggested the KIW and KDW stored abundant inorganic carbon and seawater in these two water masses was quite acidic with respect to the surface water column. As for the KSSW, which could affect the ECS shelf ecosystem through physical processes such as upwelling, vertical mixing and cyclonic mesoscale, moderate range of carbonate parameters were found in this water masses. For the sake of exploring internal influence of Kuroshio on the CO2 source/sink of adjacent continental shelf, the relationships between carbonate parameters and related controlling factors and the cross-shelf transport of various carbonate species were presented in the following paragraphs.

4. Discussion

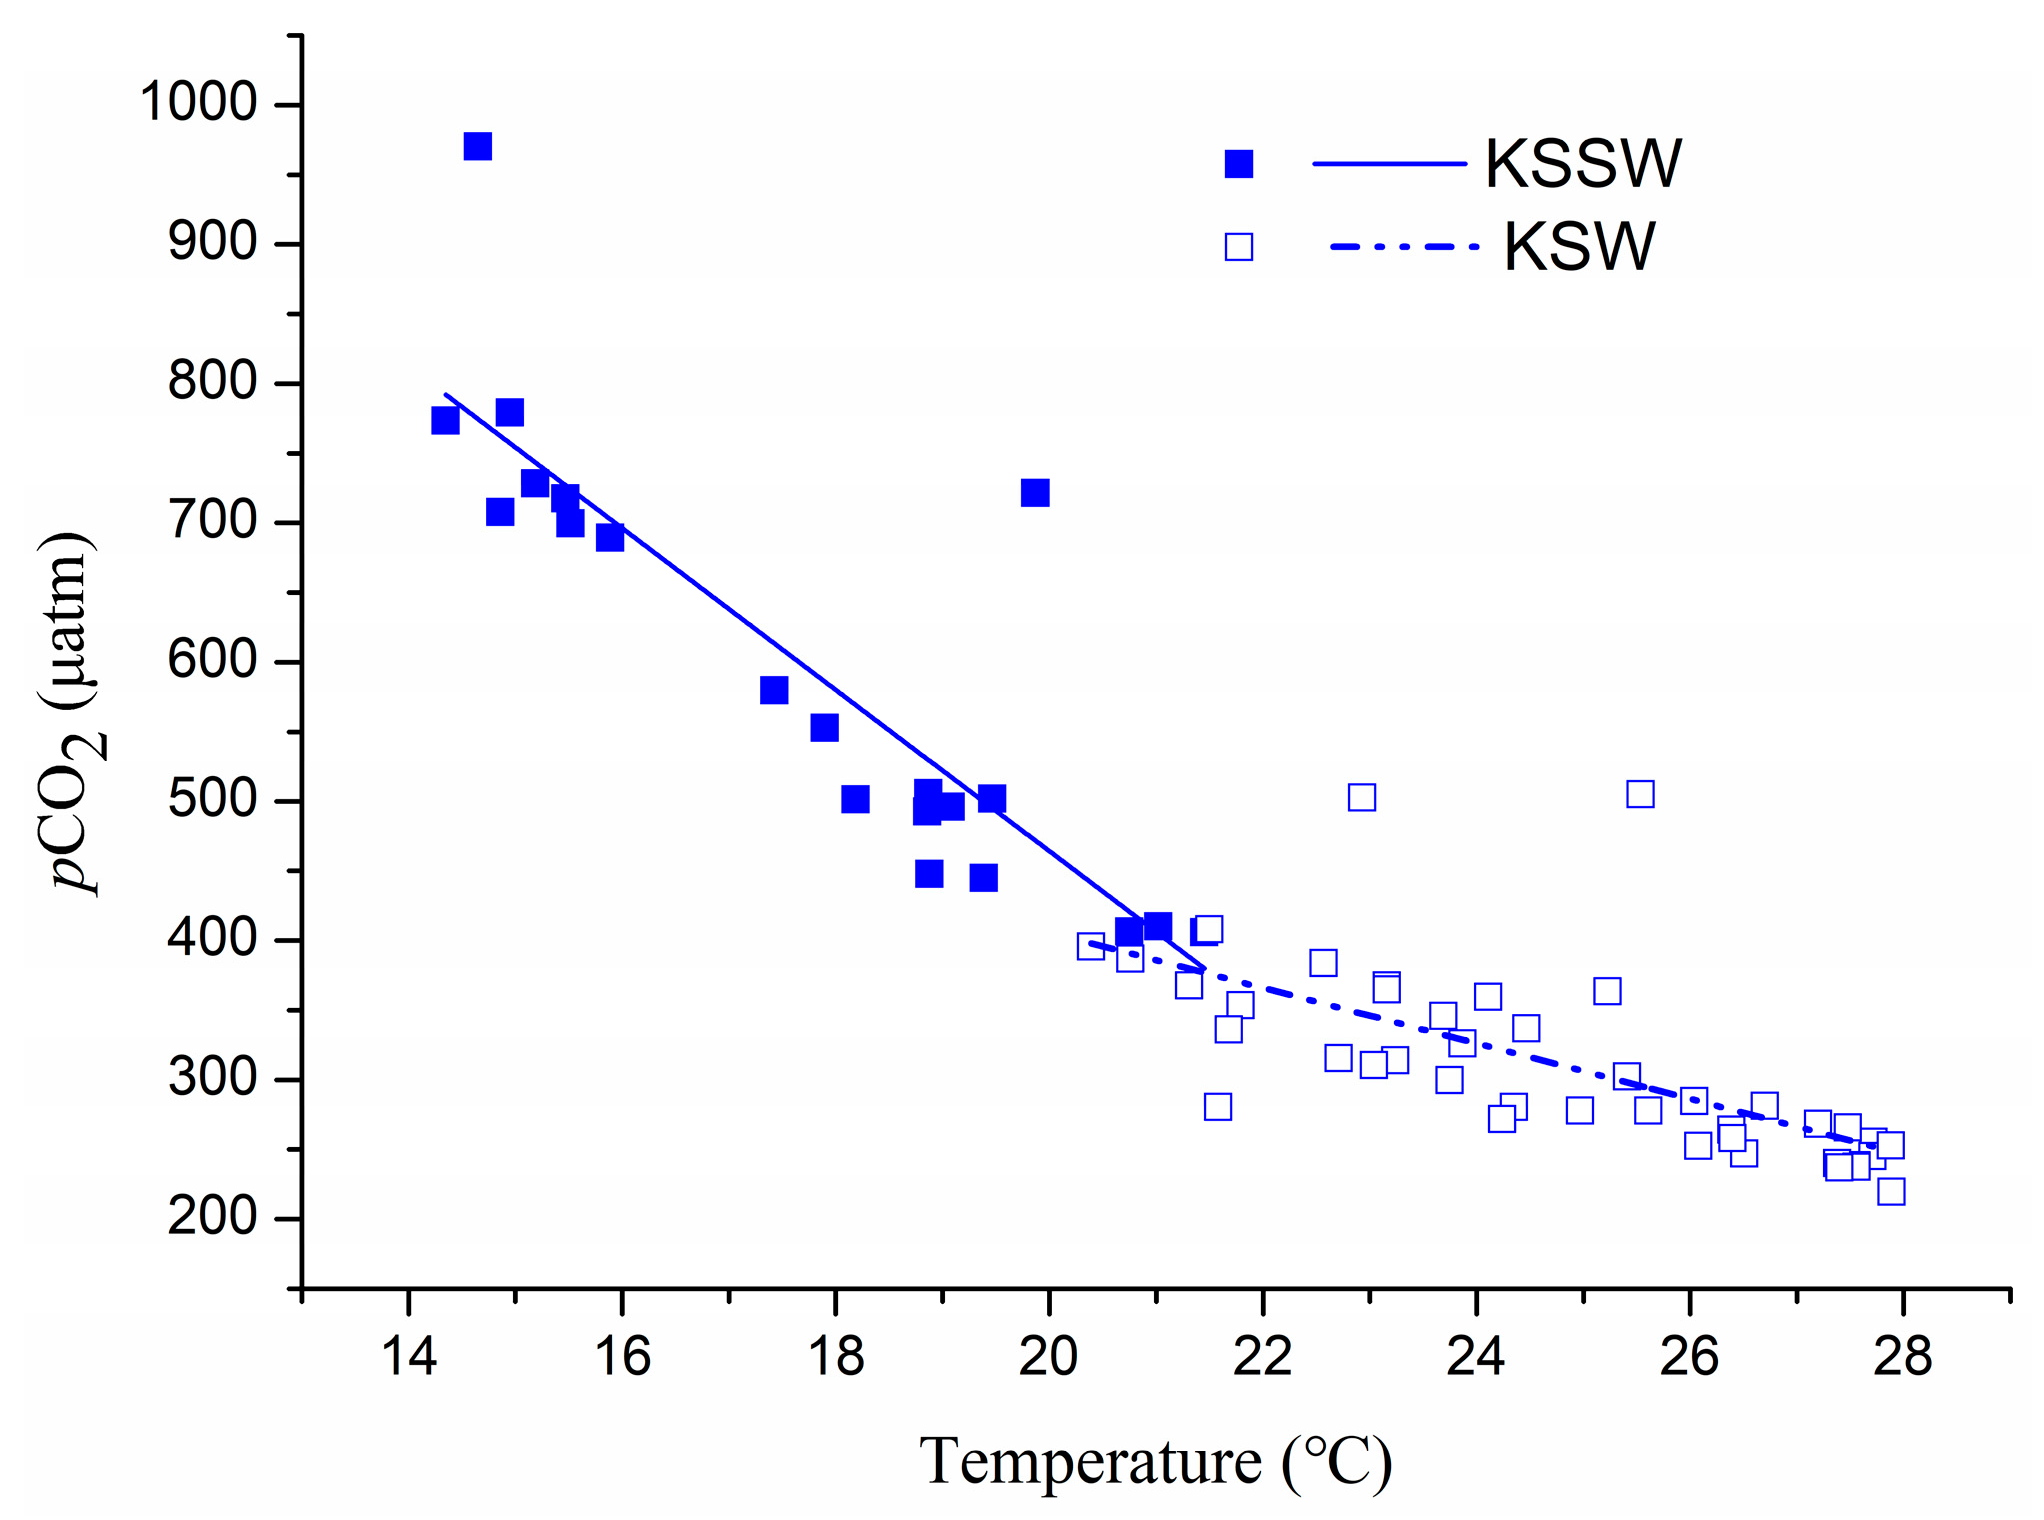
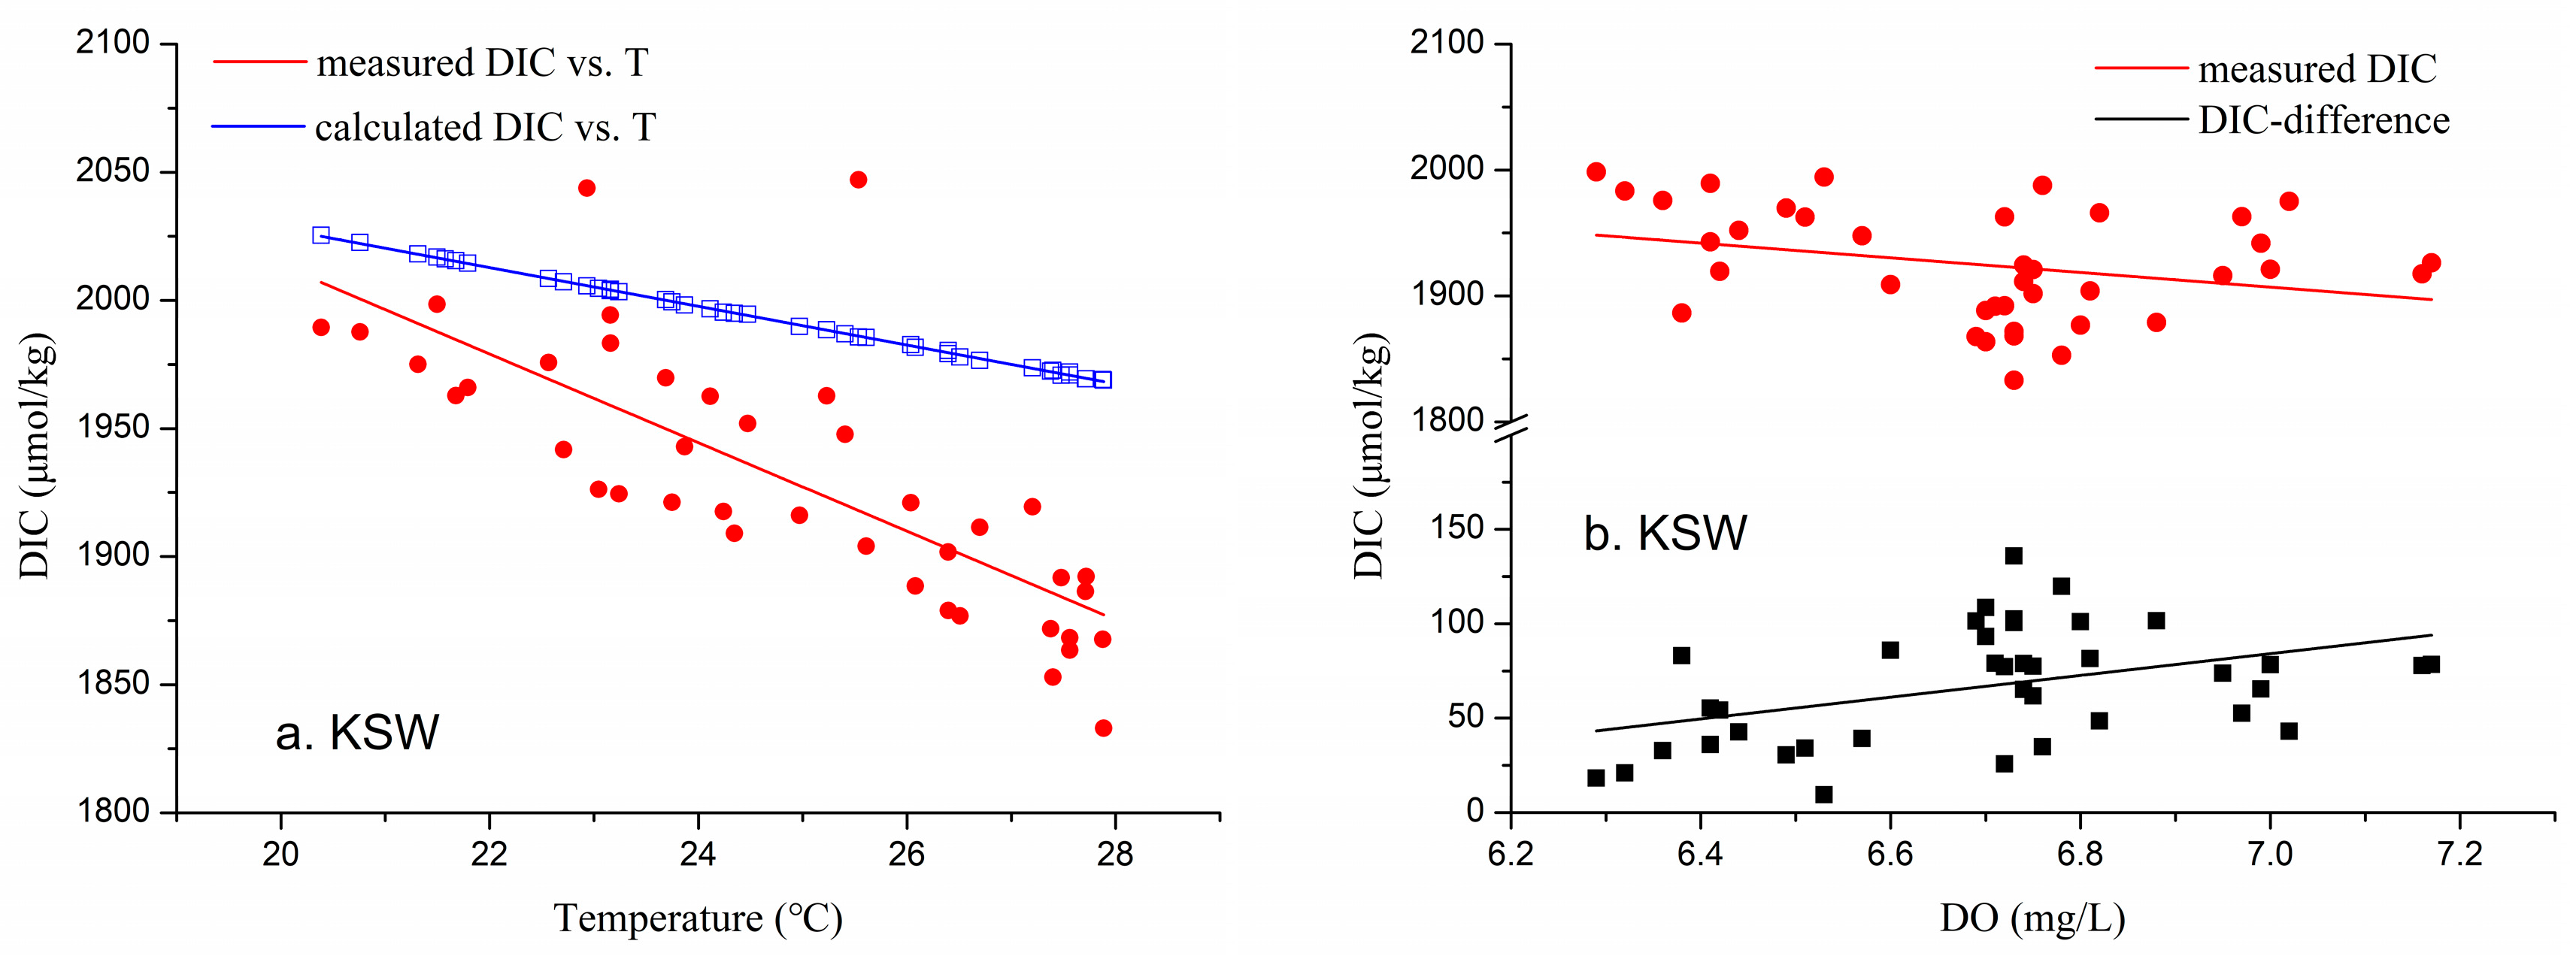
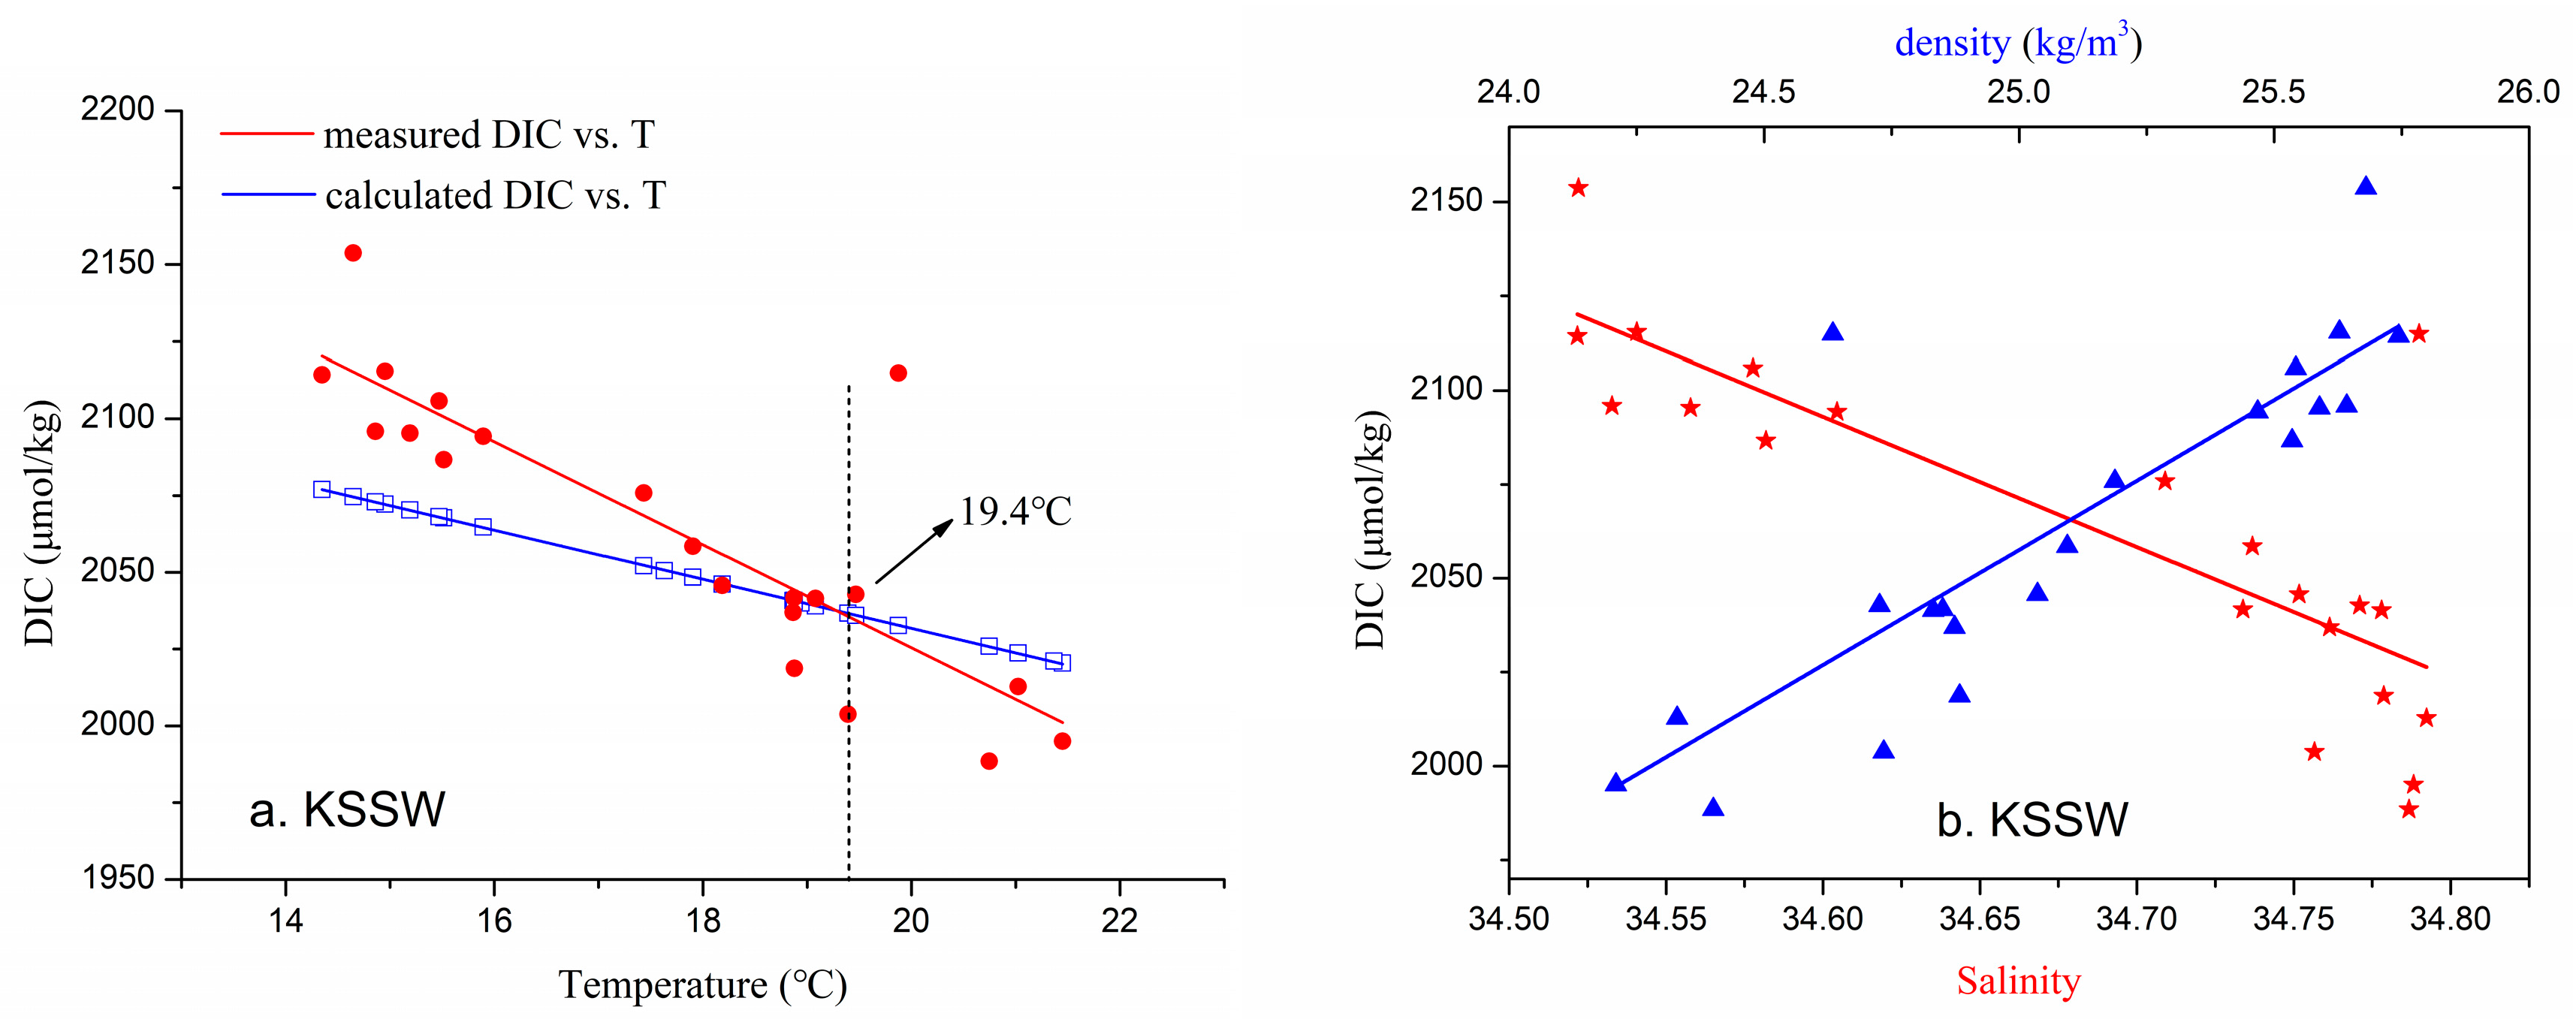
4.1. Relationships between Carbonate Parameters and Environmental Factors in Kuroshio

The relationships between pCO2, DIC and environmental parameters (e.g., temperature, salinity, DO) will be discussed in this section. To be specific, there were strong negative correlations between pCO2 and temperature in the KSW (r = −0.707, p < 0.01, n = 41) and the KSSW (r = −0.861, p < 0.01, n = 21) (Figure 6). Normally, temperature was supposed to show a positive correlation with pCO2 in the perspective of thermodynamic [62,63]. However, external import of CO2-rich cold water and biological activity were considered to be the most two important causations for this negative correlation [11]. Similar negative correlations were also observed in a cold-core cyclonic eddy in Hawaiian Islands [64], the offshore region of south Yellow Sea in the winter and summer [65] and the inner and middle shelf of ECS in winter [9].
In order to explore the internal controlling effects of environmental factors in KSW, we provided that a water with a constant TAlk of 2291 μmol/kg (the average TAlk for KSW) is in equilibrium with an atmospheric pCO2 of 402 μatm (the average of the atmospheric pCO2 measurements off eastern Taiwan). The temperature dependence of DIC in this hypothetical water parcel can be calculated as −7.6 μmol kg/°C (blue line in Figure 7a). This value was less than the observed slope of the DIC vs. temperature relationship (slope = −17.3 μmol kg/°C, red line in Figure 7a). What is more, we found a negative correlation between measured DIC and DO (r = −0.326, p < 0.05, n = 41) and a positive correlation between DIC difference (DIC calculated minus DIC measured) and DO contents in KSW (r = 0.423, p < 0.01, n = 39) (Figure 7b). Therefore, this kind of discrepancy between calculated DIC (blue symbols in Figure 7a) and measured DIC (red symbols in Figure 7a) should be attributed to an additional DIC “sequestration” process which generally derived from phytoplankton photosynthesis. Namely, biological activity actually affected the carbonate system of KSW profoundly. However, there was no significant correlation between DIC and Chl a. The reason for the deviation in Chl a content from primary production was most likely the result of grazing pressure exerted by zooplankton [44].
We also compared the measured DIC and calculated DIC in the KSSW, based on the same assumptions carried out in KSW. The results demonstrated that the interrelation between DIC calculated and DIC measured showed two opposing trends: DIC measured was higher than DIC calculated for water with temperature <19.4 °C, whereas DIC measured was lower than the DIC calculated for water with temperature >19.4 °C (Figure 8a). The positive differences between DIC measured and DIC calculated when temperature >19.4 °C was similar with the situation of KSW, indicating the regulating effects of biological activity on DIC variation still occurred in the relative warmer layer of KSSW. However, the negative difference between DIC measured and DIC calculated when temperature <19.4 °C was very likely related to the external transport of DIC-enriched water, which was probably from the South China Sea (SCS). A study conducted in the Luzon Strait and eastern Taiwan demonstrated that the SCS subsurface water that was rich in biological fixed carbon could significantly modify the carbon chemistry of the subsurface water of the Kuroshio Current in regions off southeast Taiwan [33,35]. Accordingly, we plotted the DIC vs. salinity and DIC vs. density in KSSW and found that the DIC in KSSW was negatively related to salinity (r = −0.811, p < 0.01, n = 41) and positively related to density (r = 0.838, p < 0.01, n = 41) (Figure 8b). These findings suggested that DIC was likely to be enriched in the saline and dense endmember of KSSW, which was probably derived from the SCS. Nevertheless, the potential influence of external DIC transportation on the carbon chemistry of KSSW was far from resolved and further study was needed.

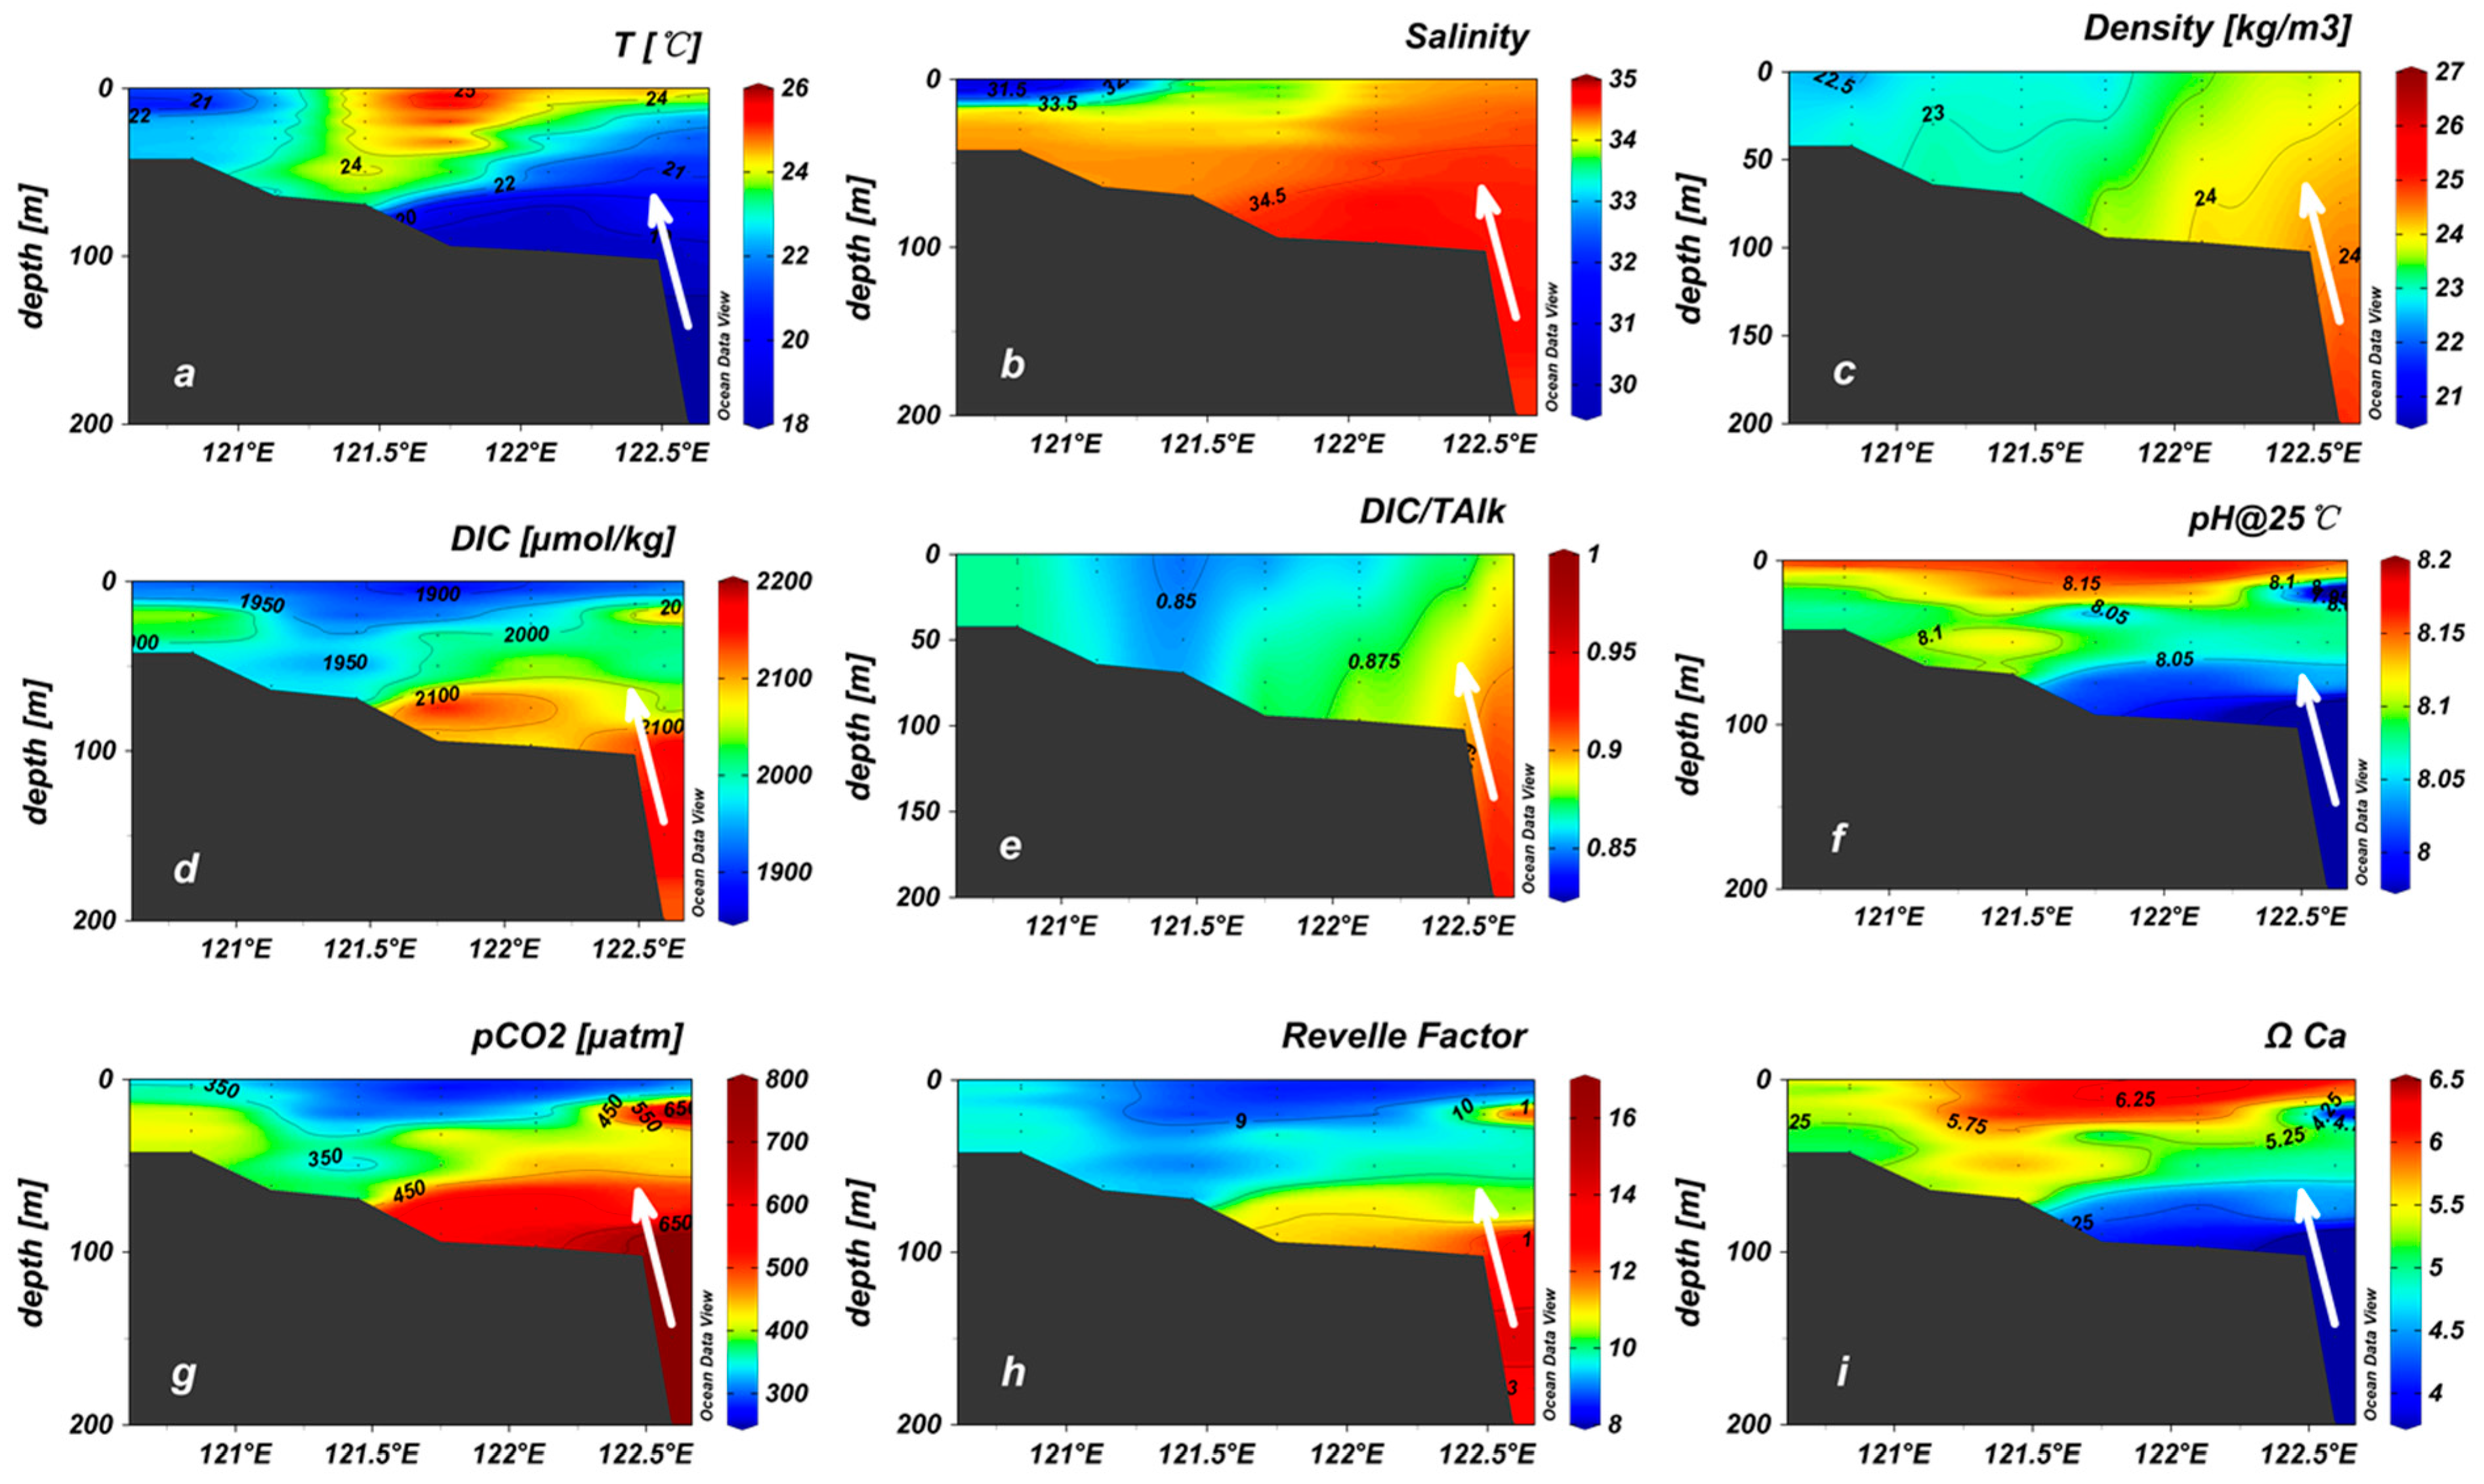
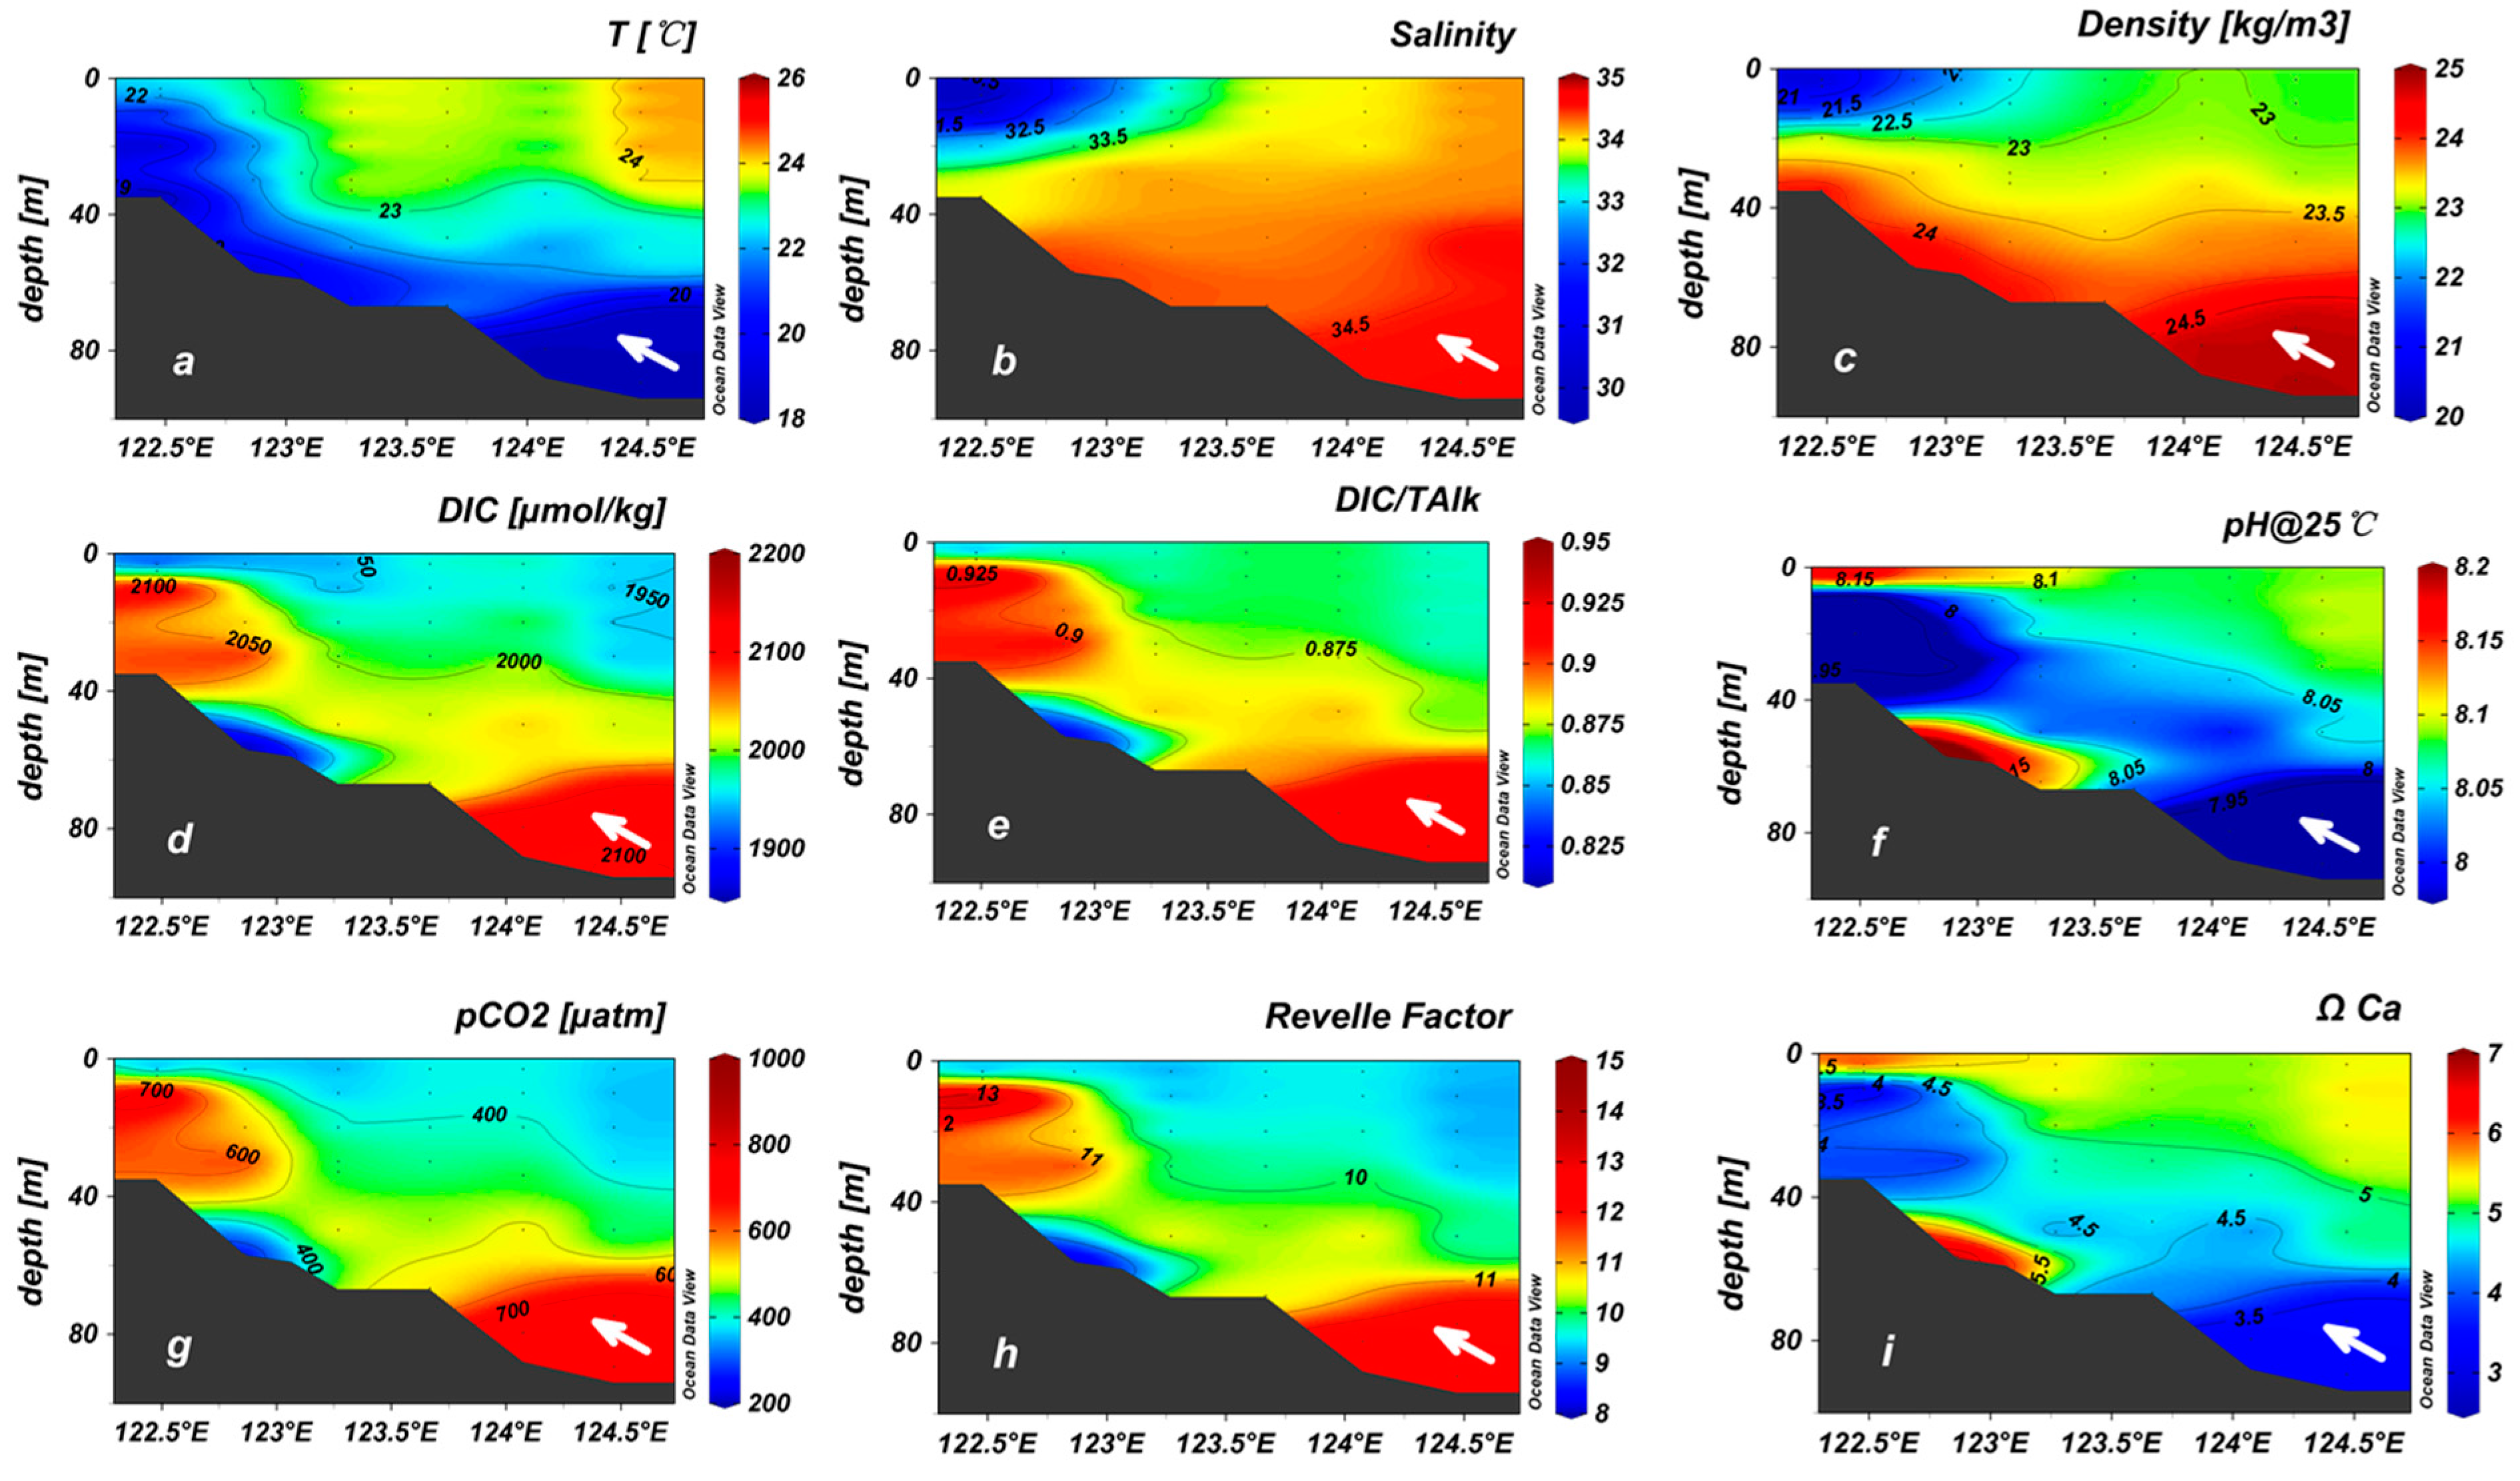
4.2. Intrusion of Kuroshio off Eastern Taiwan into the ECS Shelf: Evidence from Carbon Chemistry Parameters

The distribution patterns of the hydrographic data and the carbonate parameters in transect DH-9, which is the nearest transect to northeast of Taiwan, are shown in Figure 9. The temperature, salinity, density in transect DH-9 showed typical slanted isoclines toward the west/shelf (Figure 6a–c). In detail, a mass of water with low temperature (T < 20.0 °C), high salinity (S > 36.5) and density (ρ > 24.5 kg/m3) occupied the bottom layer of this transect (Figure 9a–c), implying the upwelling of the northwardly flowing Kuroshio waters. Correspondingly, we found that this water mass in transect DH-9 (marked in Figure 9 by an arrow symbol) possessed a relatively high concentration of DIC, DIC/TAlk, pCO2 and Revelle Factor (RF) but low pH and ΩCa (Figure 9d–i). In other words, the upwelling of Kuroshio water off northeastern Taiwan could not only transport cold, saline and dense water mass into the southern ECS shelf but also could convey water mass with a high content of DIC, DIC/TAlk and RF, low pH and ΩCa into the southern ECS shelf.
It had already been found that the cold, nutrient-rich KSSW intruded into the southern ECS shelf and was a major nutrient source to maintain high productivity [30,35]. However, the influence scope of KSSW on ECS is still in debate. It had been reported that the KSSW in eastern Taiwan could intrude into the ECS as far as its nearshore region by a Nearshore Kuroshio Branch Current (NKBC), which linked the nutrient-rich KSSW with the ECS shelf [31,39,66]. In this paper, we supplemented the vertical profiles of temperature, salinity, density, DIC, DIC/TAlk, pH@25 °C, pCO2, Revelle Factor and ΩCa in transect DH-5, which was located near the Changjiang estuary, in order to verify whether the water mass with a high content of DIC observed in transect DH-9 could appeared in transect DH-5 (Figure 10). Our findings demonstrated that, in the outer endmember of transect DH-5, water mass that had a relatively high concentration of DIC, DIC/TAlk, pCO2 and Revelle Factor (RF), low pH and ΩCa was also observed just like the situation in transect DH-9 (Figure 10d–i). Consequently, it could be inferred that the Kuroshio Current off eastern Taiwan could exactly intrude into the ECS shelf as far as 27.9° E, 125.5° N (the outer endmember of transect DH-5), basing on the evidence of carbon chemistry.

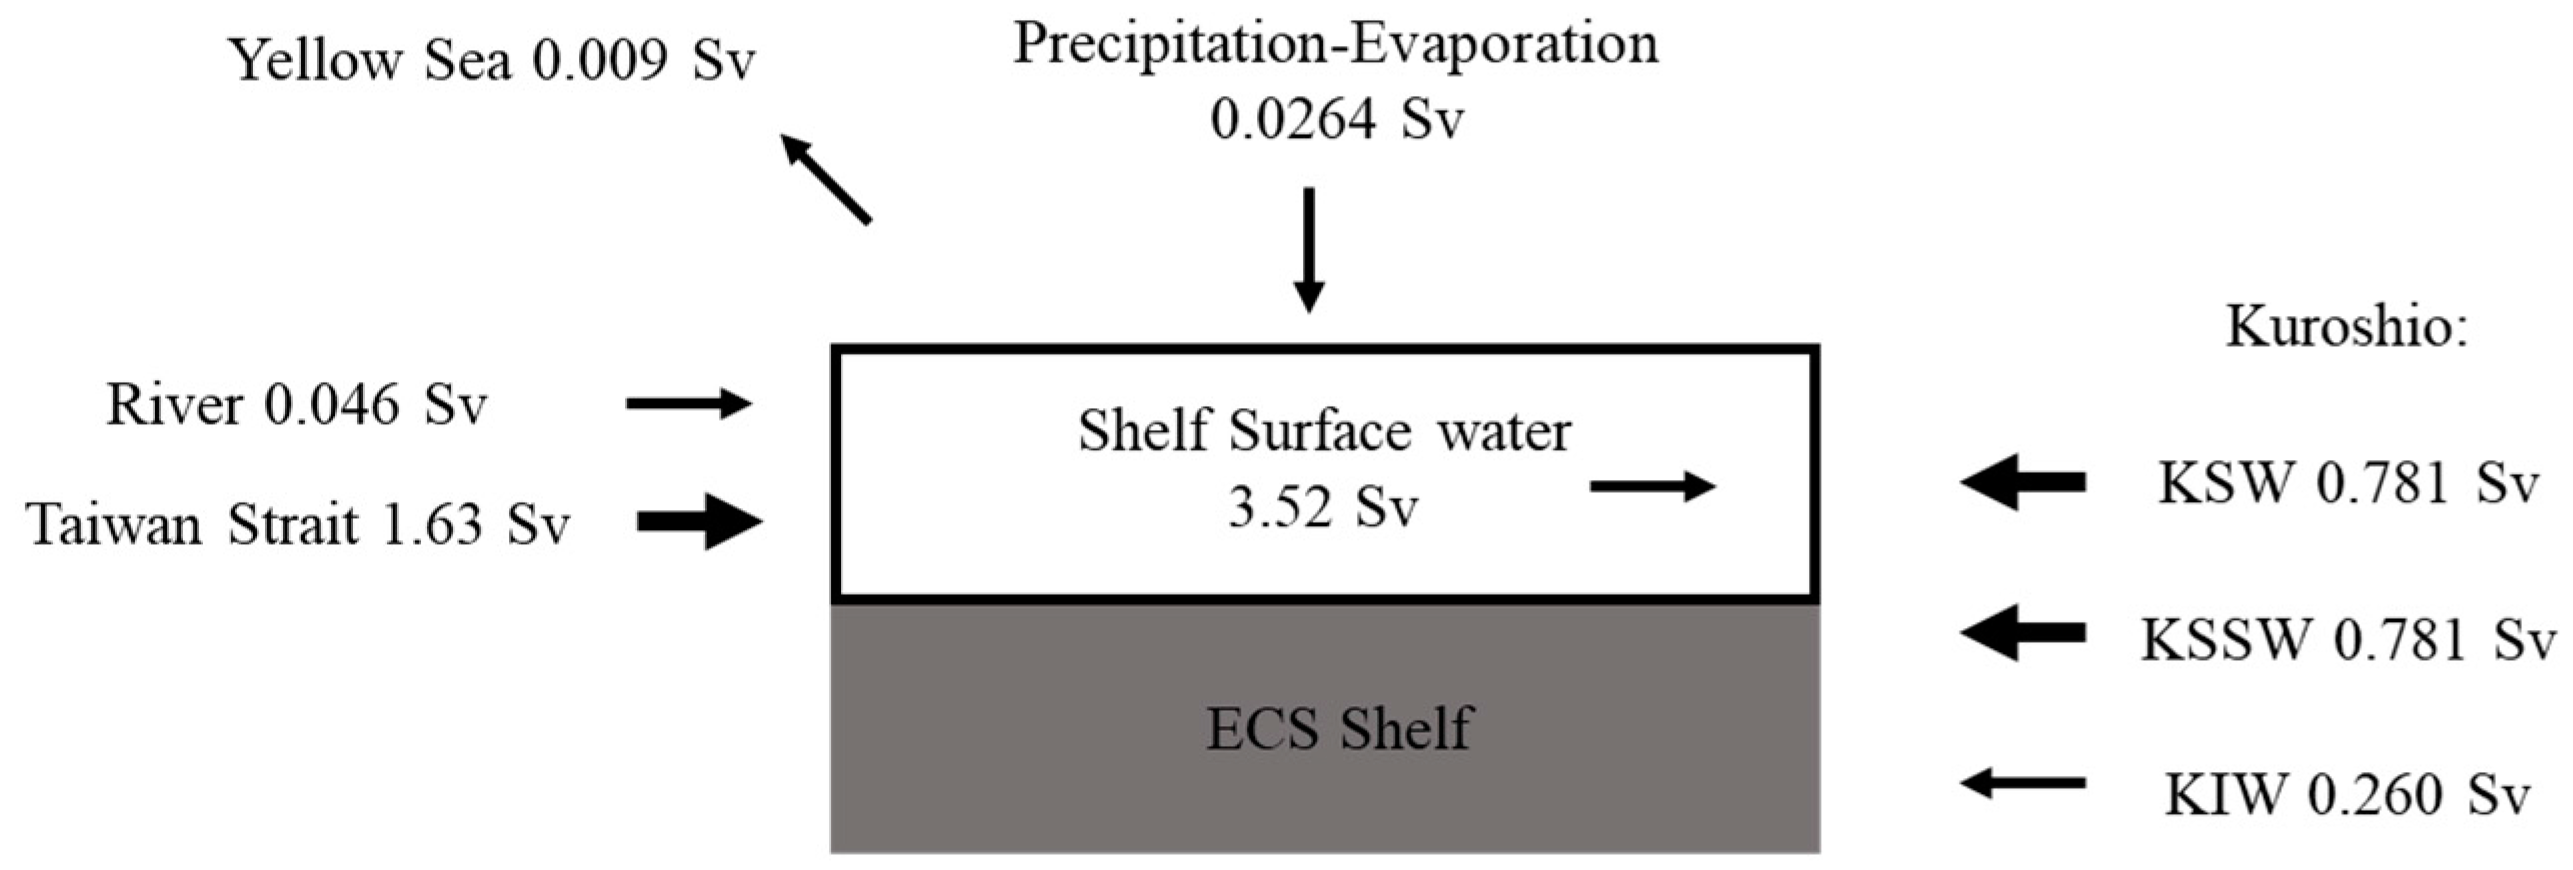
4.3. Estimates of Carbon Transport from Kuroshio into the ECS Shelf

As discussed in Section 4.2, the Kuroshio upwelled waters were characterized by high DIC/TA ratio and Revelle factor. As these upwelled waters flowed northwardly and entered into the ECS shelf finally, they would profoundly change the carbonate properties and CO2 absorption capacity in the ECS, which was probably the most important oceanic atmospheric CO2 sink for China [67]. In the following paragraphs, we tried to evaluate the impact of the intruded Kuroshio water to the DIC pool in the ECS shelf. The water fluxes budget for the ECS in rainy season (May to October), which was evaluated by Zuo et al. (2016) based upon a simple box model about water and salt, was adopted in the estimation of DIC transport [68] (Figure 11). This water flux budget was in good agreement with the latest research results [39,69]. As for the estimation of carbon transport, the following formulation was adopted: F = C × Q, where F represented the transport flux (Tg C, 1 Tg = 1012 g), C was the average concentration for various carbon parameters (μmol/L) and Q stood for the water flux (Sv, 1 Sv = 106 m3/s).
Results of all these transport fluxes are summarized in Table 4. As a result, the KSW, KSSW and KIW could convey DIC into the ECS shelf with a flux of 285, 305 and 112 Tg C/half year (1 Tg = 1012 g), respectively (Table 4). And the relevant flux of POC for KSW, KSSW and KIW was 0.16, 2.93 and 0.04 Tg C/half year, respectively (Table 4). The results indicated that the total influx of DIC (702 Tg C/half year) from the Kuroshio was much larger than the CO2 uptake rate (13~30 Tg C/yr) in ECS through air-sea CO2 exchanging process [5]. This great difference should be attributed to the fact that some of the Kuroshio water might only stay a short time in the ECS, thus will not remain in the ECS for a long time. In particular, since carbonate species transport fluxes estimated in the present study were derived basically from their depth profiles in spring time, seasonal variability and related changes in upwelling that may vary obviously were not considered.

5. Conclusions

The Kuroshio Current, as the famous western boundary of the subtropical gyre in the North Pacific Ocean, transports an abundant amount of warm saline water and nutrients (e.g., nitrate, phosphate, silicate) into the ECS shelf and serves as a major nutrients source for primary production in the southern ECS. Moreover, the transport of excess dissolved inorganic carbon (DIC) could restrain the ability of CO2 sequestration in marginal seas. In this study, comprehensive carbon chemistry data including pH@25 °C, dissolved inorganic carbon (DIC), ratio of dissolved inorganic carbon and total alkalinity (DIC/TAlk), partial pressure of CO2 (pCO2), particulate organic carbon (POC), Revelle Factor (RF) and carbonate saturation state (ΩCa) were measured in the mainstream of Kuroshio off eastern Taiwan in May 2014.
The results indicated that the vertical variations of these carbonate species were closely related the characteristics of various water masses in the Kuroshio Current. Kuroshio Surface Water (KSW) had the highest biological-related parameters such as pH@25 °C, POC and ΩCa but the lowest DIC, pCO2 and RF, which consistently demonstrated that this water could serve as an atmospheric CO2 sink. However, low pH@25 °C, POC and ΩCa and high DIC, pCO2 and RF were found in the Kuroshio Intermediate Water (KIW) and Kuroshio Deep Water (KDW). The Kuroshio Subsurface Water (KSSW), which is traditionally considered an important nutrient source for ECS shelf, possessed the moderate level of carbonate parameters.
Relationships interpretations among pCO2, DIC, temperature and dissolved oxygen (DO) demonstrated phytoplankton photosynthesis played important controlling roles on DIC variation in KSW, whereas the DIC variation in KSSW was controlled not only by the above-mentioned biological activity but the external transport of DIC-enriched water from the South China Sea (SCS). In this article, we found the Kuroshio Current in eastern Taiwan could exactly intrude into the ECS shelf as far as 27.9° E, 125.5° N, basing on the evidence of carbon chemistry obtained in transects DH-9 and DH-5. This study also tried to evaluate the impact of the intruded Kuroshio water to the carbon pool in the ECS shelf. In general, the KSW, KSSW and KIW could convey DIC into the ECS shelf with flux of 285, 305 and 112 Tg C/half year (1 Tg = 1012 g), respectively. And the relevant flux of POC for KSW, KSSW and KIW was 0.16, 2.93 and 0.04 Tg C/half year, respectively. Although carbonate species estimated in this study were derived exclusively from the spring time and seasonal variability and possible changes in upwelling intensity that may vary obviously were not considered, the transportation of carbon from the Kuroshio to the ECS shelf might further exert a counteracting influence on the potential of atmospheric CO2 absorption in the ECS, which needed intensive study in the future.

Supplementary Materials

Acknowledgments

We are grateful to the captain and crew of R/V Kexue I for their shipboard operations and help during the filed investigation. Constructive comments from anonymous reviewers have greatly improved the quality of this manuscript. This study is supported by the Strategic Priority Research Program of the Chinese Academy of Sciences (No. XDA11020102) and the Joint Fund of Shandong Province and National Natural Science Foundation of China (No. U1406404).

Author Contributions

Baoxiao Qu, Jinming Song and Huamao Yuan conceived and designed the experiments; Baoxiao Qu and Huamao Yuan performed the experiments and analyzed the data; Xuegang Li and Ning Li contributed reagents/materials/analysis tools; Baoxiao Qu wrote the paper.

Conflicts of Interest

The authors declare no conflict of interest. The founding sponsors had no role in the design of the study; in the collection, analyses, or interpretation of data, in the writing of the manuscript and in the decision to publish the results.

References

  1. Sabine, C.L.; Feely, R.A.; Gruber, N.; Key, R.M.; Lee, K.; Bullister, J.L.; Wanninkhof, R.; Wong, C.S.; Wallace, D.W.R.; Tilbrook, B.; et al. The oceanic sink for anthropogenic CO2. Science 2004, 305, 367–371. [Google Scholar] [CrossRef] [PubMed] [Green Version]
  2. Kempe, S.; Pegler, K. Sinks and sources of CO2 in coastal seas—The North-Sea. Tellus B 1991, 43, 224–235. [Google Scholar] [CrossRef]
  3. Thomas, H.; Bozec, Y.; Elkalay, K.; de Baar, H.J.W. Enhanced open ocean storage of CO2 from shelf sea pumping. Science 2004, 304, 1005–1008. [Google Scholar] [CrossRef] [PubMed]
  4. Walsh, J.J. Importance of continental margins in the marine biogeochemical cycling of carbon and nitrogen. Nature 1991, 350, 53–55. [Google Scholar] [CrossRef]
  5. Wang, S.-L.; Chen, C.-T.A.; Hong, G.-H.; Chung, C.-S. Carbon dioxide and related parameters in the East China Sea. Cont. Shelf. Res. 2000, 20, 525–544. [Google Scholar] [CrossRef]
  6. Chen, C.-T.A.; Wang, S.-L. Carbon, alkalinity and nutrient budgets on the East China Sea continental shelf. J. Geophys. Res. 1999, 104, 20675–20686. [Google Scholar] [CrossRef]
  7. Chou, W.-C.; Gong, G.-C.; Sheu, D.D.; Hung, C.-C.; Tseng, T.-F. Surface distributions of carbon chemistry parameters in the East China Sea in summer 2007. J. Geophys. Res. 2009, 114, 1–12. [Google Scholar] [CrossRef]
  8. Chou, W.-C.; Gong, G.-C.; Sheu, D.D.; Jan, S.; Hung, C.-C.; Chen, C.-C. Reconciling the paradox that the heterotrophic waters of the East China Sea shelf act as a significant CO2 sink during the summertime: Evidence and implications. Geophys. Res. Lett. 2009, 36, 1–5. [Google Scholar] [CrossRef]
  9. Chou, W.-C.; Gong, G.-C.; Tseng, C.-M.; Sheu, D.D.; Hung, C.-C.; Chang, L.-P.; Wang, L.-W. The carbonate system in the East China Sea in winter. Mar. Chem. 2011, 123, 44–55. [Google Scholar] [CrossRef]
  10. Peng, T.-H.; Hung, J.-J.; Wanninkhof, R.; Millero, F.J. Carbon budget in the East China Sea in spring. Tellus B 1999, 51, 531–540. [Google Scholar] [CrossRef]
  11. Qu, B.X.; Song, J.M.; Yuan, H.M.; Li, X.G.; Li, N. Air-sea CO2 exchange process in the southern Yellow Sea in April of 2011 and June, July, October of 2012. Cont. Shelf. Res. 2014, 80, 8–19. [Google Scholar] [CrossRef]
  12. Qu, B.X.; Song, J.M.; Yuan, H.M.; Li, X.G.; Li, N.; Duan, L.Q. Comparison of carbonate parameters and air-sea CO2 flux in the southern Yellow Sea and East China Sea during spring and summer of 2011. J. Oceanogr. 2017, 73, 365–382. [Google Scholar] [CrossRef]
  13. Tsunogai, S.; Watanabe, S.; Nakamura, J.; Ono, T.; Sato, T. A Preliminary study of carbon system in the East China Sea. J. Oceanogr. 1997, 53, 9–17. [Google Scholar] [CrossRef]
  14. Tsunogai, S.; Watanabe, S.; Sato, T. Is there a “continental shelf pump” for the absorption of atmospheric CO2? Tellus B 1999, 51, 701–712. [Google Scholar] [CrossRef]
  15. Qu, B.; Song, J.; Li, X.; Yuan, H.; Li, N.; Ma, Q. pCO2 distribution and CO2 flux on the inner continental shelf of the East China Sea during summer 2011. Chin. J. Oceanol. Limnol. 2013, 31, 1088–1097. [Google Scholar] [CrossRef]
  16. Wong, G.T.F.; Chao, S.-Y.; Li, Y.-H.; Shiah, F.-K. The Kuroshio edge exchange processes (KEEP) study—An introduction to hypotheses and highlights. Cont. Shelf. Res. 2000, 20, 335–347. [Google Scholar] [CrossRef]
  17. Chen, C.-T.A.; Zhai, W.D.; Dai, M.H. Riverine input and air-sea CO2 exchanges near the Changjiang (Yangtze River) Estuary: Status quo and implication on possible future changes in metabolic status. Cont. Shelf. Res. 2008, 28, 1476–1482. [Google Scholar] [CrossRef]
  18. Gao, X.L.; Song, J.M.; Li, X.G.; Li, N.; Yuan, H.M. pCO2 and carbon fluxes across sea-air interface in the Changjiang Estuary and Hangzhou Bay. Chin. J. Oceanol. Limnol. 2008, 26, 289–295. [Google Scholar] [CrossRef]
  19. Li, X.G.; Song, J.M.; Yuan, H.M.; Li, N.; Duan, L.Q.; Qu, B.X. CO2 flux and seasonal variability in the turbidity maximum zone and surrounding area in the Changjiang River estuary. Chin. J. Oceanol. Limnol. 2015, 33, 222–232. [Google Scholar] [CrossRef]
  20. Guo, X.H.; Zhai, W.D.; Dai, M.H.; Zhang, C.; Bai, Y.; Xu, Y.; Li, Q.; Wang, G.Z. Air-sea CO2 fluxes in the East China Sea based on multiple-year underway observations. Biogeosciences 2015, 12, 5495–5514. [Google Scholar] [CrossRef]
  21. Song, J. Biogeochemical Processes of Biogenic Elements in China Marginal Seas; Springer: Berlin/Heidelberg, Germany, 2010. [Google Scholar]
  22. Qu, B.X.; Song, J.M.; Yuan, H.M.; Li, X.G.; Li, N.; Duan, L.Q.; Chen, X.; Lu, X. Summer carbonate chemistry dynamics in the Southern Yellow Sea and the East China Sea: Regional variations and controls. Cont. Shelf Res. 2015, 111, 250–261. [Google Scholar] [CrossRef]
  23. Lui, H.-K.; Chen, C.-T.A.; Lee, J.; Wang, S.-L.; Gong, G.-C.; Bai, Y.; He, X.Q. Acidifying intermediate water accelerates the acidification of seawater on shelves: An example of the East China Sea. Cont. Shelf Res. 2015, 111, 223–233. [Google Scholar] [CrossRef]
  24. Chen, C.-C.; Chiang, K.-P.; Gong, G.-C.; Shiah, F.-K.; Tseng, C.-M.; Liu, K.-K. Importance of planktonic community respiration on the carbon balance of the East China Sea in summer. Glob. Biogeochem. Cycles 2006, 20, 1–14. [Google Scholar] [CrossRef]
  25. Tseng, C.M.; Liu, K.-K.; Gong, G.-C.; Shen, P.-Y.; Cai, W.-J. CO2 uptake in the East China Sea relying on Changjiang runoff is prone to change. Geophys. Res. Lett. 2011, 38, 1–6. [Google Scholar] [CrossRef]
  26. Milliman, J.D.; Shen, H.T.; Yang, Z.S.; Mead, R.H. Transport and deposition of river sediment in the Changjiang estuary and adjacent continental shelf. Cont. Shelf Res. 1985, 4, 37–45. [Google Scholar] [CrossRef]
  27. Edmond, J.M.; Spivack, A.; Grant, B.C.; Hu, M.H.; Chen, Z.; Chen, S.; Zeng, X. Chemical dynamics of the Changjiang estuary. Cont. Shelf Res. 1985, 4, 17–36. [Google Scholar] [CrossRef]
  28. Zhang, J.; Liu, S.M.; Ren, J.L.; Wu, Y.; Zhang, G.L. Nutrient gradients from the eutrophic Changjiang (Yangtze River) Estuary to the oligotrophic Kuroshio waters and re-evaluation of budgets for the East China Sea Shelf. Prog. Oceanogr. 2007, 74, 449–478. [Google Scholar] [CrossRef]
  29. Chen, C.-C.; Hsu, S.-C.; Jan, S.; Gong, G.-C. Episodic events imposed on the seasonal nutrient dynamics of an upwelling system off northeastern Taiwan. J. Mar. Syst. 2015, 141, 128–135. [Google Scholar] [CrossRef]
  30. Chen, C.-T.A. The Kuroshio intermediate water is the major source of nutrients on the East China Sea continental shelf. Oceanol. Acta 1996, 19, 523–527. [Google Scholar]
  31. Yang, D.; Yin, B.; Sun, J.; Zhang, Y. Numerical study on the origins and the forcing mechanism of the phosphate in upwelling areas off the coast of Zhejiang province, China in summer. J. Mar. Syst. 2013, 123–124, 1–18. [Google Scholar] [CrossRef]
  32. Wang, W.; Yu, Z.; Song, X.; Wu, Z.; Yuan, Y.; Zhou, P.; Cao, X. The effect of Kuroshio Current on nitrate dynamics in the southern East China Sea revealed by nitrate isotopic composition. J. Geophys. Res. 2016, 121, 7073–7087. [Google Scholar] [CrossRef]
  33. Chou, W.-C.; Sheu, D.D.; Chen, C.-T.A.; Wen, L.-S.; Yang, Y.; Wei, C.-L. Transport of the South China Sea subsurface water outflow and its influence on carbon chemistry of Kuroshio waters off southeastern Taiwan. J. Geophys. Res. 2007, 112, 1–11. [Google Scholar] [CrossRef]
  34. Sheu, D.D.; Chou, W.-C.; Chen, C.-T.A.; Wei, C.-L.; Hsieh, H.-L.; Hou, W.-P.; Dai, M.H. Riding over the Kuroshio from the South to the East China Sea: Mixing and transport of DIC. Geophys. Res. Lett. 2009, 36, 251–254. [Google Scholar] [CrossRef]
  35. Chen, C.-T.A. Distributions of nutrients in the East China Sea and the South China Sea connection. J. Oceanogr. 2008, 64, 737–751. [Google Scholar] [CrossRef]
  36. Yang, D.Z.; Yin, B.S.; Hou, Y.J.; Sun, S.; Yu, Z.M.; Song, J.M.; Xu, L.J.; Yu, F.; Song, X.X.; Yu, R.C.; et al. Advance in research on Kuroshio intrusion and its ecological influence on the continental shelf of East China Sea. Oceanol. Limnol. Sin. 2007, 48, 1196–1207, (in Chinese with English abstract). [Google Scholar]
  37. Dai, A.G.; Trenberth, K.E. Estimates of freshwater discharge from continents: Latitudinal and seasonal variations. J. Hydrometeorol. 2002, 3, 660–687. [Google Scholar] [CrossRef]
  38. Stommel, H.M.; Yoshida, K. Kuroshio: Its Physical Aspects; University of Tokyo Press: Tokyo, Japan, 1972. [Google Scholar]
  39. Yang, D.Z.; Yin, B.S.; Liu, Z.L.; Feng, X.R. Numerical study of the ocean circulation on the East China Sea shelf and a Kuroshio bottom branch northeast of Taiwan in summer. J. Geophys. Res. 2011, 116, C05015. [Google Scholar] [CrossRef]
  40. Jan, S.; Yang, Y.J.; Wang, J.; Mensah, V.; Kuo, T.-H.; Chiou, M.-D.; Chern, C.-S.; Chang, M.-H.; Chien, H. Large variability of the Kuroshio at 23.75 degrees N east of Taiwan. J. Geophys. Res. 2015, 120, 1825–1840. [Google Scholar] [CrossRef]
  41. Qiu, B.; Imasato, N. A Numerical Study on the Formation of the Kuroshio Counter Current and the Kuroshio Branch Current in the East China Sea. Cont. Shelf Res. 1990, 10, 165–184. [Google Scholar] [CrossRef]
  42. Dickson, A.G.; Sabine, C.L.; Christian, J.R. Guide to Best Practices for Ocean CO2 Measurements; North Pacific Marine Science Organization: Sidney, BC, Canada, 2007. [Google Scholar]
  43. Zhai, W.D.; Zheng, N.; Huo, C.; Xu, Y.; Zhao, H.D.; Li, Y.W.; Zang, K.P.; Wang, J.Y.; Xu, X.M. Subsurface pH and carbonate saturation state of aragonite on the Chinese side of the North Yellow Sea: Seasonal variations and controls. Biogeosciences 2014, 11, 1103–1123. [Google Scholar] [CrossRef] [Green Version]
  44. Fu, M.Z.; Wang, Z.L.; Li, Y.; Li, R.X.; Sun, P.; Wei, X.H.; Lin, X.Z.; Guo, J.S. Phytoplankton biomass size structure and its regulation in the Southern Yellow Sea (China): Seasonal variability. Cont. Shelf Res. 2009, 29, 2178–2194. [Google Scholar] [CrossRef]
  45. Lewis, E.; Wallace, D.W.R. Program Developed for CO2 System Calculations; Report ORNLrCDIAC-105; Carbon Dioxide Information Analysis Center, Oak Ridge National Laboratory: Oak Ridge, TN, USA, February 1998.
  46. Mehrbach, C.; Culberson, C.H.; Hawley, J.E.; Pytkowicz, R.M. Measurement of apparent dissociation constants of carbonic acid in seawater at atmospheric pressure. Limnol. Oceanogr. 1973, 18, 897–907. [Google Scholar] [CrossRef]
  47. Dickson, A.G.; Millero, F.J. A comparison of the equilibrium constants for the dissociation of carbonic acid in seawater media. Deep Sea Res. 1987, 34, 1733–1743. [Google Scholar] [CrossRef]
  48. Dickson, A.G. Standard potential of the reaction: AgCl(s) + 1/2H2(g) = Ag(s) + HCl(aq) and the standard acidity constant of the ion HSO4 in synthetic seawater from 273.15 to 318.15 K. J. Chem. Thermodyn. 1990, 22, 113–127. [Google Scholar] [CrossRef]
  49. Dickson, A.G. Thermodynamics of the dissociation of boric acid in synthetic seawater from 273.15 to 318.15 K. Deep Sea Res. Part I 1990, 37, 755–766. [Google Scholar] [CrossRef]
  50. Bryan, J.R.; Riley, J.P.; Williams, P.J.L. Winkler procedure for making precise measurements of oxygen concentration for productivity and related studies. J. Exp. Mar. Biol. Ecol. 1976, 21, 191–197. [Google Scholar] [CrossRef]
  51. Hung, J.-J.; Lin, P.-L.; Liu, K.-K. Dissolved and particulate organic carbon in the southern East China Sea. Cont. Shelf Res. 2000, 20, 545–569. [Google Scholar] [CrossRef]
  52. Yuan, D.L.; Zhu, J.R.; Li, C.Y.; Hu, D.X. Cross-shelf circulation in the Yellow and East China Seas indicated by MODIS satellite observations. J. Mar. Syst. 2008, 70, 134–149. [Google Scholar] [CrossRef]
  53. Chen, C.-T.A. Chemical and physical fronts in the Bohai, Yellow and East China seas. J. Mar. Syst. 2009, 78, 394–410. [Google Scholar] [CrossRef]
  54. Chen, C.-T.A.; Wang, S.-L. A salinity front in the southern East China Sea separating the Chinese coastal and Taiwan Strait waters from Kuroshio waters. Cont. Shelf Res. 2006, 26, 1636–1653. [Google Scholar] [CrossRef]
  55. Ichikawa, H.; Chaen, M. Seasonal variation of heat and freshwater transports by the Kuroshio in the East China Sea. J. Mar. Syst. 2000, 24, 119–129. [Google Scholar] [CrossRef]
  56. Qi, J.F.; Yin, B.S.; Zhang, Q.L.; Yang, D.Z.; Xu, Z.H. Analysis of seasonal variation of water masses in East China Sea. Chinese J. Oceanol. Limnol. 2014, 32, 958–971. [Google Scholar] [CrossRef]
  57. Sheu, D.D.; Lee, W.Y.; Wang, C.H.; Wei, C.L.; Chen, C.T.A.; Cherng, C.; Huang, M.H. Depth distribution of delta δ13C of dissolved ∑CO2 in seawater off eastern Taiwan: Effects of the Kuroshio current and its associated upwelling phenomenon. Cont. Shelf Res. 1996, 16, 1609–1619. [Google Scholar] [CrossRef]
  58. Fuenzalida, R.; Schneider, W.; Garces-Vargas, J.; Bravo, L.; Lange, C. Vertical and horizontal extension of the oxygen minimum zone in the eastern South Pacific Ocean. Deep Sea Res. Part II Top. Stud. Oceanogr. 2009, 56, 1027–1038. [Google Scholar] [CrossRef]
  59. Karstensen, J.; Stramma, L.; Visbeck, M. Oxygen minimum zones in the eastern tropical Atlantic and Pacific oceans. Prog. Oceanogr. 2008, 77, 331–350. [Google Scholar] [CrossRef] [Green Version]
  60. Ulloa, O.; Pantoja, S. The oxygen minimum zone of the eastern South Pacific. Deep Sea Res. Part II Top. Stud. Oceanogr. 2009, 56, 987–991. [Google Scholar] [CrossRef]
  61. Hung, J.-J.; Chen, C.-H.; Gong, G.-C.; Sheu, D.D.; Shiah, F.-K. Distributions, stoichiometric patterns and cross-shelf exports of dissolved organic matter in the East China Sea. Deep Sea Res. Part II Top. Stud. Oceanogr. 2003, 50, 1127–1145. [Google Scholar] [CrossRef]
  62. Millero, F.J. Thermodynamics of the carbon dioxide system in the oceans. Geochim. Cosmochim. Acta 1995, 59, 661–677. [Google Scholar] [CrossRef]
  63. Takahashi, T.; Sutherland, S.C.; Sweeney, C.; Poisson, A.; Metzl, N.; Tilbrook, B.; Bates, N.; Wanninkhof, R.; Feely, R.A.; Sabine, C.; et al. Global sea-air CO2 flux based on climatological surface ocean pCO2 and seasonal biological and temperature effects. Deep Sea Res. Part II Top. Stud. Oceanogr. 2002, 49, 1601–1622. [Google Scholar] [CrossRef]
  64. Chen, F.; Cai, W.-J.; Claudia, B.-N.; Wang, Y. Sea surface pCO2-SST relationships across a cold-core cyclonic eddy: Implications for understanding regional variability and air-sea gas exchange. Geophys. Res. Lett. 2007, 341, 265–278. [Google Scholar]
  65. Zhang, L.J.; Xue, L.; Song, M.Q.; Jiang, C.B. Distribution of the surface partial pressure of CO2 in the southern Yellow Sea and its controls. Cont. Shelf Res. 2010, 30, 293–304. [Google Scholar] [CrossRef]
  66. Yang, D.Z.; Yin, B.S.; Liu, Z.L.; Bai, T.; Qi, J.F.; Chen, H.Y. Numerical study on the pattern and origins of Kuroshio branches in the bottom water of southern East China Sea in summer. J. Geophys. Res. 2012, 117, C02014. [Google Scholar] [CrossRef]
  67. Sarmiento, J.L.; Gruber, N. Carbon cycle. In Ocean Biogeochemical Dynamics; Sarmiento, J.L., Gruber, N., Eds.; Princeton University Press: Princeton, NJ, USA, 2006; pp. 318–358. [Google Scholar]
  68. Zuo, J.L.; Song, J.M.; Yuan, H.M.; Li, X.G.; Li, N.; Duan, L.Q. Particulate nitrogen and phosphorus in the East China Sea and its adjacent Kuroshio waters and evaluation of budgets for the East China Sea Shelf. Cont. Shelf Res. 2016, 131, 1–11. [Google Scholar] [CrossRef]
  69. Zhou, F.; Xue, H.; Huang, D.; Xuan, J.; Ni, X.; Xiu, P.; Hao, Q. Cross-shelf exchange in the shelf of the East China Sea. J. Geophys. Res. 2015, 120, 1545–1572. [Google Scholar] [CrossRef]
Figure 1. Study area and station location in our study. The black dash-dot line was the schematic diagram of the mainstream of Kuroshio Current.
Sustainability 10 00791 g001
Figure 2. Spatial distributions of the hydrographic parameter (temperature (°C), salinity and density (kg/m3) in the surface and bottom layer of the East China Sea (ECS) and eastern Taiwan.
Sustainability 10 00791 g002
Figure 3. A plot of potential temperature (θ) and salinity of seawater at all stations in ECS shelf and eastern Taiwan. The dash-dot lines denote the isopycnals of potential density anomaly (σ0). The colorful rectangles represents different water masses, which include the ECS coastal water (ECSCW), Taiwan Warm Current (TWC), Shelf Mixed Water (SMW), Kuroshio Surface Water (KSW), Kuroshio Subsurface Water (KSSW), Kuroshio Intermediate Water (KIW) and Kuroshio Deep Water (KDW). The definitions of the water masses were based on Chen (2009), Chen and Wang (2006), Ichikawa and Chaen (2000), Qi et al. (2014) [53,54,55,56].
Sustainability 10 00791 g003
Figure 4. Vertical distributions of temperature (°C), salinity, density (kg/m3), DIC (μmol/kg), pH@25°C, DIC/TAlk, DO (mg/L), POC (μmol/L) and the calculated pCO2 (μatm) and Revelle Factor along transect TW-1, eastern Taiwan. The gray dashed line in vertical distributions of pCO2 indicated the atmospheric CO2 value in May 2014 (402 μatm, https://www.co2.earth/monthly-co2).
Sustainability 10 00791 g004
Figure 5. Vertical distributions of temperature (°C), salinity, density (kg/m3), DIC (μmol/kg), pH@25 °C, DIC/TAlk, DO (mg/L), POC (μmol/L) and the calculated pCO2 (μatm) and Revelle Factor along transect TW-2, eastern Taiwan. The gray dashed line in vertical distributions of pCO2 indicated the atmospheric CO2 value in May 2014 (402 μatm, https://www.co2.earth/monthly-co2).
Sustainability 10 00791 g005
Figure 6. Diagrams of pCO2 vs. temperature for the Kuroshio Surface Water (KSW) (blue hollow squares) and the Kuroshio Subsurface Water (KSSW) (blue filled squares) off eastern Taiwan.
Sustainability 10 00791 g006
Figure 7. (a) Diagrams of measured and calculated DIC vs. temperature for the Kuroshio Surface Water (KSW). (b) Diagrams of measured DIC and DIC difference (calculated DIC minus measured DIC) vs. dissolved oxygen in the KSW.
Sustainability 10 00791 g007
Figure 8. (a) Diagrams of measured and calculated DIC vs. Temperature for the Kuroshio Subsurface Water (KSSW). (b) Plots of DIC vs. salinity and density in the KSSW.
Sustainability 10 00791 g008
Figure 9. Vertical profiles of (a) temperature, (b) salinity, (c) density, (d) DIC, (e) DIC/TAlk, (f) pH@25 °C, (g) pCO2, (h) Revelle Factor, (i) ΩCa in transect DH-9. The white arrow indicated the upwelling of Kuroshio Current in the northeastern Taiwan.
Sustainability 10 00791 g009
Figure 10. Vertical profiles of (a) temperature, (b) salinity, (c) density, (d) DIC, (e) DIC/TAlk, (f) pH@25 °C, (g) pCO2, (h) Revelle Factor, (i) ΩCa in transect DH-5.
Sustainability 10 00791 g010
Figure 11. Schematic diagram of the water budgets (Sv) for the ECS Shelf in rainy season (May–October). 1 Sv = 106 m3/s. Data was derived from the summary conducted by Zuo et al. (2016) [68].
Sustainability 10 00791 g011
Table 1. Temperature and salinity variations in the various water types.
Water typesTemperature (°C)Salinity (PSU)
ECSCW18.87 < T < 23.8826.34 < S < 31.20
TWC21.69 < T < 25.8331.33 < S < 34.28
SMW16.25 < T < 21.0231.40 < S < 34.49
KSW20.39 < T < 27.8934.34 < S < 34.82
KSSW14.35 < T < 21.4534.52 < S < 34.79
KIW4.99 < T < 12.8334.23 < S < 34.43
KDW1.89 < T < 5.4034.35 < S < 34.62
Table 2. Contents of hydrological and ecological-related parameters (mean ± standard deviation) in different water masses of mainstream of Kuroshio off eastern Taiwan (KSW, KSSW, KIW, KDW).
T (°C)Salinityρ (kg/m3)Chl a (μg/L)DO (mg/L)
KSW27.74 ± 2.2634.68 ± 0.1323.16 ± 0.76025 ± 0.256.7 ± 0.2
KSSW17.92 ± 2.2934.69 ± 0.1025.04 ± 0.490.04 ± 0.036.2 ± 0.3
KIW8.01 ± 2.6334.33 ± 0.0526.71 ± 0.39not detected 3.6 ± 1.0
KDW2.99 ± 0.9934.52 ± 0.0827.50 ± 0.16not detected 3.3 ± 0.6
Note: The definitions of water masses were conducted in Section 3.1.
Table 3. Contents of various carbonate species (mean ± standard deviation) in different water masses of mainstream of Kuroshio off eastern Taiwan (KSW, KSSW, KIW and KDW).
KSWKSSWKIWKDW
pH@25 °C8.141 ± 0.058.013 ± 0.0697.692 ± 0.1357.606 ± 0.043
DIC (μmol/kg)1930 ± 512064 ± 462274 ± 632389 ± 16
DIC/TAlk0.84 ± 0.020.90 ± 0.020.98 ± 0.020.99 ± 0.01
pCO2 (μatm)312 ± 68597 ± 1561869 ± 5682401 ± 216
RF8.74 ± 0.5911.07 ± 1.1715.98 ± 1.1016.80 ± 0.10
POC (μmol/L)2.5 ± 1.01.1 ± 0.70.9 ± 0.30.9 ± 0.2
ΩCa6.1 ± 0.74.0 ± 0.71.6 ± 0.51.1 ± 0.1
Note: The definitions of water masses were conducted in Section 3.1.
Table 4. Water fluxes and estimates of various carbonate species transport from Kuroshio into the ECS shelf.
Water FluxDIC Input (1012 g)POC Input (1012 g)
KSW0.7812850.37
KSSW0.7813050.16
KIW0.2601120.04
total1.827020.57

