Network Analysis on Green Technology in National Research and Development Projects in Korea


1
Department of Science and Technology Management Policy, University of Science and Technology, 217, Gajeong-ro, Yuseong-gu, Daejeon 34113, Korea
2
NTIS Center, Korea Institute of Science and Technology Information, 245, Daehak-ro, Yuseong-gu, Daejeon 34113, Korea
*
Author to whom correspondence should be addressed.
Sustainability 2018, 10(4), 1043; https://0-doi-org.brum.beds.ac.uk/10.3390/su10041043
Submission received: 12 March 2018
/
Revised: 29 March 2018
/
Accepted: 30 March 2018
/
Published: 2 April 2018
(This article belongs to the Section Economic and Business Aspects of Sustainability)
Abstract
:This study examined how green technology (GT) has evolved recently in the domain of national research and development (R&D) in Korea. The analysis considered social network analysis by using keywords of national R&D projects in environmentally benign (‘green’ in this paper) technologies. Data for analysis were collected from the R&D database of the National Science and Technology Information Service (NTIS). By selecting the official GT category in the NTIS’s database, we gathered 53,896 GT R&D projects from 2011 to 2016 inclusive. By constructing a co-occurrence matrix with keywords, we conducted a centrality analysis (including degree, closeness, betweenness centrality) and visualized the network matrix to display a cluster map. This study presents the following findings: (1) the chronical trends of GT R&D, (2) focused fields of GT R&D, (3) the relations between keywords and GTs, and (4) the characteristics and problems in GT R&D. The paper ends with suggested policy implications to boost national GT R&D and to develop GTs in the future.
1. Introduction
Sustainable development (SD) was adopted by the United Nations General Assembly in September 2015 as the next global development goal after the Millennium Development Goal. Since the United Nations (UN) World Commission on Environment and Development published the report of “Our Common Future” in 1987, the concept of SD has spread across the world. This report defines SD as “development that meets the needs of the present without compromising the ability of future generations to meet their own needs” [1,2,3,4,5,6]. Because of the vagueness of this definition of SD, ‘green growth’ and ‘green innovation’ have emerged worldwide in academia, policy, and industry as a practical means to achieve SD.
In 2005, the 5th Ministerial Conference on Environmental and Development in Asia and Pacific hosted by the UN Economic and Social Commission for Asia and Pacific (UN ESCAP) mentioned ‘green growth’ as the term based on SD to foster economic growth by preventing environmental contamination and using natural resources sustainably [5]. Green innovation has been defined in various ways [2,7,8,9,10,11,12,13], which can be summarized as “innovations to consist of new or modified processes, techniques, systems, and products which benefit the environment and avoid or reduce environmental harm” [9]. Green technology (GT) has emerged globally as an important component in pursuing SD as well as in promoting green growth and innovation.
In Korea, GT first appeared in the law when the Lee Myung-bak administration proposed the “Low Carbon, Green Growth” strategy for the new national development paradigm in 2009 [5,14,15]. The Korean government regards GT as a means to respond to climate change, to overcome the energy crisis, and to sustain SD [16]. Since then, the national research and development (R&D) investment in GT increased from 2.2 trillion won in 2010 to 4.13 trillion won in 2013, but then decreased to 3.57 trillion won in 2014 and to 1.93 trillion won in 2016. Although the significance of GT has increased in the world to pursue SD and to promote low-carbon growth, in Korea, the national R&D investment in GT has recently dropped and the national R&D plan of GT has not been designed and implemented in the long run because GT tended to be considered as a means for economic growth in Korea [5,15]. Moreover, academic study of GT has been rarely conducted in Korea. Thus, we attempted to fill this research gap. The main purpose of this study is to examine how GT has evolved in the domain of national R&D in Korea, especially focusing on the transition of keyword trends in GT R&D. This study also aims to present the trend changes of GT in national R&D by applying a social network analysis that considers the co-occurrence of keywords and degree, closeness, and betweenness centrality. Based on the co-occurrence matrix of keywords, we visualized the network matrix to display a cluster map of GT. From the results of network analysis, we identify the characteristics and problems in national GT R&D and suggest some policies to boost GT R&D again in Korea.
This paper is organized as follows. Section 2 presents the definition of GT and a review of some literature. Section 3 demonstrates research design, data collection, and cleansing, as well as a brief overview of social network analysis. Section 4 presents the results of network analysis on national R&D for GT. Section 5 presents discussion and policy suggestions. The final section concludes the paper with a summary, recommendation for future study, and limitations of the paper.
2. Literature Review of Green Technology
The concept of GT originated in the 1960s and 1970s when the social ecological movement arose in Western industrialized countries [17]. However, GT has been widely accepted since the 21st century, when it was introduced and developed to foster SD and to pursue green growth by reducing the environmental effects of technologies [15,16,17]. GT is basically acknowledged as a technology both to diminish negative effects on the environment and to improve the quality of the environment [10,13]. GT has been also regarded as synonymous with environmental, ecological, and clean technologies. According to Google Trend analysis, GT has drawn increasing interest in search frequency compared to other similar terms that refer to clean and environmentally benign technologies [16]. Consequently, “green technology” has become a dominant term in the context of environmental, ecological, and clean technologies.
GT is based on the concept of green innovation [2,7,8,9,10,13]. Thus, the literature that related to green innovation is also the source of the definition of GT. Green innovation must develop new technologies for energy saving, waste recycling, pollution-prevention, green product designs, and corporate environmental management [9,18]. GT is defined as a product, service, or process to generate economic, social, and ecological value by reducing use of resources and energy, and by minimizing environmental contamination [19,20,21]. In developed countries, GT may function as an appropriate technology because of its sustainability for the environment and economic development as well as its promotion of the importance of human value [15], whereas an appropriate technology may meet the needs of local people and places in developing countries [22]. For instance, in the U.S., renewable energy as GT has been developed as an alternative to fossil or nuclear energy to fulfill local needs and to protect the environment [23].
Numerous studies of GT have been performed in technological fields [17] such as renewable energy [24,25,26], solar cells [27,28,29], fuel cells [30,31], and water management [32,33]. Similarly, numerous studies have been conducted on GT and green innovation from an economic perspective; examples include an analysis of green innovation factors in small and medium-sized enterprises in Korea [34] and a study on how environmental taxes affect the adoption of GT [35]. According to Porter’s hypothesis [36] of green innovation, appropriate environmental regulations induce technological innovation, which can offset the development and production costs incurred [34,36,37]. Nevertheless, for private companies, investment in GT may raise costs and reduce profits [7,38,39,40]. Because green investment is mostly capital-intensive, a government has a significant role in the R&D of GT. Therefore, policy instruments have been developed to facilitate green innovation and to diffuse GT in Asian countries [2]. Despite its importance, the study of GT has been insufficient in the field of national R&D. To fill this research gap, the present paper quantitatively examines relationships among research topics in national R&D and GT in Korea.
3. Research Method
The goal of this study is to investigate the evolution of GT in the national R&D domain of Korea. This goal is accomplished by focusing on changes in the keyword trends in GT R&D. To conduct research with reliable data, we used the national R&D database produced by the National Science and Technology Information Service (NTIS) [41]. The NTIS is operated by the Korea Institute of Science and Technology Information (KISTI) to provide all national R&D information such as projects, human resources, facilities, and outcomes in real time.
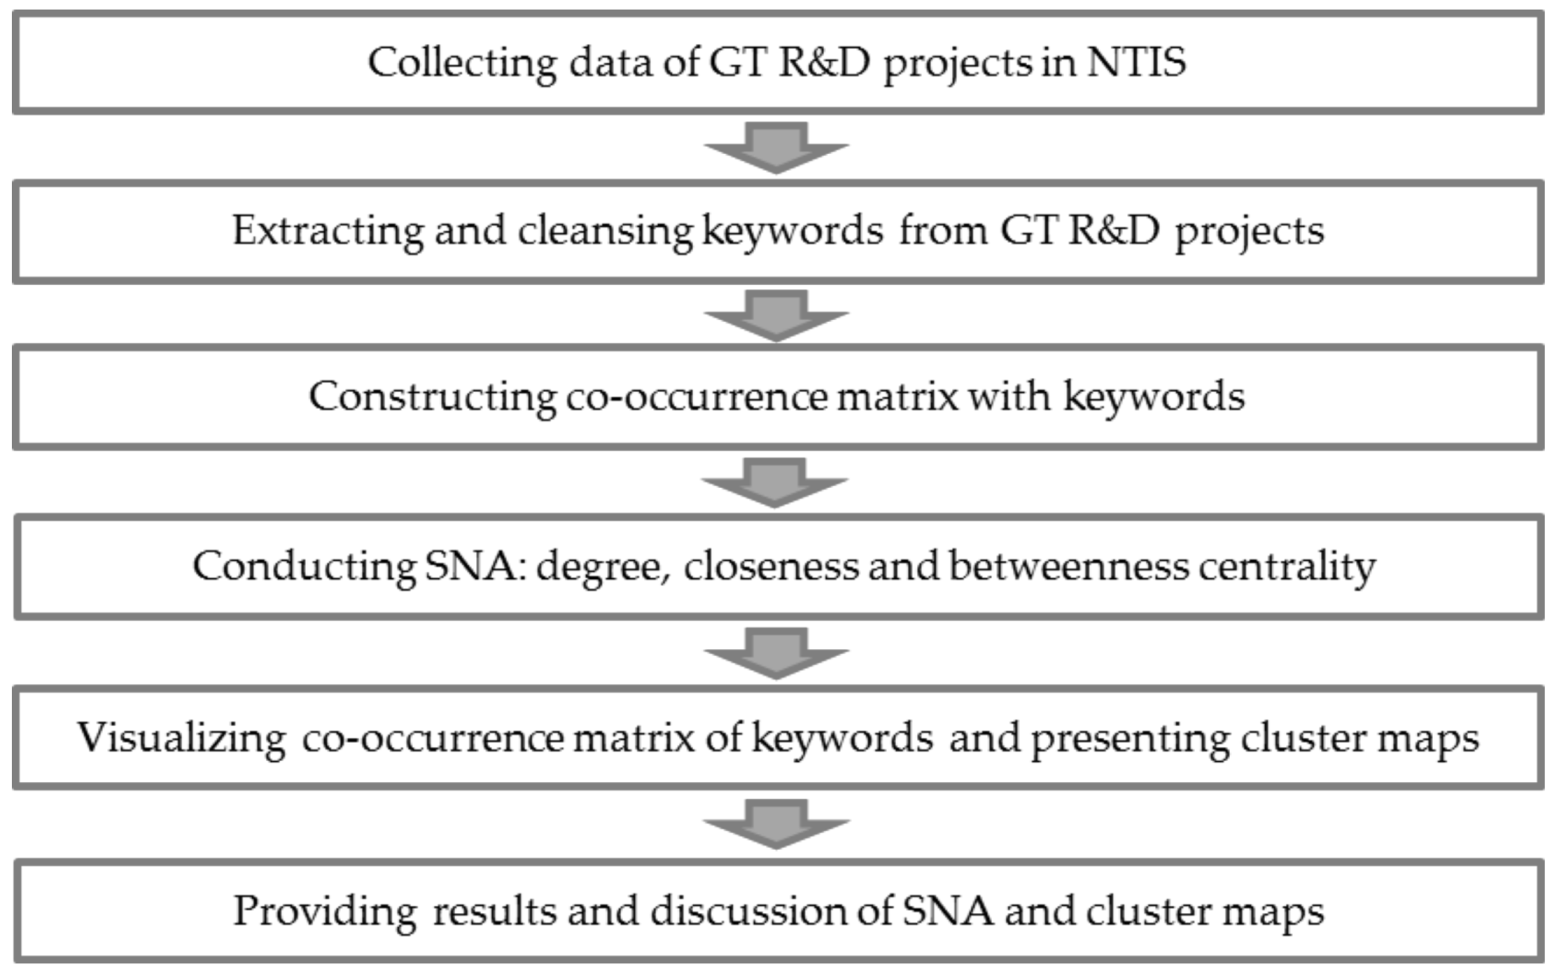
The research process used in this study entails five steps (Figure 1). The first step was to select GT-related projects in the national R&D database of NTIS. The second step was to extract keywords from the GT R&D projects and then to cleanse the keywords for standardization. The third step was to construct a co-occurrence matrix with the cleansed keywords. The next step was to conduct a social network analysis (SNA) by calculating degree, closeness, and betweenness centrality, and then to visualize the co-occurrence matrix to present cluster maps. In the last step, we provided results and a discussion of the SNA and cluster maps.
3.1. Data
Data were collected from the R&D database of the NTIS. We gathered 53,896 GT R&D projects during the recent six-year period from 2011 to 2016 by selecting the GT category in the NTIS database. The GT category consists of 57 sub-classes of GT, including a wide spectrum of technologies such as climate-change assessment and adaptation, renewable energy, highly-efficient technology, green information technology (IT), green cities, CO2 capture, storage, and processing, and virtual reality.
The purpose of this study is to examine national R&D trends in GT by applying network analysis to keywords of GT R&D projects. So, we extracted English keywords provided by each project. Before we conducted the network analysis, we cleansed the data by eliminating projects that had none of the keywords that were sought, or that included meaningless words or were conducted in non-technical fields. Then the extracted keywords were standardized, for example by decapitalizing, and unifying singular or plural terms, and replacing abbreviations with their full names. This standardization process was easily conducted by using MS Excel formulas. Before the analysis, we divided the six-year dataset into three periods of two years, which corresponded to the regime changes from President Lee Myung-bak (2011–2012) to President Park Geun-hye (2013–2016) and the policy change from the “Creative Economy” (2013–2014) to the “Fourth Industrial Revolution” (2015–2016). The final dataset considered <53,896 projects and <135,000 standardized keywords (Table 1).
3.2. Social Network Analysis
Social network analysis (SNA) has been increasingly used in fields of social science such as psychology, sociology, economics, and innovation studies. SNA applies network and graph theory to investigate social relations between people or objects [19,20,42,43,44,45]. In the field of GT, several studies have used SNA, for example to observe specialized GTs, emerging GT fields, and clusters in GT in green-tech firms in San Francisco, New York City, and London [19]. Analysis of keywords to find trending topics in international GT has been used to forecast the future development and change in GT [46].
This study uses SNA that considers the co-occurrence of keywords [1,46] and centrality [43,45]. Co-occurrence analysis is used to generate a matrix of relationships between pairs of keywords for further network analysis and visualization. Co-occurrence analysis identifies pairs of nodes (keywords in this study) that co-occur in a defined group of a network [43,47]. We calculated the co-occurrence frequency of pairs of keywords in the same R&D project. To observe the status and change of keywords, we adopted three basic centrality indices: degree, closeness, and betweenness [45]. Centrality quantifies the importance or influence of a specific object within a network [43,45,47,48].
Degree centrality counts the number of connections to other nodes in the network; the power and importance of a node in the network increases with its degree centrality [43,45]. To easily compare with other types of centrality, we standardized degree centrality by dividing it by the total number of nodes, not including the node considered.
Closeness centrality measures the inverse of the sum of the shortest distances between each node and every other node within the network [43]. A high value of closeness indicates that a node has close access directly and indirectly to other nodes; thus, this node can influence or monitor information flow between them [43,46].
Betweenness centrality represents the number of times that a node is on the shortest path that links two other nodes. Hence, high betweenness indicates that a node has high power to control the information flow through the network [43,45,46].
For the first step of SNA, to balance among the three periods and to easily conduct the network analysis, we selected ~250 keywords that had >20 occurrences in 2011–2012 and 2015–2016 and >33 occurrences in 2013–2014. Co-occurrence of keywords was calculated among all standardized keywords during each time period. Thus, each time period presented a different value of co-occurrence. In particular, the period of 2013 and 2014 included the largest number of keywords; so, we set a higher cut-line of occurrences for selecting ~250 keywords in this period than the other two periods. To generate a similarity matrix of keyword co-occurrence, we used KnowledgeMatrix (version 0.8) (Daejeon, Korea) developed by KISTI. Based on the similarity matrix, we attained all the values of degree, closeness, and betweenness centrality automatically calculated by Pajek (version 5.03) (Ljubljana, Slovenia). To visualize the network matrix for each time period, we used VOSviewer (version 1.6.5) (Leiden, Netherlands). Clusters in the three network maps clearly represent which technologies are dominant and how technologies are related each other. KnowledgeMatrix 0.8, Pajek 5.03, and VOSviewer 1.6.5 are freeware. We conducted all analyses on a personal desktop computer.
4. Results and Policy Implications
4.1. Keyword Trends in GT R&D
During 2011 and 2012 (Table 2), “solar cell” and “fuel cell”, respectively, had the first and second place in centrality. This result suggests that the Korean government invested heavily in R&D in these technologies. “Biomass”, “renewable energy”, and “high efficiency” were in the top five of degree, closeness, and betweenness centrality, respectively. Hence, Korean national R&D in energy was actively conducted in renewable energy and efficiency. During this period, the three centrality indices individually did not differ much, and betweenness centrality was relatively low; these results mean that the high-rank fields of GT were closely related to each other and were conducted independently in national R&D.
From 2013 to 2014 (Table 3), “light emitting diodes (LEDs)” had the highest centrality rank. This result suggests that interest and investment in national R&D on LEDs were sharply higher during 2011 and 2012. “Solar cell” and “fuel cell” had high degree and closeness centrality, so they were still important themes of national R&D. Other terms such as “monitoring”, “energy”, and “hybrid” newly appeared at high rank in betweenness centrality, although the values were lower than those of LEDs. This result means that the words “monitoring”, “energy”, “renewable energy”, and “hybrid” formed relatively crucial links among GT R&D; i.e., R&D in GT focused on renewable energy, efficient energy systems, and hybrid materials and systems at this time. Another remarkable point in 2013 and 2014 was the increase in the degree centrality of graphene; this trend occurred because graphene is widely used in developing solar cells, fuel cells, and second batteries.
From 2015 to 2016 (Table 4), “solar cell”, “fuel cell”, and “LEDs” continued to take the highest place in degree and closeness centrality. However, “climate change” appeared as the most powerful word that connected other keywords in the network; this trend implies that climate change became a directly and indirectly important factor for R&D in an increasing number of R&D projects. The “Internet of Things (IoT)” appeared in the three centrality indexes. This result occurred because the Korean government has actively promoted projects related to the Fourth Industrial Revolution since 2015, and because IoT is regarded as one of the important technologies to foster this revolution. Specifically, IoT is necessary in energy-managing systems, climate change and environmental disaster forecasts for events such as floods, LED lighting systems, and battery systems.
Overall, national R&D in Korea has been skewed toward solar cells and fuel cells (Table 5), despite an increasing necessity to diversify alternative energy sources and to identify new sources of renewable energy. Nevertheless, the main fields of GT R&D experienced changes from solar cells and fuel cells (2011–2012) to LEDs (2013–2014) and the IoT (2015–2016) depending on the national changes to science and technology R&D policies and plans. Throughout all time periods, betweenness centrality values were generally quite low (Table 2, Table 3 and Table 4); this result means that dominant fields of GT are not strongly related to each other, and that most R&D projects in GT are conducted independently.
4.2. Technical Cluster Trends in GT R&D
We drew network maps of each period by using the same network matrix that was used in the keyword analysis. We kept the same conditions when creating the network maps on VOSviewer: resolution of 1.0, minimum cluster size of 5, and label size variation of 0.6. The network maps show keywords clusters, where are emphasized by assigning distinct colors. VOSviewer does this automatically. In the network map, we detected fields of GT that were not found in the keyword analysis. We also discovered rich information across GT R&D.
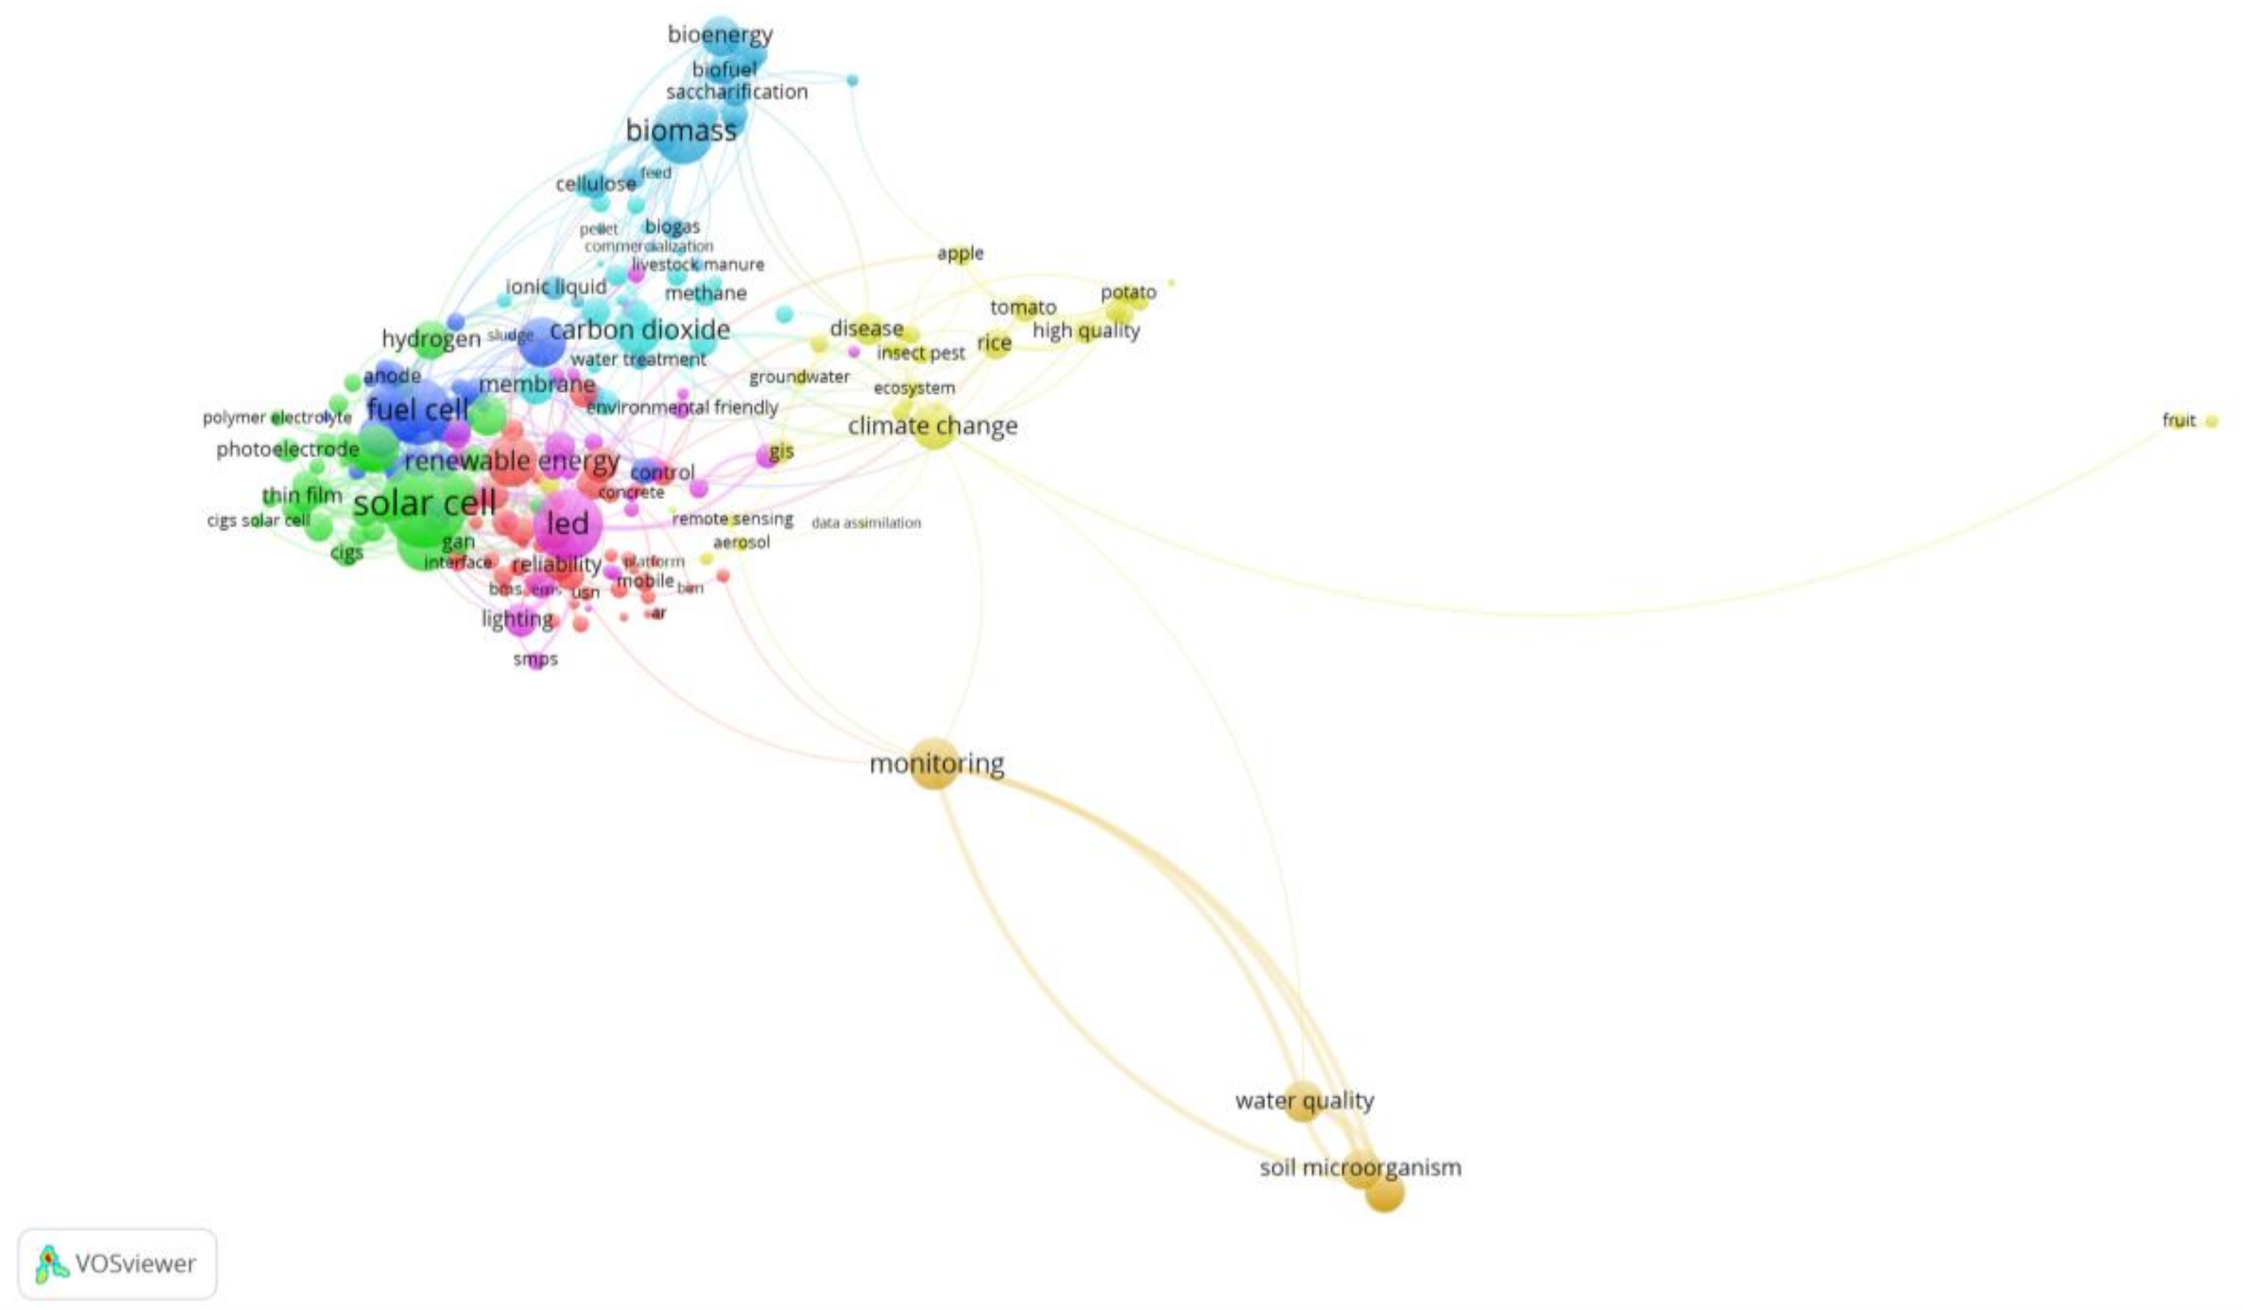
During 2011 and 2012, the network map (Figure 2) consists of eight clusters. From largest to smallest, these were: energy efficiency, solar cell, fuel cell, agricultural adaptation, LED, recycling, bioenergy, and soil improvement. Energy efficiency became the biggest cluster by including subsets such as green IT, energy monitoring system, and cloud computing. Similar to the keyword analysis, solar cell and fuel cell appeared as dominant technical fields in GT R&D. In contrast to keyword analysis, agricultural adaptation and soil improvement were major areas of national R&D in GT; neither of these fields was detected in keyword analysis. The network map shows two interesting clusters: technology to recycle waste and wastewater, and bioenergy including biodiesel, bioethanol, biofuel, and biomass.
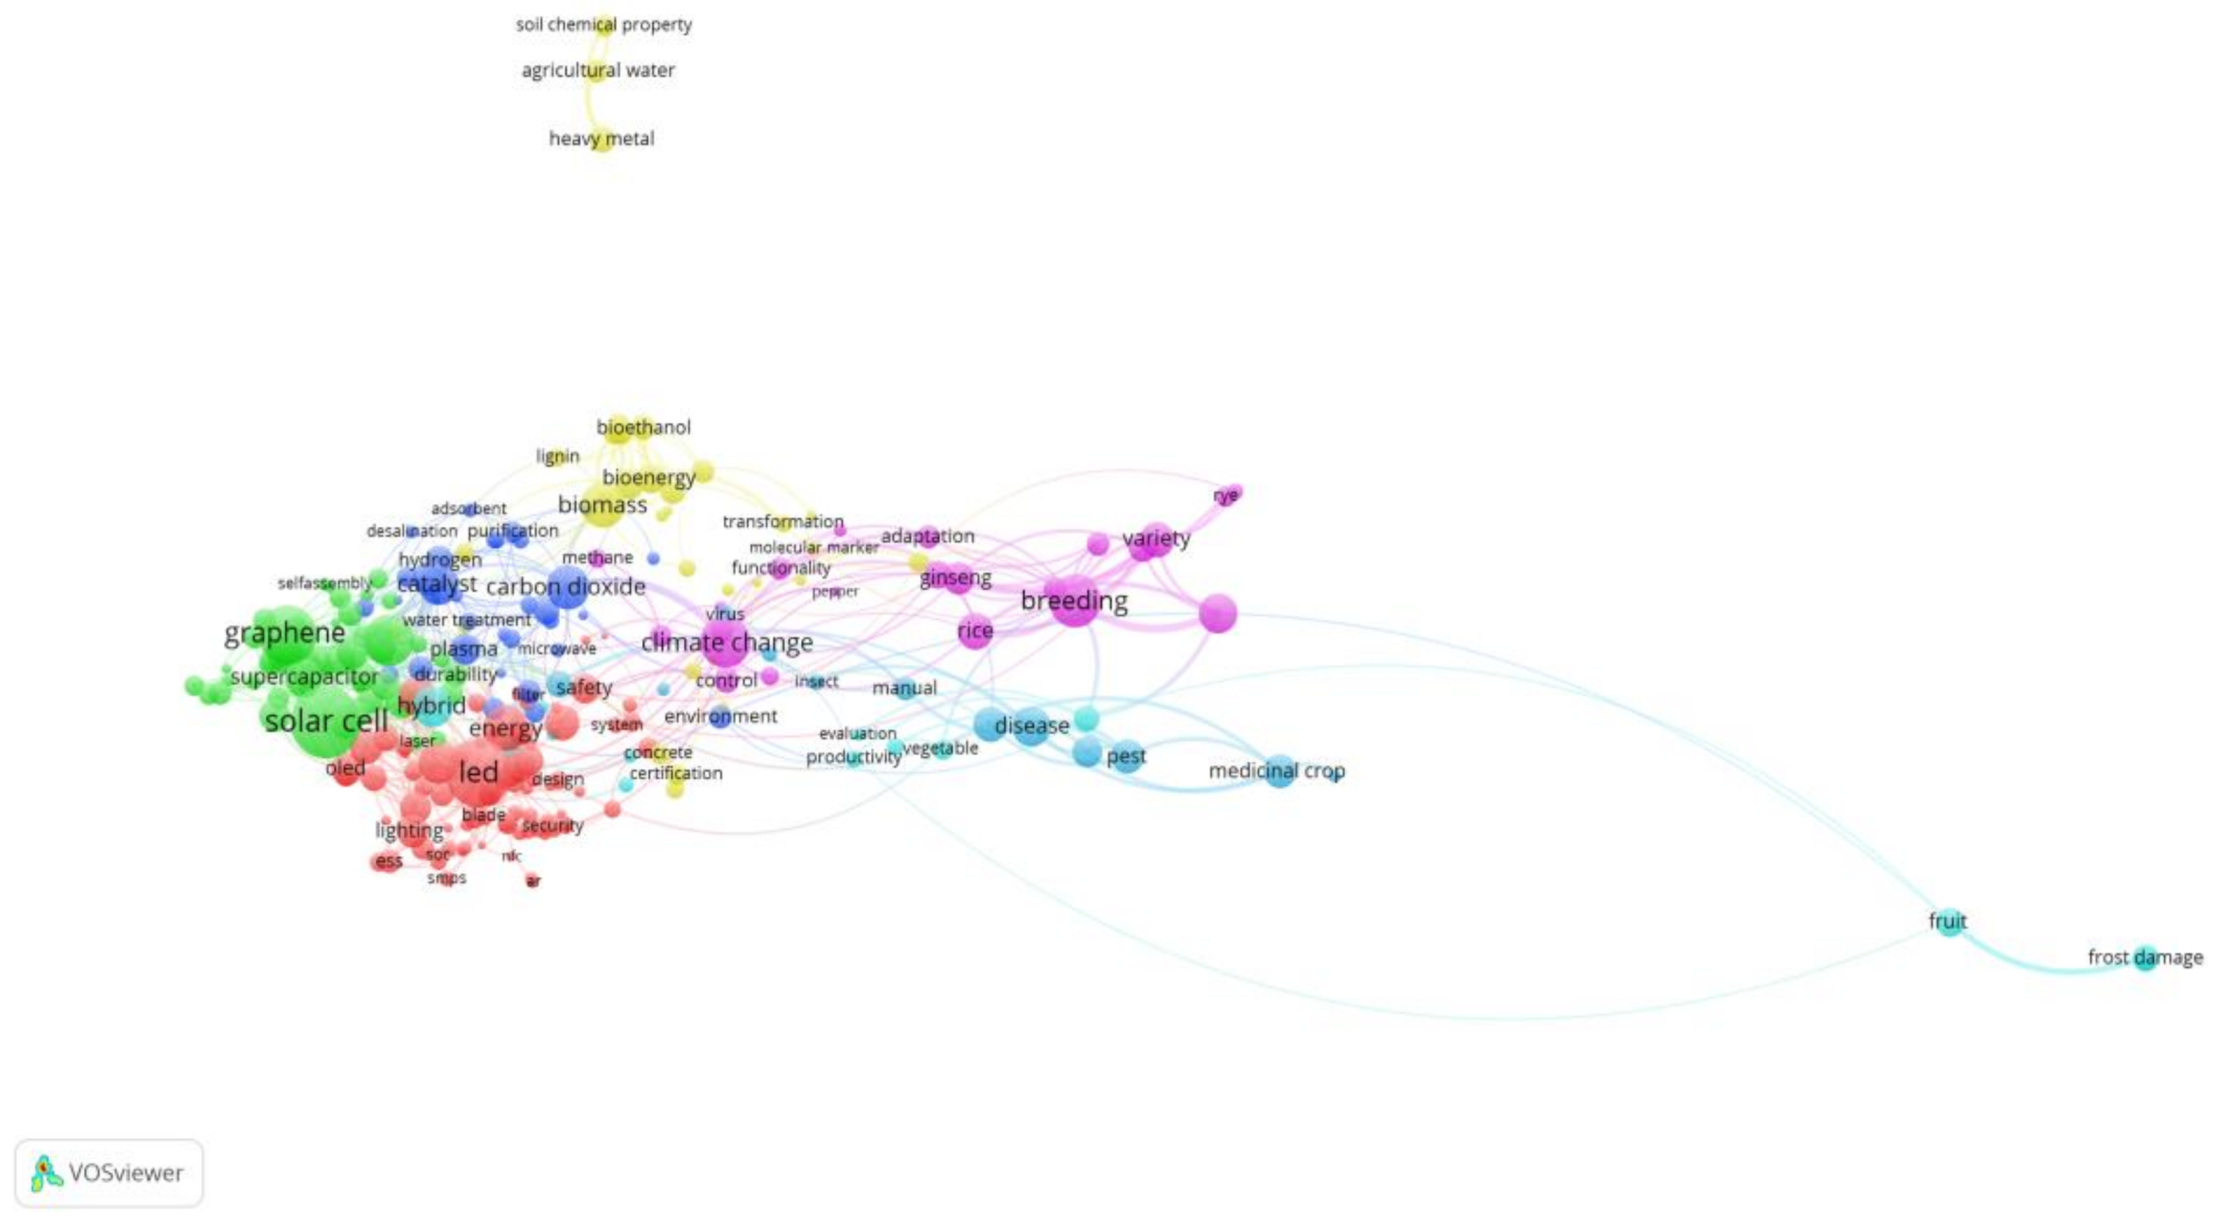
During 2013 and 2014, the network map (Figure 3) consisted of seven clusters. From largest to smallest, these were: smart energy system, solar and fuel cells, CO2 reduction, bioenergy, agricultural adaptation, fruit protection, and disease prevention. The ‘smart energy system’ cluster is related to energy efficiency, LED for lighting efficiency, and various information technologies such as big data, mobile sensor, and the IoT. During this period, solar and fuel cells are included in the same cluster as secondary batteries and graphene. Carbon dioxide (CO2) reduction emerged as newly important field due to the development of carbon-lowering and CO2-absorbing technologies.
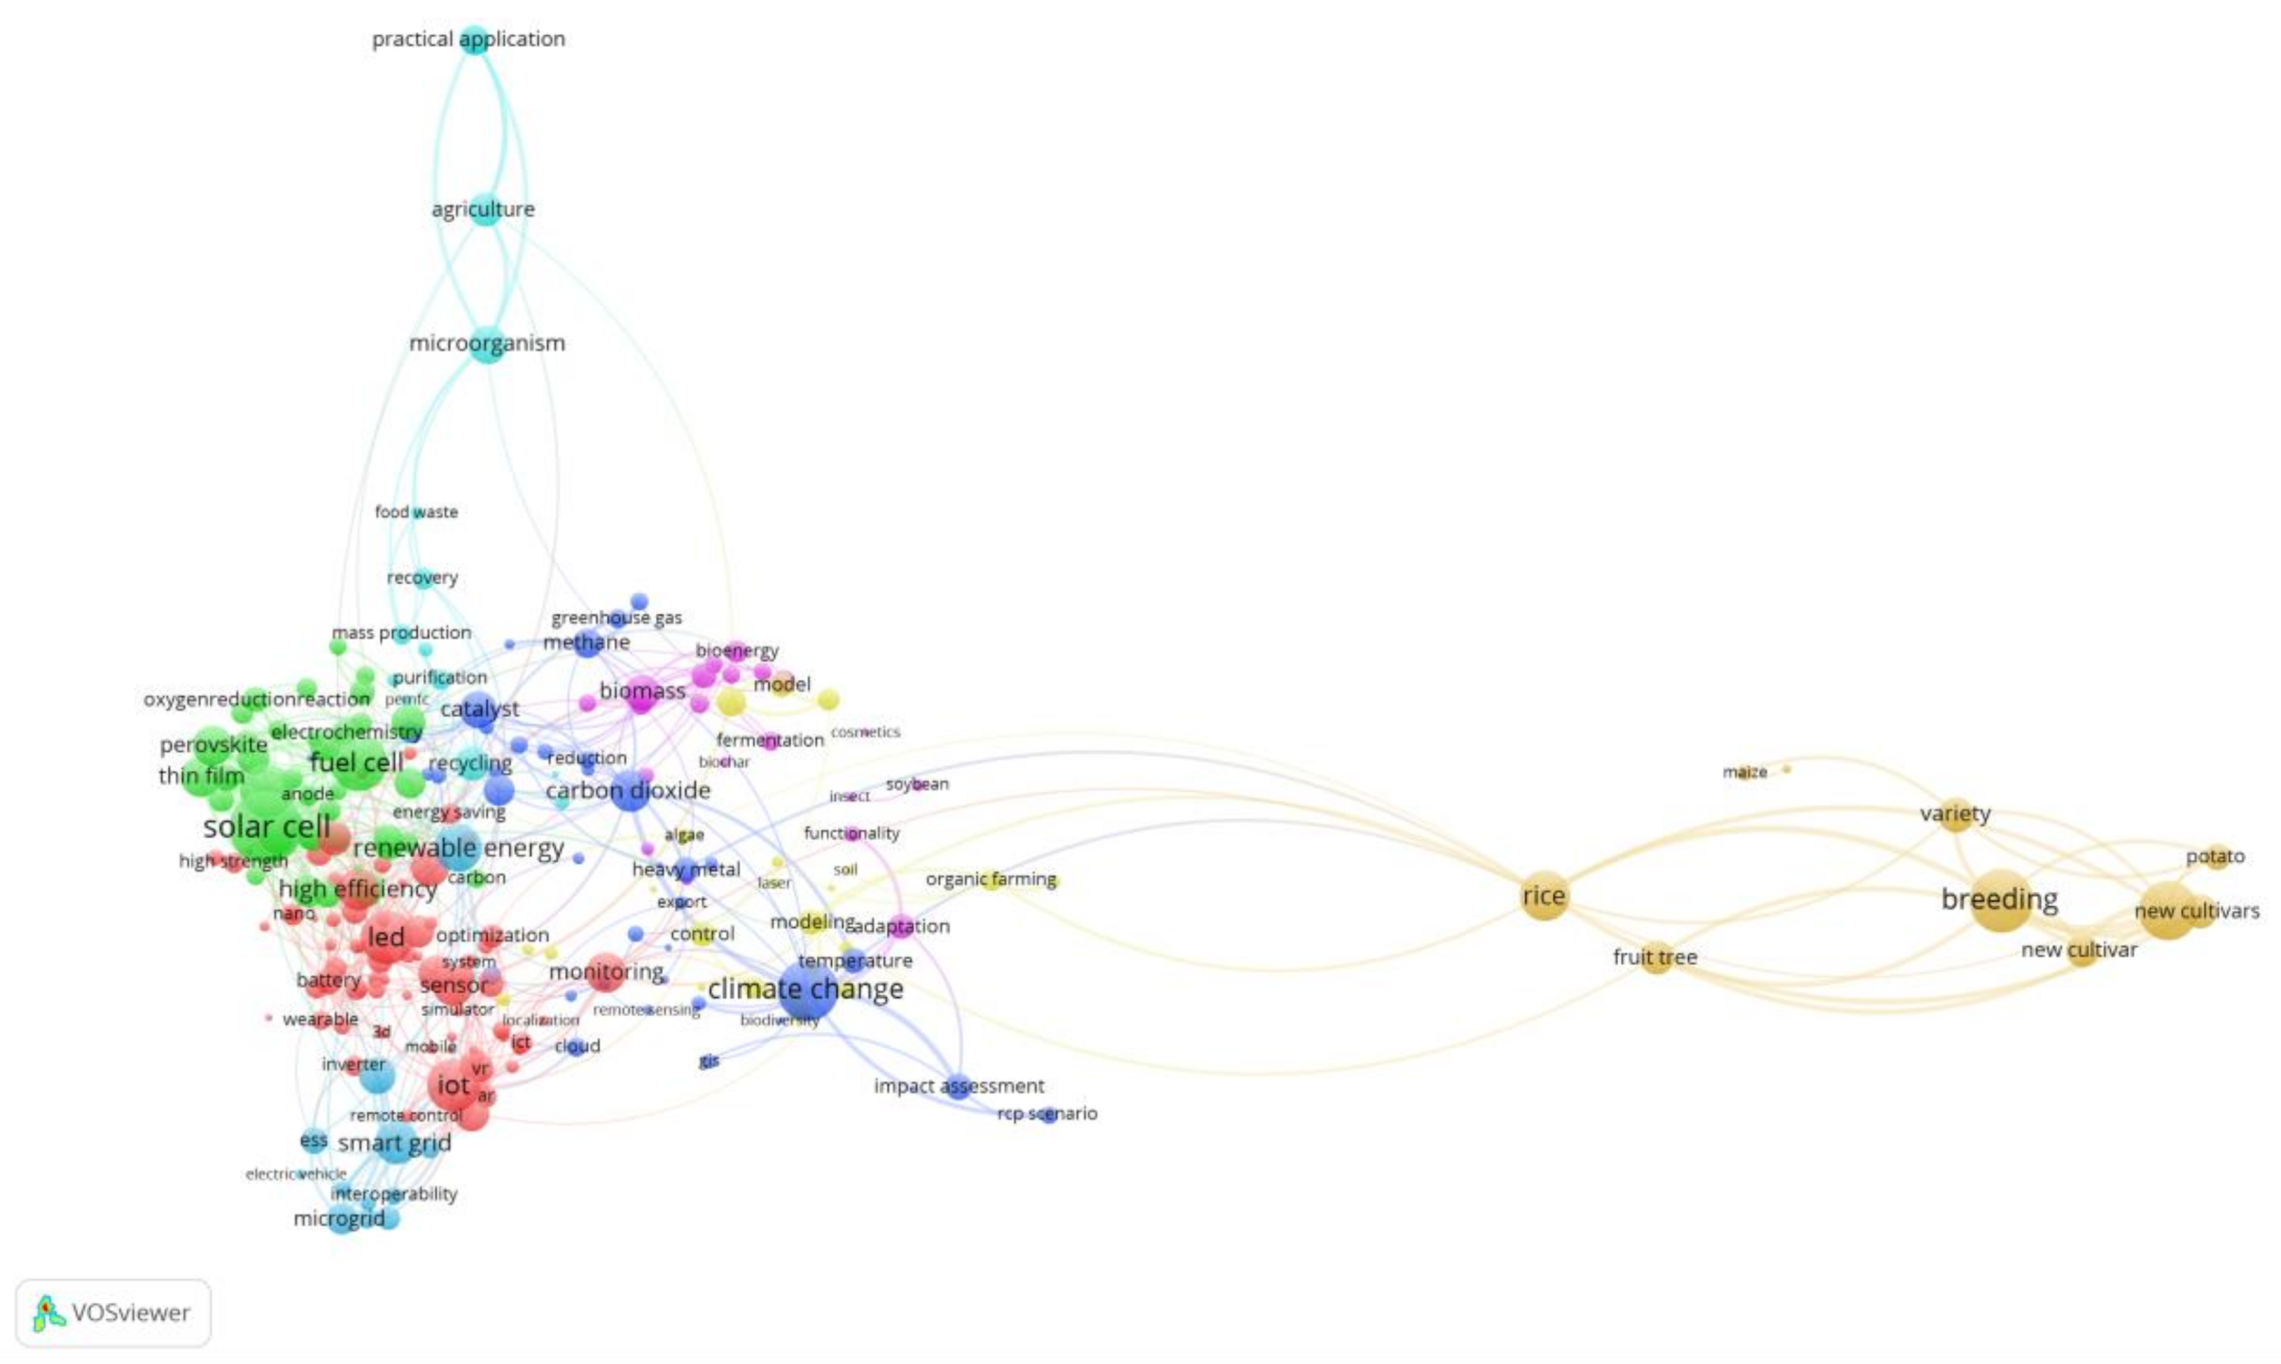
During 2015 and 2016, the network map (Figure 4) consisted of eight clusters. From the largest to smallest, these were: smart lighting system, solar and fuel cells, CO2 reduction, agricultural adaptation, bioenergy, biogas, energy management system, and breeding. Smart lighting systems were clustered mainly with LED and LED-related efficient managing technologies. The IoT appeared as the most influential keyword in this period; this term may be related to the development of smart lighting systems. Most clusters seemed to be constructed as in the earlier two periods, but the energy management system and breeding clusters were new. An energy management system is a technical cluster that includes components such as smart grids, energy storage systems, and battery management systems. Breeding was composed of technologies to promote the growth of crops and fruits, as well as to protect them from climate change.
The cluster analysis gave similar results to the keyword analysis for the main fields of national R&D in GT such as solar cells, fuel cells, and LEDs. However, the cluster maps present other various fields of GT that were not found by the keyword analysis, including bioenergy, CO2 reduction, breeding crops, agriculture adaptation, and soil improvement (Figure 2, Figure 3 and Figure 4). Interestingly, the cluster maps revealed relations between technologies and keywords intuitively. For example, solar cells and fuel cells were linked to specific technological terms: solar cells to graphene, thin films, perovskite; and fuel cells to electrodes, catalysts, and solid oxides (Figure 2, Figure 3 and Figure 4). During the entire period, national R&D projects in climate change were strongly related to technologies in breeding crops and fruits, ecosystem, and CO2 reduction or capture. Renewable energy appears to be connected to biomass, bioenergy, and bioethanol, as well as to smart grids, solar cells, fuel cells, and energy storage. Thus, renewable energy is a component of various GTs. LEDs were linked to revolutionizing technologies such as smart farming, smart factories, and the IoT.
5. Discussion
Despite the globally-increasing importance and interest in GT, the capacity of Korean national R&D in GT has tended to be limited to a few technologies related to solar cells, fuel cells, LEDs, and secondary batteries. This limitation occurred because the Korean government established and implemented the national R&D policy in GT as a means to expand the economy and to create jobs [5,15,49]. R&D investment in GT has dropped from 4.13 trillion won in 2013 to 1.93 trillion won in 2016 due to the regime change in 2013. Accordingly, GT R&D tended to be influenced greatly by the government’s intention through a top-down manner.
The evolutionary trends of GT R&D provide useful insights for policymakers in R&D management and the national development plan. GT can contribute to fostering SD and to finding a new technological niche; hence, we suggest five tactics in this section to reinforce GT in Korea.
First, the Korean government should raise R&D investment in GT to maintain its continuity and to invigorate the development of GT [49]. An increase in the amount of R&D investment in GT will lead to the qualitative development of GT and to advances in the domestic status of GT.
Second, a bottom-up approach should be applied to R&D management systems in the GT field to reflect the needs for specific GTs in a market or local society [5,49,50]. R&D policy and support in a GT field have tended to be planned and implemented by a top-down approach. In particular, during the former President Lee Myung-bak’s regime, the central government strategically designed and developed GT to promote low-carbon green growth.
Third, the systematic and consistent study of international trends in green, climate, and renewable technologies should be conducted to guide the expansion of the scope of GT beyond its current focus on a few technologies such as solar cells, fuel cells, and LEDs. This expansion will help Korea to meet the trend of the world market, and to expand sales and applications of domestic GTs.
Fourth, to increase the national investment and interest in GT, it should be followed by the promotion of the practical use of GT in domestic and world markets. Therefore, the Korean government should strengthen industry-university-institute collaboration and support the commercialization of developed GT [49].
Fifth, to continue the development of national GT R&D in the long term, the negative effects of GT should be considered during the R&D process. Therefore, policymakers should devote the R&D capacity to predict negative effects of GT and to establish a standard for defining and measuring them [15,51].
6. Conclusions
This study used a social network analysis and visualization of network maps to present the evolution of national R&D in Korea. This study searched for keywords of national R&D projects that were related to green technologies from 2011 to 2016, divided into three periods of two years.
We identified the following important phenomena in the GT R&D trend. During the entire period, the Korean government tended to focus its GT R&D on solar cells, fuel cells, renewable energy, and LEDs. The network analysis of keywords detected that the special domain of GT moved from solar cells and fuel cells (2011–2012) to LEDs (2013–2014) and then to the IoT and climate change (2015–2016).
Network visualization detected some fields of GT that were not found in the SNA: examples include bioenergy, agricultural adaptation, green IT, and CO2 reduction. This visualization also revealed technical cluster construction in the GT R&D field, as well as connections between key technologies. The most dominant technologies such as solar cells, fuel cells, and LEDs presented relations with their specific sub-technologies or components. Distinctive findings include the fact that climate change appeared to be linked to technologies for breeding crops and fruits, and to ecosystems, and that technologies for CO2 reduction or capture and LEDs were connected to the representative technologies of Fourth Industrialization Revolution such as smart farming, smart factories, and the IoT.
The present study has some limitations. Because it used only national R&D data of green technology, this research could not show all national R&D trends in GT, such as those conducted at the business level. Moreover, the study was limited to technologies that are included in the national classification code of GT; these data may exclude other technologies that are regarded as green in other countries or time periods. Although keyword analysis gives a general understanding of the technical trend changes of GT, this study cannot identify factors that affect planning and conducting national R&D in GT, such as R&D budget, project performers, and outcomes. Thus, we recommend that future studies should include information about GT R&D in the private sector, and should expand the range of GTs considered.
Acknowledgments
This research was supported by the “Establishment and management of national research outcome utilization system” project of Korea Institute of Science and Technology Information (KISTI).
Author Contributions
The paper was written by Jae Yun Jeong. Inje Kang, Ki Seok Choi, and Byeong-Hee Lee contributed to designing the study, conducting social network analysis, and interpreting the results. All authors have read and approved the final paper.
Conflicts of Interest
The authors have no conflict of interest.
References
- Zhu, J.; Hua, W. Visualizing the knowledge domain of sustainable development research between 1987 and 2015: A bibliometric analysis. Scientometrics 2017, 110, 893–914. [Google Scholar] [CrossRef]
- Jang, E.K.; Park, M.S.; Roh, T.W.; Han, K.J. Policy Instruments for Eco-Innovation in Asian Countries. Sustainability 2015, 7, 12586–12614. [Google Scholar] [CrossRef]
- Christen, M.; Schmidt, S. A formal framework for conceptions of sustainability—A theoretical contribution to the discourse in sustainable development. Sustain. Dev. 2012, 20, 400–410. [Google Scholar] [CrossRef]
- Smith, A.; Voß, J.; Grin, J. Innovation studies and sustainability transitions: The allure of the multi-level perspective and its challenges. Res. Policy 2010, 39, 435–448. [Google Scholar] [CrossRef]
- Yun, S. The Ideological Basis and the Reality of Low Carbon Green Growth. ECO 2009, 13, 219–266. [Google Scholar]
- Harris, J. Sustainability and sustainable development. Int. Soc. Ecol. Econ. 2003, 1, 1–12. [Google Scholar]
- Calza, F.; Parmentola, A.; Tutore, I. Types of Green Innovations: Ways of Implementation in a Non-Green Industry. Sustainability 2017, 9, 1301. [Google Scholar] [CrossRef]
- Ma, Y.; Hou, G.; Xin, B. Green Process Innovation and Innovation Benefit: The Mediating Effect of Firm Image. Sustainability 2017, 9, 1778. [Google Scholar] [CrossRef]
- Albort-Morant, G.; Henseler, J.; Leal-Millán, A.; Cepeda-Carrión, G. Mapping the Field: A Bibliometric Analysis of Green Innovation. Sustainability 2017, 9, 1011. [Google Scholar] [CrossRef]
- Schiederig, T.; Tietze, F.; Herstatt, C. Green innovation in technology and innovation management—An exploratory literature review. R&D Manag. 2012, 42, 180–192. [Google Scholar]
- Oltra, V.; Saint Jean, M. Sectoral systems of environmental innovation: An application to the French automotive industry. Technol. Forecast. Soc. Chang. 2009, 76, 567–583. [Google Scholar] [CrossRef]
- Horbach, J. Determinants of environmental innovation—New evidence from German panel data sources. Res. Policy 2008, 37, 163–173. [Google Scholar] [CrossRef]
- Driessen, P.; Hillebrand, B. Adoption and Diffusion of Green Innovations. In Marketing for Sustainability: Towards Transactional Policy-Making; Bartels, G., Nelissen, W., Eds.; IOS Press: Amsterdam, The Netherland, 2002; pp. 343–355. [Google Scholar]
- Hermanns, H. Green Growth-Ecological Modernization Korean-Style? J. 21 Century Political Sci. Assoc. 2015, 25, 263–286. [Google Scholar] [CrossRef]
- Lee, S.; Go, I.; Jeong, S. Issue Paper: Concept of Green Technology and Direction of Policy Development; KISTEP: Seoul, Korea, 2012. [Google Scholar]
- Han, S. Green Tech Review: The Role of Green Technology in Creative Economy; Green Technology Center: Seoul, Korea, 2013. [Google Scholar]
- Heng, X.; Zou, C. How Can Green Technology Be Possible? Asian Soc. Sci. 2010, 6, 110–114. [Google Scholar] [CrossRef]
- Leenders, M.; Chandra, Y. Antecedents and consequences of green innovation in the wine industry: The role of channel structure. Technol. Anal. Strateg. Manag. 2013, 25, 203–218. [Google Scholar] [CrossRef]
- Marra, A.; Antonelli, P.; Pozzi, C. Emerging green-tech specializations and clusters—A network analysis on technological innovation at the metropolitan level. Renew. Sustain. Energy Rev. 2017, 67, 1037–1046. [Google Scholar] [CrossRef]
- Marra, A.; Antonelli, P.; Dell’Anna, L.; Pozzi, C. A network analysis using metadata to investigate innovation in clean-tech–Implications for energy policy. Energy Policy 2015, 86, 17–26. [Google Scholar] [CrossRef]
- Cooke, P. Clean tech and an analysis of the platform nature of life sciences: Further reflections upon platform policies. Eur. Plan. Stud. 2008, 16, 375–393. [Google Scholar] [CrossRef]
- Schumacher, E.F. Small Is Beautiful: Economics as If People Mattered; Harper and Row: New York, NY, USA, 1973. [Google Scholar]
- Mittlefehldt, S. From appropriate technology to the clean energy economy: Renewable energy and environmental politics since the 1970s. J. Environ. Stud. Sci. 2018, 1–8. [Google Scholar] [CrossRef]
- Bulavskaya, T.; Reynès, F. Job creation and economic impact of renewable energy in the Netherlands. Renew. Energy 2018, 119, 528–538. [Google Scholar] [CrossRef]
- Pehnt, M. Dynamic life cycle assessment (LCA) of renewable energy technologies. Renew. Energy 2006, 31, 55–71. [Google Scholar] [CrossRef]
- Reddy, S.; Painuly, J. Diffusion of renewable energy technologies—Barriers and stakeholders’ perspectives. Renew. Energy 2004, 29, 1431–1447. [Google Scholar] [CrossRef]
- Rand, B.P.; Ekins-Daukes, N.; Haug, F. Editorial for ‘Special Issue on Advanced Solar Cell Technology’. Available online: http://0-iopscience-iop-org.brum.beds.ac.uk/article/10.1088/2040-8986/aa98b7/pdf (accessed on 30 March 2018).
- Yoshikawa, K.; Kawasaki, H.; Yoshida, W.; Irie, T.; Konishi, K.; Nakano, K.; Uto, T.; Adachi, D.; Kanematsu, M.; Uzu, H.; et al. Silicon heterojunction solar cell with interdigitated back contacts for a photoconversion efficiency over 26%. Nat. Energy 2017, 2, 17032. [Google Scholar] [CrossRef]
- Han, G.; Zhang, S.; Boix, P.; Wong, L.; Sun, L.; Lien, S. Towards high efficiency thin film solar cells. Prog. Mater. Sci. 2017, 87, 246–291. [Google Scholar] [CrossRef]
- Wang, S.; Jiang, S. Prospects of fuel cell technologies. Natl. Sci. Rev. 2017, 4, 163–166. [Google Scholar] [CrossRef]
- Sharaf, O.; Orhan, M. An overview of fuel cell technology: Fundamentals and applications. Renew. Sustain. Energy Rev. 2014, 32, 810–853. [Google Scholar] [CrossRef]
- Eggimann, S.; Mutzner, L.; Wani, O.; Schneider, M.; Spuhler, D.; Moy de Vitry, M.; Beutler, P.; Maurer, M. The Potential of Knowing More: A Review of Data-Driven Urban Water Management. Environ. Sci. Technol. 2017, 51, 2538–2553. [Google Scholar] [CrossRef] [PubMed]
- Richter, B.; Mathews, R.; Harrison, D.; Wigington, R. Ecologically sustainable water management: Managing river flows for ecological integrity. Ecol. Appl. 2003, 13, 206–224. [Google Scholar] [CrossRef]
- Park, J.; Kim, S. An Analysis on the Costs and Outcomes of Green Technology Innovation: Focusing on Production Innovation Activities in Manufacturing SMEs in Korea. J. Technol. Innov. 2010, 18, 199–218. [Google Scholar]
- Krass, D.; Nedorezov, T.; Ovchinnikov, A. Environmental taxes and the choice of green technology. Prod. Oper. Manag. 2013, 22, 1035–1055. [Google Scholar] [CrossRef]
- Porter, M.; van der Linde, C. Green and Competitiveness: Ending the Stalemate. Harvard Business Review, September–October 1995; 120–134. [Google Scholar]
- Ambec, S.; Cohen, M.; Elgie, S.; Lanoie, P. The Porter hypothesis at 20: Can environmental regulation enhance innovation and competitiveness? Rev. Environ. Econ. Policy 2013, 7, 2–22. [Google Scholar] [CrossRef]
- Eyraud, L.; Clements, B.; Wane, A. Green investment: Trends and determinants. Energy Policy 2013, 60, 852–865. [Google Scholar] [CrossRef]
- Jaffe, A.; Newell, R.; Stavins, R. A tale of two market failures: Technology and environmental policy. Ecol. Econ. 2005, 54, 164–174. [Google Scholar] [CrossRef]
- Rennings, K. Redefining innovation—Eco-innovation research and the contribution from ecological economics. Ecol. Econ. 2000, 32, 319–332. [Google Scholar] [CrossRef]
- NTIS. Available online: http://www.ntis.go.kr/en/GpIntroduction.do (accessed on 18 September 2017).
- Jeong, D.; Koo, Y. Analysis of Research Trends in Water Resource Management Using Network Analysis. Appl. Mech. Mater. 2015, 752, 1430–1440. [Google Scholar] [CrossRef]
- Lee, S. Network Analysis Methodology; Nonhyung: Seoul, Korea, 2012. [Google Scholar]
- Borgatti, S.; Mehra, A.; Brass, D.; Labianca, G. Network analysis in the social sciences. Science 2009, 323, 892–895. [Google Scholar] [CrossRef] [PubMed]
- Freeman, L. Centrality in social networks conceptual clarification. Soc. Netw. 1979, 1, 215–239. [Google Scholar] [CrossRef]
- Jeong, D.; Kwon, O.; Kwon, Y. Network Analysis of Green Technology using Keyword of Green Field. Korean J. Contents 2012, 12, 511–518. [Google Scholar] [CrossRef]
- He, Q. Knowledge discovery through co-word analysis. Libr. Trends 1999, 48, 133–159. [Google Scholar]
- Butts, C. Social network analysis: A methodological introduction. Asian J. Soc. Psychol. 2008, 11, 13–41. [Google Scholar] [CrossRef]
- Hong, M.; Hwang, K.; Hong, J.; Lee, K. The Survey and Analysis of Technology Level on Korea’s Key Green Technologies and its Implications. J. Korea Technol. Innov. Soc. 2013, 16, 476–505. [Google Scholar]
- Seo, L. A study on the Development Directions and Situations of the Green Growth Policy in Korea. Korean Bus. Rev. 2012, 5, 93–113. [Google Scholar]
- Zehner, O. Unintended Consequences of Green Technologies. In Green Technology; Robbins, P., Mulvaney, D., Golson, J., Eds.; Sage: London, UK, 2011; pp. 427–432. [Google Scholar]
Figure 1.
Research framework.

Figure 2.
Network map of GT R&D presenting technology clusters in different colors (2011–2012).

Figure 3.
Network map of GT R&D presenting technology clusters in different colors (2013–2014).

Figure 4.
Network map of GT R&D presenting technology clusters in different colors (2015–2016).


Table 1.
The number of green technology (GT) research and development (R&D) projects and their keywords.
Table 1.
The number of green technology (GT) research and development (R&D) projects and their keywords.
| 2011–2012 | 2013–2014 | 2015–2016 | |
|---|---|---|---|
| GT R&D projects | 13,430 | 24,901 | 15,565 |
| Standardized keywords | 31,754 | 62,925 | 40,830 |
Table 2.
Top 10 keywords with highest centrality of the network (2011–2012).
| Rank | Degree Centrality | Closeness Centrality | Betweenness Centrality | |||
|---|---|---|---|---|---|---|
| Keyword | Value | Keyword | Value | Keyword | Value | |
| 1 | solar cell | 0.323 | solar cell | 0.564 | fuel cell | 0.100 |
| 2 | fuel cell | 0.311 | fuel cell | 0.560 | solar cell | 0.094 |
| 3 | biomass | 0.226 | renewable energy | 0.536 | biomass | 0.081 |
| 4 | renewable energy | 0.226 | biomass | 0.522 | renewable energy | 0.069 |
| 5 | high efficiency | 0.220 | high efficiency | 0.519 | high efficiency | 0.062 |
| 6 | catalyst | 0.189 | catalyst | 0.511 | polymer | 0.051 |
| 7 | LED | 0.165 | nanoparticle | 0.498 | LED | 0.049 |
| 8 | polymer | 0.165 | polymer | 0.492 | catalyst | 0.041 |
| 9 | nanoparticle | 0.152 | optimization | 0.487 | nanoparticle | 0.030 |
| 10 | thin film | 0.152 | thin film | 0.485 | climate change | 0.028 |
Table 3.
Top 10 keywords with highest centrality of the network (2013–2014).
| Rank | Degree Centrality | Closeness Centrality | Betweenness Centrality | |||
|---|---|---|---|---|---|---|
| Keyword | Value | Keyword | Value | Keyword | Value | |
| 1 | LED | 0.344 | LED | 0.580 | LED | 0.049 |
| 2 | solar cell | 0.336 | solar cell | 0.575 | monitoring | 0.042 |
| 3 | hybrid | 0.308 | energy | 0.566 | energy | 0.038 |
| 4 | fuel cell | 0.280 | hybrid | 0.561 | solar cell | 0.035 |
| 5 | energy | 0.272 | monitoring | 0.559 | hybrid | 0.032 |
| 6 | graphene | 0.264 | fuel cell | 0.552 | climate change | 0.029 |
| 7 | high efficiency | 0.260 | high efficiency | 0.549 | renewable energy | 0.027 |
| 8 | monitoring | 0.260 | renewable energy | 0.542 | sensor | 0.026 |
| 9 | renewable energy | 0.240 | catalyst | 0.534 | high efficiency | 0.026 |
| 10 | sensor | 0.224 | sensor | 0.534 | fuel cell | 0.026 |
Table 4.
Top 10 keywords with highest centrality of the network (2015–2016).
| Rank | Degree Centrality | Closeness Centrality | Betweenness Centrality | |||
|---|---|---|---|---|---|---|
| Keyword | Value | Keyword | Value | Keyword | Value | |
| 1 | solar cell | 0.272 | solar cell | 0.537 | climate change | 0.061 |
| 2 | LED | 0.264 | fuel cell | 0.534 | monitoring | 0.058 |
| 3 | fuel cell | 0.259 | LED | 0.533 | LED | 0.046 |
| 4 | renewable energy | 0.243 | renewable energy | 0.531 | IoT | 0.042 |
| 5 | graphene | 0.226 | monitoring | 0.530 | eco-friendly | 0.042 |
| 6 | IoT | 0.226 | module | 0.527 | renewable energy | 0.040 |
| 7 | high efficiency | 0.222 | eco-friendly | 0.520 | fuel cell | 0.038 |
| 8 | eco-friendly | 0.218 | energy | 0.520 | module | 0.028 |
| 9 | monitoring | 0.213 | IoT | 0.519 | energy | 0.026 |
| 10 | catalyst | 0.201 | high efficiency | 0.511 | solar cell | 0.026 |
Table 5.
Trend changes of keywords based on the total value of the three centralities.
| Rank | 2011–2012 | 2013–2014 | 2015–2016 |
|---|---|---|---|
| 1 | solar cell | LED | LED |
| 2 | fuel cell | solar cell | solar cell |
| 3 | renewable energy | hybrid | fuel cell |
| 4 | biomass | energy | renewable energy |
| 5 | high efficiency | monitoring | IoT |
© 2018 by the authors. Licensee MDPI, Basel, Switzerland. This article is an open access article distributed under the terms and conditions of the Creative Commons Attribution (CC BY) license (http://creativecommons.org/licenses/by/4.0/).
Share and Cite
MDPI and ACS Style
Jeong, J.Y.; Kang, I.; Choi, K.S.; Lee, B.-H. Network Analysis on Green Technology in National Research and Development Projects in Korea. Sustainability 2018, 10, 1043. https://0-doi-org.brum.beds.ac.uk/10.3390/su10041043
AMA Style
Jeong JY, Kang I, Choi KS, Lee B-H. Network Analysis on Green Technology in National Research and Development Projects in Korea. Sustainability. 2018; 10(4):1043. https://0-doi-org.brum.beds.ac.uk/10.3390/su10041043
Chicago/Turabian StyleJeong, Jae Yun, Inje Kang, Ki Seok Choi, and Byeong-Hee Lee. 2018. "Network Analysis on Green Technology in National Research and Development Projects in Korea" Sustainability 10, no. 4: 1043. https://0-doi-org.brum.beds.ac.uk/10.3390/su10041043
Note that from the first issue of 2016, this journal uses article numbers instead of page numbers. See further details here.