Sustainable Water Use in Agriculture: A Review of Worldwide Research
by
 , , and
Juan F. Velasco-Muñoz
1 ,
,
José A. Aznar-Sánchez
1,*,
Luis J. Belmonte-Ureña
1 and
Isabel M. Román-Sánchez
1,2
1
Department of Economics and Business, Research Centre CIAIMBITAL and CAESCG, University of Almería, 04120 Almería, Spain
2
Solar Energy Research Centre (CIESOL), Joint Centre University of Almería-CIEMAT, 04120 Almería, Spain
*
Author to whom correspondence should be addressed.
Sustainability 2018, 10(4), 1084; https://0-doi-org.brum.beds.ac.uk/10.3390/su10041084
Submission received: 25 February 2018
/
Revised: 22 March 2018
/
Accepted: 3 April 2018
/
Published: 5 April 2018
(This article belongs to the Special Issue Sustainable Irrigation for the Future: Addressing the Challenges to Improved Water Use Efficiency)
Abstract
:Sustainability of water use in agriculture is a line of research that has gained in importance worldwide. The present study reviewed 25 years of international research on sustainable water use in agriculture. A bibliometric analysis was developed to sample 2084 articles. Results indicate exponential growth in the number of articles published per year, with research in this field having acquired a global scale. Environmental Science and Agricultural and Biological Sciences are the main categories. Three journals—Agricultural Water Management, Water Resources Management and Nongye Gongcheng Xuebao Agricultural Engineering—published the most of the articles. China, the U.S., Australia, India and Germany produced the most research. The three institutions that published the most articles were all Chinese (Chinese Academy of Sciences, China Agricultural University and Northwest A&F University). The most cited authors were Ridoutt, Hoekstra and Zhang. The keywords most frequently used include: water-use, irrigation, water-management, water-supply, and sustainability. A network map shows three clusters that focus on the environmental, agronomic and management aspects. The findings of this study can assist researchers in this field by providing an overview of research on the sustainability of hydric resources.
1. Introduction
Water forms the basis of wetland and marine ecosystems. Water is essential for other ecosystems, particularly agricultural ecosystems. Agricultural ecosystems are the main consumer of hydric resources worldwide [1,2] as they use approximately 80% of hydric resources, with regional variation derived from economic development and climatology [3,4]. In developed countries, water consumption for irrigation uses approximately 60% of available hydric resources, while this can reach 90% in developing countries [5]. The estimated 275 million hectares worldwide that is devoted to irrigated crops increases by 1.3% per annum [4]. This accounts for only 23% of cultivated land, although 45% of total food production is obtained from this type of crop [6,7,8]. To meet food demand by 2050, worldwide production needs to increase by 70% [9]. This projected increase in world food production implies an extension of cultivated land, an intensification of supplies under current cultivated land or the search for integrated management systems [10]. In low production scenarios, an increase of 53% in the consumption of hydric resources and an increase of 38% in worldwide cultivated land would be necessary to satisfy the target for the food demand by 2050 [11]. Increases in irrigation water consumption to meet those food demands are estimated to be 50% in developing countries and 16% in developed countries [12]. Intensification in water consumption can cause biodiversity loss; soil salinization; soil flooding; loss of complementary services; inequality between users; increases in vulnerability; and the deterioration of water sources and ecosystems [13,14,15]. Global climate change threatens the availability of hydric resources and agricultural systems. Change is predicted in precipitation cycles; increased frequency and intensity of extreme phenomena; and variations in soil moisture, evapotranspiration flows and surface runoff [16,17].
To deal with these challenges, many studies apply “sustainability science” (defined as “a discipline that points the way towards a sustainable society” [18] and “aimed at understanding the fundamental character of interactions between natural, human, and social systems, covers a wide range of academic disciplines” ([19], p. 116)) to the development of agricultural systems and sustainable water use [20]. The concept of sustainable development was first applied to ecosystems at the end of the twentieth century and was defined as the ability of ecosystems to maintain continuous service flows despite environmental, economic and social alterations [21]. Since then, many institutions and initiatives have included sustainability proposals in their objectives, reports and declarations. For example, the 2030 Agenda for Sustainable Development of United Nations includes 17 sustainable development goals among which there is one specific goal for clean water and sanitation (SDG 6) as well as other goals focusing on water scarcity to water use efficiency [22]. Furthermore, in the Horizon 2020 research and innovation program, the European Parliament introduced the requirement of sustainable production [23].
Before the focus on sustainable water use in agriculture, the concept of sustainability was progressively applied to different environmental, biophysical and agronomic fields. With reference to hydric resources, sustainability was defined in 1999 as the set of systems designed and managed with the purpose of satisfying the current and future objectives of society, without prejudice of environmental, ecological and hydrologic integrity [24]. In terms of agriculture, sustainability is focused on the development of safe practices that do not damage the environment [25]. When applied to the management of hydric resources in agriculture, sustainability is viewed as the set of practices that increase crop production while minimizing water losses [26]. The objectives of sustainable management of hydric resources in agriculture consider the continuity of the agrarian system from a physical-biological perspective, economic efficiency in the use of resources and social participation in decision-making processes [27]. A global field of research has emerged using this conceptual framework, generating a volume of literature on sustainable water use in agriculture (SWUA) that is relevant to scientists and stakeholders. However, there has been no analysis on the dynamics of world research on SWUA until now.
The research objective in this paper is a quantitative analysis on the dynamics of global SWUA research in the last 25 years. Bibliometric methods were employed to achieve this objective. Bibliometric analysis is used for identifying, organizing and analyzing the main elements of a research topic [28]. This analysis used mapping techniques to represent the bibliographic information available in the different database and determine the trends of a research field derived from statistical and mathematical methods [29,30]. The obtained results are useful for experts when introducing and evaluating scientific activity within a field of study as well as for analysts and managers in the decision-making process [31,32]. The methodology highlights the most productive agents in a research field, such as authors, institutions or countries [33], which identifies the driving forces in a field of study. Furthermore, through the use of different tools, the collaborative relationships between different productive agents can be established [19]. The bibliometric method is employed in Engineering, Medicine, Energy, Management and Biology. In the specific case of sustainability research, different bibliometric studies have been used for analysis, such as sustainable development at national and institutional levels [34]; sustainability and innovation in the car industry [28]; energy efficiency and sustainability in public buildings [35]; and interdisciplinarity of research on sustainability [36].
2. Methodology
The Scopus database was used to develop the bibliometric analysis. Scopus is the world’s largest abstract and citation database of peer-reviewed research literature, which includes the most cited journals in each field of study. It is comprised of approximately 15,000 publications, 265 million webpages and 18 million patents [28]. Therefore, Scopus guarantees the representation of the final sample of documents within a field of study and the quality and originality of the data [37]. Scopus provides a wide variety of data on each of the publications, allowing the comparison of different analysis and the downloading of useful information for the analysis process in different formats [38]. Recent bibliometric studies have used the Scopus database [35,39,40,41].
To select the sample of articles analyzed in this study, a search was performed in January 2018 using the following terms: (TITLE-ABS-KEY (“water use” OR “water-use” OR “use of water”); AND TITLE-ABS-KEY (sustainability OR sustainable); AND TITLE-ABS-KEY (irrigation OR agricultur* OR farm* OR crop* OR agroecosystem)). Searches were limited to the period of 1993–2017. In the final sample, documents without a rigorous review process were rejected, such as working documents, books and conference papers [42]. Review articles were excluded to avoid duplication in the sample [43]. The final sample contained 2084 articles. The variables analyzed were: publication year of articles; categories; journals; countries; institutions; authors; and keywords.
Bibliometric studies distinguish three types of indicators [32]: quantity indicators that refer to productivity; quality indicators that refer to impact of publications; and structural indicators that measure the connections established between the different agents (authors, institutions and countries). In this study, these three types of indicators were analyzed. In addition to the different counts to measure the productivity of authors, institutions and countries, different indicators used to measure research impact were the number of citations; the H index; and the SCImago Journal Rank (SJR) impact factor.
The analysis was completed with networking maps to provide values for international collaboration and the hotspots trends for this field of study. The networking map tools reveal the collaboration links established between different agents involved in a field of study. In this work, we used VOSviewer (version 1.6.5., Leiden University, Leiden, The Netherlands) to show the international collaboration between the different countries and the research trends through keywords. VOSviewer is a software tool for the processing of keywords and the grouping analysis used for the visualization of topographic network maps through a coincidence matrix, which allows grouping by co-authorship and by co-occurrence [44]. VOSviewer is widely used for showing maps of global scientific collaboration [28,45,46,47,48].
3. Results and Discussion
3.1. Evolution of Main Variables
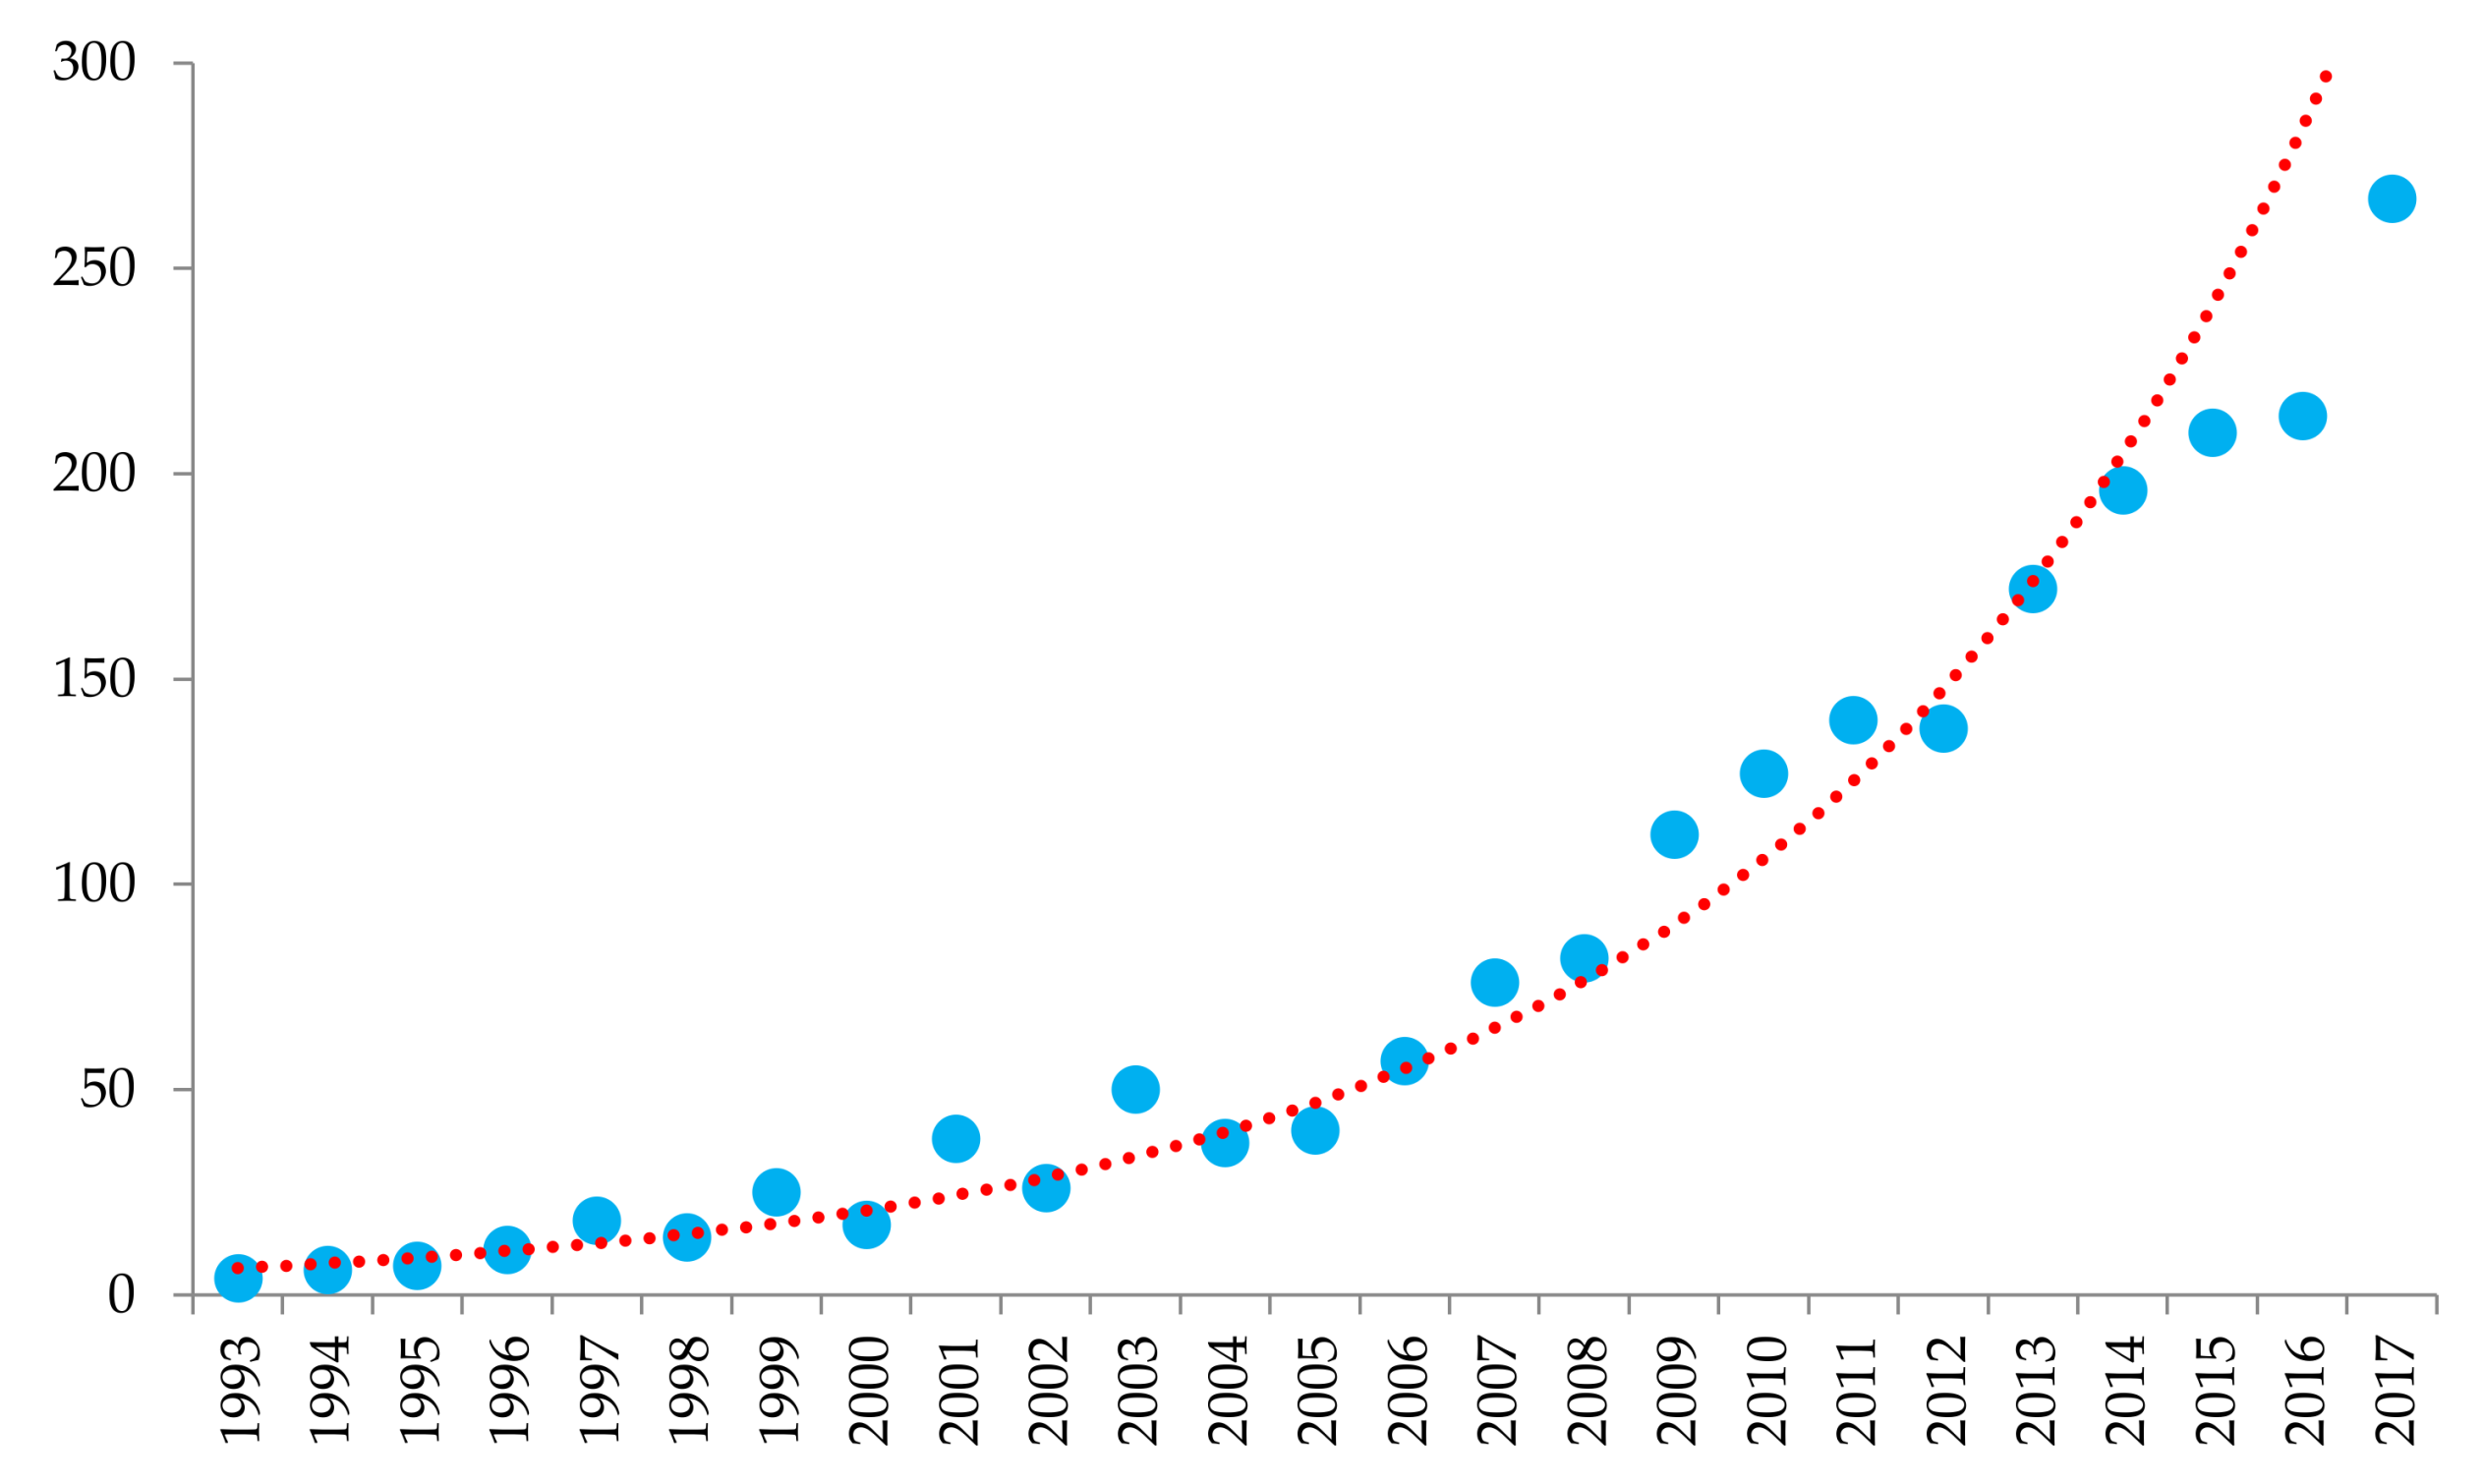
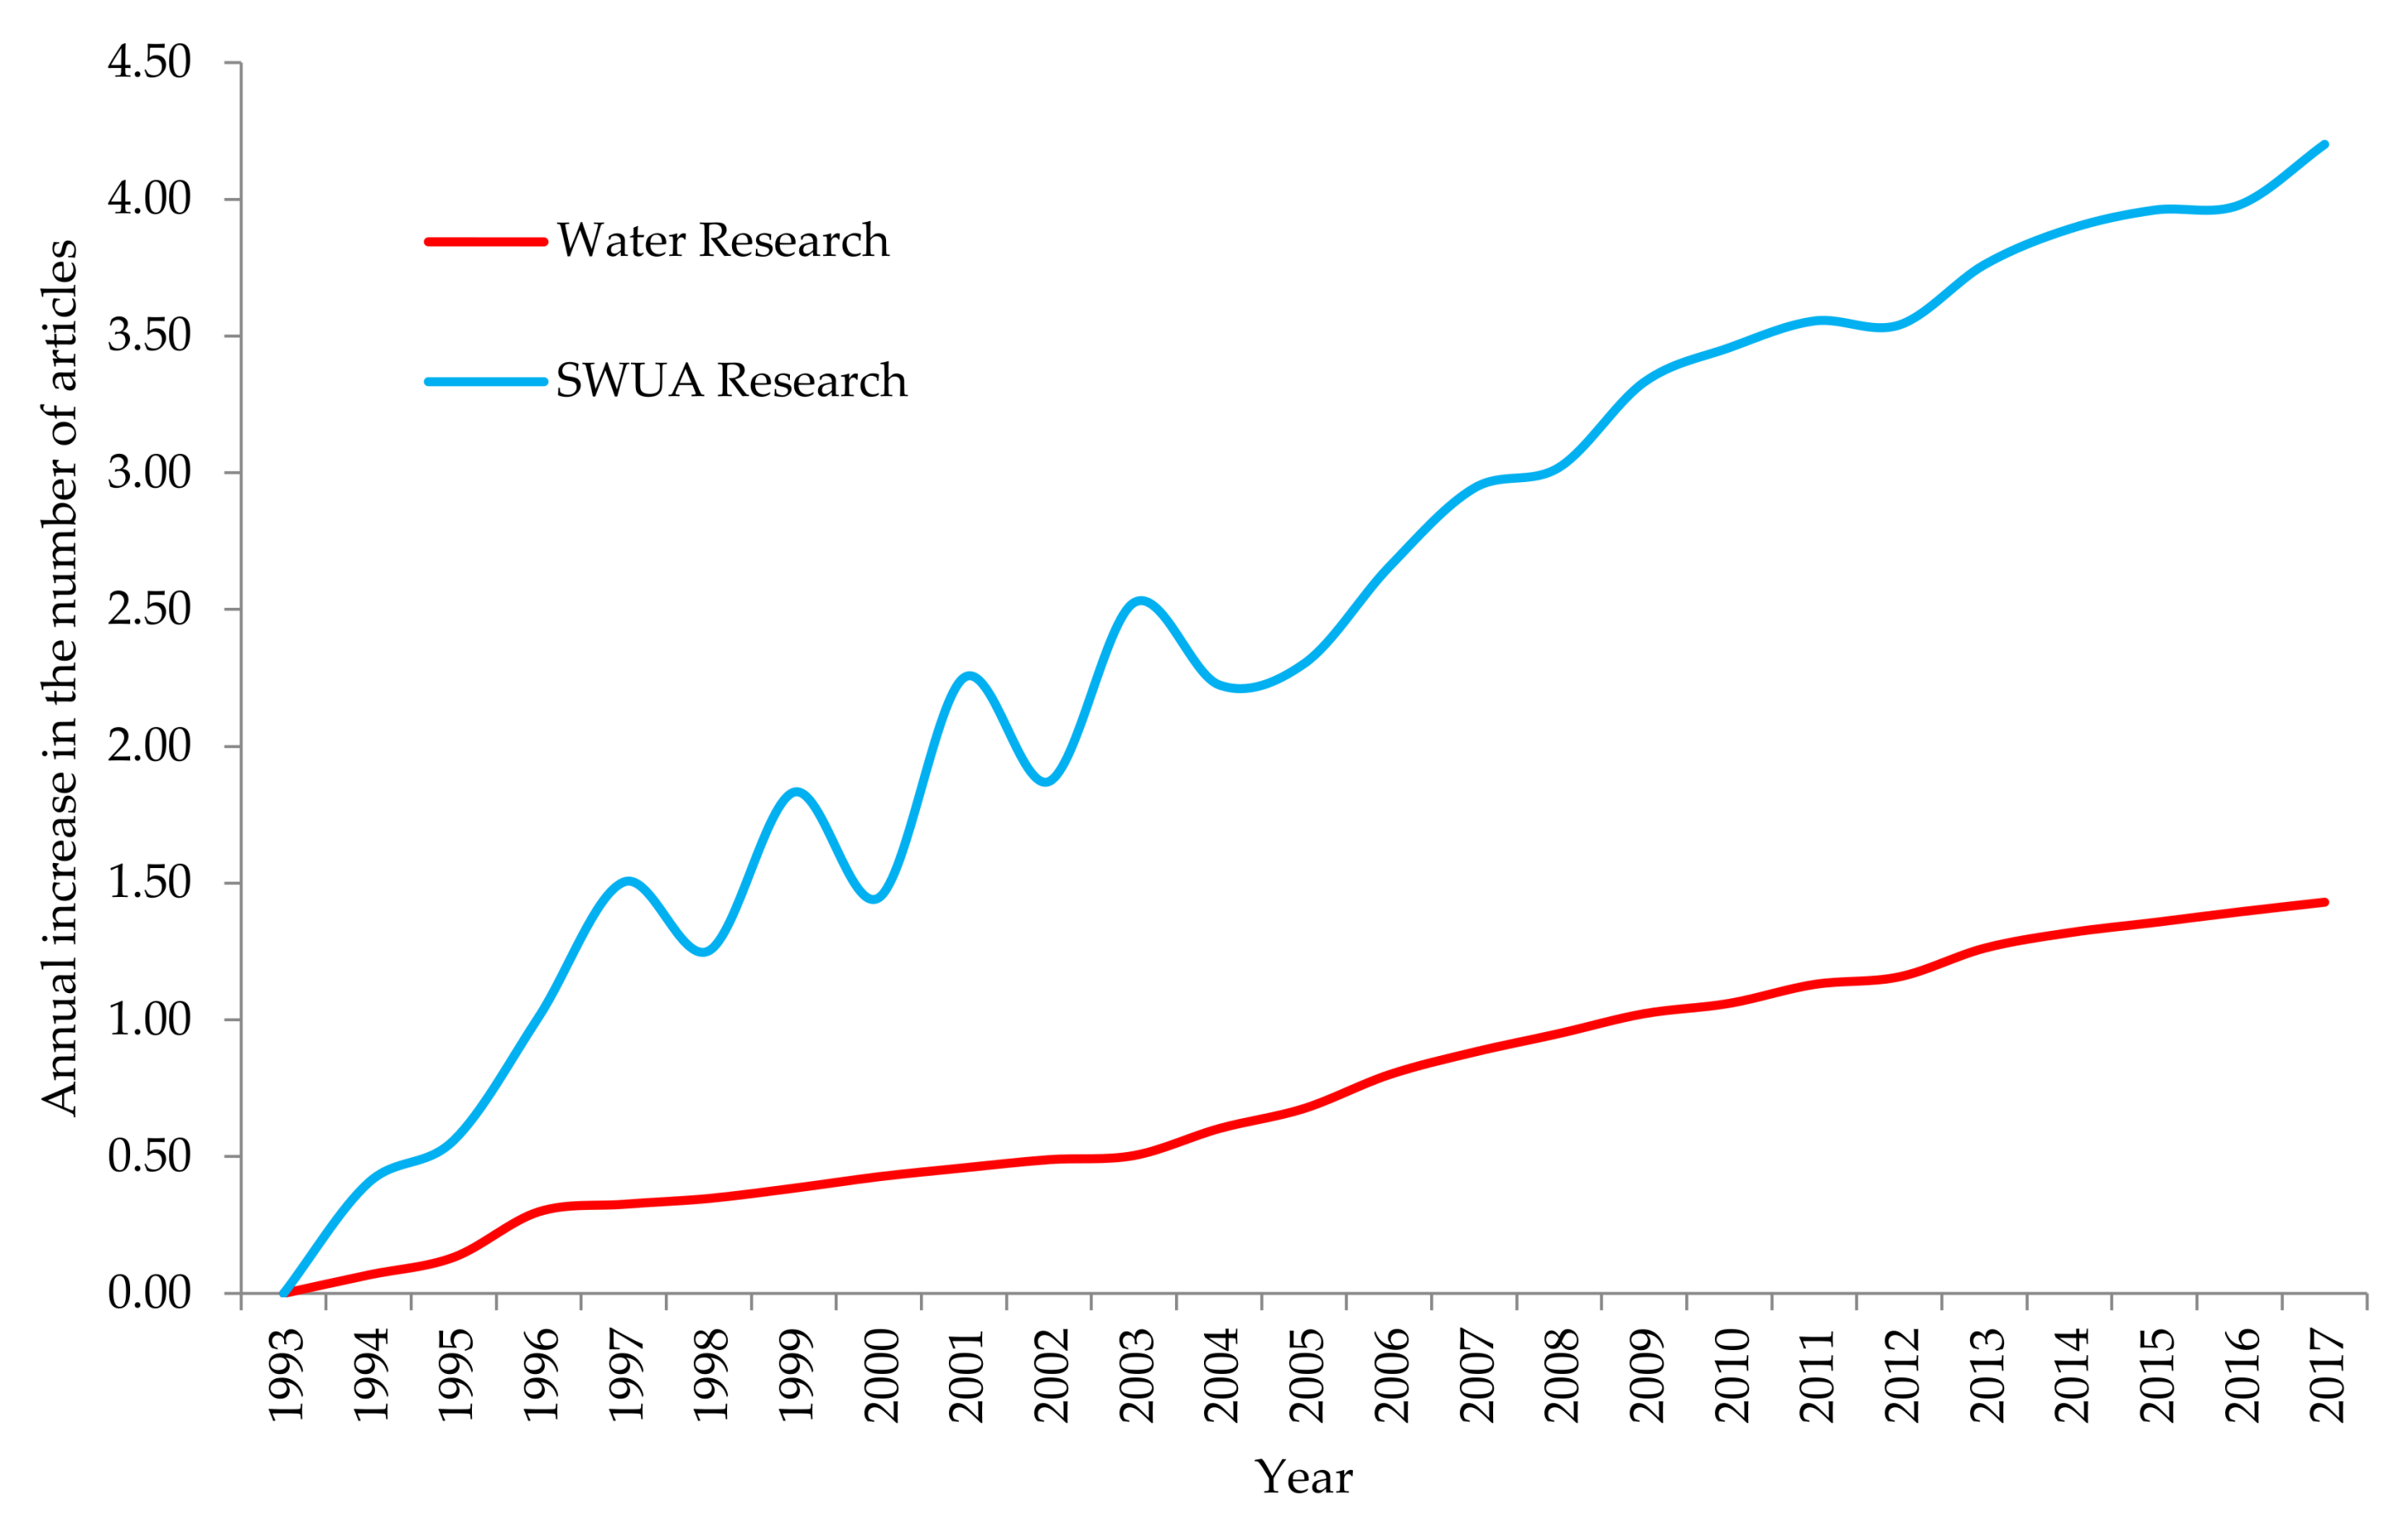
The analysis of the number of articles published during 1993–2017 proves that research on SWUA has attracted increased attention throughout the years (Table 1). In particular, the number of articles published (A) grew from 4 in 1993 to 267 in 2017. Figure 1 shows how the number of articles published has grown exponentially within this thematic field. Figure 2 has been created in order to compare the publication trends of articles versing on water as a general topic and articles specifically studying SWUA. Logarithms have been applied to both series for homogenization purposes. The average rate of cumulative growth has been calculated. Results show that published articles on water have increased at an annual average rate of 6.14%, whereas the SWUA studies achieve a rate of 19.13%. These data highlight the fact that the publication increase on SWUA is superior to the one of water as a general theme. The growing interest in this field is also shown by the increase in the number of authors, journals and countries. The number of authors (AU) increased from 4 in 1993 to 1110 in 2017. The number of journals (J) increased from 3 to 147. The number of countries (C) increased from 3 to 69. The participation of 6170 authors, 597 journals and 115 countries in the publication of the 2084 articles included in the sample shows the growth of this field of study, demonstrating that it has become an important global issue. The number of references (NR) included in the articles expanded. In 1994, the number of references was 120, while this was 11,773 in 2017, which resulted in the average number of references per article increasing from 20.1 to 44.1. The total number of citations accumulated (TC) grew from 1 in 1994 to 5638 in 2017, which resulted in an increase in the average number of citations per article (CTC/CA) from 0.1 to 15.4.
3.2. Thematic Areas and Journals
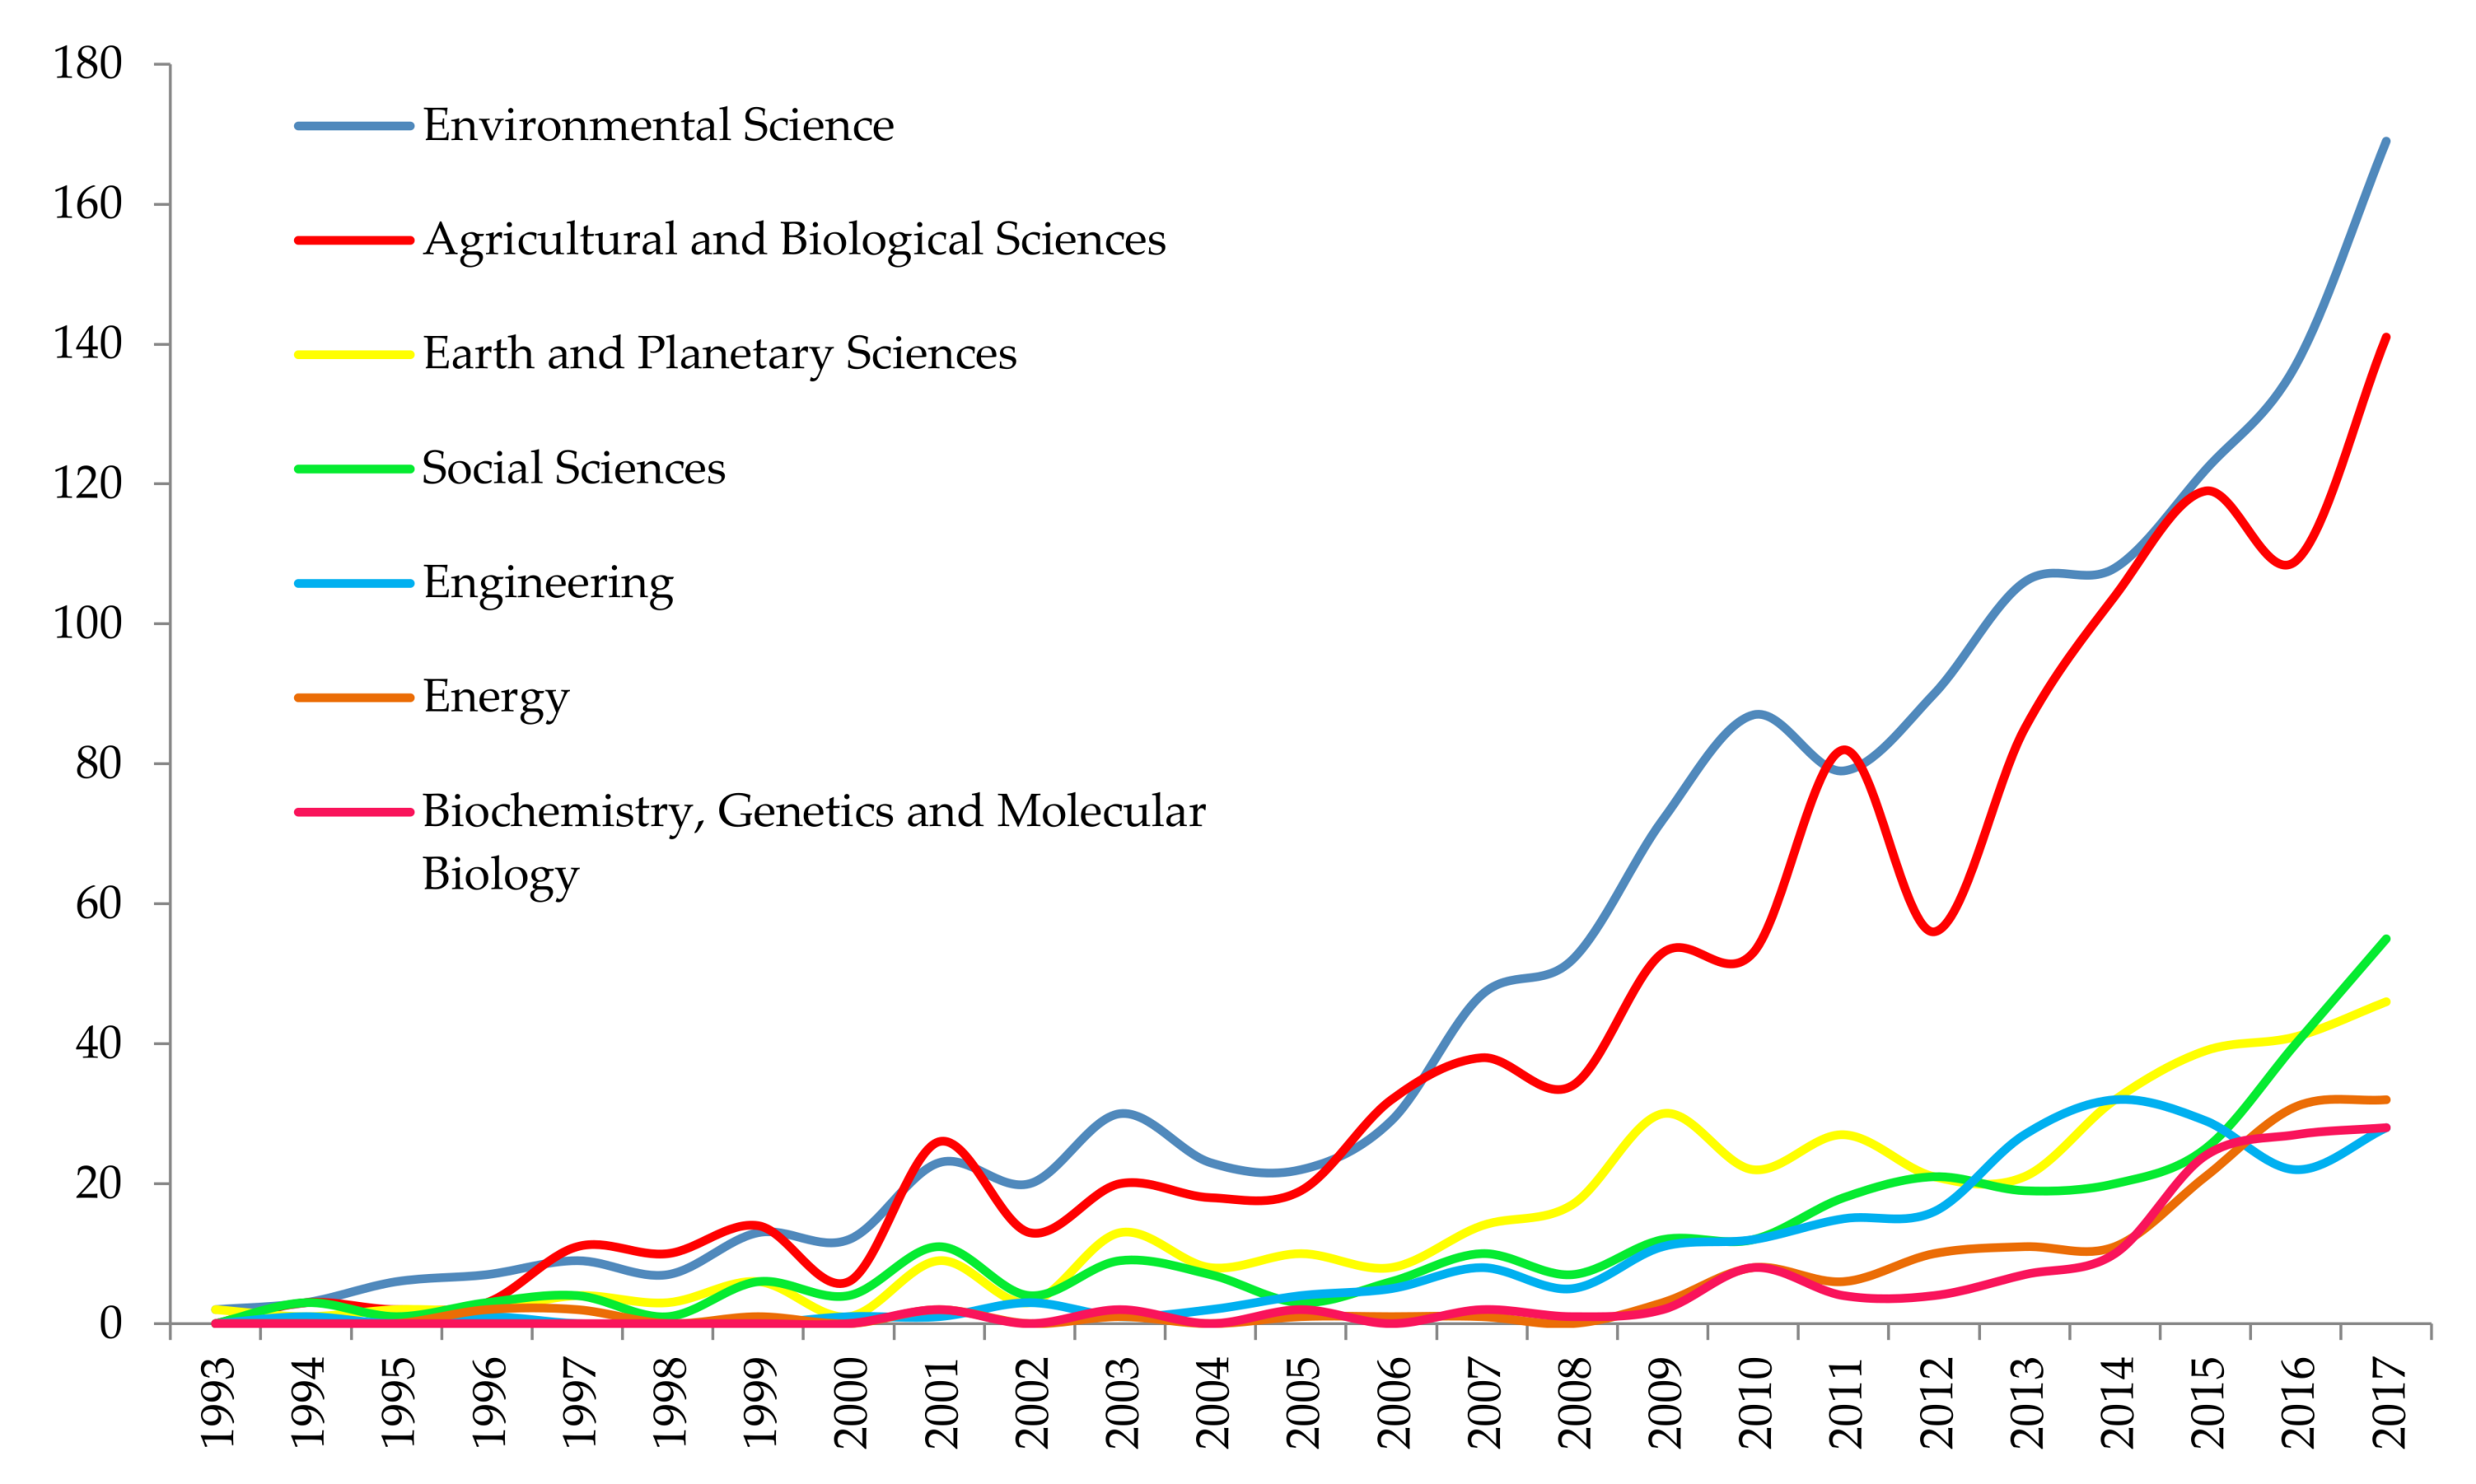
The articles published on SWUA were classified in 25 different categories, although an article can be simultaneously classified into different thematic areas. During the entire study period, the main categories were Environmental Sciences as well as Agricultural and Biological Sciences, which published 61.2% and 50.5% of the total number of published articles, respectively. This was followed by Earth and Planetary Sciences with 18.3%, Social Sciences with 14.5%, Engineering with 10.8% and Energy with 7%. Sustainability is an inherently multidisciplinary concept, which needs the intervention of Natural and Social Sciences for its analysis [1,49]. The Social Sciences category only included 14.5% of the total number of articles of the sample, while Economics, Econometrics and Finance represented 2.7%. Business, Management and Accounting represented 2.6%, Multidisciplinary 1.2% and Decision Sciences 0.6%. Figure 3 shows the evolution of the main subject areas according to the Scopus classification for the period of 1993–2017.
Table 2 shows the most productive journals for SWUA research. In these journals, the different indicators related with production and impact are displayed. This group of journals accumulated 27.1% of the total of articles published, indicating that a wide variety of journals publish articles on SWUA. The journal with the highest number of articles published in this research field was Agricultural Water Management, with a total of 159 articles. Since the beginning of the period chosen, this journal led the ranking. There is a group of journals that was published on this field recently (they published their first article on SWUA in 2011–2013). Nevertheless, they were first in terms of the most productive journals. For example, the journal Sustainability joined the SWUA publications most recently, but achieved the seventh position in the entire period and the third position in the last five-year period (2013–2017), thus surpassing journals with a longer history of SWUA research.
With respect to impact indicators, Agricultural Water Management is the journal that accumulated the highest total number of citations of 4367, followed by Agriculture Ecosystems and Environment with 1101, Water Resources Management with 1020 and Field Crops Research with 942. The journals with the highest number of citations per article are Agriculture Ecosystems and Environment with 45.9, Agricultural Water Management with 27.5, Field Crops Research with 26.2 and Journal of Environmental Management with 25.8. As the H index is conditioned by the number of articles, the comparison between some of these journals according to this index does highlight interesting cases, although there is no clarification. Despite publishing a relatively high volume of articles, journals that joined this thematic area more recently have not accumulated enough citations to increase their H index yet, as an article will not generate a high number of citations until some years after publication. This is the case for journals such as Sustainability, Water or Science of the Total Environment. However, there are journals with a high number of articles and higher tradition in this topic that also showed relatively reduced indexes. This is the case for journals, such as Wit Transactions on Ecology and the Environment, Shengtai Xuebao and Irrigation and Drainage. With respect to the SJR index, the most important publication is the Journal of Hydrology, followed by Science of the Total Environment, Journal of Cleaner Production as well as Agriculture, Ecosystem and Environment. The journals in which more articles on SWUA were published were high quality, as all of them occupied the first and second quartile of their categories within the SJR, with the exception of one journal.
Regarding the group composition of journals that publish most on SWUA, it is interesting to point out that they come from very different theme categories. We can find journals devoted to agriculture, water, management and ecology. This diversity lies in the multidisciplinary character of the water sustainability study in agriculture. The concepts of efficiency and ecosystemic services are tightly linked to the sustainable management of water for irrigation. In fact, it is necessary to improve efficiency in order to reach sustainability. Moreover, efficiency should guarantee services beyond food supply and assure erosion prevention, CO2 capture and improvement of water quality. The study of these current questions requires the use of new methodologies and the establishment of collaborations among disciplines like Agronomy, Biology, Ecology, Economics and Social Sciences [50].
3.3. Countries, Institutions and Authors
Table 3 shows the main productivity and impact indicators in the 10 countries with the highest number of articles published on SWUA. China ranked first with 432 articles, followed by the U.S. with 423, Australia with 221, India with 181 and Germany with 120. The U.S. was the country with the highest total number of articles published on SWUA during the study period until 2013 when China became the leading country for this ranking. The rest of the countries alternated in other positions within the leading group, except for France, which occupied the eleventh position in the last five-year period and Canada, which occupied the tenth position before joining the top ten group. The table also shows the number of published articles on SWUA per million inhabitants in each country (APC: number of articles per 1 mill. inhabitants). If we weight the number of published articles regarding the country population, in the first position, we can find Australia, followed by The Netherlands and Spain, whereas the last positions are occupied by China and India.
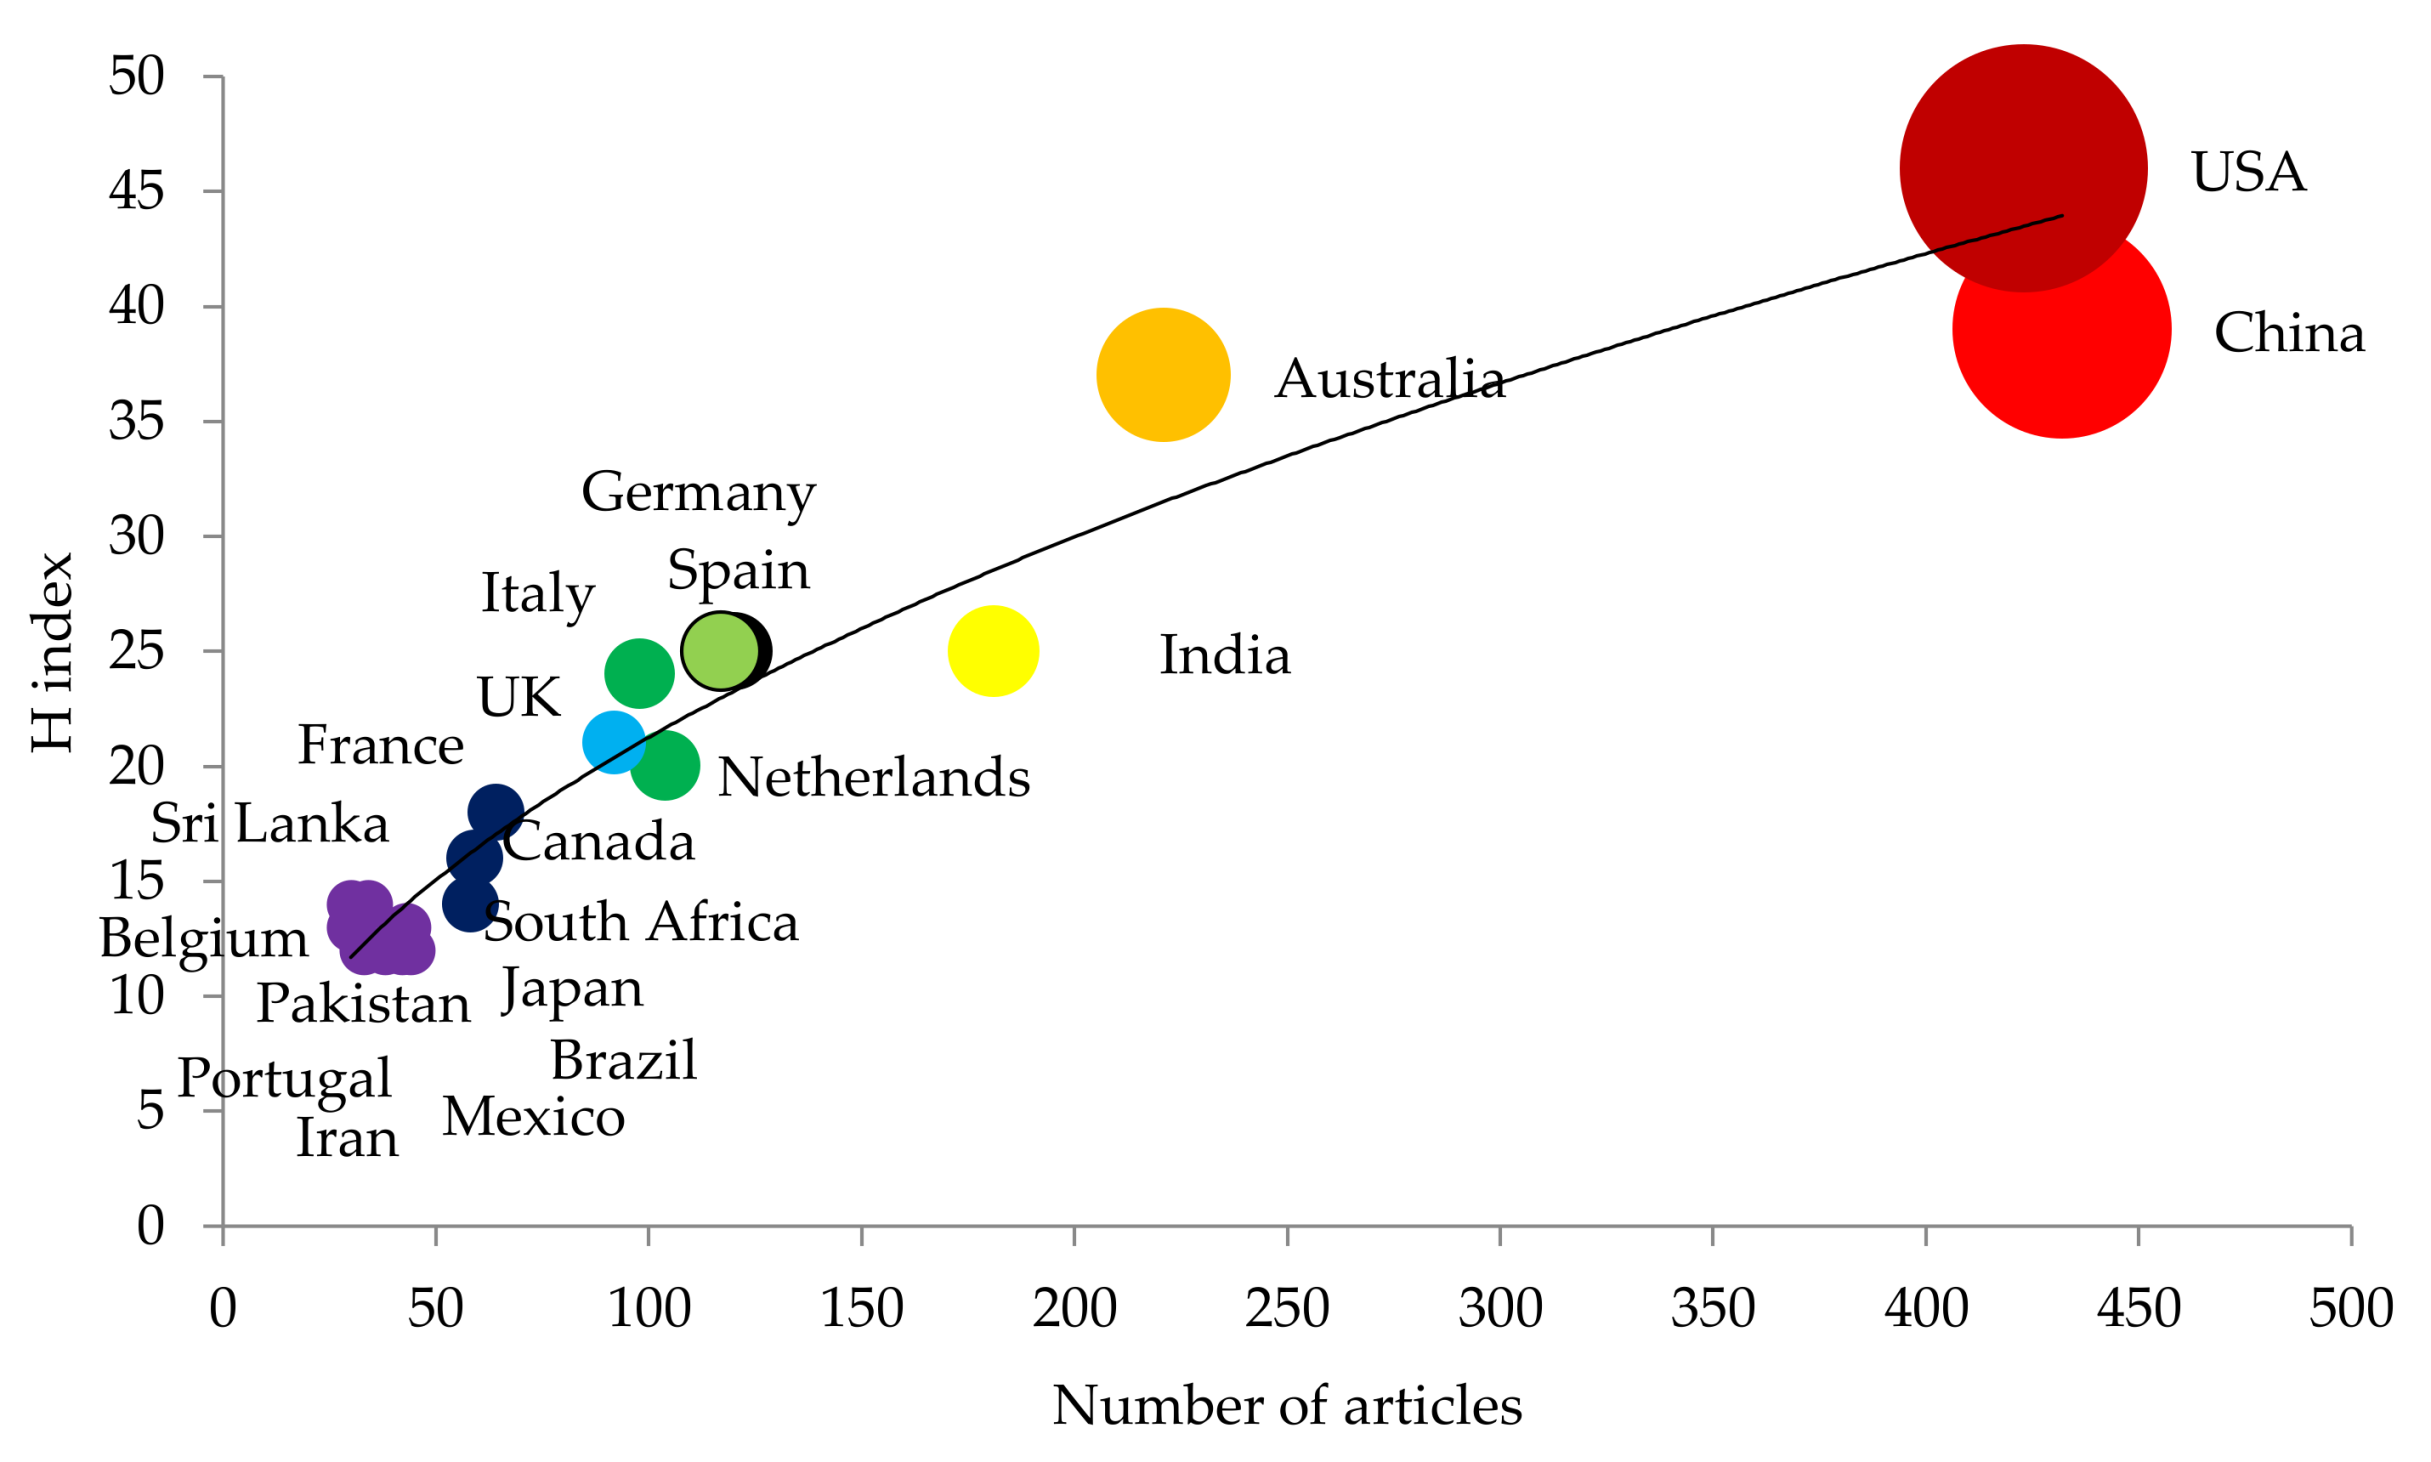
With respect to impact indicator, the U.S. is the country with the highest number of accumulated citations in its articles on SWUA with a total of 9315 citations. It is followed by China with 5382, Australia with 4583, India with 2813 and The Netherlands with 2617. However, if the average number of citations per article is considered, The Netherlands ranked first with a total of 26.7 citations. It is followed by France with 23.2, the U.S. with 22, Italy with 20.8 and Australia with 20.7 citations per article. To visualize the correlation between H index and the number of articles published by each country, Figure 4 shows the regression model that links these two variables.
Table 4 shows the percentage of international collaboration (IC), the number of countries forming a collaboration network (NC) and the five main collaborators from each of the most productive countries (classified in descending order with respect to the number of collaborations). France had the highest percentage of works with international collaboration at 68.75% of the total, followed by Germany at 68.33%, The Netherlands at 65.31% and the United Kingdom at 63.04%. The U.S. had the largest network of collaborations, with a total of 55 different collaborating countries, followed by Germany with 50 and China with 43. The table also includes the average number of citations of each country (TC/A) for articles completed with international collaboration (IC) and without international collaboration (NIC). International collaboration created higher impact for the articles published (measured through the number of citations) in all of the cases except for The Netherlands, the United Kingdom and France.
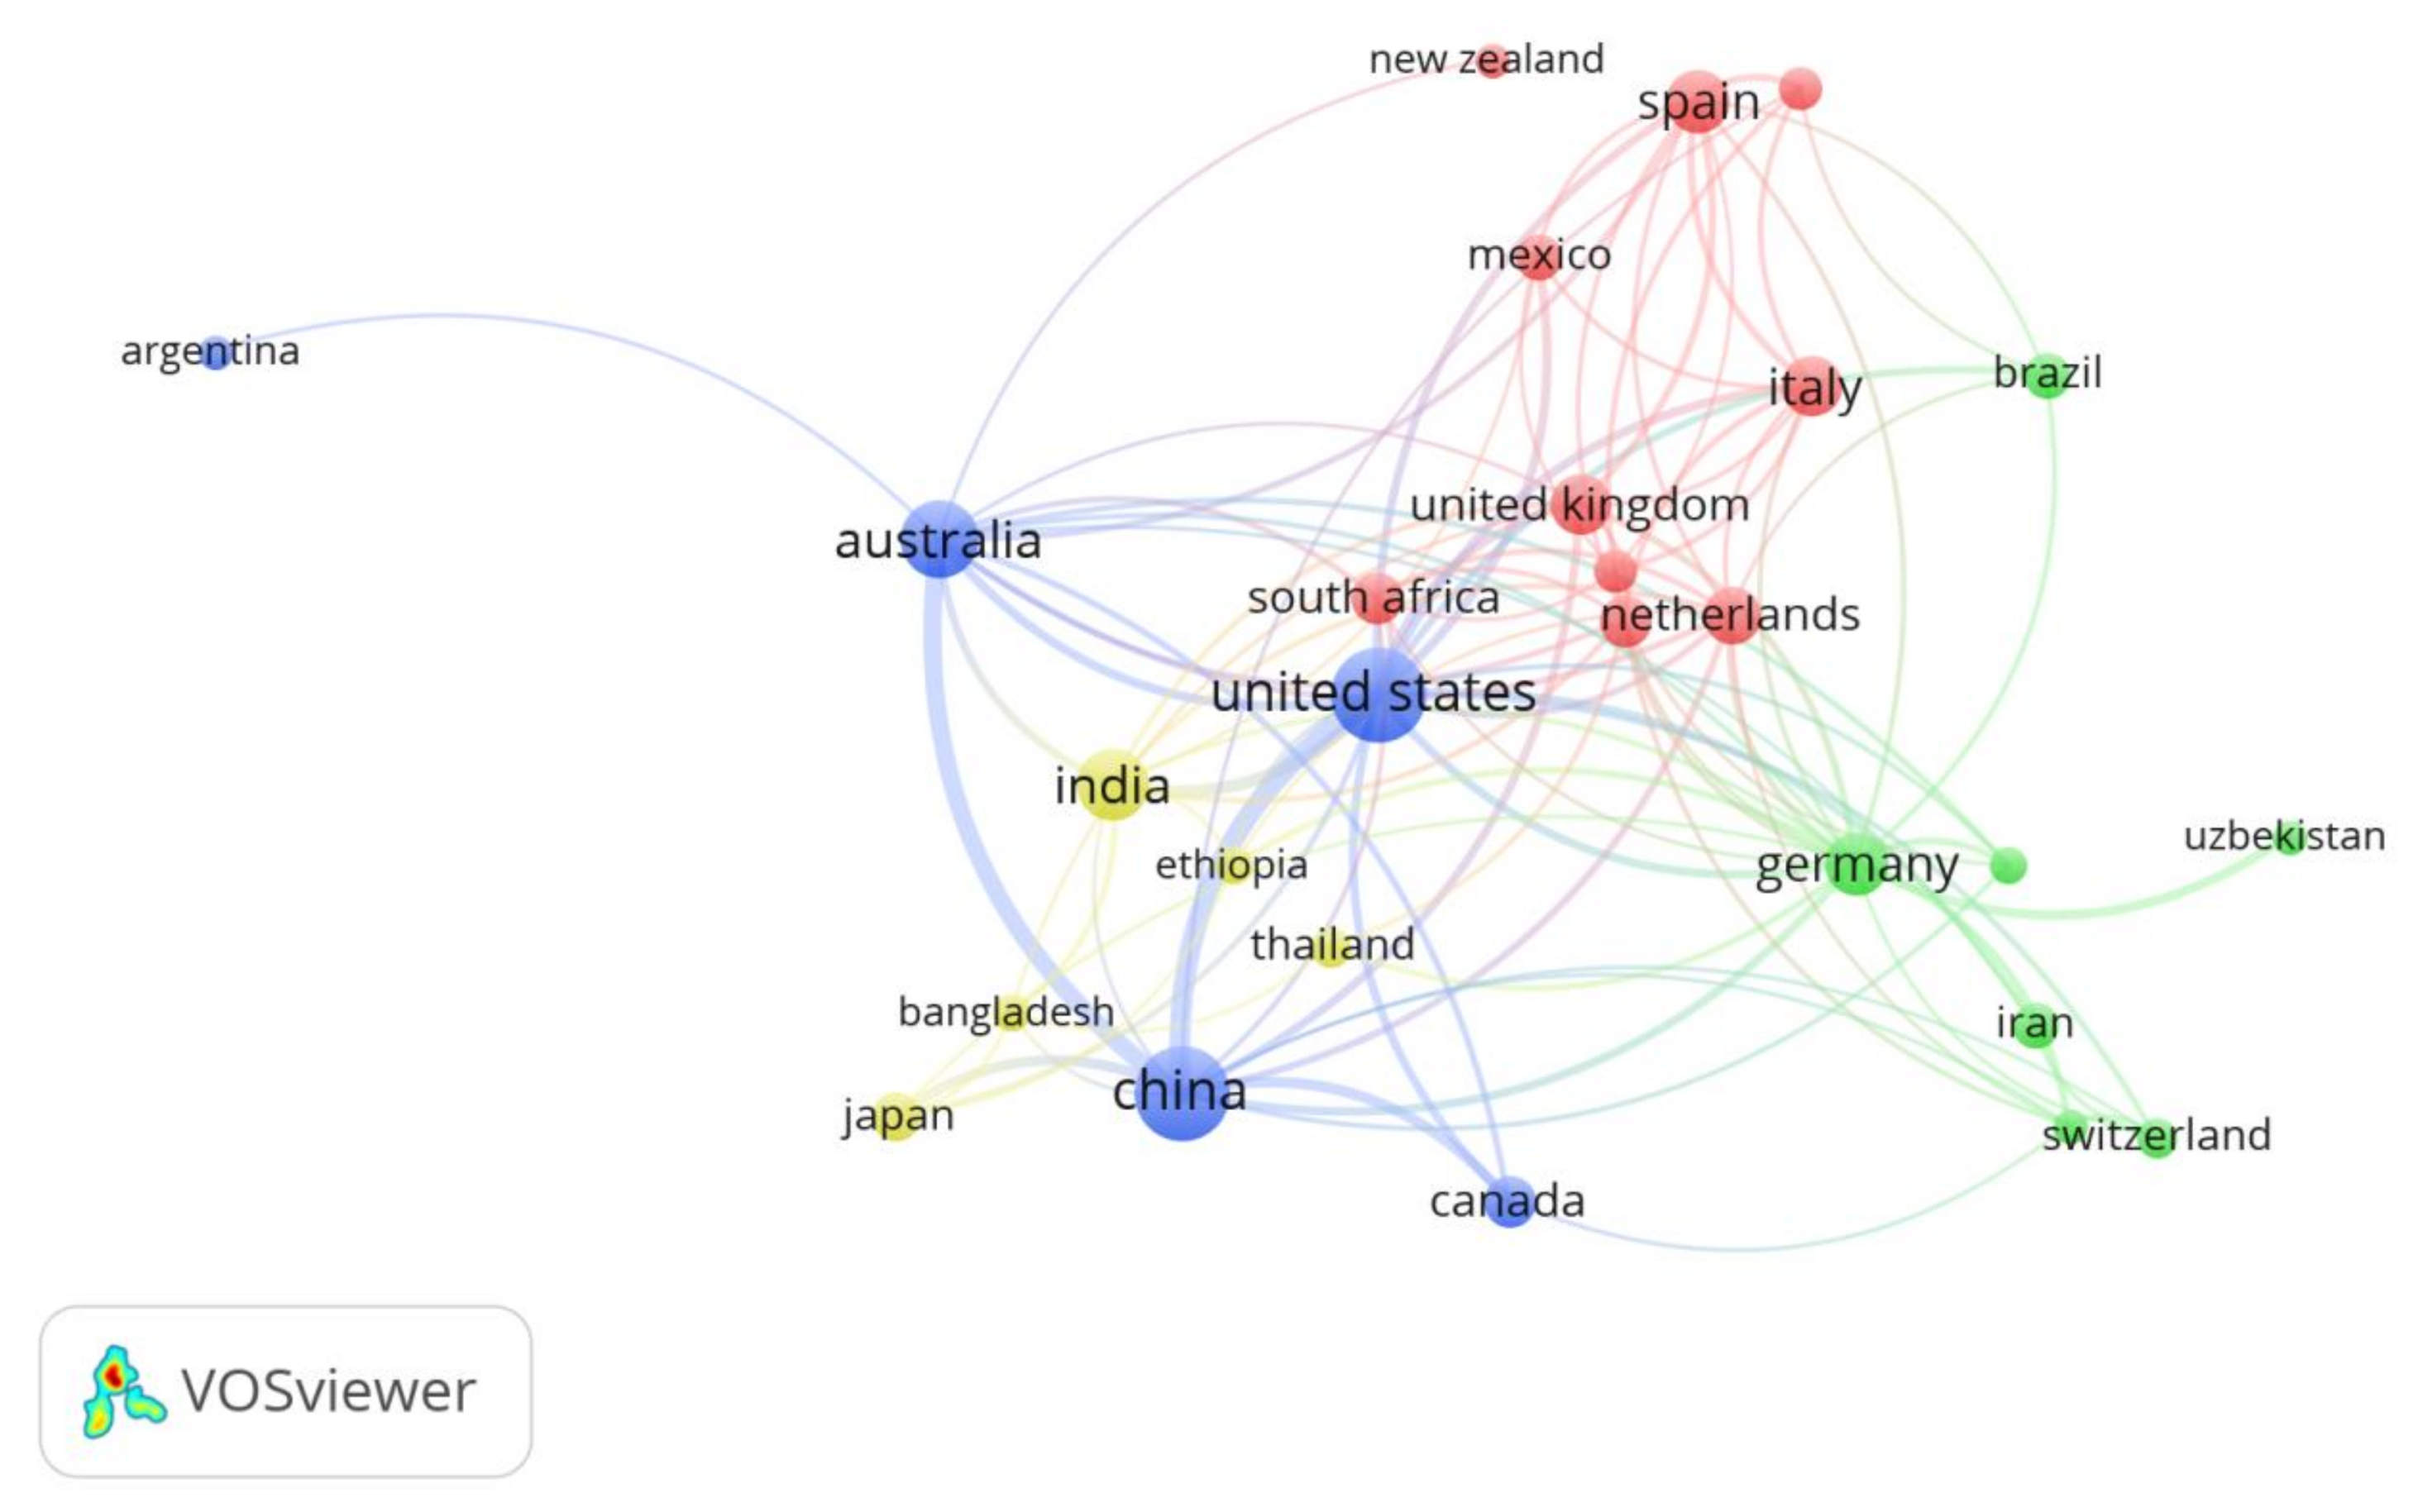
Figure 5 shows a network map of the different collaborations between countries. The set of countries with the highest number of connections was chosen to make the map. The size of each circle represents the number of articles of each country. The thickness of each line represents the number of collaborations between countries. The different colors group the different clusters formed by sets of countries. Four clusters can be differentiated. The first cluster (Blue) is formed by the main productive countries, which are China, the U.S. and Australia, together with Argentina and Canada. The second cluster (Yellow) is formed by India, Ethiopia, Thailand, Bangladesh and Japan. The third cluster (Green) represents Germany with Brazil, Iran, Uzbekistan, Sweden and Switzerland. The fourth cluster (Red) includes the set of Western Europe countries (The Netherlands, Belgium, Portugal, Spain, the UK, France and Italy) together with South Africa, Mexico and New Zealand.
In order to detect the main differences between research trends, articles in collaboration with the leading researching countries—China and the United States—have been reviewed. Regarding China, articles in collaboration with the group built by Australia and the United States have been firstly analysed; and, secondly, those written together with its main European partners—Germany, The Netherlands and the United Kingdom. In both cases, most articles are devoted to domestic Chinese issues, 83% and 95%, respectively. Within the first group (China with Australia and the United States), researchers focus on the efficient use of water, whereas in the second group (China and European countries), the main topic is groundwater. Regarding the collaboration between the United States and its main European partners—Germany, Italy, Spain and the United Kingdom—a balance of the study territory has been found. They are equally devoted to American and European areas, as well as to third countries. The research focus varies from water use and supply to water management for irrigation and sustainability.
Table 5 shows the main production and impact indicators of the institutions with the highest number of publications on SWUA. The Chinese Academy of Sciences ranked first with a total of 134 articles published between 1993–2017. It is followed by the China Agricultural University with 63, the Northwest A&F University (from China) with 59 and the Wageningen University and Research Centre of The Netherlands with 46. With respect to the number of citations, the Chinese Academy of Science had 2195 citations, followed by the Wageningen University and Research Centre of The Netherlands with 1243, the United States Department of Agriculture (USDA) Agricultural Research Service with 1058 and China Agricultural University with 1032. If we consider the average number of citations per article, the USDA Agricultural Research Service ranked first with 27.8 citations. The Wageningen University and Research Centre occupied the second position with 27 citations per article and the CSIRO Land and Water of Australia had the third position with 26.6 citations. Similar to the case found with countries, the H index was not a determining indicator due to the difference in the number of articles published by the different institutions. However, the Chinese Academy of Sciences also showed the highest H index (27). The Wageningen University and Research Centre is the institution that had articles with the most international collaboration (73.91%), followed by the University of Western Australia (56%) and the China Agricultural University (52.38%). In all of the cases, except the University of Western Australia, the articles published by these institutions with international collaboration had a higher impact when measured through the number of citations received.
Table 6 includes the most productive authors on SWUA and shows the main variables related to production (A) and the impact of their articles (TC) in addition to the affiliation, the country (C), the year of publication of their first (1st A) and last article on this topic (Last A). Half of these authors belong to Chinese research centers and, generally, are frequently the recent members of the SWUA research cohort. The author with the oldest publication is Luis S. Pereira from Portugal, who published his first article on SWUA in 1996. All authors published their last article in SWUA between 2015 and 2017, indicating that they continue to work on this topic. The only exception is the case of Frank A. Ward, whose last article is dated from 2012.
Bradley G. Ridoutt is the author with the highest number of articles published on SWUA. His work on the water footprint is the most relevant with respect to the number of citations [51,52,53]. The author with the second highest number of articles is Arjen Y. Hoekstra, who stands out for his works on water footprint and for the large number of countries he has studied, such as China, Kenya, France, the UK, Malawi and Latin America. His more relevant articles are available in references [54,55,56]. Xiying Zhang has the same number of articles published, but his work in the North China Plain is more agronomic. His most cited articles are references [57,58,59]. These three authors have the highest number of citations, have accumulated the highest average number of citations per article and have the highest H index. Based on these data, these three authors are considered as models in this line of research.
3.4. Keyword Analysis
An analysis of the keywords was used to identify hotspots within a research field. The 20 most frequently used keywords in articles on SWUA are displayed in Table 7 for the period of 1993–2017. The period was divided into five-year sub-periods, which show the evolution of keywords. The values that appear in the table refer to the position that keywords occupied in each sub-period compared with the total number of keywords of the sample, the number of articles in which it appeared [R (A)] and the repetition percentage (%). The 20 most frequently used keywords included terms related to water (Water-Use, Water-Management, Water-Supply, Water-Resources, Water-Use-Efficiency, Water-Conservation, Groundwater and Groundwater-Resources); sustainability (Sustainability, Sustainable-Development and Climate Change); crops and agricultural practices (Irrigation, Agriculture, Crops, Irrigation-System, Crop-Yield, Crop-Production, Triticum-Aestivum, Evapotranspiration and Zea-Mays).
Irrigation ranked first for most of the period. The group formed by these 20 keywords was the set of most frequently used terms in articles on SWUA, although they changed their position according to the relevance given to each one by research in the different sub-periods. The most repeated keywords in the 1993–1997 sub-period were: Irrigation, Water-Supply, Water-Management, Environmental-Protection, Sustainable-Development and Developing-Country. The most used geographical terms were Asia and the Middle East. In this first period, research was directed towards the conservation and environmental protection as well as the agricultural development in developing countries, mainly in the Middle East and Asia. Outstanding methodological terms did not appear.
In the second five-year period (1998–2002), research preferences for keywords changed. In the 1993–1997 period, the focus was on developing regions, whereas, in the 1998–2002 period, specific countries appear among the first positions of the most used terms (India in the 10th position, Australia in the 11th position, China in the 12th position and the U.S. in the 13th position). Unlike the first period, terms referring to arid and semi-arid regions were highlighted in the second period. Terms related to sustainability continue to appear between the two periods. However, terms referring to crops, which were barely used previously, increased in importance during the second period, including Triticum-Aestivum, Crops, Crop-Yield and Crop-Production. Research focused on more agronomic aspects and the field of study was set at the watershed and exploitation level.
The period of 2003–2007 signified the current configuration of the framework with respect to keywords. In addition to the terms already mentioned and related with sustainability and agronomy, words related with hydric resources were diversified (Water, Groundwater, Groundwater-Resources, Catchments, Rain, Aquifers and Rivers). The main crops were Zea-Mays and Wheat. By region, Eurasia, Asia and Europe were respectively ranked in the fifth, ninth and sixteenth positions in the entire keywords sample. By country, China occupied the 16th position and Australia the 19th position. The term World appeared for the first time in the 17th position, which referred to the global scale of the topic analyzed. Mathematical-Models was the most repeated methodological term. The link between Economic and Social Sciences in this field of study was relevant in this period because the term Economic-And-Social-Effects was frequently used.
Trends from 2003–2007 continued through 2008–2012. The main difference was the appearance of terms, such as Drought, Water-Stress and Water-Scarcity. These appeared as a consequence of increasing concerns about the consequences of climate change. This situation was extended to the next period (2013–2017), in which Climate-Change was within the group of the twenty most used words for the first time. Food security was a priority in this field, represented by the terms Food-Security and Food-Supply. The studied crops were Zea-Mays, Wheat and Rice, while the field of study was focused on the watershed level. The most mentioned methodology among the keywords was Water-Footprint.
As far as the keyword evolution is concerned, the term Climate Change stands out. It has moved forward from the 81st to the 15th place. In order to picture the term trends, 192 articles with this keyword have been analysed. The main reason for the increase of its use lies in the growing social interest in the effects of climate change on various fields. One of the key milestones that fostered research on climate change was the creation of the Intergovernmental Panel on Climate Change in 1988. Since then, this platform has published reports about the state of climate change that serve as guidelines for the research needs. The coming into force of the Kyoto Protocol in 2005 meant another huge impulse for the research on climate change. The growing interest in climate change has brought about some research trends on SWUA, the most relevant ones being: sustainability of food and water supply for the growing world population; soil management sustainability based on hydrographic basins; climate change impacts on crops and their sustainability; and planning measures and decision-making processes related to the effects of climate change on the effective use of water for agriculture.
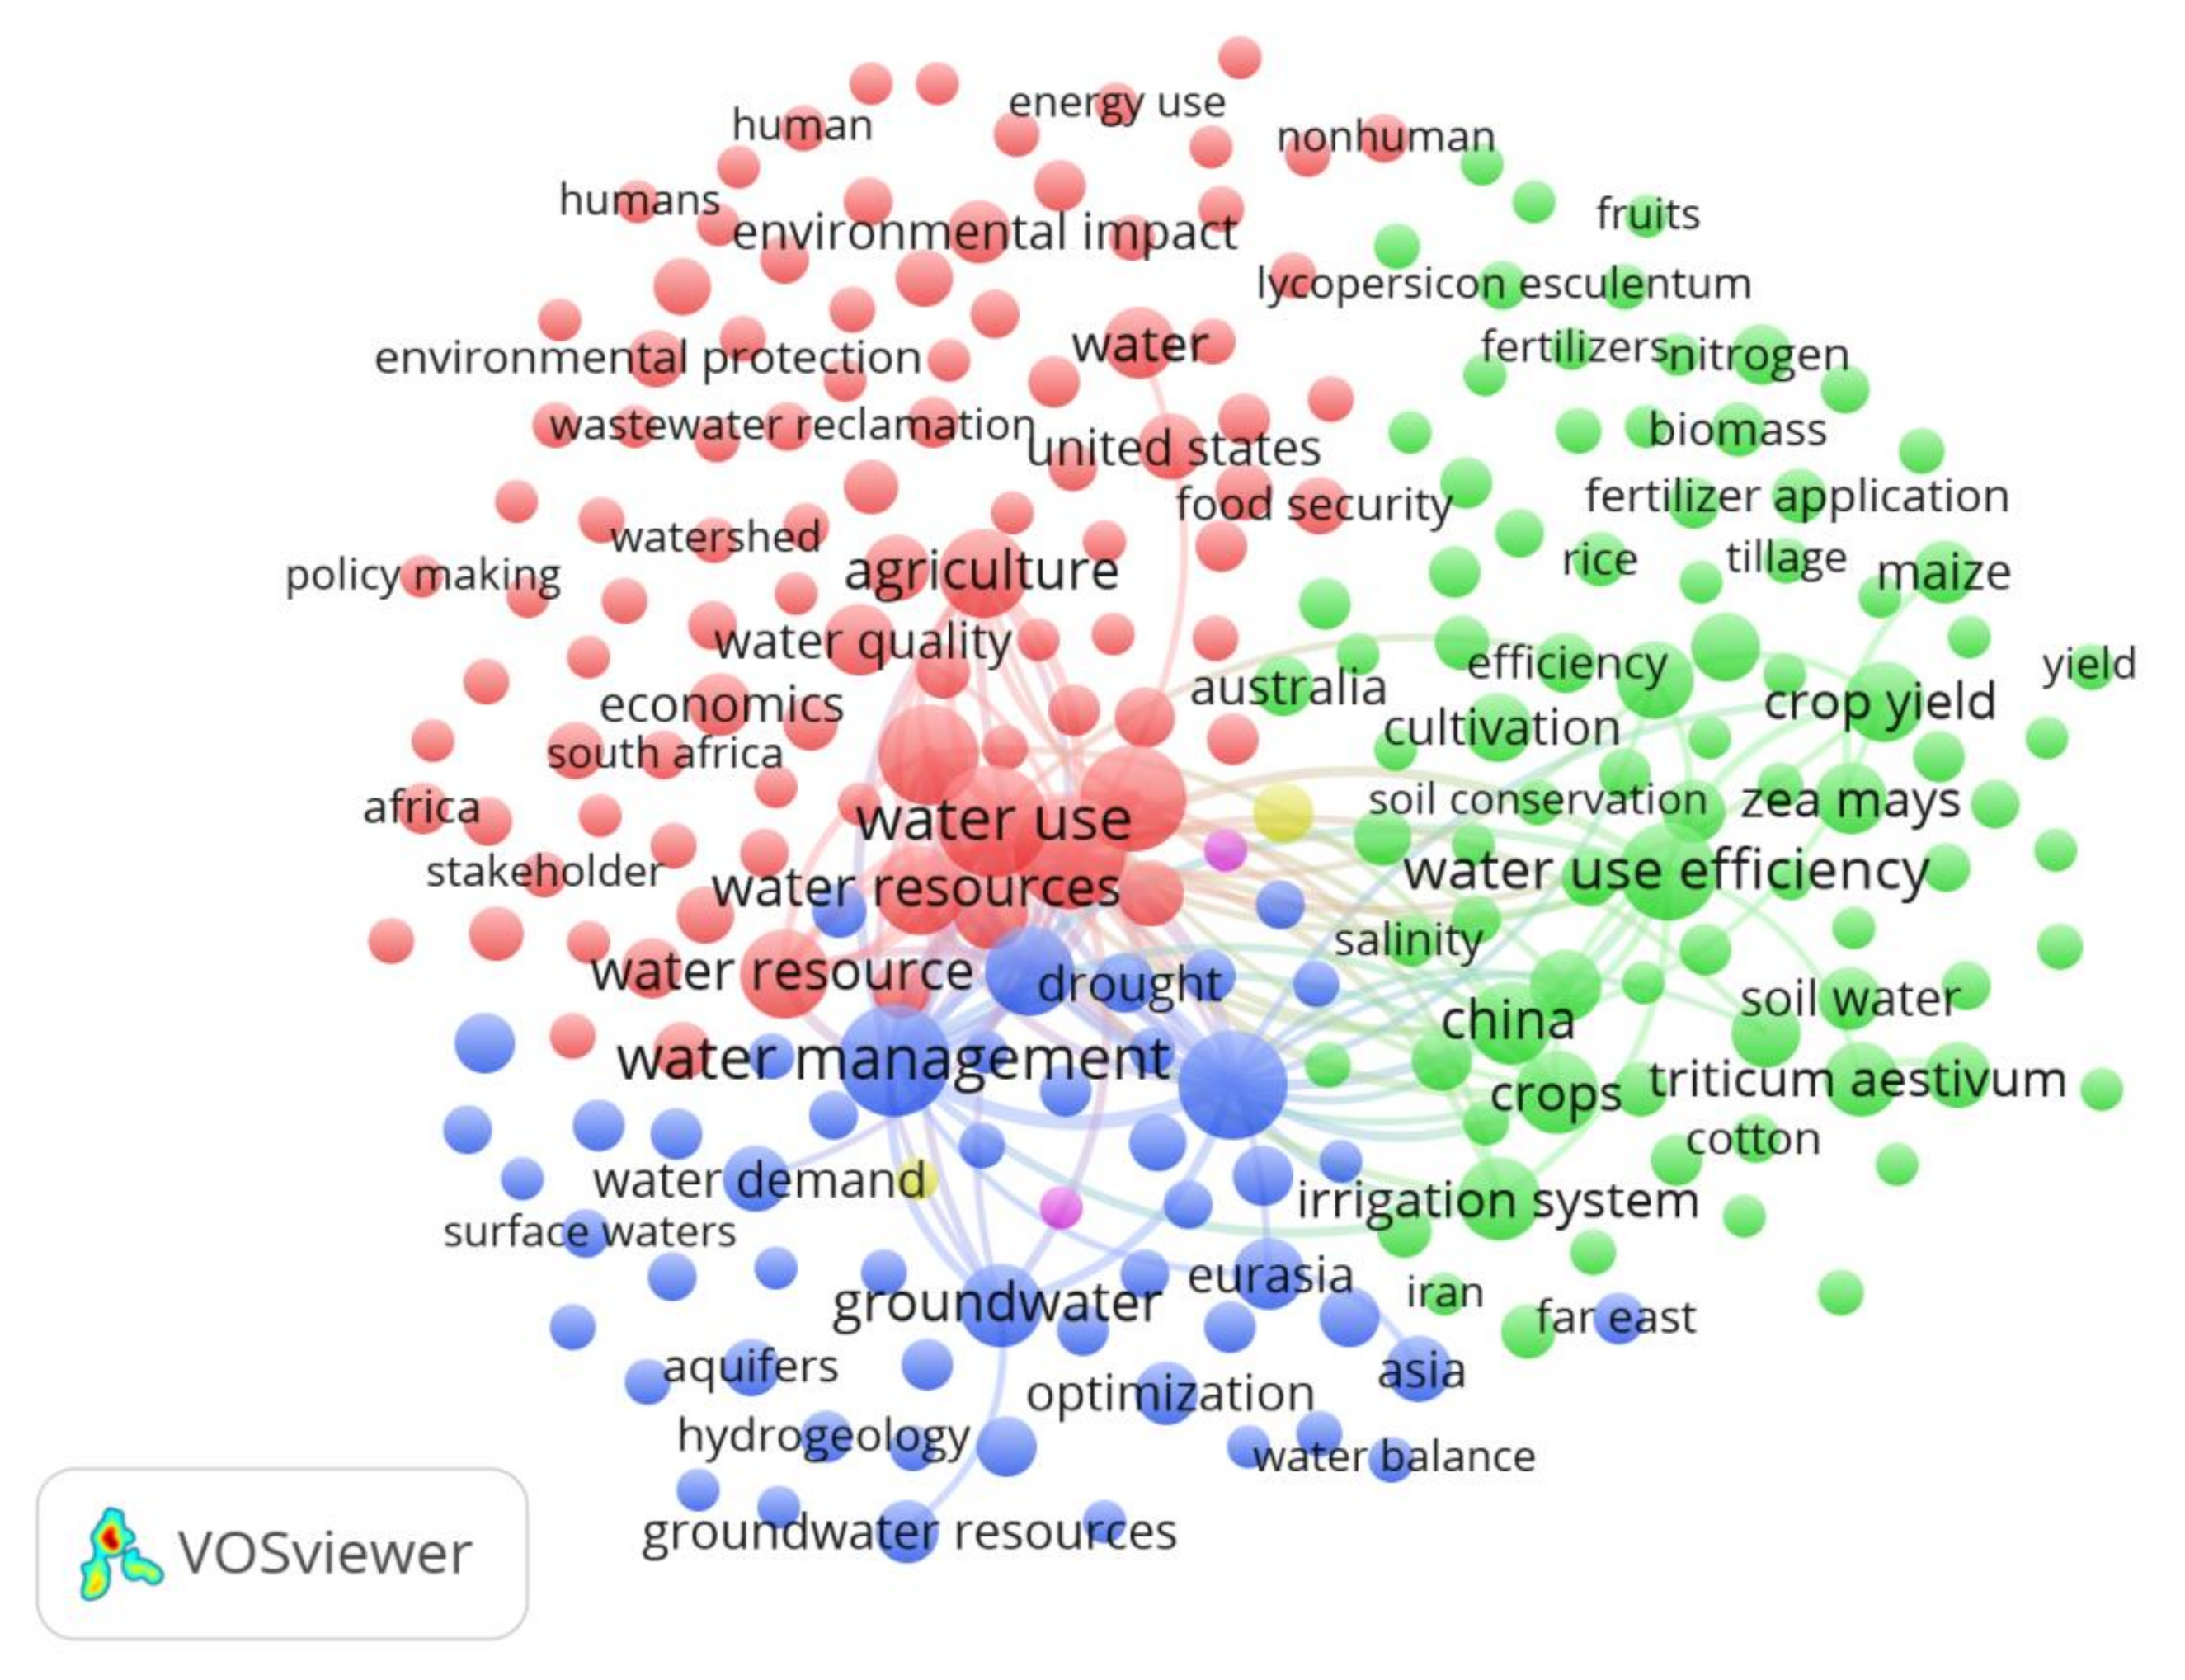
Figure 6 shows the network map that links the keywords to the entire sample of the articles analyzed. The size of the circle represents the number of articles in which each keyword appears and the color represents the cluster in which the keyword is included based on the number of co-appearances. There are three main clusters that represent three different viewpoints on SWUA. The first (Red) is focused on environmental aspects, including terms related to environmental protection and conservation. It is closely related to the socio-economic aspect of sustainability and is associated with the U.S. and Africa. The second (Green) represents the largest agronomic trend on SWUA. It includes different crops and agricultural management practices that influence agricultural sustainability and is associated with China and Australia. The third (Blue) represents hydric resources management that follows resource optimization and the balance between the source availability and the satisfaction of the different demands. This trend is associated with the European and Asian regions.
Table 8 shows the five most frequently used keywords by the five most productive countries on SWUA. These terms signify the main hotspots for each of these countries. This analysis permits identification of the different research trends based on the features of each country. In general, all of the countries shared the same keywords, although there are some differences. The U.S., Australia and Germany displayed differences only on one keyword. The U.S. and Germany had the same keywords, while Australia included the name of the country among the most used keywords and did not include Water-Supply. For China and India, the most repeated keyword was the name of its country itself. China is the only country that included Water-Resources and the country that gave less importance to Water-Management and Sustainability. Chinese works were focused on water availability and water use efficiency. India was the only country that did not include Irrigation, but it was focused on the sustainable management of water use and its efficiency.
In order to verify underlying trends, 432 articles from China and 181 from India have been studied. It has been proven that 91.7% of the Chinese articles focus on domestic issues as well as 83.6% of the Indian ones. This highlights the fact that Indian and Chinese authors concentrate almost exclusively on domestic issues.
4. Conclusions
The aim of this study was to review 25 years of international research on sustainable water use in agriculture. A bibliometric analysis was developed to sample 2084 articles published between 1993 and 2017. A productivity, impact and structural study was carried out based on the number of articles, journals, thematic categories, authors, affiliation and countries. This work was completed with the analysis of the main hotspots’ trends based on the keywords used in the articles.
Results indicated that research on sustainable water use in agriculture achieved exponential growth in the number of articles published and has become a global issue. It has been proven that the number of published articles on this topic is increasing much more than articles on water in general terms. It highlights that this research line has become a relevant study field within the general water question.
The main categories, which included articles on sustainable water use in agriculture, were Environmental Sciences (60.2%) and Agricultural and Biological Sciences (50.5%). The concept of sustainability had repercussions at environmental, socio-cultural and economic levels. Many authors stated the need for multidisciplinary approaches to deal with environmental resource sustainability. However, in the case of sustainable water use in agriculture, only 14.5% of the articles published used the Social Sciences approach; 2.7% were included in the Economics, Econometrics and Finance category; 2.6% in Business, Management and Accounting; 1.2% in Multidisciplinary; and 0.6% in Decision Sciences. The sustainability concept applied to the use of water in agriculture is directly linked to the water use efficiency and water ecosystemic services concepts. We find it necessary to create holistic analysis approaches that include technical, environmental and socio-economic aspects. They will be able to generate needed information for sustainable planning and management of hydric resources. The decision-making process has to be able to incorporate stakeholders’ preferences, as well as keep ecosystem integrity and their service flow.
The countries that published the most articles were China, the U.S., Australia, India and Germany, although the countries that published the articles with the highest impact were The Netherlands, France, the U.S., Italy and Australia. It has been proven that there are relevant differences when comparing the absolute number of published articles and the weighted average number regarding population per country. In this sense, the countries that stand out are Australia, The Netherlands and Spain. The countries that published the most articles with international collaboration were France, Germany, The Netherlands, the United Kingdom and the U.S. Different research trends have been observed per country. China and India focus their efforts on domestic issues, even when they work together with other countries, whereas European countries, the United States and Australia show balanced national and international research issues. The variety of leading research topics could also be identified per country. The research aims of the United States and China vary according to the country with which they are collaborating.
The analysis of keywords showed that the use of the term Climate Change has seen the most growth in the last few years. It highlights the fact that concerns about climate change risks are becoming greater in scientific communities. Four main research trends have been identified within this issue. We find it necessary to include climate change impacts on the studies of water use in agriculture if we want to obtain realistic and useful information in decision-making processes.
Acknowledgments
This work has been partially supported by the Spanish Ministry of Economy and Competitiveness and the European Regional Development Fund by means of the research project ECO2017-82347-P, and by the Research Plan of the University of Almería through a Predoctoral Contract to Juan F. Velasco Muñoz.
Author Contributions
The four authors have equally contributed to this paper. All authors have revised and approved the final manuscript.
Conflicts of Interest
The authors declare no conflict of interest.
References
- Forouzani, M.; Karami, E. Agricultural water poverty index and sustainability. Agron. Sustain. Dev. 2011, 31, 415–432. [Google Scholar] [CrossRef]
- Pedro-Monzonís, M.; Solera, A.; Ferrer, J.; Estrela, T.; Paredes-Arquiola, J. A review of water scarcity and drought indexes in water resources planning and management. J. Hydrol. 2015, 527, 482–493. [Google Scholar] [CrossRef]
- Gilbert, N. Water under pressure. Nature 2012, 483, 256–257. [Google Scholar] [CrossRef] [PubMed]
- Hedley, C.B.; Knox, J.W.; Raine, S.R.; Smith, R. Water: Advanced irrigation technologies. Encycl. Agric. Food Syst. 2014, 5, 378–406. [Google Scholar]
- Adeyemi, O.; Grove, I.; Peets, S.; Norton, T. Advanced monitoring and management systems for improving sustainability in precision irrigation. Sustainability 2017, 9, 353. [Google Scholar] [CrossRef]
- International Water Management Institute (IWMI). Water for Food, Water for Life: A Comprehensive Assessment of Water Management in Agriculture; Earthscan: London, UK, 2007. [Google Scholar]
- Singh, A. Conjunctive use of water resources for sustainable irrigated agriculture. J. Hydrol. 2014, 519, 1688–1697. [Google Scholar] [CrossRef]
- Gago, J.; Douthe, C.; Coopman, R.E.; Gallego, P.P.; Ribas-Carbo, M.; Flexas, J.; Escalona, J.; Medrano, H. UAVs challenge to assess water stress for sustainable agriculture. Agric. Water Manag. 2015, 153, 9–19. [Google Scholar]
- Wu, W.; Ma, B. Integrated nutrient management (INM) for sustaining crop productivity and reducing environmental impact: A review. Sci. Total Environ. 2015, 512–513, 415–427. [Google Scholar] [CrossRef] [PubMed]
- Stoeckl, N.; Chaiechi, T.; Farr, M.; Jarvis, D.; Álvarez-Romero, J.G.; Kennard, M.J.; Hermoso, V.; Pressey, R.L. Co-benefits and trade-offs between agriculture and conservation: A case study in Northern Australia. Biol. Conserv. 2015, 191, 478–494. [Google Scholar]
- De Fraiture, C.; Wichelns, D. Satisfying future water demands for agriculture. Agric. Water Manag. 2010, 97, 502–511. [Google Scholar] [CrossRef]
- Fischer, G.; Tubiello, F.N.; van Velthuizen, H.; Wiberg, D.A. Climate change impacts on irrigation water requirements: Effects of mitigation, 1990–2080. Technol. Forecast. Soc. 2007, 74, 1083–1107. [Google Scholar] [CrossRef] [Green Version]
- Singh, A. Decision support for on-farm water management and long-term agricultural sustainability in a semi-arid region of India. J. Hydrol. 2010, 391, 63–76. [Google Scholar] [CrossRef]
- Richard-Ferroudji, A.; Faysse, N.; Bouzidi, Z.; Menon, R.T.P.; Rinaudo, J.D. The DIALAQ project on sustainable groundwater management: A transdisciplinary and transcultural approach to participatory foresight. Curr. Opin. Environ. Sustain. 2016, 20, 56–60. [Google Scholar] [CrossRef]
- García-Caparrós, P.; Contreras, J.I.; Baeza, R.; Segura, M.L.; Lao, M.T. Integral management of irrigation water in intensive horticultural systems of Almería. Sustainability 2017, 9, 2271. [Google Scholar] [CrossRef]
- Sillmann, J.; Roeckner, E. Indices for extreme events in projections of anthropogenic climate change. Clim. Chang. 2008, 86, 83–104. [Google Scholar] [CrossRef]
- Zhang, Y.; Zhang, Y.; Shi, K.; Yao, X. Research development, current hotspots, and future directions of water research based on MODIS images: A critical review with a bibliometric analysis. Environ. Sci. Pollut. Res. Int. 2017, 24, 15226–15239. [Google Scholar] [CrossRef] [PubMed]
- Komiyama, H.; Takeuchi, K. Sustainability science: Building a new discipline. Sustain. Sci. 2006, 1, 1–6. [Google Scholar] [CrossRef]
- Yarime, M.; Takeda, Y.; Kajikawa, Y. Towards institutional analysis of sustainability science: A quantitative examination of the patterns of research collaboration. Sustain. Sci. 2010, 5, 115–125. [Google Scholar] [CrossRef]
- Juwana, I.; Muttil, N.; Perera, B.J.C. Indicator-based water sustainability assessment—A review. Sci. Total Environ. 2012, 438, 357–371. [Google Scholar] [CrossRef] [PubMed]
- Becker, B. Sustainability Assessment: A Review of Values, Concepts and Methodological Approaches; Issues in Agriculture 10; World Bank-Consultative Group on International Agriculture Research (CGIAR): Washington, DC, USA, 1997. [Google Scholar]
- Vanham, D.; Hoekstra, A.Y.; Wada, Y.; Bouraoui, F.; de Roo, A.; Mekonnen, M.M.; van de Bund, W.J.; Batelaan, O.; Pavelic, P.; Bastiaanssen, W.G.M.; et al. Physical water scarcity metrics for monitoring progress towards SDG target 6.4: An evaluation of indicator 6.4.2. “Level of water stress”. Sci. Total Environ. 2018, 613–614, 218–232. [Google Scholar] [CrossRef] [PubMed]
- Geoghegan-Quin, M. Role of Research & Innovation in Agriculture. European Commission-SPEECH/13/505. 2013. Available online: http://europa.eu/rapid/press-release_SPEECH-13-505_en.htm (accessed on 20 January 2018).
- Loucks, D.P.; Gladwell, J.S. Sustainability Criteria for Water Resource Systems; Cambridge University Press: Cambridge, UK, 1999. [Google Scholar]
- Alberola, C.; Lichtfouse, E.; Navarrete, M.; Debaeke, P.; Souchère, V. Agronomy for sustainable development. Ital. J. Agron. 2008, 3, 77–78. [Google Scholar]
- Mancosu, N.; Snyder, R.L.; Kyriakakis, G.; Spano, D. Water scarcity and future challenges for food production. Water 2015, 7, 975–992. [Google Scholar] [CrossRef]
- Ioris, A.A.R.; Hunter, C.; Walker, S. The development and application of water management sustainability indicators in Brazil and Scotland. J. Environ. Manag. 2008, 88, 1190–1201. [Google Scholar] [CrossRef] [PubMed] [Green Version]
- Rodrigues-Vaz, C.; Shoeninger-Rauen, T.R.; Rojas-Lezana, A.G. Sustainability and innovation in the automotive sector: A structured content analysis. Sustainability 2017, 9, 880. [Google Scholar] [CrossRef]
- Albort-Morant, G.; Henseler, J.; Leal-Millán, A.; Cepeda-Carrión, G. Mapping the field: A bibliometric analysis of green innovation. Sustainability 2017, 9, 1011. [Google Scholar] [CrossRef]
- Uriona-Maldonado, M.; Silva-Santos, J.L.; Santos, R.N.M. Inovação e Conhecimento Organizacional: Um mapeamento bibliométrico das publicações cientificas até 2009. In Proceedings of the XXXIV Encontro ANPAD, Rio de Janeiro, Brazil, 25–29 September 2010. [Google Scholar]
- Duque-Oliva, E.J.; Cervera Taulet, A.; Rodríguez-Romero, C. A bibliometric analysis of models measuring the concept of perceived quality in providing internet service. Innovar. Rev. Cienc. AD 2006, 16, 223–243. [Google Scholar]
- Durieux, V.; Gevenois, P.A. Bibliometric indicators: Quality measurements of scientific publication 1. Radiology 2010, 255, 342–351. [Google Scholar] [CrossRef] [PubMed]
- Li, Q.; Wei, W.; Xiong, N.; Feng, D.; Ye, X.; Jiang, Y. Social media research, human behavior, and sustainable society. Sustainability 2017, 9, 384. [Google Scholar] [CrossRef]
- Hassan, S.U.; Haddawy, P.; Zhu, J. A bibliometric study of the world’s research activity in sustainable development and its sub-areas using scientific literature. Scientometrics 2014, 99, 549–579. [Google Scholar] [CrossRef]
- De la Cruz-Lovera, C.; Perea-Moreno, A.J.; de la Cruz-Fernández, J.L.; Álvarez-Bermejo, J.A.; Manzano-Agugliaro, F. Worldwide research on energy efficiency and sustainability in public buildings. Sustainability 2017, 9, 1294. [Google Scholar] [CrossRef]
- Schoolman, E.D.; Guest, J.S.; Bush, K.F.; Bell, A.R. How interdisciplinary is sustainability research? Analyzing the structure of an emerging scientific field. Sustain. Sci. 2012, 7, 67–80. [Google Scholar] [CrossRef]
- Ferenhof, H.A.; Vignochi, L.; Selig, P.M.; Lezana, Á.G.R.; Campos, L.M. Environmental management systems in small and medium-sized enterprises: An analysis and systematic review. J. Clean. Prod. 2014, 74, 44–53. [Google Scholar] [CrossRef]
- Kim, J.; Lee, S.; Shim, W.; Kang, J. A mapping of marine biodiversity research trends and collaboration in the East Asia Region from 1996–2015. Sustainability 2016, 8, 1075. [Google Scholar] [CrossRef]
- Gimenez, E.; Salinas, M.; Manzano-Agugliaro, F. Worldwide research on plant defense against biotic stresses as improvement for sustainable agriculture. Sustainability 2018, 10, 391. [Google Scholar] [CrossRef]
- Barthel, R.; Seidl, R. Interdisciplinary collaboration between natural and social sciences—Status and trends exemplified in groundwater research. PLoS ONE 2017, 12, e0170754. [Google Scholar] [CrossRef] [PubMed]
- Khaled, D.; Novas, N.; Gázquez, J.A.; Manzano-Agugliaro, F. Dielectric and bioimpedance research studies: A Scientometric approach using the scopus database. Publications 2018, 6, 6. [Google Scholar] [CrossRef]
- Gusmão-Caiado, R.G.; de Freitas-Dias, R.; Veiga-Mattos, L.; Gonçalves-Quelhas, O.L.; Leal-Filho, W. Towards sustainable development through the perspective of eco-efficiency—A systematic literature review. J. Clean. Prod. 2017, 165, 890–904. [Google Scholar] [CrossRef]
- Cossarini, D.M.; MacDonald, B.H.; Wells, P.G. Communicating marine environmental information to decision makers: Enablers and barriers to use of publications (grey literature) of the Gulf of Maine Council on the Marine Environment. Ocean Coastal Manag. 2014, 96, 163–172. [Google Scholar] [CrossRef]
- Van Eck, N.J.; Waltman, L. Software survey: VOSviewer, a computer program for bibliometric mapping. Scientometrics 2010, 84, 523–538. [Google Scholar] [CrossRef] [PubMed]
- Leydesdorff, L.; Wagner, C.; Park, H.W.; Adams, J. International collaboration in science: The global map and the network. arXiv, 2013; arXiv:1301.0801.19. [Google Scholar]
- Hoppen, N.H.F.; Vanz, S.A. Neurosciences in Brazil: A bibliometric study of main characteristics, collaboration and citations. Scientometrics 2016, 109, 121–141. [Google Scholar] [CrossRef]
- De souza- Mendonça, A.K.; Rodrigues-Vaz, C.; Rojas-Lezana, A.G.; Alves-Anacleto, C.; Pacheco-Paladini, E. Comparing patent and Scientific literature in airborne wind energy. Sustainability 2017, 9, 915. [Google Scholar] [CrossRef]
- Liao, H.; Tang, M.; Luo, L.; Li, C.H.; Chiclana, F.; Zeng, X.J. A bibliometric analysis and visualization of medical big data research. Sustainability 2018, 10, 166. [Google Scholar] [CrossRef]
- Buter, R.K.; van Raan, A.F.J. Identification and analysis of the highly cited knowledge base of sustainability science. Sustain. Sci. 2013, 8, 253–267. [Google Scholar] [CrossRef]
- Brown, C.M.; Lund, J.R.; Cai, X.; Reed, P.M.; Zagona, E.A.; Ostfeld, A.; Hall, J.; Characklis, G.W.; Yu, W.; Brekke, L. The future of water resources systems analysis: Toward a scientific framework for sustainable water management. Water Resour. Res. 2015, 51, 6110–6124. [Google Scholar] [CrossRef]
- Ridoutt, B.G.; Eady, S.J.; Sellahewa, J.; Simons, L.; Bektash, R. Water footprinting at the product brand level: Case study and future challenges. J. Clean. Prod. 2009, 17, 1228–1235. [Google Scholar] [CrossRef]
- Page, G.; Ridoutt, B.; Bellotti, B. Carbon and water footprint tradeoffs in fresh tomato production. J. Clean. Prod. 2012, 32, 219–226. [Google Scholar] [CrossRef]
- Ridoutt, B.G.; Pfister, S. A revised approach to water footprinting to make transparent the impacts of consumption and production on global freshwater scarcity. Glob. Environ. Chang. Hum. Policy Dimens. 2010, 20, 113–120. [Google Scholar] [CrossRef]
- Zeng, Z.; Liu, J.; Koeneman, P.H.; Zarate, E.; Hoekstra, A.Y. Assessing water footprint at river basin level: A case study for the Heihe River Basin in northwest China. Hydrol. Earth Syst. Sci. 2012, 16, 2771–2781. [Google Scholar] [CrossRef] [Green Version]
- Berrittella, M.; Hoekstra, A.Y.; Rehdanz, K.; Roson, R.; Tol, R.S.J. The economic impact of restricted water supply: A computable general equilibrium analysis. Water Res. 2007, 41, 1799–1813. [Google Scholar] [CrossRef] [PubMed] [Green Version]
- Gerbens-Leenes, P.W.; Hoekstra, A.Y.; van der Meer, T.H. The water footprint of energy from biomass: A quantitative assessment and consequences of an increasing share of bio-energy in energy supply. Ecol. Econ. 2009, 68, 1052–1060. [Google Scholar] [CrossRef]
- Du, T.; Kang, S.; Sun, J.; Zhang, X.; Zhang, J. An improved water use efficiency of cereals under temporal and spatial deficit irrigation in north China. Agric. Water Manag. 2010, 97, 66–74. [Google Scholar] [CrossRef]
- Zhang, X.; Pei, D.; Hu, C. Conserving groundwater for irrigation in the North China Plain. Irrig. Sci. 2003, 21, 159–166. [Google Scholar]
- Sun, H.; Shen, Y.; Yu, Q.; Flerchinger, G.N.; Zhang, Y.; Liu, C.H.; Zhang, X. Effect of precipitation change on water balance and WUE of the winter wheat–summer maize rotation in the North China Plain. Agric. Water Manag. 2010, 97, 1139–1145. [Google Scholar] [CrossRef]
Figure 1.
Trend in the number of articles.

Figure 2.
Comparative trends in the number of articles of Water and Sustainable Water Use in Agriculture SWUA research.
Figure 2.
Comparative trends in the number of articles of Water and Sustainable Water Use in Agriculture SWUA research.

Figure 3.
Evolution of the main subject areas.

Figure 4.
Correlation between H index and number of articles by country.

Figure 5.
Countries’ network.

Figure 6.
Keywords network.


Table 1.
Evolution of the main characteristics of the articles.
| Year | A | AU | J | C | NR | NR/A | TC | CTC/CA |
|---|---|---|---|---|---|---|---|---|
| 1993 | 4 | 4 | 3 | 3 | ND | ND | 0 | 0.0 |
| 1994 | 6 | 9 | 5 | 4 | 120 | 20.1 | 1 | 0.1 |
| 1995 | 7 | 17 | 6 | 6 | 231 | 33.0 | 6 | 0.4 |
| 1996 | 11 | 17 | 10 | 8 | 126 | 11.5 | 8 | 0.5 |
| 1997 | 18 | 46 | 14 | 14 | 456 | 25.3 | 21 | 0.8 |
| 1998 | 14 | 34 | 13 | 11 | 300 | 21.4 | 38 | 1.2 |
| 1999 | 25 | 61 | 14 | 14 | 863 | 34.5 | 61 | 1.6 |
| 2000 | 17 | 43 | 17 | 13 | 462 | 27.2 | 82 | 2.1 |
| 2001 | 38 | 114 | 26 | 19 | 998 | 26.3 | 107 | 2.3 |
| 2002 | 26 | 75 | 22 | 12 | 889 | 34.2 | 192 | 3.1 |
| 2003 | 50 | 152 | 37 | 29 | 1177 | 23.5 | 253 | 3.6 |
| 2004 | 37 | 113 | 27 | 25 | 1046 | 28.3 | 268 | 4.1 |
| 2005 | 40 | 119 | 33 | 24 | 975 | 24.4 | 364 | 4.8 |
| 2006 | 57 | 202 | 46 | 21 | 1467 | 25.7 | 491 | 5.4 |
| 2007 | 76 | 244 | 54 | 35 | 2267 | 29.8 | 620 | 5.9 |
| 2008 | 82 | 258 | 56 | 34 | 2473 | 30.2 | 809 | 6.5 |
| 2009 | 112 | 389 | 79 | 38 | 4079 | 36.4 | 1086 | 7.1 |
| 2010 | 127 | 435 | 84 | 46 | 4307 | 33.9 | 1420 | 7.8 |
| 2011 | 140 | 523 | 94 | 48 | 5312 | 37.9 | 2015 | 8.8 |
| 2012 | 138 | 493 | 89 | 49 | 4889 | 35.4 | 2365 | 10.0 |
| 2013 | 172 | 694 | 110 | 55 | 7183 | 41.8 | 3106 | 11.1 |
| 2014 | 196 | 756 | 137 | 49 | 7831 | 40.0 | 3773 | 12.3 |
| 2015 | 210 | 867 | 116 | 56 | 8517 | 40.6 | 4262 | 13.3 |
| 2016 | 214 | 910 | 126 | 59 | 9273 | 43.3 | 5117 | 14.6 |
| 2017 | 267 | 1110 | 147 | 69 | 11,773 | 44.1 | 5638 | 15.4 |
A: The annual number of total articles; AU: the annual number of authors; J: the annual number of journals; C: the annual number of countries; NR: the number of references in total articles; NR/A: the annual number of references per article; TC: the annual number of citations in cumulative articles; CTC/CA: annual total citation per cumulative article.
Table 2.
Characteristics of the main journals.
| Journal | A | SJR | C | TC | TC/A | H | 1st A | R (A) | ||||
|---|---|---|---|---|---|---|---|---|---|---|---|---|
| 1993–1997 | 1998–2002 | 2003–2007 | 2008–2012 | 2013–2017 | ||||||||
| Agricultural Water Management | 159 | 1.264 (Q1) | The Netherlands | 4367 | 27.5 | 39 | 1997 | 7 (1) | 1 (12) | 1 (22) | 1 (51) | 1 (73) |
| Water Resources Management | 51 | 1.355 (Q1) | The Netherlands | 1020 | 20.0 | 18 | 2000 | 0 | 10 (2) | 6 (6) | 3 (21) | 6 (22) |
| Nongye Gongcheng Xuebao Agricultural Engineering | 37 | 0.372 (Q2) | China | 140 | 3.8 | 7 | 2011 | 0 | 0 | 0 | 13 (7) | 4 (30) |
| Field Crops Research | 36 | 1.577 (Q1) | The Netherlands | 942 | 26.2 | 17 | 1998 | 0 | 6 (3) | 15 (3) | 10 (8) | 6 (22) |
| Wit Transactions on Ecology and the Environment | 35 | 0.123 (ND) | the United Kingdom | 18 | 0.5 | 2 | 2006 | 0 | 0 | 4 (7) | 2 (25) | 65 (3) |
| Water | 33 | 0.548 (Q2) | Switzerland | 75 | 2.3 | 4 | 2012 | 0 | 0 | 0 | 90 (1) | 2 (32) |
| Sustainability | 31 | 0.524 (Q2) | Switzerland | 94 | 3.0 | 6 | 2013 | 0 | 0 | 0 | 0 | 3 (31) |
| Shengtai Xuebao Acta Ecologica Sinica | 29 | 0.177 (Q4) | China | 73 | 2.5 | 5 | 2008 | 0 | 0 | 0 | 4 (18) | 14 (11) |
| Science of the Total Environment | 28 | 1.621 (Q1) | The Netherlands | 214 | 7.6 | 10 | 2012 | 0 | 0 | 0 | 90 (1) | 5 (27) |
| Journal of Cleaner Production | 27 | 1.615 (Q1) | The Netherlands | 396 | 14.7 | 12 | 2006 | 0 | 0 | 43 (1) | 16 (5) | 8 (21) |
| Journal of Hydrology | 26 | 1.745 (Q1) | The Netherlands | 536 | 20.6 | 13 | 2004 | 0 | 0 | 28 (2) | 5 (11) | 11 (13) |
| Irrigation and Drainage | 25 | 0.433 (Q2) | the U.S. | 134 | 5.4 | 8 | 2003 | 0 | 0 | 8 (4) | 6 (10) | 14 (11) |
| Agriculture Ecosystems and Environment | 24 | 1.612 (Q1) | The Netherlands | 1101 | 45.9 | 13 | 2000 | 0 | 10 (2) | 8 (4) | 16 (5) | 11 (13) |
| Journal of Environmental Management | 24 | 1.141 (Q1) | the U.S. | 618 | 25.8 | 16 | 2000 | 0 | 10 (2) | 15 (3) | 7 (9) | 18 (10) |
A: the annual number of total articles; SJR: Scopus Journal Ranking; C: country; TC: the annual number of citations in total articles; TC/A: total citation per article; H: H index; 1st A: first article of SWUA research by journal; R: ranking position.
Table 3.
Characteristics of the main countries.
| Country | A | APC | TC | TC/A | R (A) | ||||
|---|---|---|---|---|---|---|---|---|---|
| 1993–1997 | 1998–2002 | 2003–2007 | 2008–2012 | 2013–2017 | |||||
| China | 432 | 0.313 | 5382 | 12.5 | 8 (1) | 4 (8) | 2 (38) | 2 (99) | 1 (286) |
| the United States | 423 | 1.309 | 9315 | 22.0 | 1 (10) | 1 (34) | 1 (50) | 1 (102) | 2 (227) |
| Australia | 221 | 9.160 | 4583 | 20.7 | 3 (3) | 2 (17) | 3 (37) | 3 (82) | 4 (82) |
| India | 181 | 0.137 | 2813 | 15.5 | 4 (2) | 3 (13) | 4 (24) | 4 (48) | 3 (94) |
| Germany | 120 | 1.452 | 2020 | 16.8 | 8 (1) | 5 (5) | 5 (15) | 5 (37) | 7 (62) |
| Spain | 117 | 2.519 | 2004 | 17.1 | 0 | 0 | 5 (15) | 6 (32) | 5 (70) |
| Italy | 104 | 1.716 | 2166 | 20.8 | 0 | 0 | 12 (7) | 8 (31) | 6 (66) |
| The Netherlands | 98 | 5.758 | 2617 | 26.7 | 4 (2) | 5 (5) | 7 (14) | 10 (24) | 8 (53) |
| the United Kingdom | 92 | 1.402 | 1554 | 16.9 | 2 (5) | 10 (3) | 9 (8) | 6 (32) | 9 (44) |
| France | 64 | 0.957 | 1483 | 23.2 | 0 | 7 (4) | 15 (5) | 9 (25) | 11 (30) |
A: the annual number of total articles; APC: number of articles per 1mill. inhabitants; TC: the annual number of citations in total articles; TC/A: total citation per article; R: ranking position.
Table 4.
International collaboration of the main countries.
| Country | IC (%) | NC | Main Collaborators | TC/A | |
|---|---|---|---|---|---|
| IC | NIC | ||||
| China | 37.73 | 43 | the United States, Australia, Canada, Japan, the United Kingdom | 18.0 | 9.1 |
| the United States | 45.39 | 55 | China, India, Australia, Germany, Mexico | 27.7 | 17.3 |
| Australia | 43.89 | 41 | China, the United States, Pakistan, India, Spain | 22.6 | 19.3 |
| India | 29.28 | 27 | the United States, Australia, The Netherlands, Bangladesh, Philippines | 34.9 | 7.5 |
| Germany | 68.33 | 50 | the United States, Uzbekistan, China, Austria, Ethiopia | 18.6 | 13.0 |
| Spain | 41.88 | 23 | Italy, the United States, Australia, Portugal, the United Kingdom | 19.4 | 15.5 |
| Italy | 38.46 | 33 | the United States, Spain, France, Morocco, Portugal | 35.3 | 11.8 |
| The Netherlands | 65.31 | 40 | China, Australia, Germany, India, South Africa | 22.7 | 34.2 |
| the United Kingdom | 63.04 | 40 | China, the United States, Spain, Germany, India | 15.4 | 19.4 |
| France | 68.75 | 37 | Italy, Morocco, Australia, Belgium, Germany | 21.4 | 27.0 |
IC: international collaborations; NC: total number of international collaborators; TC/A: total citation per article; NIC: no international collaborations.
Table 5.
Characteristics of the main institutions.
| Institution | C | A | TC | TC/A | H index | IC (%) | TC/A | |
|---|---|---|---|---|---|---|---|---|
| IC | NIC | |||||||
| Chinese Academy of Sciences | China | 134 | 2195 | 16.4 | 27 | 34.33 | 23.5 | 12.7 |
| China Agricultural University | China | 63 | 1032 | 16.4 | 18 | 52.38 | 16.5 | 16.3 |
| Northwest A&F University | China | 59 | 712 | 12.1 | 14 | 35.59 | 19.0 | 8.2 |
| Wageningen University and Research Centre | The Netherlands | 46 | 1243 | 27.0 | 17 | 73.91 | 27.9 | 24.7 |
| USDA Agricultural Research Service | the U.S. | 38 | 1058 | 27.8 | 18 | 31.58 | 34.8 | 24.7 |
| Institute of Geographical Sciences and Natural Resources Research Chinese Academy of Sciences | China | 35 | 743 | 21.2 | 12 | 34.29 | 39.5 | 11.7 |
| CSIRO Land and Water | Australia | 33 | 878 | 26.6 | 15 | 48.48 | 40.7 | 13.4 |
| Ministry of Agriculture of the People’s Republic of China | China | 29 | 178 | 6.1 | 8 | 24.14 | 12.6 | 4.1 |
| Beijing Normal University | China | 28 | 371 | 13.3 | 10 | 32.14 | 24.1 | 8.1 |
| University of Western Australia | Australia | 25 | 426 | 17.0 | 10 | 56.00 | 14.3 | 20.5 |
C: country; A: the annual number of total articles; TC: the annual number of citations in total articles; TC/A: total citation per article; IC: international collaborations; NIC: no international collaborations.
Table 6.
Characteristics of the main authors.
| Author | A | TC | TC/A | H Index | C | Affiliation | 1st A | Last A |
|---|---|---|---|---|---|---|---|---|
| Ridoutt, Bradley G. | 13 | 548 | 42.2 | 10 | Australia | Commonwealth Scientific and Industrial Research Organization | 2009 | 2017 |
| Hoekstra, Arjen Y. | 10 | 456 | 45.6 | 9 | The Netherlands | University of Twente | 2007 | 2017 |
| Zhang, Xiying | 10 | 541 | 54.1 | 9 | China | Institute of Genetics and Developmental Biology Chinese Academy of Sciences | 2003 | 2015 |
| Jat, MangiLal | 9 | 180 | 20.0 | 5 | India | International Maize and Wheat Improvement Centre | 2009 | 2016 |
| Lamers, John P.A. | 8 | 68 | 8.5 | 6 | Germany | Universitat Bonn | 2010 | 2016 |
| Wang, Dong | 8 | 27 | 3.4 | 3 | China | Shandong Agricultural University | 2010 | 2017 |
| Wu, Pute | 8 | 35 | 4.4 | 4 | China | Northwest A&F University | 2010 | 2017 |
| Yang, Yonghui | 8 | 311 | 38.9 | 6 | China | Chinese Academy of Sciences, Key Laboratory of Agricultural Water Resources | 2002 | 2017 |
| Chen, Fu | 7 | 82 | 11.7 | 5 | China | China University of Mining Technology | 2010 | 2015 |
| Huo, Zailin | 7 | 44 | 6.3 | 3 | China | China Agricultural University, College of Water Resources and Civil Engineering | 2012 | 2017 |
| Pereira, Luis S. | 7 | 168 | 24.0 | 5 | Portugal | Technical University of Lisbon, Instituto Superior de Agronomia | 1996 | 2017 |
| Ward, Frank A. | 7 | 261 | 37.3 | 6 | the U.S. | New Mexico State University Las Cruces | 2007 | 2012 |
A: the annual number of total articles; TC: the annual number of citations in total articles; TC/A: total citation per article; C: country; 1st A: first article of SWUA research by author; Last A: last article of SWUA research by author.
Table 7.
Evolution of the main keywords.
| Keywords | 1993–2017 | 1993–1997 | 1998–2002 | 2003–2007 | 2008–2012 | 2013–2017 | ||||||
|---|---|---|---|---|---|---|---|---|---|---|---|---|
| A | % | R (A) | % | R (A) | % | R (A) | % | R (A) | % | R (A) | % | |
| Water-Use | 697 | 33.45 | 9 (6) | 13.04 | 3 (29) | 24.17 | 3 (89) | 34.23 | 2 (255) | 42.57 | 3 (318) | 30.03 |
| Irrigation | 691 | 33.16 | 1 (11) | 23.91 | 1 (35) | 29.17 | 1 (104) | 40.00 | 4 (207) | 34.56 | 1 (334) | 31.54 |
| Water-Management | 668 | 32.05 | 4 (8) | 17.39 | 2 (33) | 27.50 | 2 (97) | 37.31 | 3 (216) | 36.06 | 4 (314) | 29.65 |
| Water-Supply | 661 | 31.72 | 3 (10) | 21.74 | 7 (13) | 10.83 | 8 (50) | 19.23 | 1 (263) | 43.91 | 2 (325) | 30.69 |
| Sustainability | 572 | 27.45 | 15 (4) | 8.70 | 5 (21) | 17.50 | 4 (74) | 28.46 | 5 (191) | 31.89 | 6 (282) | 26.63 |
| Water-Resources | 547 | 26.25 | 7 (7) | 15.22 | 5 (21) | 17.50 | 5 (68) | 26.15 | 7 (152) | 25.38 | 5 (299) | 28.23 |
| Water-Use-Efficiency | 477 | 22.89 | 12 (5) | 10.87 | 9 (9) | 7.50 | 9 (49) | 18.85 | 6 (160) | 26.71 | 7 (251) | 23.70 |
| Sustainable-Development | 475 | 22.79 | 4 (8) | 17.39 | 4 (24) | 20.00 | 7 (67) | 25.77 | 8 (134) | 22.37 | 8 (242) | 22.85 |
| Agriculture | 342 | 16.41 | 21 (3) | 6.52 | 12 (8) | 6.67 | 12 (39) | 15.00 | 11 (81) | 13.52 | 9 (211) | 19.92 |
| Water-Conservation | 311 | 14.92 | 21 (3) | 6.52 | 51 (3) | 2.50 | 24 (22) | 8.46 | 9 (106) | 17.70 | 10 (177) | 16.71 |
| Crops | 281 | 13.48 | 0 | 0.00 | 25 (5) | 4.17 | 14 (34) | 13.08 | 13 (79) | 13.19 | 12 (161) | 15.20 |
| Groundwater | 279 | 13.39 | 33 (2) | 4.35 | 9 (9) | 7.50 | 11 (41) | 13.46 | 12 (81) | 13.52 | 14 (141) | 13.31 |
| Irrigation-System | 267 | 12.81 | 0 | 0.00 | 19 (6) | 5.00 | 30 (18) | 6.92 | 10 (93) | 15.53 | 13 (150) | 14.16 |
| Crop-Yield | 228 | 10.94 | 72 (1) | 2.17 | 19 (6) | 5.00 | 15 (27) | 10.38 | 15 (72) | 12.02 | 16 (122) | 11.52 |
| Crop-Production | 209 | 10.03 | 0 | 0.00 | 43 (4) | 3.33 | 29 (19) | 7.31 | 17 (69) | 11.52 | 17 (118) | 11.14 |
| Triticum-Aestivum | 197 | 9.45 | 33 (2) | 4.35 | 16 (7) | 5.83 | 13 (38) | 14.62 | 18(68) | 11.35 | 26 (80) | 7.55 |
| Climate-Change | 192 | 9.21 | 0 | 0.00 | 51 (3) | 2.50 | 81 (7) | 2.69 | 21 (57) | 9.52 | 15 (125) | 11.80 |
| Evapotranspiration | 176 | 8.45 | 0 | 0.00 | 43 (4) | 3.33 | 25 (21) | 8.08 | 30 (46) | 7.68 | 18 (105) | 9.92 |
| Groundwater-Resources | 175 | 8.40 | 33 (2) | 4.35 | 25 (5) | 4.17 | 30 (18) | 6.92 | 23 (56) | 9.35 | 22 (94) | 8.88 |
| Zea-Mays | 171 | 8.21 | 72 (1) | 2.17 | 43 (4) | 3.33 | 21 (23) | 8.85 | 22(57) | 9.52 | 25 (86) | 8.12 |
A: the annual number of total articles; R: ranking position.
Table 8.
Main keywords by country.
| Country | Keyword 1 | Keyword 2 | Keyword 3 | Keyword 4 | Keyword 5 |
|---|---|---|---|---|---|
| China | China | Water-Supply | Water-Resources | Water-Use-Efficiency | Irrigation |
| the United States | Water-Supply | Irrigation | Water-Use | Sustainability | Water-Management |
| Australia | Water-Use | Australia | Irrigation | Sustainability | Water-Management |
| India | India | Sustainability | Water-Management | Water-Use | Water-Use-Efficiency |
| Germany | Water-Management | Water-Use | Irrigation | Water-Supply | Sustainability |
© 2018 by the authors. Licensee MDPI, Basel, Switzerland. This article is an open access article distributed under the terms and conditions of the Creative Commons Attribution (CC BY) license (http://creativecommons.org/licenses/by/4.0/).
Share and Cite
MDPI and ACS Style
Velasco-Muñoz, J.F.; Aznar-Sánchez, J.A.; Belmonte-Ureña, L.J.; Román-Sánchez, I.M. Sustainable Water Use in Agriculture: A Review of Worldwide Research. Sustainability 2018, 10, 1084. https://0-doi-org.brum.beds.ac.uk/10.3390/su10041084
AMA Style
Velasco-Muñoz JF, Aznar-Sánchez JA, Belmonte-Ureña LJ, Román-Sánchez IM. Sustainable Water Use in Agriculture: A Review of Worldwide Research. Sustainability. 2018; 10(4):1084. https://0-doi-org.brum.beds.ac.uk/10.3390/su10041084
Chicago/Turabian StyleVelasco-Muñoz, Juan F., José A. Aznar-Sánchez, Luis J. Belmonte-Ureña, and Isabel M. Román-Sánchez. 2018. "Sustainable Water Use in Agriculture: A Review of Worldwide Research" Sustainability 10, no. 4: 1084. https://0-doi-org.brum.beds.ac.uk/10.3390/su10041084
Note that from the first issue of 2016, this journal uses article numbers instead of page numbers. See further details here.