Evaluation of Temporal and Spatial Ecosystem Services in Dalian, China: Implications for Urban Planning


Abstract
:1. Introduction
2. Case Study
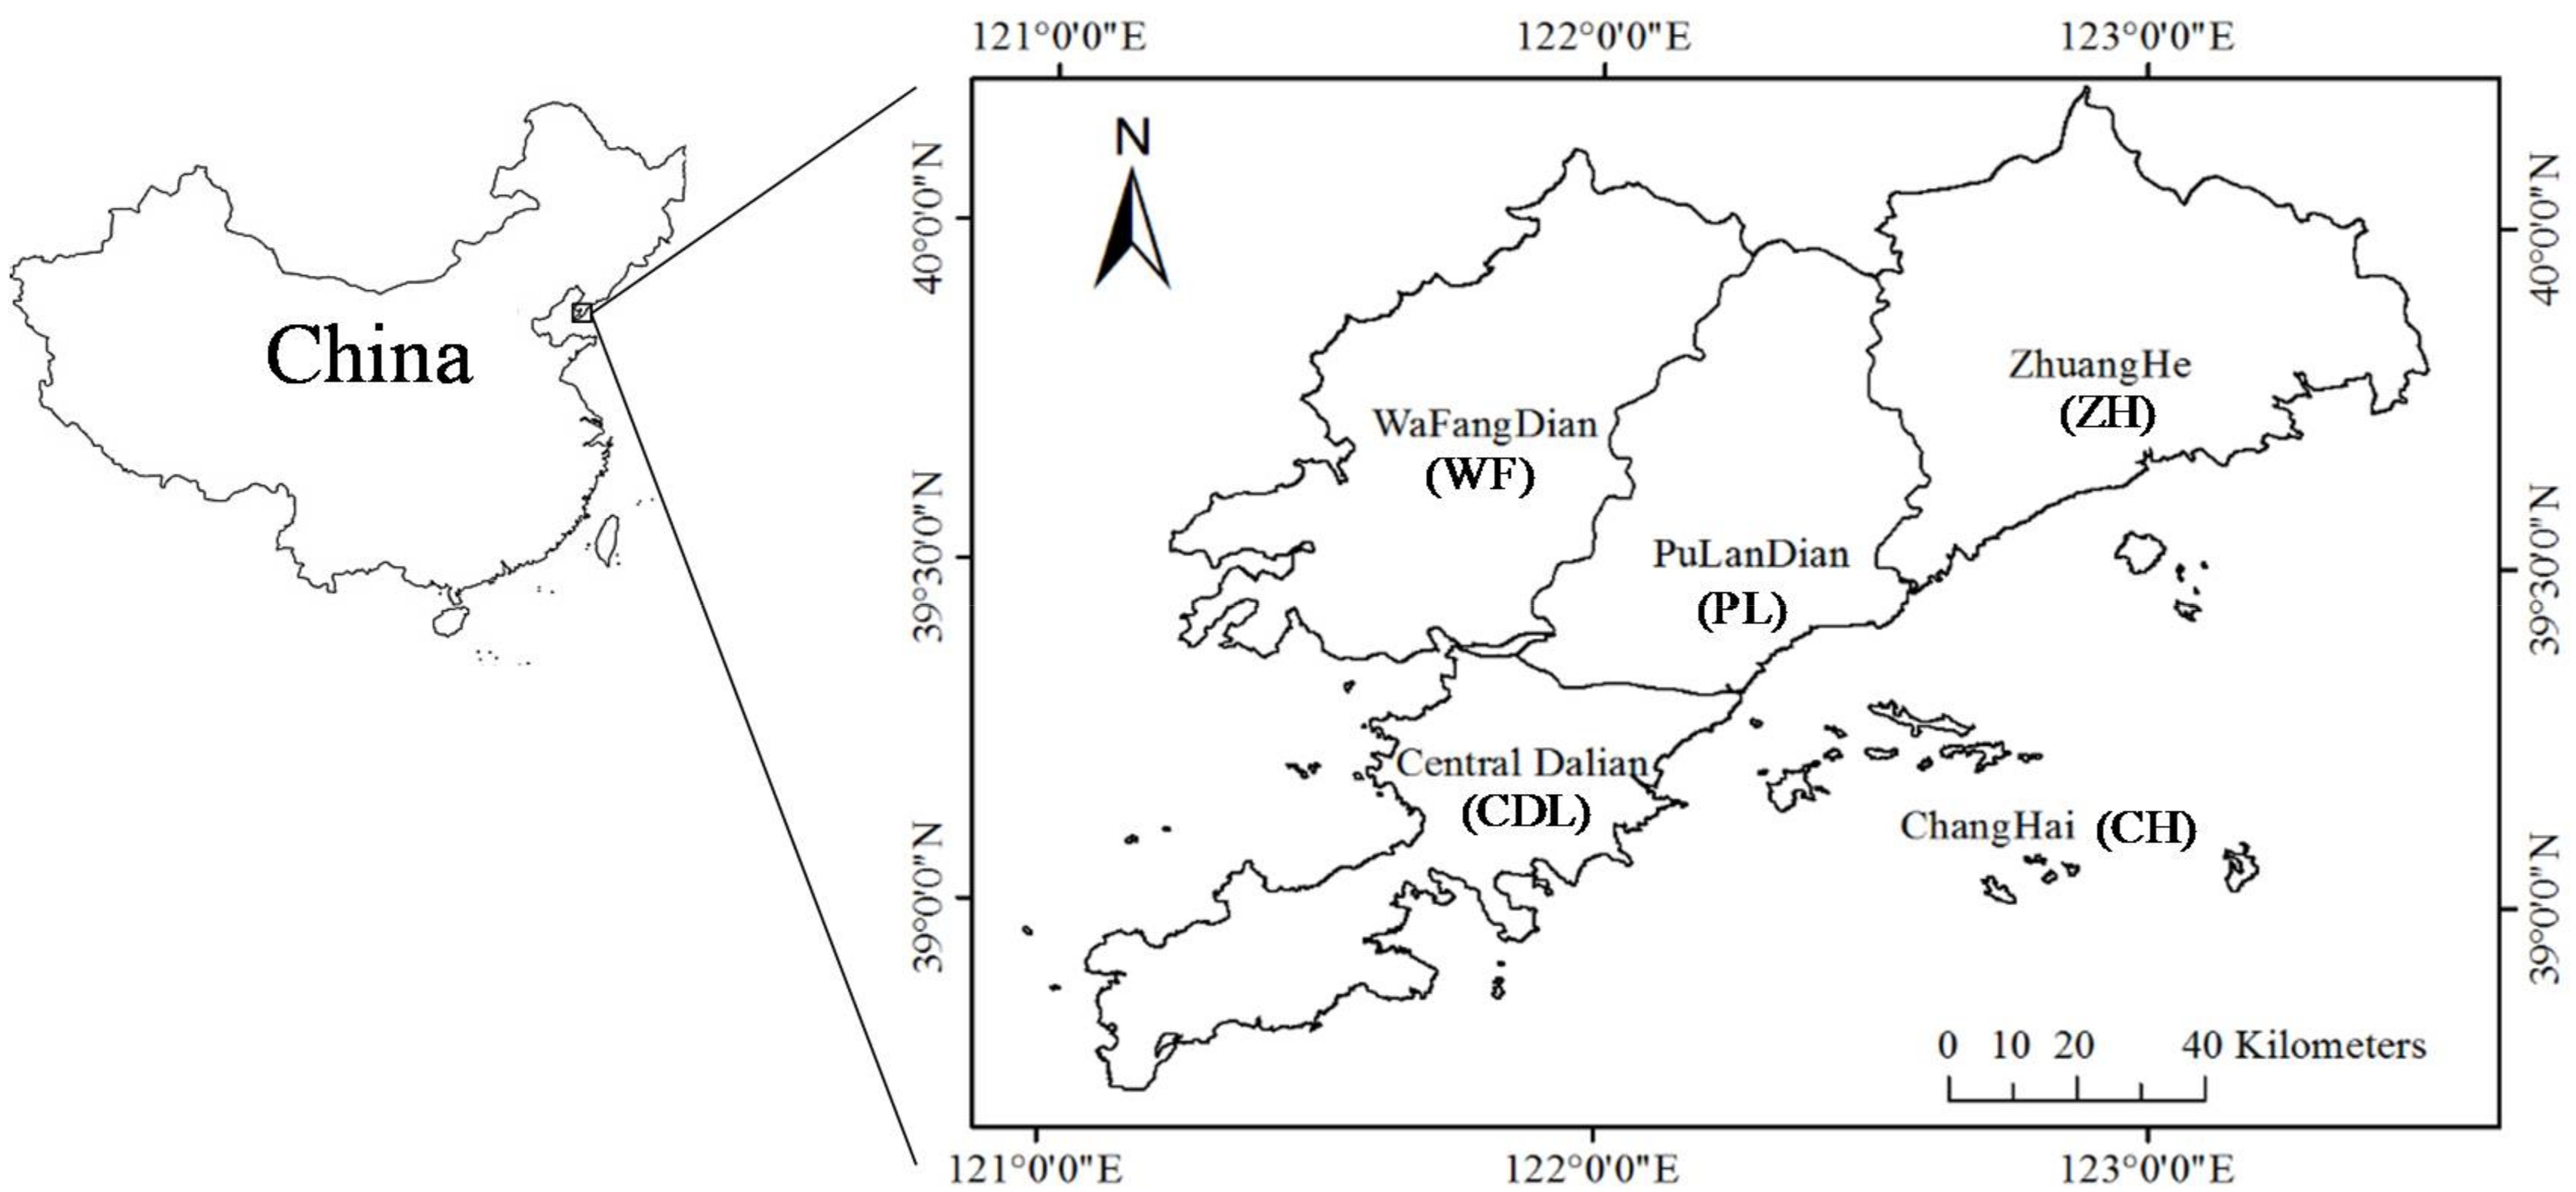
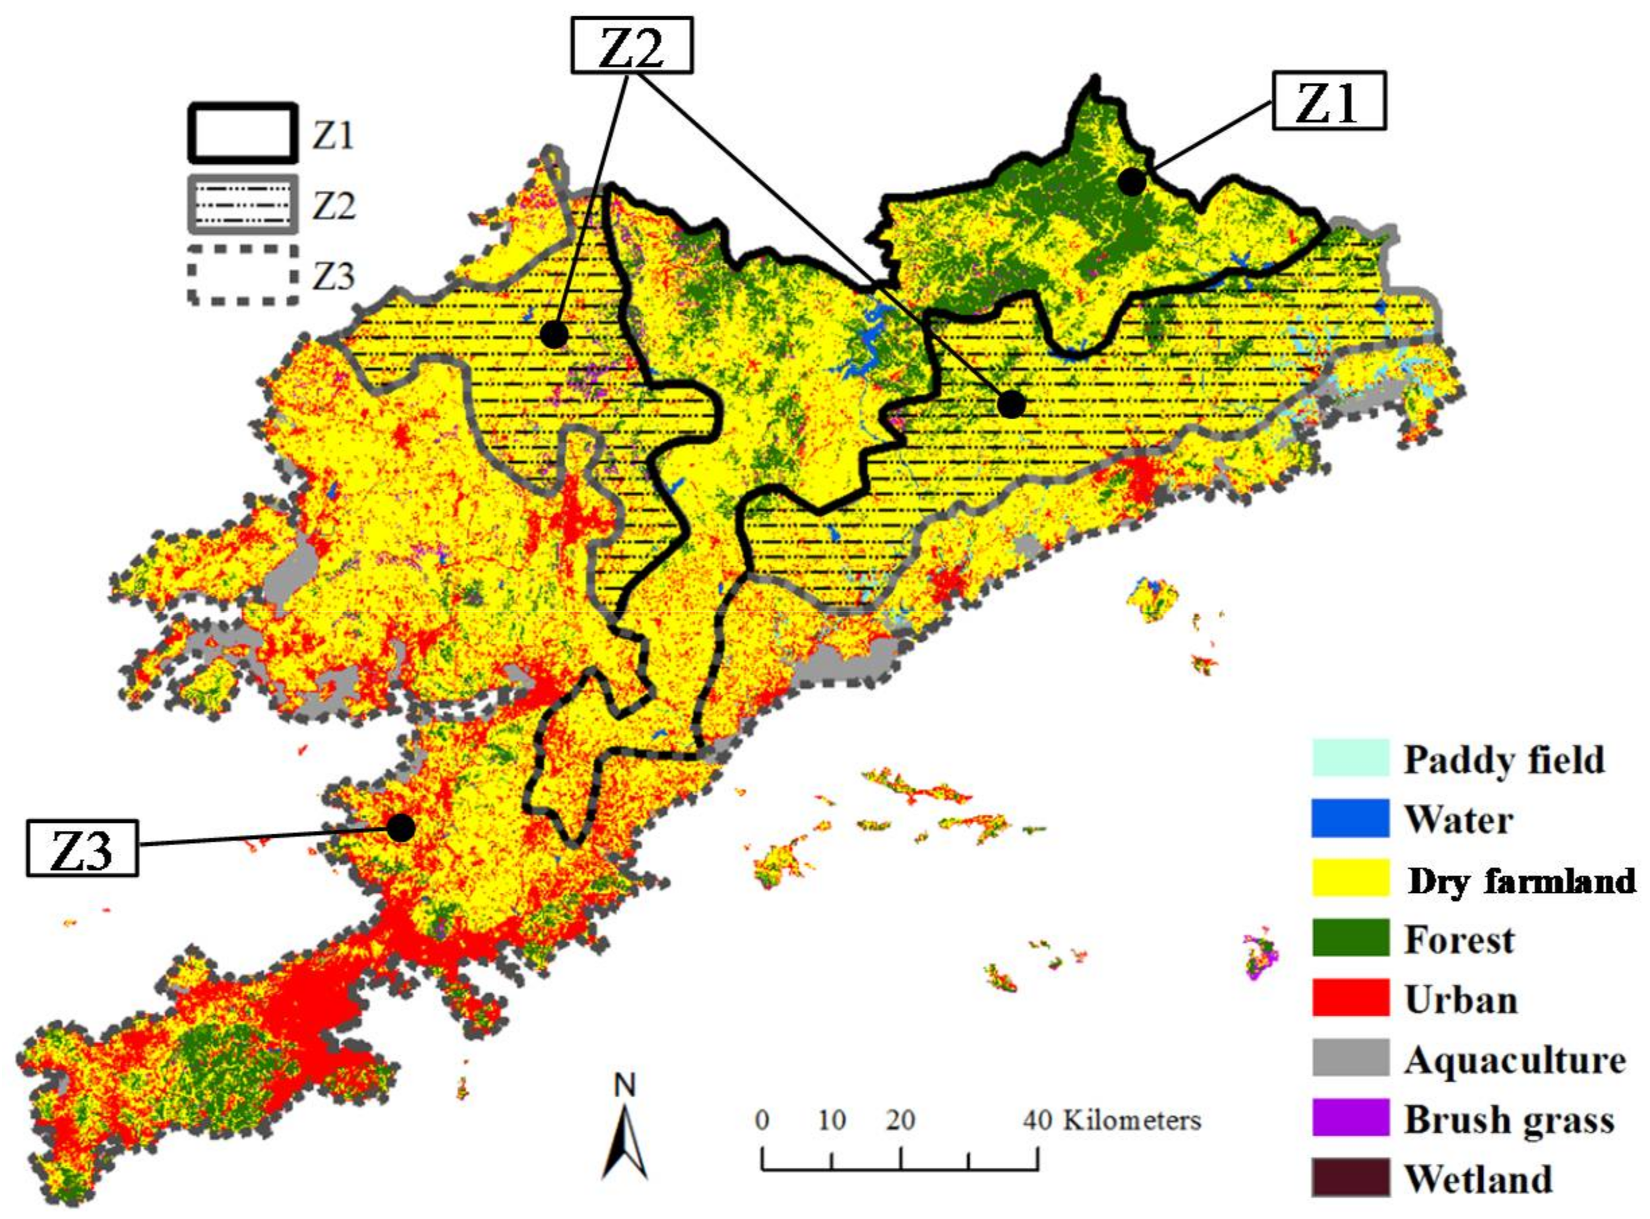
2.1. Study Area
2.2. Data Sources
3. Methods
3.1. Land Use Classification
3.2. Evaluation of the Ecosystem Service Value
4. Results and Discussion
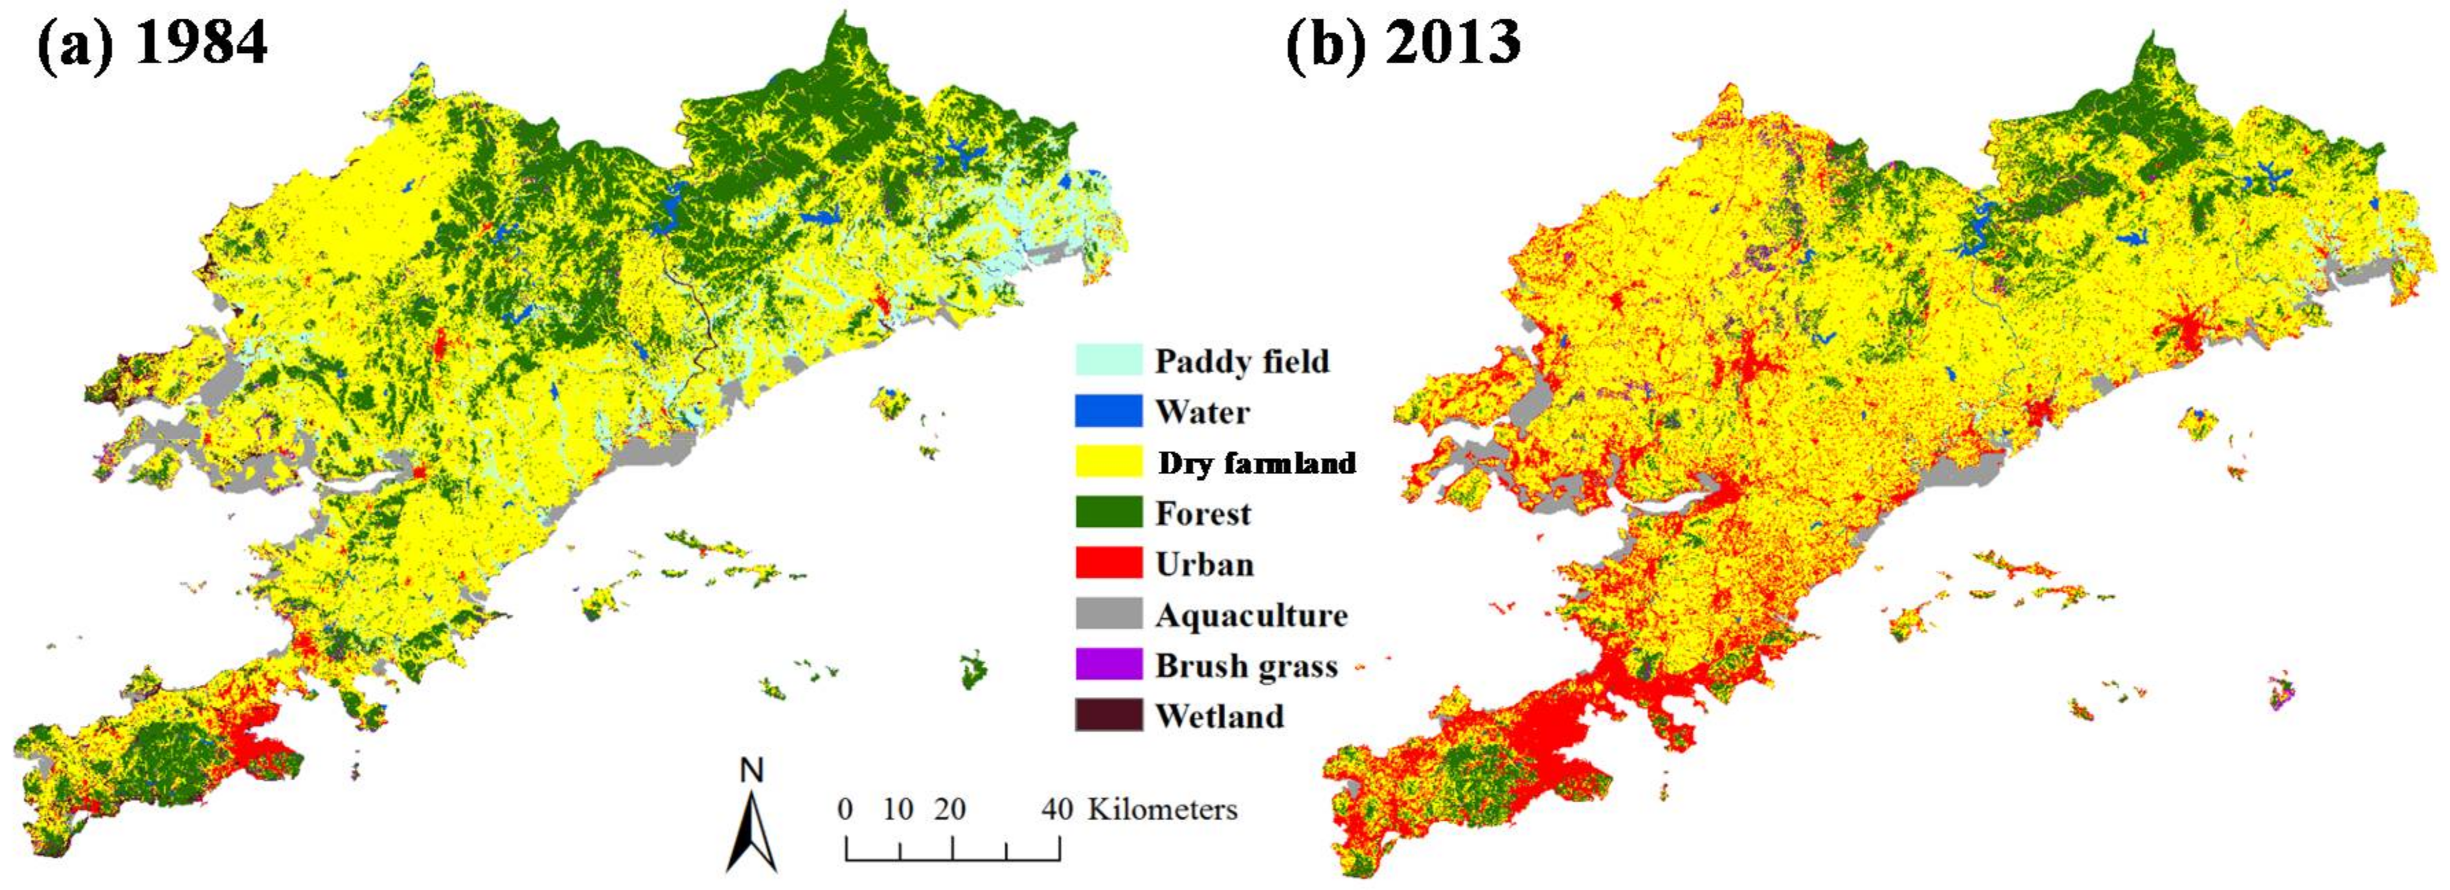
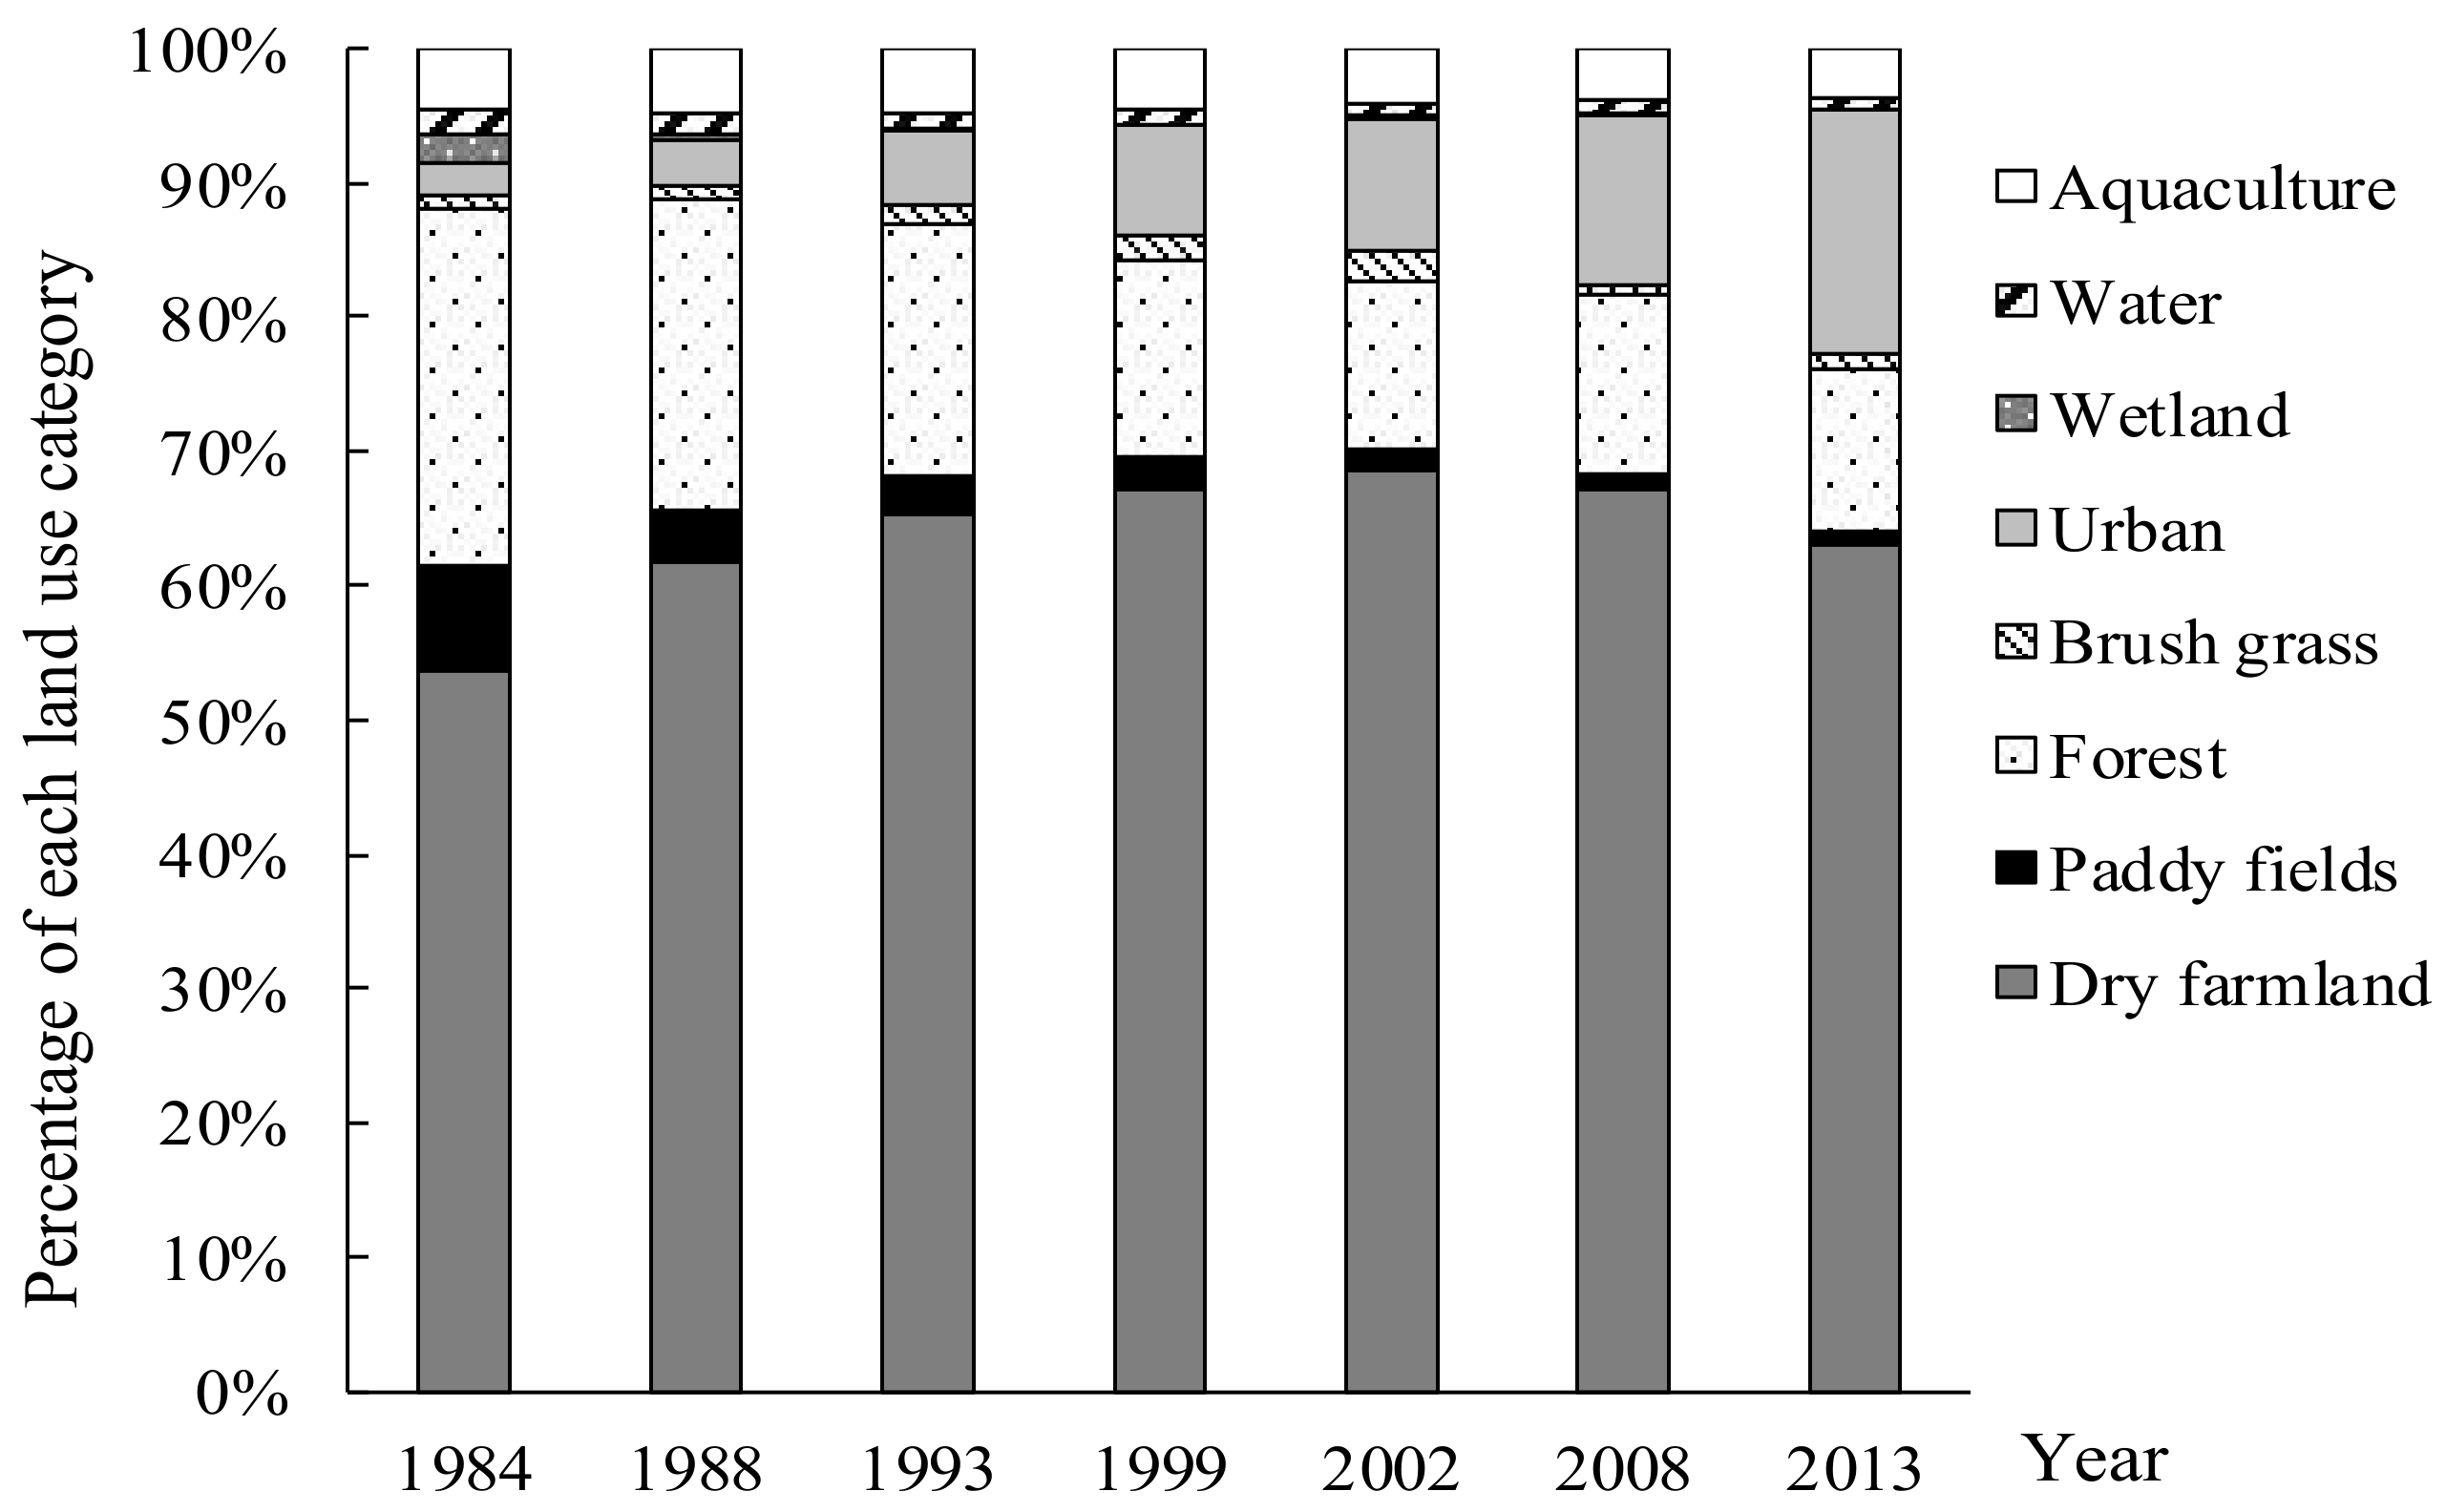
4.1. Land Use Change Characterization
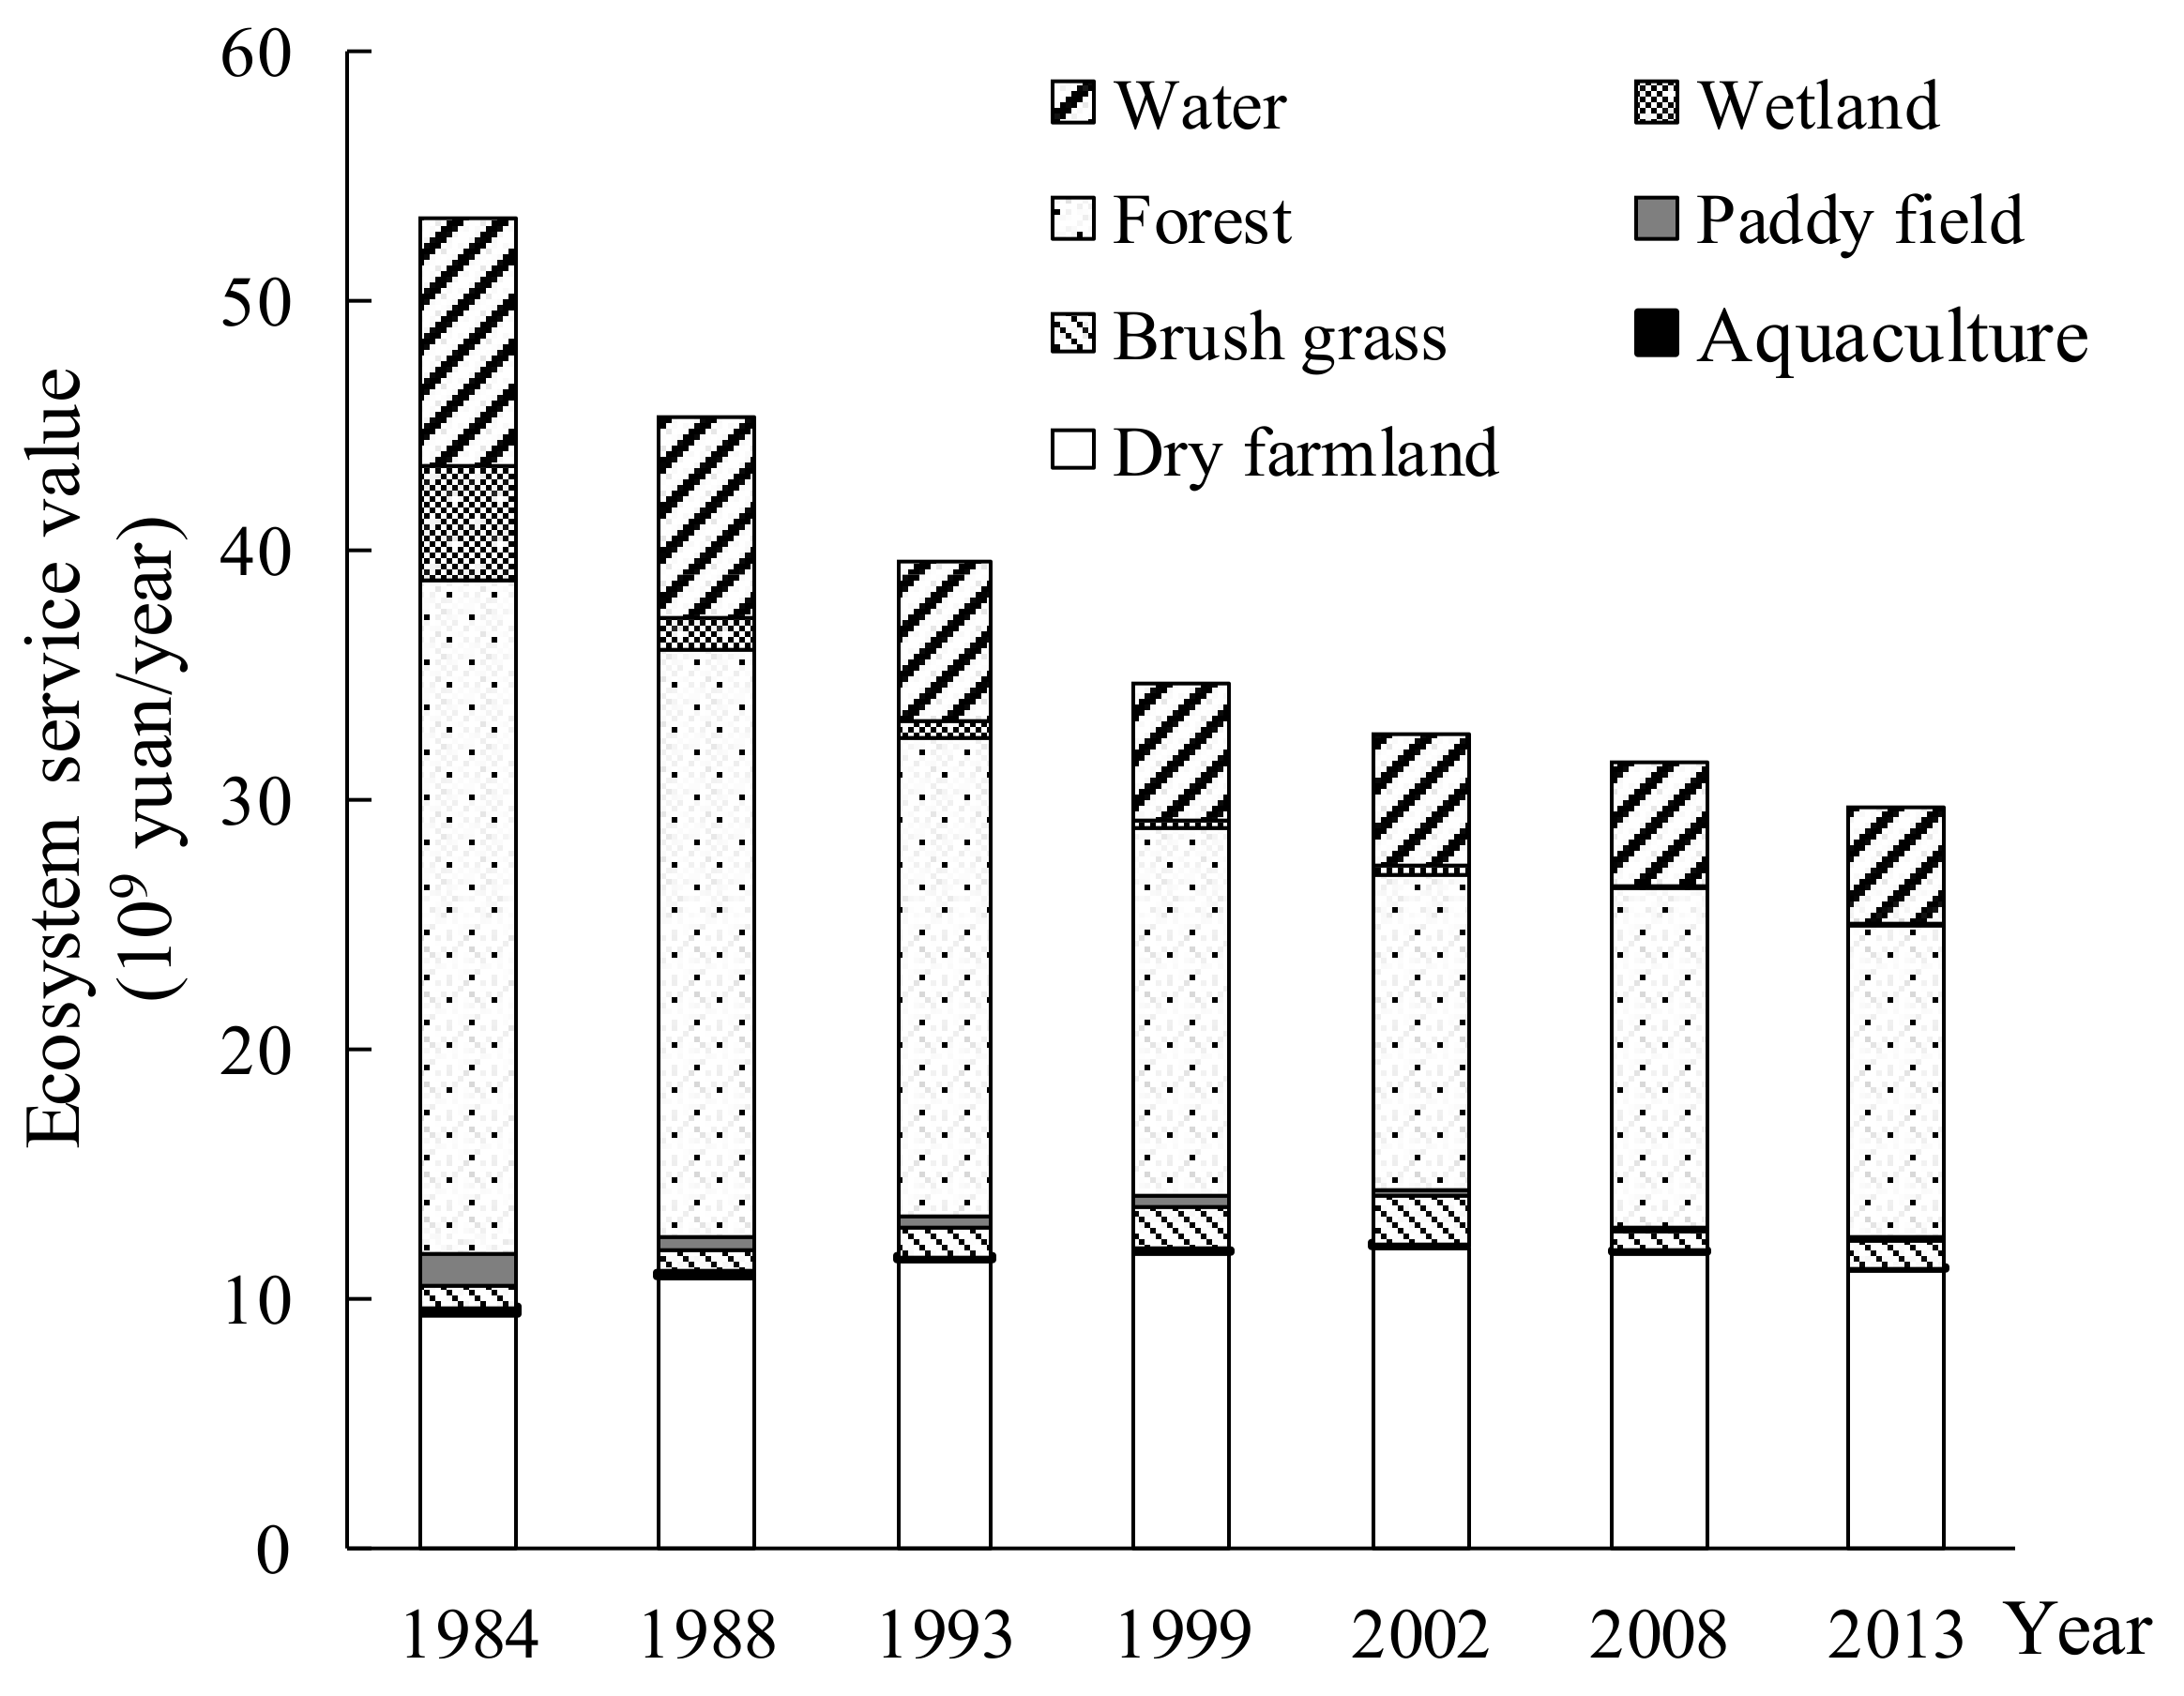
4.2. Ecosystem Service Values of Different Land Uses
4.3. Ecosystem Service Values of Different Functions
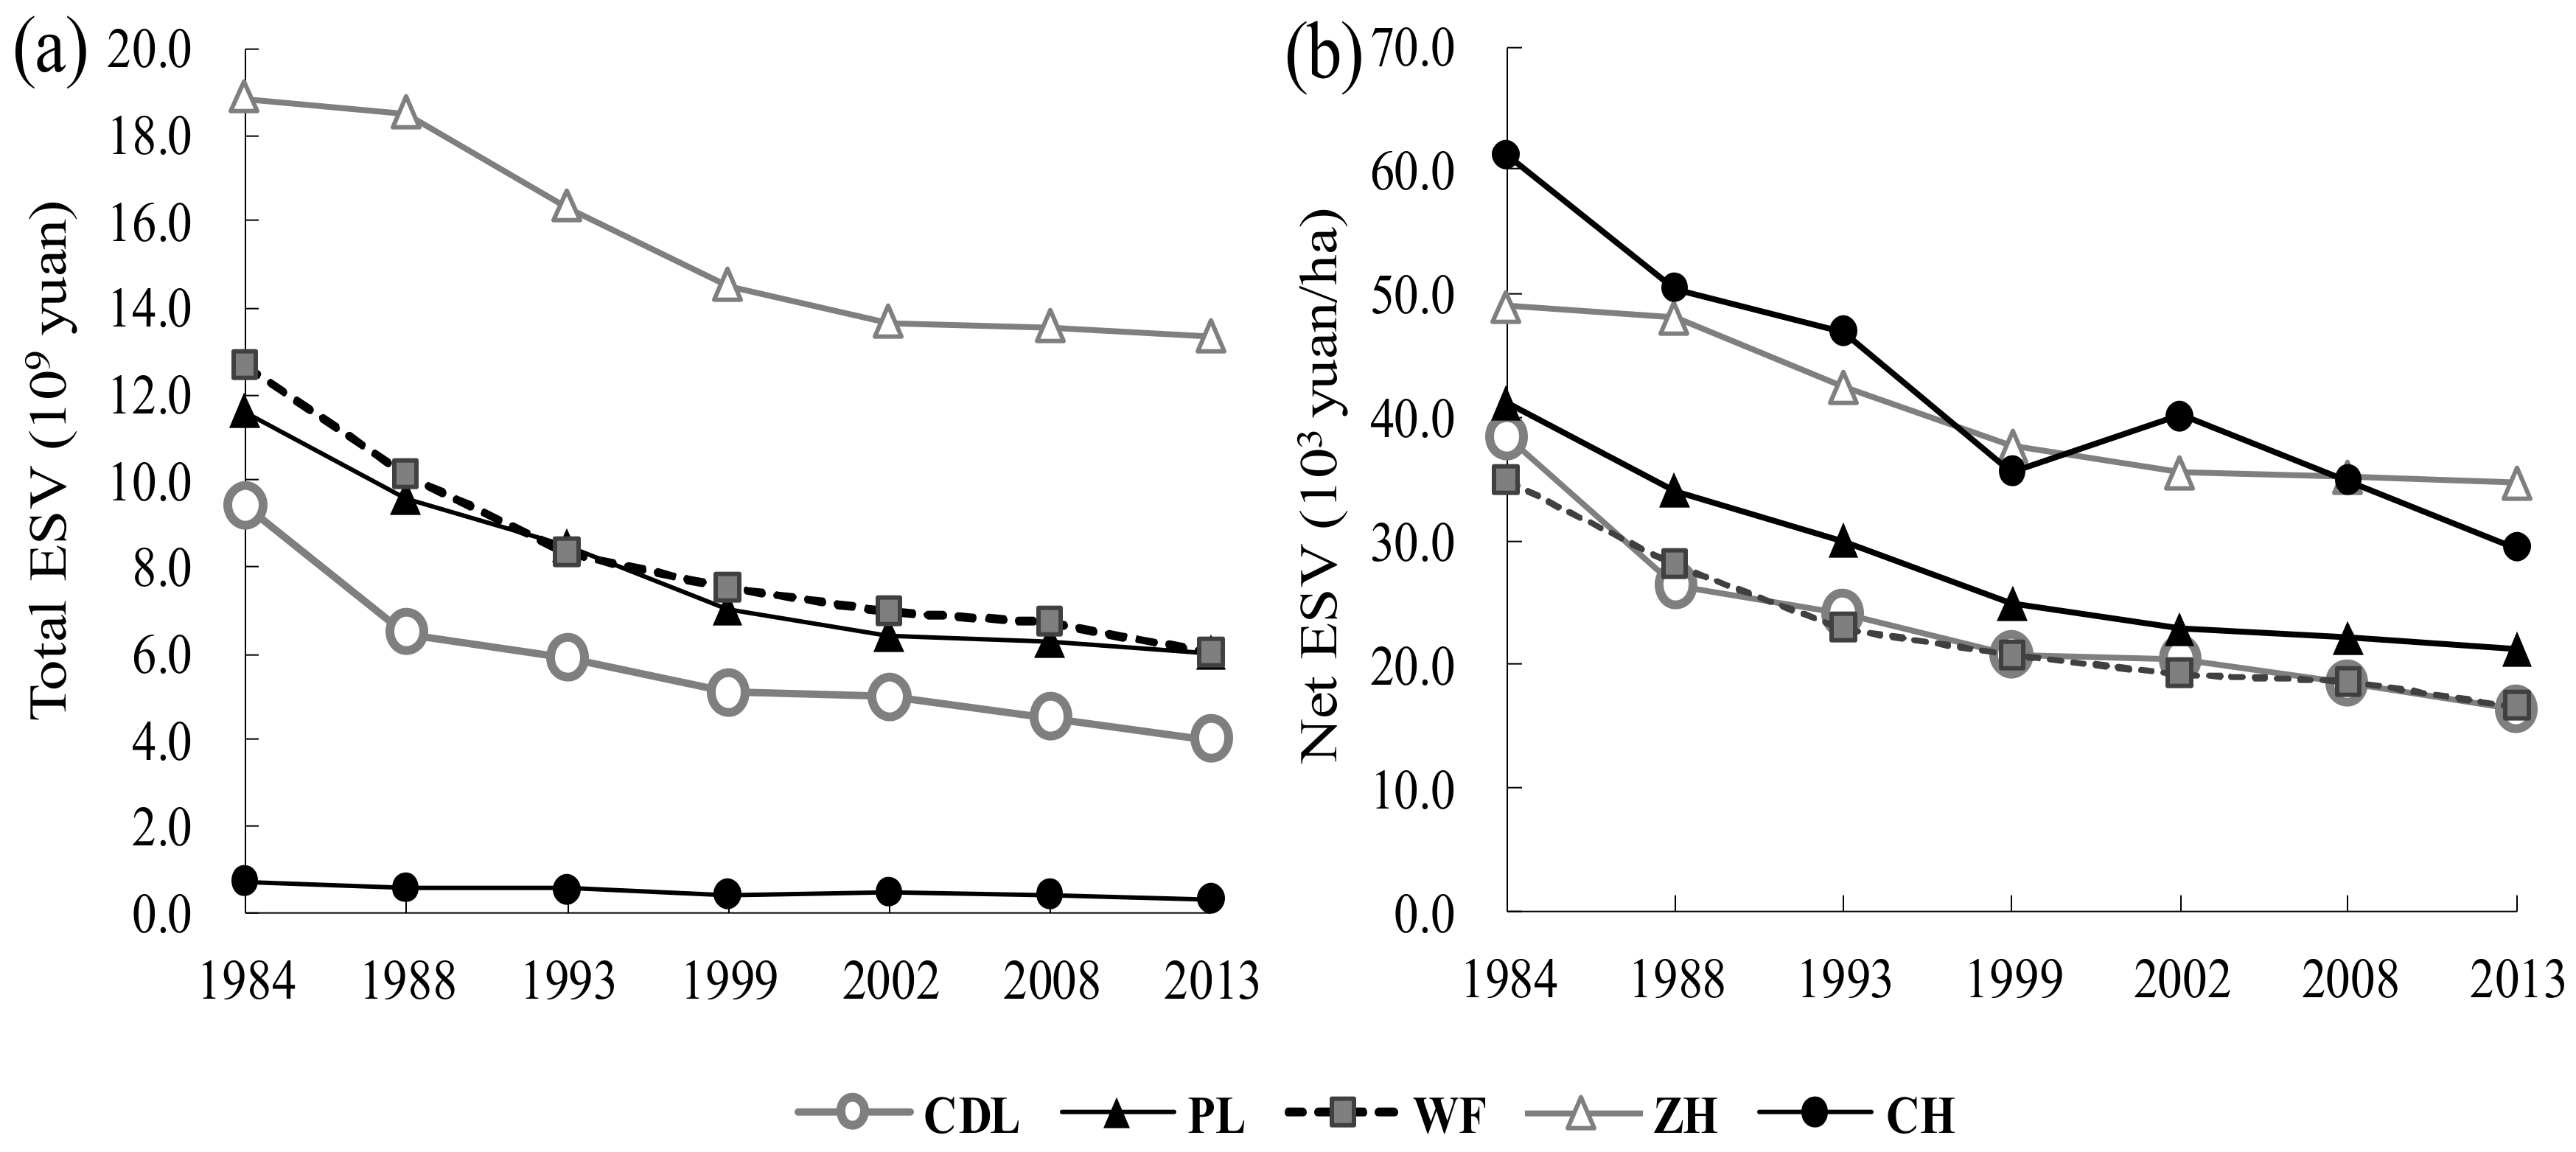
4.4. Spatial Variations of the ESV
4.5. Implications of ESV on Urban Planning
4.6. Methodological Limitations
5. Conclusions
Acknowledgments
Author Contributions
Conflicts of Interest
References
- Costanza, R.; D’Arge, R.; de Groot, R.; Farber, S.; Grasso, M.; Hannon, B.; Limburg, K.; Naeem, S.; O’Neill, R.V.; Paruelo, J.; et al. The value of the world’s ecosystem services and natural capital. Nature 1997, 387, 253–260. [Google Scholar] [CrossRef]
- Costanza, R.; D’Arge, R.; de Groot, R.; Farber, S.; Grasso, M.; Hannon, B.; Limburg, K.; Naeem, S.; O’Neill, R.V.; Paruelo, J.; et al. The value of ecosystem services: Putting the issues in perspective. Ecol. Econ. 1998, 25, 67–72. [Google Scholar] [CrossRef]
- Braat, L.C.; de Groot, R. The ecosystem services agenda: Bridging the worlds of natural science and economics, conservation and development, and public and private policy. Ecosyst. Serv. 2012, 1, 4–15. [Google Scholar] [CrossRef]
- Costanza, R.; Kubiszewski, I. The authorship structure of “ecosystem services” as a transdisciplinary field of scholarship. Ecosyst. Serv. 2012, 1, 16–25. [Google Scholar] [CrossRef]
- Costanza, R.; de Groot, R.; Sutton, P.; van der Ploeg, S.; Anderson, S.J.; Kubiszewski, I.; Farber, S.; Turner, R.K. Changes in the global value of ecosystem services. Glob. Environ. Chang. 2014, 26, 152–158. [Google Scholar] [CrossRef]
- Ouyang, Z.; Zheng, H.; Xiao, Y.; Polasky, S.; Liu, J.; Xu, W.; Wang, Q.; Zhang, L.; Rao, E.; Jiang, L.; et al. Improvements in ecosystem services from investments in natural capital. Science 2016, 352, 1455–1459. [Google Scholar] [CrossRef] [PubMed]
- Egoh, B.; Reyers, B.; Rouget, M.; Richardson, D.M.; Le Maitre, D.C.; van Jaarsveld, A.S. Mapping ecosystem services for planning and management. Agric. Ecosyst. Environ. 2008, 127, 135–140. [Google Scholar] [CrossRef]
- Núñez, D.; Nahuelhual, L.; Oyarzún, C. Forests and water: The value of native temperate forests in supplying water for human consumption. Ecol. Econ. 2006, 58, 606–616. [Google Scholar] [CrossRef]
- Woodward, R.T.; Wui, Y.-S. The economic value of wetland services: A meta-analysis. Ecol. Econ. 2001, 37, 257–270. [Google Scholar] [CrossRef]
- Zorrilla-Miras, P.; Palomo, I.; Gómez-Baggethun, E.; Martín-López, B.; Lomas, P.L.; Montes, C. Effects of land-use change on wetland ecosystem services: A case study in the Doñana marshes (SW Spain). Landsc. Urban Plan. 2014, 122, 160–174. [Google Scholar] [CrossRef]
- Schirpke, U.; Leitinger, G.; Tasser, E.; Schermer, M.; Steinbacher, M.; Tappeiner, U. Multiple ecosystem services of a changing Alpine landscape: Past, present and future. Int. J. Biodivers. Sci. Ecosyst. Serv. Manag. 2012, 9, 123–135. [Google Scholar] [CrossRef]
- Estoque, R.C.; Murayama, Y. Landscape pattern and ecosystem service value changes: Implications for environmental sustainability planning for the rapidly urbanizing summer capital of the Philippines. Landsc. Urban Plan. 2013, 116, 60–72. [Google Scholar] [CrossRef]
- Kreuter, U.P.; Harris, H.G.; Matlock, M.D.; Lacey, R.E. Change in ecosystem service values in the San Antonio area, Texas. Ecol. Econ. 2001, 39, 333–346. [Google Scholar] [CrossRef]
- Yoshida, A.; Chanhda, H.; Ye, Y.-M.; Liang, Y.-R. Ecosystem service values and land use change in the opium poppy cultivation region in Northern Part of Lao PDR. Acta. Ecol. Sin. 2010, 30, 56–61. [Google Scholar] [CrossRef]
- Kareiva, P.; Marvier, M. Conserving Biodiversity Coldspots. Am. Sci. 2003, 91, 344–351. [Google Scholar] [CrossRef]
- Robertson, G.P.; Swinton, S.M. Reconciling agricultural productivity and environmental integrity: A grand challenge for agriculture. Front. Ecol. Environ. 2005, 3, 38–46. [Google Scholar] [CrossRef]
- Xie, G.; Lu, C.; Leng, Y.; Zheng, D.; Li, S. Ecological assets valuation of the Tibetan Plateau. J. Nat. Resour. 2003, 18, 189–196. (In Chinese) [Google Scholar]
- Xie, G.; Zhang, C.; Zhang, L.; Chen, W.; Li, S. Improvement of the Evaluation Method for Ecosystem Service Value Based on Per Unit Area. J. Nat. Resour. 2015, 30, 1243–1254. (In Chinese) [Google Scholar]
- Bai, X.; Chen, H. The changes of ecosystem services and their values in various constructions of land use—A case study from Yijinhuoluo County of Inner Mogolia. Chin. J. Eco-Agric. 2004, 12, 180–182. (In Chinese) [Google Scholar]
- Li, J.; Wang, W.; Hu, G.; Wei, Z. Changes in ecosystem service values in Zoige Plateau, China. Agric. Ecosyst. Environ. 2010, 139, 766–770. [Google Scholar] [CrossRef]
- Li, T.; Li, W.; Qian, Z. Variations in ecosystem service value in response to land use changes in Shenzhen. Ecol. Econ. 2010, 69, 1427–1435. [Google Scholar]
- Mo, H.; Ren, Z.; Xie, H. Relation between Land use/cover change and changes of ecological effect in wind drift sand region. J. Shanxi Norm. Univ. 2005, 33, 110–114. (In Chinese) [Google Scholar]
- Roebeling, C.P.; Costa, L.; Magalhães Filho, L.; Tekken, V. Ecosystem service value losses from coastal erosion in Europe: Historical trends and future projections. J. Coast. Conserv. 2013, 17, 389–395. [Google Scholar] [CrossRef]
- Palomo, I.; Martín-López, B.; Zorrilla-Miras, P.; García del Amo, D.; Montes, C. Deliberative mapping of ecosystem services within and around Doñana National Park (SW Spain) in relation to land use change. Reg. Environ. Chang. 2014, 14, 237–251. [Google Scholar] [CrossRef]
- Dalian Water Affairs Bureau. Water Conservation Modernization Report of Dalian City, 2012; Dalian Water Affairs Bureau: Dalian, China, 2012. (In Chinese)
- Urban Development Planning Group. Urban Development Planning of Dalian City (2003 to 2020); Urban Development Planning Group: Dalian, China, 2006. (In Chinese) [Google Scholar]
- Environmental Systems Research Institute (ESRI). ArcGIS Desktop: Release 10.2; Environmental Systems Research Institute: Redlands, CA, USA, 2013. [Google Scholar]
- Long, H.; Liu, Y.; Hou, X.; Li, T.; Li, Y. Effects of land use transitions due to rapid urbanization on ecosystem services: Implications for urban planning in the new developing area of China. Habitat Int. 2014, 44, 536–544. [Google Scholar] [CrossRef]
- Wang, W.; Guo, H.; Chuai, X.; Dai, C.; Lai, L.; Zhang, M. The impact of land use change on the temporospatial variations of ecosystems services value in China and an optimized land use solution. Environ. Sci. Policy 2014, 44, 62–72. [Google Scholar] [CrossRef]
- Zhang, P.; He, L.; Fan, X.; Huo, P.; Liu, Y.; Zhang, T.; Pan, Y.; Yu, Z. Ecosystem service value assessment and contribution factor analysis of land use change in Miyun County, China. Sustainable 2015, 7, 7333–7356. [Google Scholar] [CrossRef]
- Zhang, Z.; Gao, J.; Gao, Y. The influences of land use changes on the value of ecosystem services in Chaohu Lake Basin, China. Environ. Earth Sci. 2015, 74, 385–395. [Google Scholar] [CrossRef]
- Zhao, B.; Kreuter, U.; Li, B.; Ma, Z.; Chen, J.; Nakagoshi, N. An ecosystem service value assessment of land-use change on Chongming Island, China. Land Use Policy 2004, 21, 139–148. [Google Scholar] [CrossRef]
- Clerici, N.; Paracchini, M.L.; Maes, J. Land-cover change dynamics and insights into ecosystem services in European stream riparian zones. Ecohydrol. Hydrobiol. 2014, 14, 107–120. [Google Scholar] [CrossRef]
- Nelson, E.; Mendoza, G.; Regetz, J.; Polasky, S.; Tallis, H.; Cameron, D.R.; Chan, K.M.A.; Daily, G.C.; Goldstein, J.; Kareiva, P.M.; et al. Modeling multiple eco-system services, biodiversity conservation, commodity production, and tradeoffs at landscape scales. Front. Ecol. Environ. 2009, 7, 4–11. [Google Scholar] [CrossRef]
- Xie, G.; Zhen, L.; Lu, C.; Xiao, Y.; Chen, C. Expert knowledge based valuation method of ecosystem services in China. J. Nat. Resour. 2008, 23, 911–919. (In Chinese) [Google Scholar]
- Verburg, P.H.; Schot, P.P.; Dijst, M.J.; Veldkamp, A. Land use change modelling: Current practice and research priorities. GeoJournal 2004, 61, 309–324. [Google Scholar] [CrossRef]
- Veldkamp, A.; Verburg, P.H. Modelling land use change and environmental impact. J. Environ. Manag. 2004, 72, 1–3. [Google Scholar] [CrossRef] [PubMed]
- Parker, D.C.; Manson, S.M.; Janssen, M.A.; Hoffman, M.; Deadman, P. Multi-agent systems for the simulation of land-use and land-cover change: A review. Ann. Assoc. Am. Geogr. 2003, 93, 314–337. [Google Scholar] [CrossRef]
- Mattews, R.B.; Gilbert, N.; Roach, A.; Gotts, N. Agent-based land-use models: A review of applications. Landsc. Ecol. 2007, 22, 1447–1459. [Google Scholar] [CrossRef] [Green Version]
- Irwin, E.; Geoghegan, J. Theory, data, methods: Developing spatially-explicit economic models of land use change. Agric. Ecosyst. Environ. 2001, 85, 7–24. [Google Scholar] [CrossRef]
- Irwin, E. New Directions for Urban Economic Models of Land Use Change: Incorporating Spatial Dynamics and Heterogeneity. J. Reg. Sci. 2010, 50, 65–91. [Google Scholar] [CrossRef]
- Jansen, H.; Stoorvogel, J.J. Quantification of aggregation bias in regional agricultural land use models: Application to Guacimo County, Costa Rica. Agric. Syst. 1998, 58, 417–439. [Google Scholar] [CrossRef]
- Bakker, M.M.; Govers, G.; Kosmas, C.; Vanacker, V.; Oost, K.; Rounsevell, M. Soil erosion as driver of land-use change. Agric. Ecosyst. Environ. 2005, 105, 467–481. [Google Scholar] [CrossRef]
- Verburg, P.H.; Soepboer, W.; Limpiada, R.; Espaldon, M.V.O.; Sharifa, M. Land use change modelling at the regional scale: The CLUE-S model. Environ. Manag. 2002, 30, 391–405. [Google Scholar] [CrossRef] [PubMed]
- Almeida, C.M.D.; Batty, M.; Monteiro, A.M.V.; Câmara, G.; Soares-Filho, B.S.; Cerqueira, G.C.; Pennachin, C.L. Stochastic cellular automata modeling of urban land use dynamics: Empirical development and estimation. Comput. Environ. Urban Syst. 2003, 27, 481–509. [Google Scholar] [CrossRef]
- Clarke, K.C.; Hoppen, S. A self-modifying cellular automaton model of historical urbanization in the San Francisco Bay area. Environ. Plan. B Plan. Des. 1997, 24, 247–261. [Google Scholar] [CrossRef]
- Chaudhuri, C.; Clarke, K.C. The SLEUTH land use change model: A review. Int. J. Environ. Resour. Res. 2013, 1, 88–104. [Google Scholar]
- Clarke, K.C. A Decade of Cellular Urban Modeling with SLEUTH: Unresolved Issues and Problems, Chapter 3 in Planning Support Systems for Cities and Regions; Brail, R.K., Ed.; Lincoln Institute of Land Policy: Cambridge, MA, USA, 2008; pp. 47–60. [Google Scholar]
- Clarke, K.C.; Gaydos, L.J. Loose-coupling a cellular automaton model and GIS: Long-term urban growth prediction for San Francisco and Washington/Baltimore. Int. J. Geogr. Inf. Sci. 1998, 12, 699–714. [Google Scholar] [CrossRef] [PubMed]


| Ecosystem Services (103 yuan/ha/year) | Land Use Category | ||||||
|---|---|---|---|---|---|---|---|
| Dry Farmland | Paddy Field | Forest | Grass | Wetland | Water | ||
| Supplying services | Food production | 2.90 | 4.63 | 1.06 | 1.29 | 1.74 | 2.73 |
| Raw material | 1.36 | 0.31 | 2.42 | 1.91 | 1.70 | 0.78 | |
| Water supply | 0.07 | −8.96 | 1.26 | 1.06 | 8.82 | 28.24 | |
| Regulating services | Gas regulation | 2.28 | 3.78 | 8.01 | 6.71 | 6.47 | 2.62 |
| Climate regulation | 1.23 | 1.94 | 23.95 | 17.75 | 12.26 | 7.80 | |
| Waste treatment | 0.34 | 0.58 | 6.78 | 5.86 | 12.26 | 18.91 | |
| Water regulation | 0.92 | 9.27 | 11.96 | 13.01 | 82.54 | 348.28 | |
| Supporting services | Soil formation and retention | 3.51 | 0.03 | 9.74 | 8.18 | 7.87 | 3.17 |
| Nutrients cycling | 0.41 | 0.65 | 0.75 | 0.61 | 0.61 | 0.24 | |
| Biodiversity protection | 0.44 | 0.72 | 8.86 | 7.43 | 26.81 | 8.69 | |
| Cultural services | Recreation and culture | 0.20 | 0.31 | 3.88 | 3.27 | 16.11 | 6.44 |
| Ecosystem Service Function | 1984 | 1999 | 2013 | 1984–2013 Change | |||
|---|---|---|---|---|---|---|---|
| ESVf | % | ESVf | % | ESVf | % | % | |
| Food production | 3.1 | 5.8 | 3.1 | 8.9 | 2.7 | 9.3 | −11.6 |
| Raw material | 1.9 | 3.5 | 1.7 | 4.9 | 1.5 | 5.2 | −18.8 |
| Water supply | 0.5 | 0.9 | 0.4 | 1.3 | 0.5 | 1.7 | +2.5 |
| Gas regulation | 5.0 | 9.4 | 3.8 | 11.1 | 3.3 | 11.1 | −34.2 |
| Climate regulation | 10.0 | 18.7 | 6.2 | 17.9 | 5.2 | 17.4 | −48.1 |
| Environmental purification | 3.4 | 6.5 | 2.0 | 5.8 | 1.7 | 5.6 | −51.7 |
| Water regulation | 16.0 | 30.1 | 8.2 | 23.6 | 6.8 | 22.9 | −57.5 |
| Soil formation and retention | 6.2 | 11.6 | 5.1 | 14.8 | 4.6 | 15.4 | −25.8 |
| Nutrients cycling | 0.6 | 1.2 | 0.5 | 1.5 | 0.5 | 1.6 | −25.8 |
| Biodiversity protection | 4.4 | 8.3 | 2.4 | 7.0 | 2.0 | 6.8 | −54.5 |
| Recreation and culture | 2.1 | 4.0 | 1.1 | 3.2 | 0.9 | 3.1 | −56.4 |
| None | Restricted | Prioritized | Optimized | |
|---|---|---|---|---|
| CDL | 49.6 | 18.2 | 8.7 | 23.4 |
| PL | 50.5 | 29.1 | 13.8 | 6.6 |
| WF | 46.4 | 24.3 | 11.3 | 18.0 |
| ZH | 74.0 | 8.1 | 13.3 | 4.7 |
| CH | 67.3 | 1.9 | 30.8 | 0.0 |
© 2018 by the authors. Licensee MDPI, Basel, Switzerland. This article is an open access article distributed under the terms and conditions of the Creative Commons Attribution (CC BY) license (http://creativecommons.org/licenses/by/4.0/).
Share and Cite
Xin, Z.; Li, C.; Liu, H.; Shang, H.; Ye, L.; Li, Y.; Zhang, C. Evaluation of Temporal and Spatial Ecosystem Services in Dalian, China: Implications for Urban Planning. Sustainability 2018, 10, 1247. https://0-doi-org.brum.beds.ac.uk/10.3390/su10041247
Xin Z, Li C, Liu H, Shang H, Ye L, Li Y, Zhang C. Evaluation of Temporal and Spatial Ecosystem Services in Dalian, China: Implications for Urban Planning. Sustainability. 2018; 10(4):1247. https://0-doi-org.brum.beds.ac.uk/10.3390/su10041247
Chicago/Turabian StyleXin, Zhuohang, Chao Li, Haixing Liu, Hua Shang, Lei Ye, Yu Li, and Chi Zhang. 2018. "Evaluation of Temporal and Spatial Ecosystem Services in Dalian, China: Implications for Urban Planning" Sustainability 10, no. 4: 1247. https://0-doi-org.brum.beds.ac.uk/10.3390/su10041247