Examining Vulnerability Factors to Natural Disasters with a Spatial Autoregressive Model: The Case of South Korea


1
School of Urban and Environmental Engineering, Ulsan National Institute of Science and Technology (UNIST), Ulsan 44919, Korea
2
Department of Urban Planning and Engineering, Yonsei University, Seoul 03722, Korea
*
Author to whom correspondence should be addressed.
Sustainability 2018, 10(5), 1651; https://0-doi-org.brum.beds.ac.uk/10.3390/su10051651
Submission received: 15 April 2018
/
Revised: 16 May 2018
/
Accepted: 18 May 2018
/
Published: 20 May 2018
(This article belongs to the Section Sustainable Urban and Rural Development)
Abstract
:Socially and economically marginalized people and environmentally vulnerable areas are disproportionately affected by natural hazards. Identifying populations and places vulnerable to disasters is important for disaster management, and crucial for mitigating their economic consequences. From the fields of geography, emergency management, and urban planning, several approaches and methodologies have been used to identify significant vulnerability factors affecting the incidence and impact of disasters. This study performs a regression analysis to examine several factors associated with disaster damage in 230 local communities in South Korea, using ten vulnerability indicators for social, economic, and environmental aspects, and a single indicator for disaster characteristics. A Lagrange Multiplier diagnostic test-based spatial autoregressive model (SAM) was applied to assess the potential spatial autocorrelation in the ordinary least squares (OLS) residuals. This study compared the OLS regression results with those of a spatial autoregressive model, for both presence of spatial autocorrelation, and model performance. The conclusion of this study is that Korean communities with a higher vulnerability to disasters, as a result of their socioeconomic and environmental characteristics, are more likely to experience economic losses from natural disasters.
1. Introduction
Despite similar magnitudes, the impact of natural disasters is unevenly distributed among communities with different social and physical aspects [1,2]. Economically low-income countries are more vulnerable to natural disasters [3]. According to the Centre for Research on the Epidemiology of Disasters (CRED), disaster victims in developing countries accounted for 69.9% of the world’s total damages from natural disasters [4].
The identification of vulnerable people and places is key to enabling local communities to assess their vulnerability to natural disasters, improve their emergency management, and mitigate losses when a natural disaster occurs [1,5,6]. In the fields of geography, urban planning, and emergency management, a vulnerability index has been developed by combining vulnerability indicators to identify areas having a high vulnerability to natural disasters [1,7,8]. Vulnerability factors related to people and communities have been examined, and their relationship with disaster damages identified, using traditional regression methods such as the ordinary least squares (OLS) regression model [1,9]. In addition to the OLS regression analysis, machine-learning approaches were applied to identify factors determining vulnerability to natural disasters, focusing on South Korea [2]. However, previous regression techniques tend to result in low model performance, and even misinterpretation, of the model results when there is a spatial autocorrelation in the model residuals [10,11]. The existence of spatial autocorrelation in the OLS regression model can be checked using the Global Moran’s I [12,13] statistic. If the index is spatially autocorrelated, a Local Indicators of Spatial Association (LISA) analysis can be used to identify significant clusters of regions with similar characteristics of vulnerability and damage [12,13]. Recent disaster-related studies showed that spatial autoregressive models (SAM) can deal with spatial autocorrelation in the model residuals [14,15]. The SAM results have shown an improved model fit with respect to the OLS regression model, in terms of Akaike information criterion (AIC), log-likelihood, and Schwarz criterion (SC) value [16,17].
The objective of this study is to identify several significant factors associated with damages resulting from a natural disaster in South Korea. An OLS regression is performed to examine the relationship between economic losses from a natural disaster, and vulnerability indicators representing social, economic, and environmental features in South Korea in 230 local communities. As vulnerability indicators are collected using spatial data, this study performs a Global Moran’s I test to examine whether there is a spatial autocorrelation in the model residuals. The test results suggest the presence of spatial autocorrelation; therefore, a Lagrange Multiplier (LM) diagnostic test was performed to identify the appropriate SAM, choosing between a spatial error model (SEM) and spatial lag model (SLM) [16]. The results of the SAM are then compared with those of the OLS regression analysis. This study outlines some important implications for vulnerability studies and policy makers who are responsible for disaster management in local communities.
2. Literature Review
Previous studies in the fields of geography, emergency management, and urban planning have defined vulnerability in several ways; one definition is the probability that damage would be incurred, in terms of both human lives and property [18]. Vulnerability has also been defined as a measure of the potential loss from a hazard [7,19], an inherent predisposition to be exposed to disaster damage [20], the extent of a community’s inability to manage stress from the outside and from shocks [21,22], and a weakened adaptive capability [23]. Vulnerability has been understood as exposure and susceptibility to disasters, and the community’s ability to prepare for and recover from a disaster [24,25].
The level of vulnerability is determined by the social and physical characteristics of a community [1,2,26]. Demographic patterns and economic status are factors related to social vulnerability [7,26], and geographic and intrinsically vulnerable traits lead physical vulnerability to vary across different geographic regions [26,27]. Regions with a large portion of children, elderly, less educated, and ethnic minorities tend to be more vulnerable to natural disasters, because they seem to have less physical and mental capacity to cope with them [7,26]. Economic conditions also affect the level of vulnerability. Low-income people tend to be more vulnerable to natural disasters, due to limited access to the resources needed to recover from disaster losses [26]. The poor may have difficulties in placing their dwellings in safe areas, leading them to live in hazard-prone areas [26]. Regarding the physical environment, building characteristics can also be a determinant of vulnerability to natural disasters, especially earthquakes [26]. Construction materials, building size, and building age are the main factors determining building vulnerability [1,26]. Geographical characteristics, including forests, open spaces, buffer zones, and slopes, are also determinants of vulnerability to natural disaster [26,28].
Among the various vulnerability studies to natural disasters worldwide, this study summarized social (demographic and economic aspect) and physical (natural and build environment aspect) vulnerability indicators from representative studies in the United States, South Korea, China, India, Nigeria, and Germany in Table 1 [2,29,30,31,32,33,34,35,36].
Demographic and economic characteristics of communities effectively represent social vulnerability in each country [1,2]. From previous studies, demographic indicators can be categorized into Age, Minority, Gender, Population, Education, and Household [2,29,30,31,32,33,34,35,36]. The ratio of elderly and younger people are representatives of Age; foreigners and ethnic minorities represent Minority; the sex ratio indicates Gender; the number of dwellings, migration, population density, and growth rate are related to Population; education level, illiteracy rate, and awareness and perception of hazards are connected to Education; and household types (rental, female-only, underground, apartment), living space, and household size comprise Household. Economic aspects are classified as Income, Social capital, and Business [2,29,30,31,32,33,34,35,36]. The indicators poverty, unemployment rate, household income, household assets, GDP, income of rural households, savings, and distribution of wealth comprise Income; Public assistance, property tax, investments, medical services, budget, subsidies, and resources for disaster prevention, relief, and assistance represent Social capital. Finally, business types (manufacturing, agriculture, small business) and job types (farmer, fishermen) are used as indicators of Business.
Regarding physical aspects, the natural and built environments are used to demonstrate the vulnerability of communities [1,2]. From the vulnerability literature, the natural environment can be largely summarized as Geological characteristic, Meteorological characteristic, and Buffer area [2,29,30,31,32,33,34,35,36]. Mean slope, stream length, low-lying areas, proximity to higher ground, and distance to a river are components of the Geological characteristic. Precipitation, past experiences, intensity and frequency of natural hazards, and depth of flood waters represent the Meteorological characteristic; and open space, ecosystem, degradation of the environment, soil erosion, rate of protected and organic farm areas, filter and buffer capacity, and water retaining capacity are associated with Buffer area. The last aspect, built environment, can be divided into Land use, Building characteristic, Infrastructure, and Urbanization [2,29,30,31,32,33,34,35,36]. The ratio of urban and recreational use, industry density, residential area, and dominating type of land use are related to Land use. Building age, number of old buildings, reinforcement concrete building, number of building floors, improper building construction, and building types are indicators of the Building characteristic. Roads, bridges, dams, schools, railways, ports, emergency facilities (police, fire station, hospital, shelter), energy supplies (electricity, water), public transportation system, sanitation/waste discharge sites, and warning systems are components of Infrastructure; and impervious surfaces, urban population, and urbanization rate represent Urbanization. Based on previous worldwide vulnerability studies, this study selects 10 indicators to identify vulnerability characteristics in Korea, which are introduced in the next section.
3. Materials and Methods
3.1. Study Area
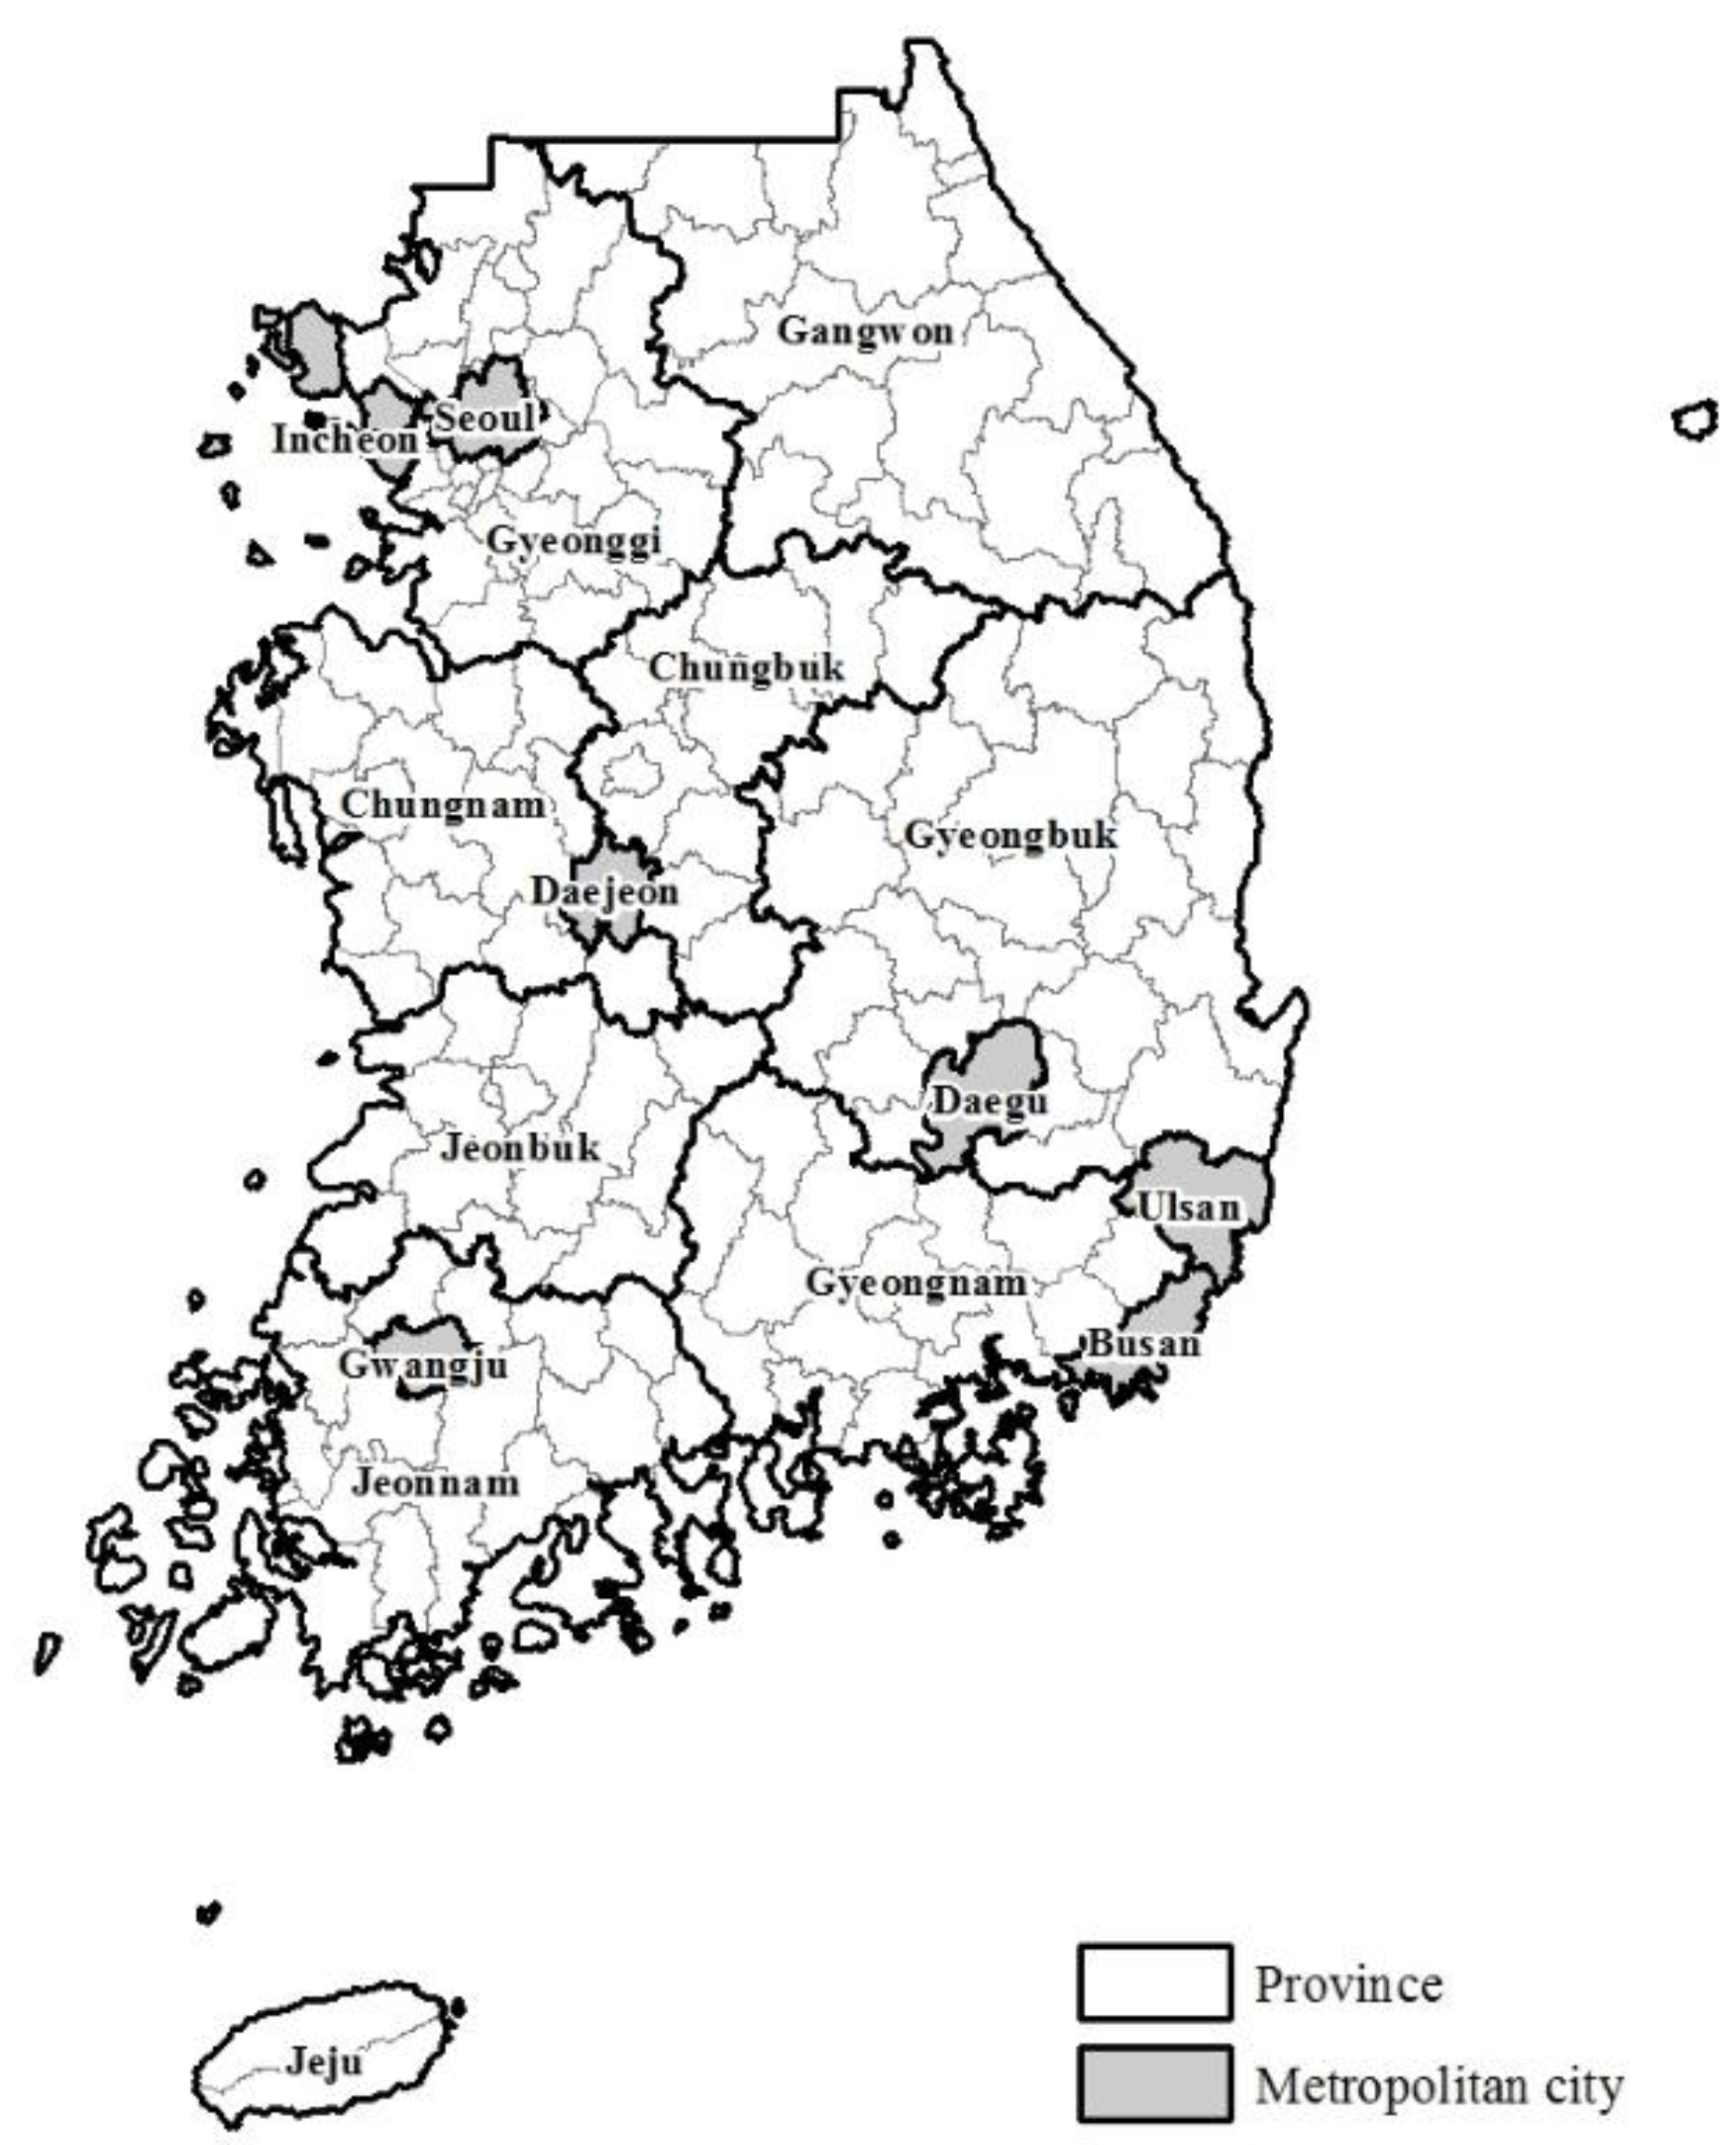
South Korea has a two-tier administrative structure comprising an upper and lower level. The upper-level administrative government agencies include a special city (Seoul), six metropolitan cities (Busan, Incheon, Daegu, Gwangju, Daejeon, and Ulsan), eight provinces (Gyeonggi, Gangwon, Chungbuk, Chungnam, Jeonbuk, Jeonnam, Gyeongbuk, and Gyeongnam), a self-governing special city (Sejong), and one self-governing special province (Jeju) (Figure 1). The lower-level administrative government agencies are composed of 230 local governments, including 75 cities (si), 69 districts (gu), and 86 counties (gun) as of 2010. The study area includes all 230 local governments (communities), covering the entire country.
3.2. Methods
As vulnerability assessments help planners prepare disaster plans [8] and improve and increase the effectiveness of emergency management [6,12,37], strong efforts have been made to identify areas that are highly vulnerability to natural disasters [1,5,7,8,12,24,38,39,40]. The Social Vulnerability Index (SoVI) was developed based on 11 factors, using a principal component analysis to identify socially vulnerable counties in the United States [7]. Zhou et al. applied the SoVI method to China to examine the change in county-level social vulnerability in 1980, 1990, 2000, and 2010 [12]. In Romania, Armas and Gavris examined earthquake vulnerability using the SoVI, as well as the spatial multi-criteria social vulnerability index (SEVI model) based on a weighting scheme [13]. Wood et al. employed the social vulnerability index proposed by Cutter et al. [7], and analyzed vulnerability (in terms of social aspects) to Cascadia-related tsunamis in the Pacific Northwest, United States [38]. Azar and Rain used a social vulnerability index for evacuation (SVEI model) based on the SoVI, to identify regions vulnerable to hydrological hazards [39]. Emrich and Cutter identified the spatial pattern of social vulnerability to drought, floods, sea-level rise, and winds from hurricanes, using the SoVI in the southern United States [5]. Myers et al. developed a regional index of social vulnerability based on the SoVI method in the Gulf Coast region, United States [40]. Yoon examined social vulnerability in the Gulf of Mexico, United States, based on the SoVI method, and compared SoVI-based vulnerability with composite social vulnerability based on standardization [1]. Along with introducing a vulnerability index, some studies also examined the Global Moran’s I to identify the existence of spatial clusters in the vulnerability index [12,13].
In addition to the vulnerability index, the identification of vulnerability factors to natural disasters is essential to effectively develop and implement mitigation strategies and disaster risk management [5,12]. In the field of geography, Uitto examined vulnerability factors in megacities with high exposures and susceptibility, focusing on social and geographical aspects [8]. The effect of wetlands on flooding was identified using an OLS regression, showing that federal permits allowing development in wetlands can increase flood losses in the United States [29]. Natural wetlands are known to play a critical role in the reduction of flood damage, controlling for biophysical and socio-economic factors [9]. In Tegucigalpa, Honduras, significant factors influencing social vulnerability were identified using an OLS regression [41]. Burton proposed an index representing social vulnerability, and identified the relationship between social vulnerability, hurricane characteristics (hurricane wind and storm surge inundation), and hurricane impact in the Gulf Coast, United States, using multiple linear regressions [42].
Although OLS regression is widely used in vulnerability studies, this method does not consider the existence of spatial autocorrelation in the residuals of the regression model. To control for spatial autocorrelation, Yoon included an adjacent property damage variable to assess the relationship between vulnerability factors and disaster damage [1]. A geographically weighted regression (GWR) was applied to find the spatially-varying relationship between water quality and land use, showing the decrease of spatial autocorrelation in the model residuals [11]. A spatial autoregressive model (SAM) has been used in disaster-related studies, including environmental justice, flood mitigation, and social vulnerability, to account for the spatial autocorrelation in the model residuals or independent variables [14,15,17,40]. Myers et al. identified the relationship between social vulnerability and migration measures using a spatial lag model (SLM) after two hurricanes—Katrina and Rita [40].
This study aims to identify the relationship between vulnerability factors related to social, economic, and environmental aspects, and economic losses from natural disaster. Disaster damage and vulnerability factors are introduced in the following two subsections. This study performed an OLS-based linear regression to examine vulnerability factors influencing the level of disaster damage. Based on the regression results, several assumptions of the OLS regression were checked to examine whether the model violates the assumptions of an OLS regression, such as the absence of multicollinearity among the variables, normality of the errors, and variance homoscedasticity [16,43,44]. The Global Moran’s I statistic was used to identify the existence of spatial autocorrelation in the OLS regression model, and a local indicators of spatial association (LISA) analysis was conducted to display significant clusters in the spatially distributed vulnerability index and disaster damage. This study used the SAM to reduce the level of spatial autocorrelation, using the open source program GeoDa (available at https://geodacenter.asu.edu/). An LM diagnostic test was performed to choose the best autoregressive model between the SLM and SEM. The SLM assumes that the dependent variable of a region is related to that of neighboring regions, whereas the SEM supposes that the residuals of a region are influenced by the residuals of neighbors [45]. This study made a comparison between the results of the OLS regression model and SAM, through the value of the log-likelihood, Schwarz criterion (SC), and Akaike information criterion (AIC). The SAM showed improvements over the OLS model, as the log-likelihood increased, and the value of AIC and SC decreased [16,17]. The procedure of examining factors determining vulnerability to a natural disaster with SAM is indicated in Figure 2.
3.3. Dependent Variable
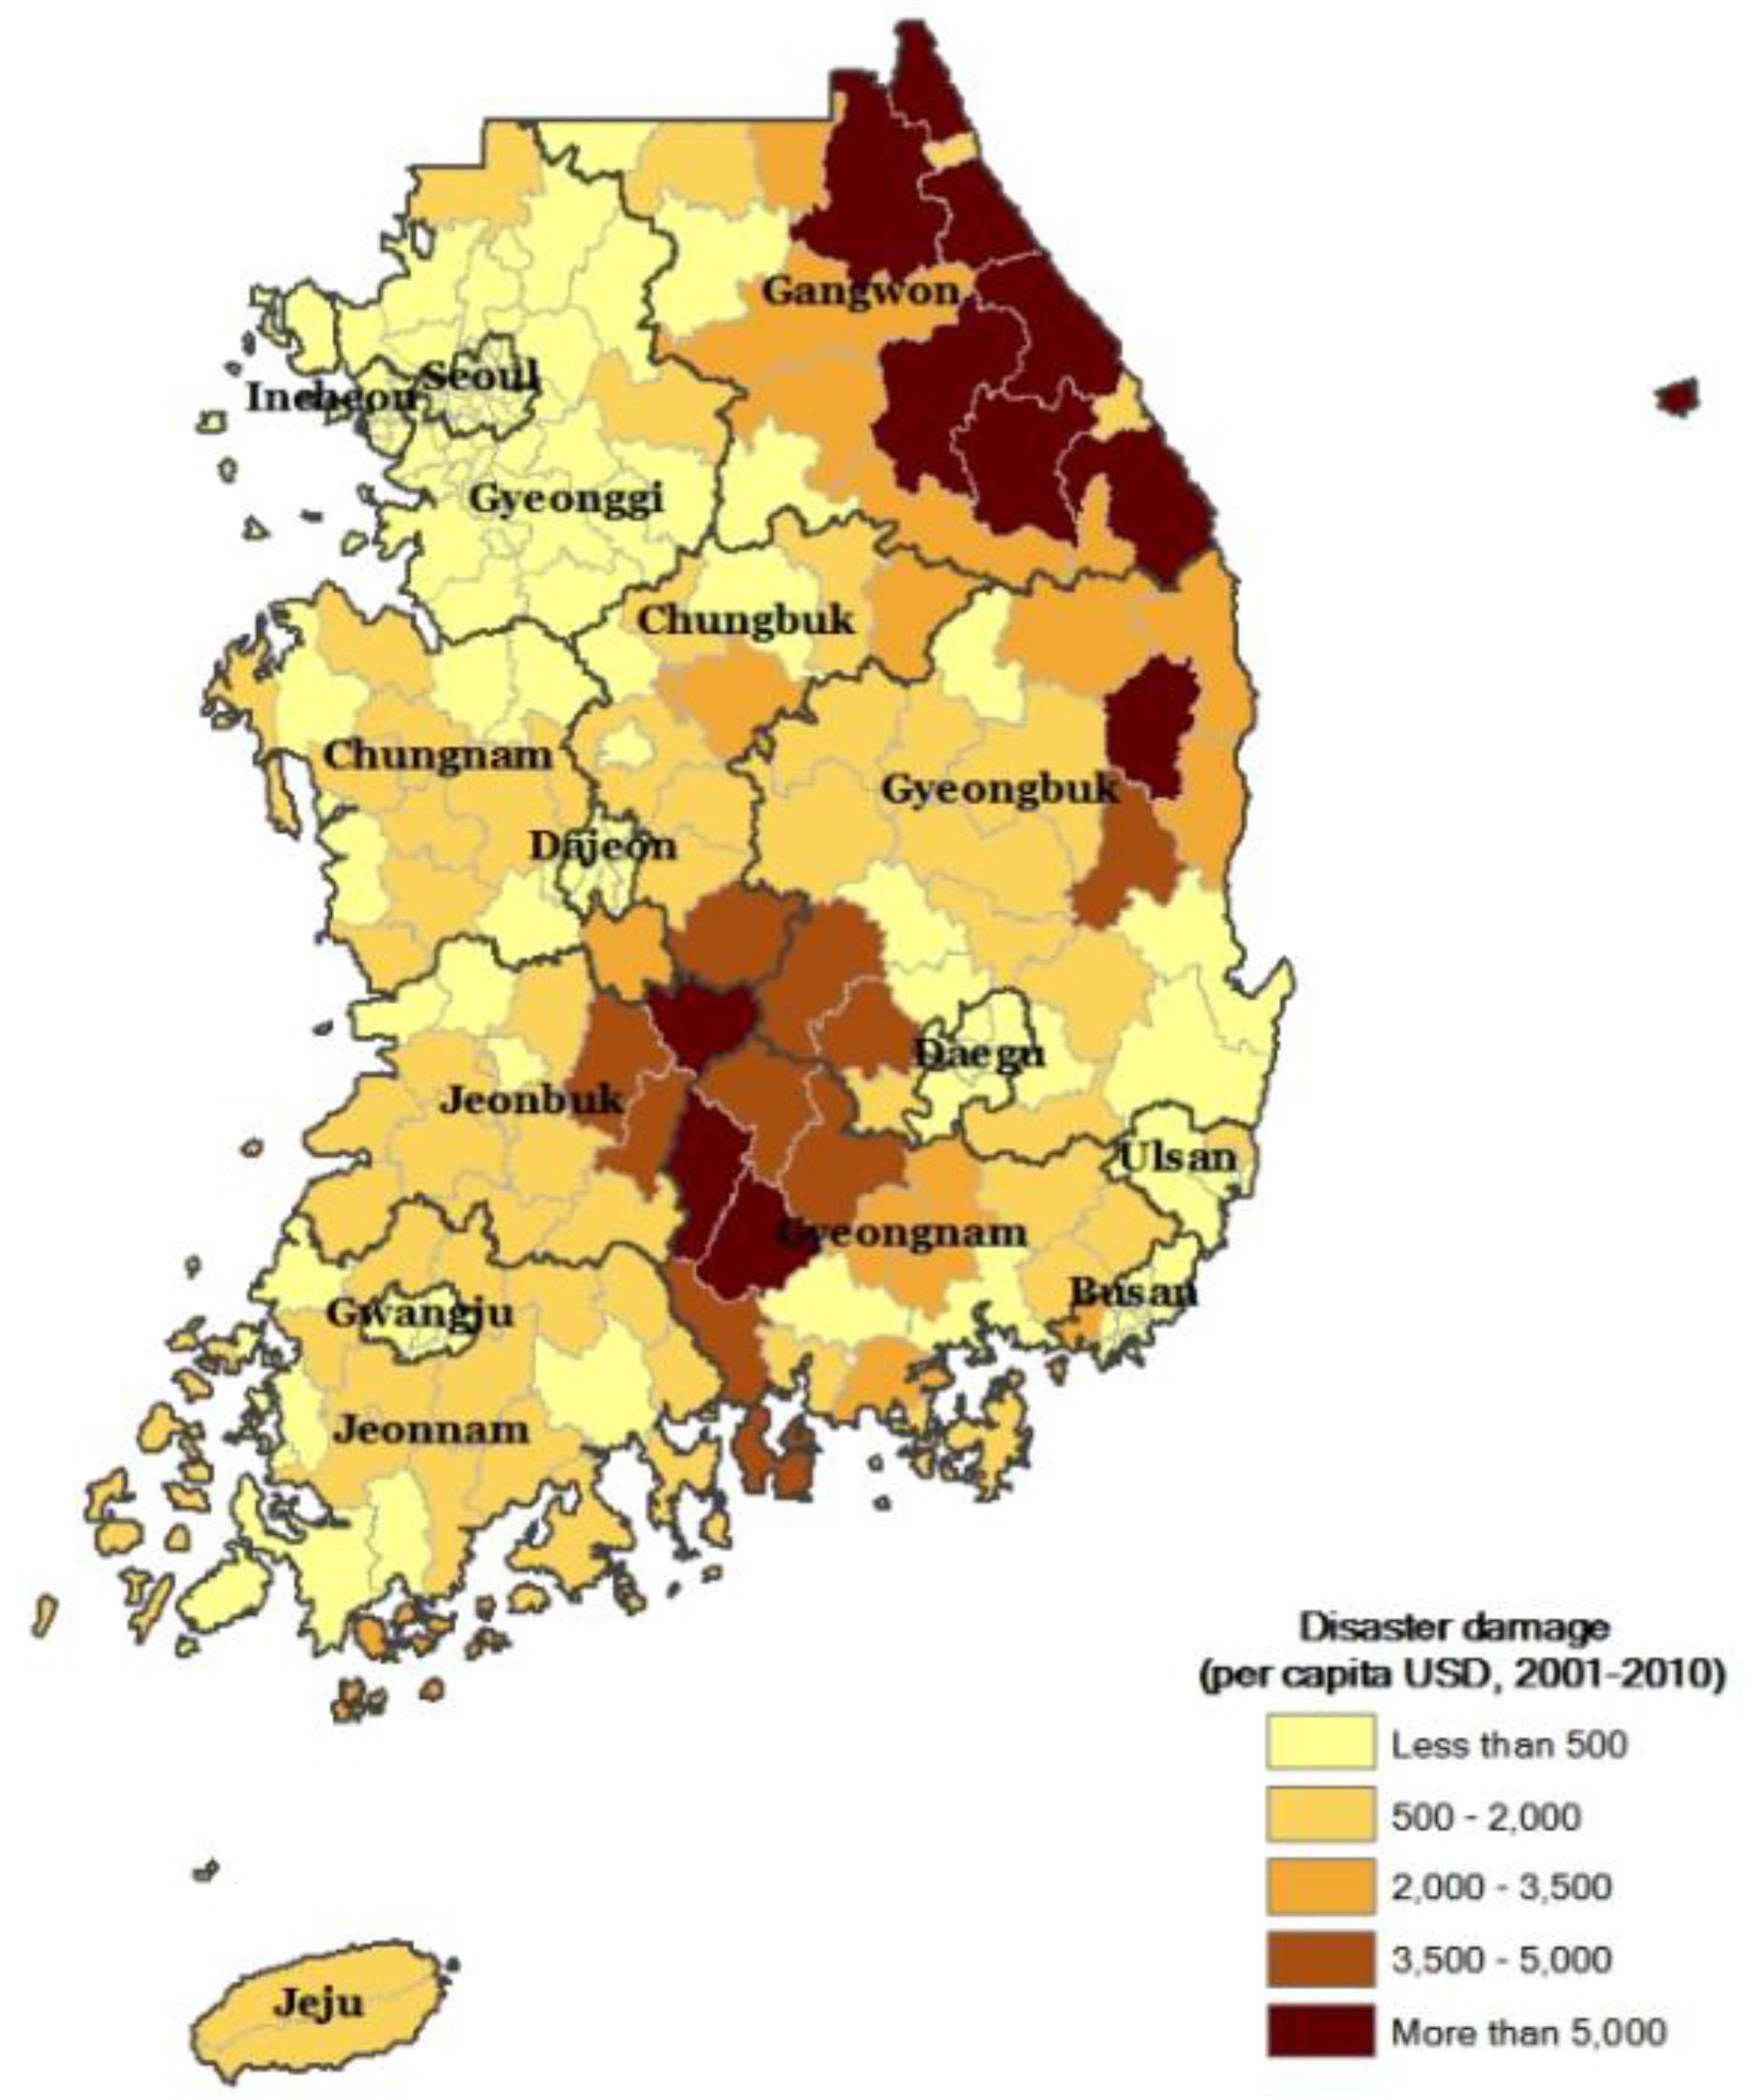
Frequently occurring natural disasters in South Korea include typhoons, heavy rains, heavy snow, and snowfall. The dependent variable for this study is the total normalized economic damage per capita from a natural disaster over 10 years (2001–2010) in 230 local communities. This study collected data on historical economic losses caused by a natural disaster from the National Disaster Information Center website (available at http://www.safekorea.go.kr), operated by the Ministry of the Interior and Safety in Korea. Economic damages from a natural disaster include losses from building, shipments, farmland, public facilities, and individual facilities.
Over the 10 years, the top five communities that suffered the most damage from natural disasters were in the Gangwon province, incurring over $12,000 USD per capita (Figure 3). In the same period, there was less disaster damage in Seoul special city, Gyeonggi province, and the metropolitan city of Incheon, where 24 million people (about half of the population of Korea, as of 2010) live (Figure 3). Damages were normalized for inflation rates (the inflation rate in 2010 was 1) and the population in each community. The dependent variable was log-transformed to obtain a normal distribution.
3.4. Independent Variables
This study selects 10 vulnerability indicators representing the social, economic, and environmental characteristics of each community, based on previous vulnerability studies [2,29,30,31,32,33,34,35,36] (Table 2). These indicators are standardized using z-score transformations to make all indicators equivalent units of measurement. More detailed descriptions of the selected vulnerability indicators, expected sign for disaster damage, and data sources are shown in Table 2.
This study selects two vulnerability indicators to estimate the social aspects of vulnerability. Less-educated people tend to be more vulnerable to natural disasters due to a lack of the knowledge necessary for responding to disasters, which limits their capacity to understand warning information and cope with, and recover from, natural disasters [1,2,5,6,7,12,13,34,35,36,46,47]. Education level is a significant factor in determining income levels, health problems, quality of life, and employment status [12,47]. The less-educated population was calculated as the percentage of the population without elementary school education. In addition to educational levels, this study identifies minorities, measured as the percentage of foreigners in Korea, as a vulnerable group. In the United States, minorities, especially non-white people, are considered vulnerable to natural disasters because they may have different languages and cultures, experience difficulties in receiving disaster recovery funds, and live in hazardous areas [1,5,7,30].
Two indicators, property tax and manufacturer establishments, are used to represent the economic aspects of community vulnerability [2,31]. These indicators are selected to represent a community’s economic vulnerability as proxies. Communities with higher poverty have more difficulties in storing emergency supplies, purchasing flood insurance, and recovering from disaster damage, which makes them more vulnerable to the impact of a disaster [30,48]. The amount of property tax per capita was used as the tax indicator, and the density of manufacturing establishments per square kilometer was used as the manufacturer indicator.
This study measures four natural environmental indicators related to the degree of disaster damage. The first, precipitation, is measured as the average precipitation from 2001 to 2010, as recorded by 419 stations in the Automatic Weather Station (AWS) operated by the Korea Meteorological Administration (KMA). A simple inverse distance weighting (IDW) method is used to interpolate precipitation, as measured by the 419 stations, to the 230 local communities. The second indicator is frequency, measured as the annual frequency of natural disasters (typhoons, heavy rain, heavy snow, and snowfall), provided by the Korean Ministry of the Interior and Safety (MOIS). Not only precipitation, but also the frequency of natural disasters, are significant natural environment aspects affecting the degree of disaster damage [2,29,34,48,49,50]. The third indicator was the extent of open space, meaning the green tract of land as a percentage of total land. A green tract of land is a space consisting of trees and other greens, which is called a buffer zone [2,28,36]. Providing a buffer zone helps reduce vulnerability to future consequences of climate impact [48], and prevents surface runoff [28]. The destruction of forest resources increases vulnerability and causes more runoff and flooding [26]. As for the geographic factor related to the level of vulnerability, this study selected the average slope in 230 communities. As a factor related to vulnerability, the location of a community is known to be a determinant of disaster damage [2,26,29,35].
Two vulnerability indicators are used to represent the built environments related to disaster damage. The first, old buildings, measured by the ratio of housing units built in 1959 or earlier, is an important vulnerability indicator related to disaster damage, as old building codes are outdated [1,2,28,33]. The second indicator is housing density, measured as the number of homes per square kilometer. Compact development based on dense housing can maximize open spaces, and is known to decrease vulnerability to natural hazards [51].
4. Results
This study checked the assumptions of the OLS linear regression. The existence of multicollinearity among independent variables was examined through the value of the multicollinearity condition. As a multicollinearity problem occurs when the multicollinearity condition number is over 30 [16], the OLS regression results showed no multicollinearity among vulnerability indicators (Table 3). Two assumptions, the normality of errors and variance homoscedasticity, were also checked using the Jarque-Bera test and Breusch-Pagan or Koenker-Bassett index, respectively, and showed the OLS linear regression model had no violations. The final test is conducted to check the existence of spatial autocorrelation in the regression residuals as one assumption of the OLS regression. As a frequently used indicator for the presence of spatial autocorrelation, the Global Moran’s I was applied to assess the spatial distribution of the model residuals in the 230 communities. The value of the Global Moran’s I was calculated using a contiguity-based approach to define the neighbors of a spatial unit. This study used the first-order “queen-based” contiguity approach, assuming that all adjacent regions are considered neighbors. After the consideration of the scope of such neighbors, this study identified the presence of spatial autocorrelation, showing that the Global Moran’s I in each model is 0.205, with a 99% statistical significance level (Table 3). This result indicated that the OLS results are likely to be biased because there is evidence of spatial autocorrelation.
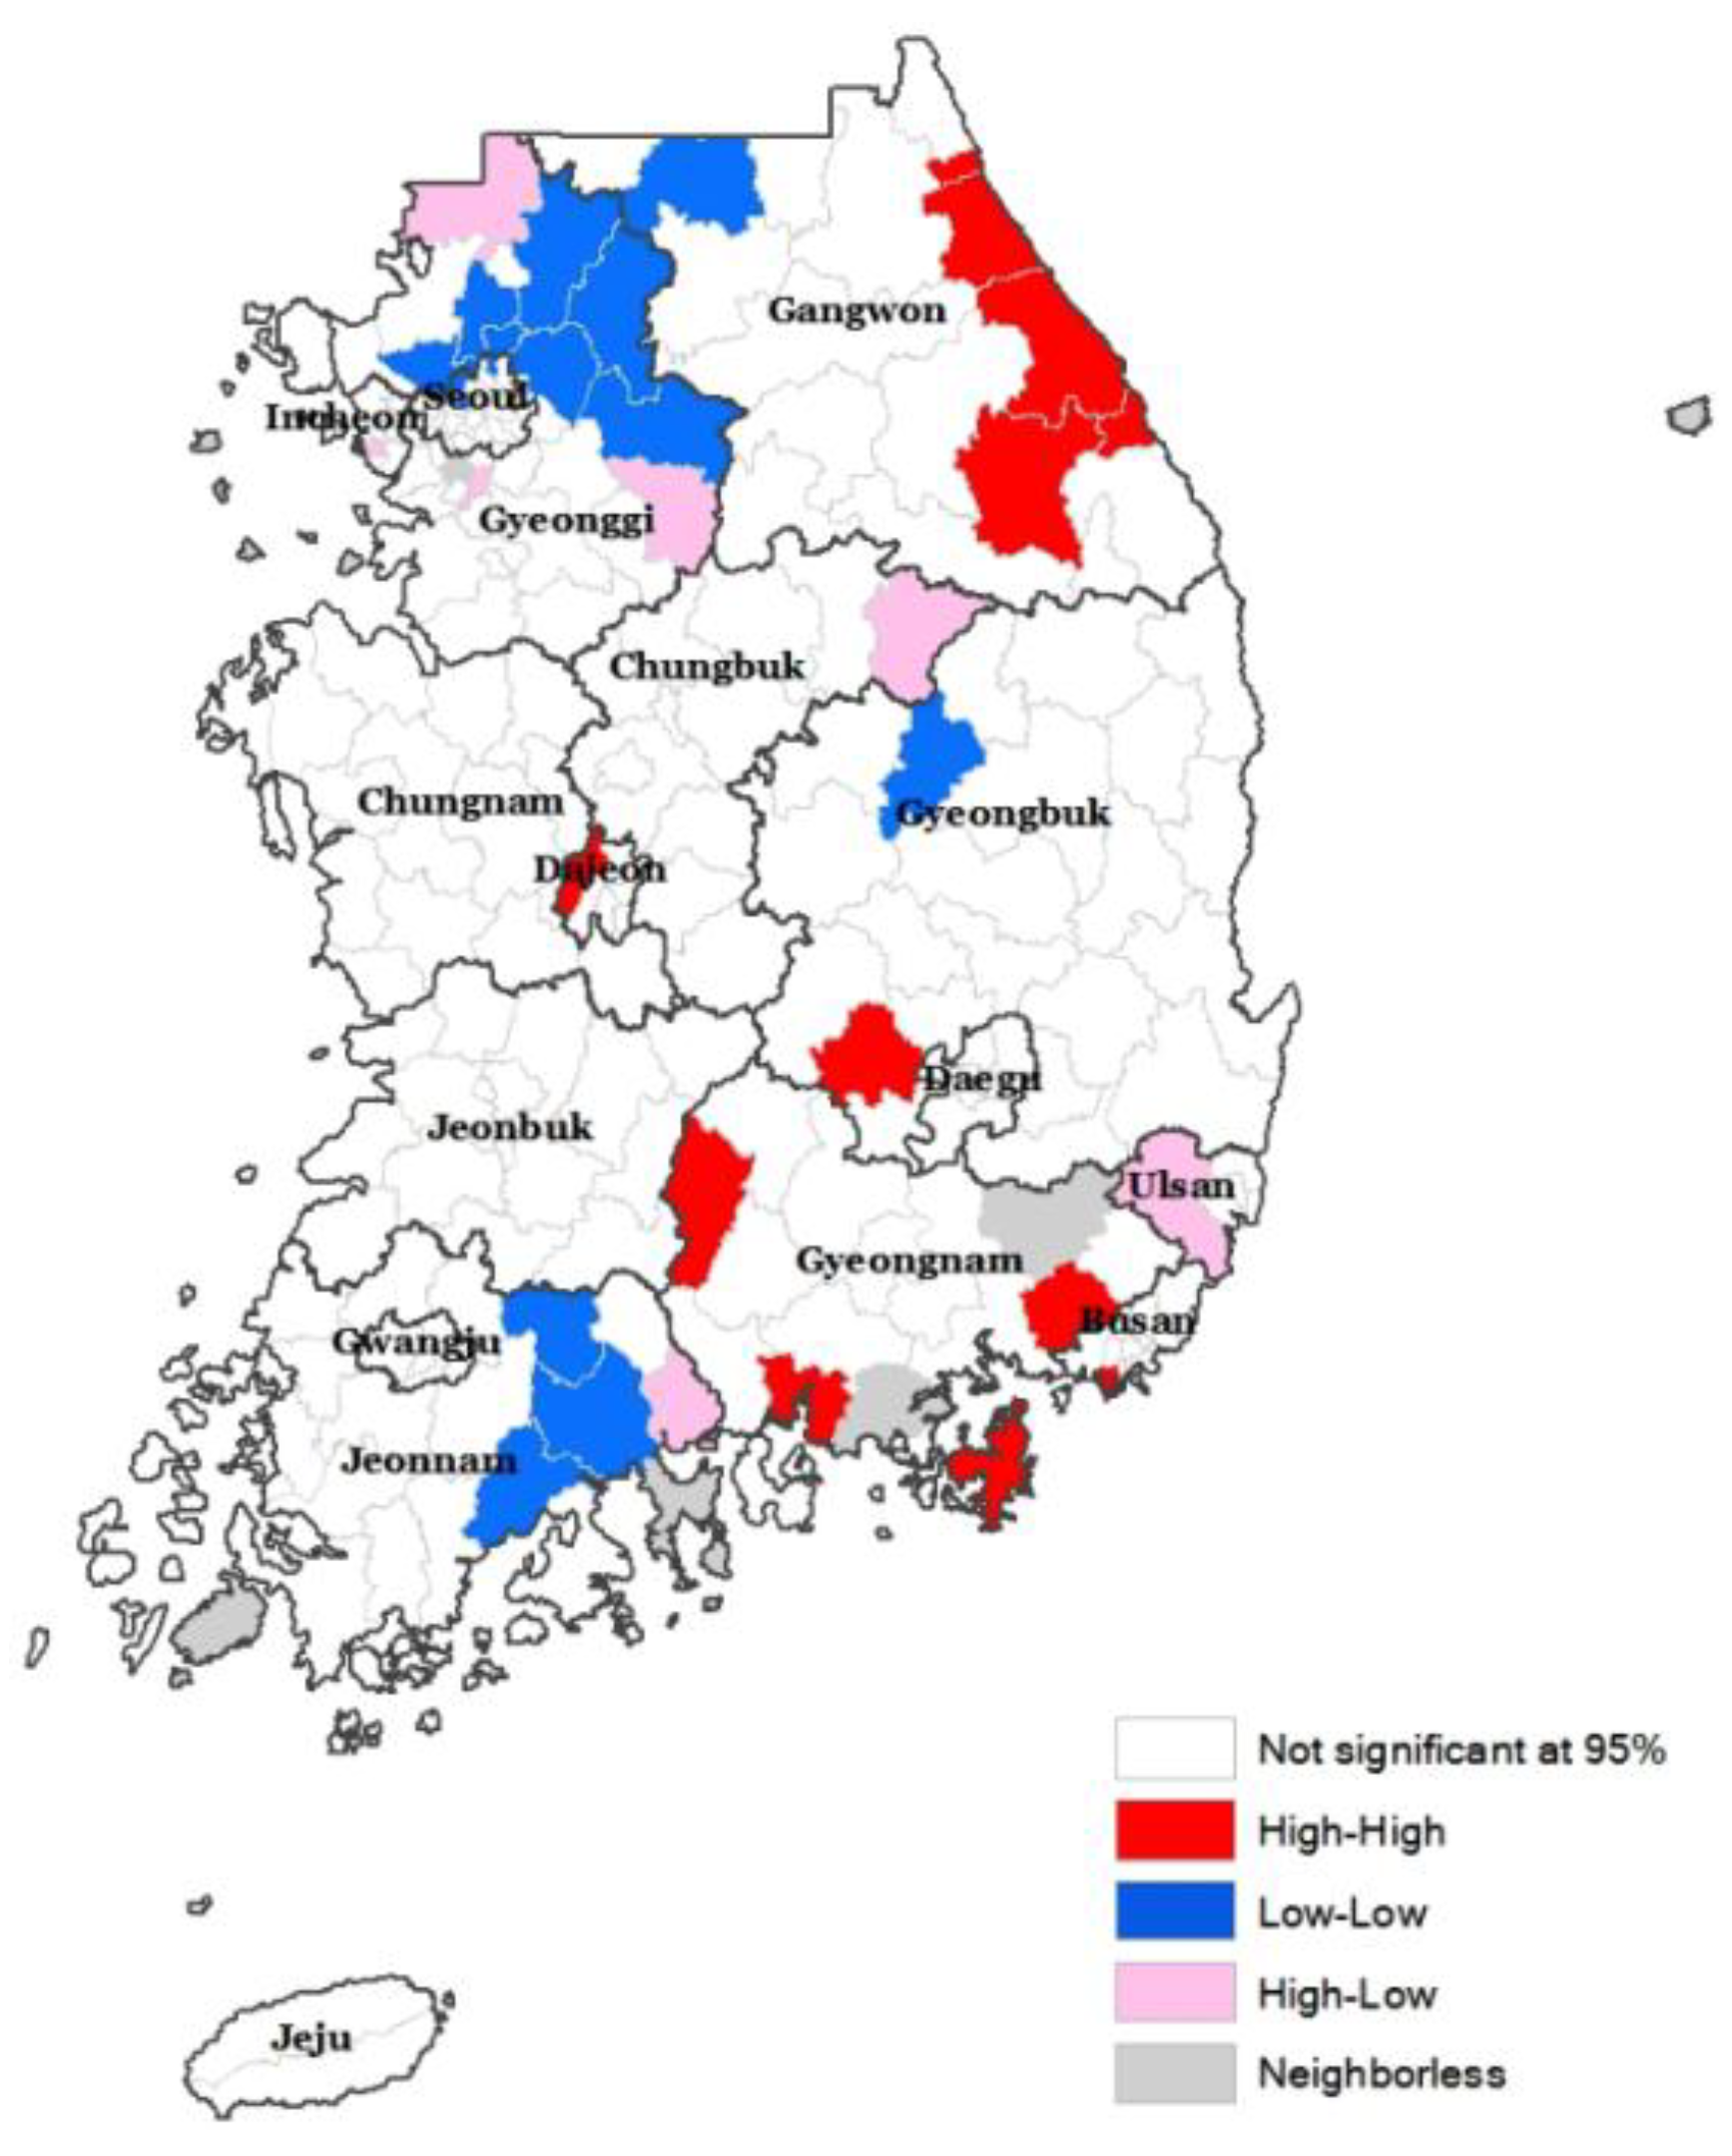
In addition to the Global Moran’s I test, this study conducted a LISA analysis to identify the degree of spatial autocorrelation in the model residuals in the 230 communities (Figure 4). The results showed that a spatial cluster exists, with some regions (shown in red in the figure) indicating a hot spot, and others (in dark blue) indicating cold spots for disaster damage.
This study employed a SAM to consider the spatial autocorrelation in the residuals of the OLS regression model. The LM diagnostic test was used to identify a suitable model, showing the best fit between the SEM and SLM. The test indicated that the standard versions of the LM-Lag and LM-Error are statistically significant, whereas only a robust version of the LM-Error is statistically significant (p < 0.01) (Table 3). Through the LM diagnostic test, the SEM was selected as the best model to account for the spatial autocorrelation in the OLS regression residuals. This study performed two different spatial error models, depending on the neighbor selection: queen-based and rook-based contiguity. The two models solved the problem of spatial autocorrelation, showing that the value of Moran’s I was statistically insignificant (p > 0.05) and close to zero, whereas the spatial error parameters were statistically significant (p < 0.01) (Table 3). The significant vulnerability indicators in the two spatial error models were the same as the OLS linear regression model, whereas the performance of spatial error models was improved. This study showed an increase in the log-likelihood, and decrease in the Akaike information criterion (AIC) and Schwarz criterion (SC), indicating a robust improvement with respect to the OLS linear regression (Table 3).
This study analyzed the relationship between 10 vulnerability indicators regarding social, economic, and environmental features and disaster damage using an OLS regression model and spatial error models (Table 3). The results from the OLS regression model showed that the coefficient on less-educated people is positively related to disaster damage. Minority is also associated with disaster damage, with a positive coefficient (B = 0.072, p < 0.05). Both social aspects are positively related to disaster damage, suggesting that socially vulnerable people are more likely to suffer from disaster damage than others. Economic aspects indicated results in line with previous studies [12,52], showing that poor communities are likely to experience more severe disaster damage. Although tax was not related to disaster damage (B = −0.001, p > 0.05), communities with many manufacturing establishments showed a negative correlation with the extent of disaster damage (B = −0.137, p < 0.01). Regarding the natural environment, precipitation was positively related to disaster damage (B = 0.098, p < 0.01), in line with previous results [49]. The frequency of natural disasters was also positively and significantly associated with the extent of disaster damage (B = 0.104, p < 0.01). The regression results showed that disaster damage is more severe in communities where annual precipitation is high and natural disasters happen frequently. As a buffer zone, open space played a significant role in diminishing disaster damage, showing a negative correlation with disaster damage in the OLS regression model (B = −0.201, p < 0.01). Communities located in steep slopes were more likely to experience damage from natural disasters (B = 0.325, p < 0.01). The findings on built environments showed that communities with a high ratio of buildings older than 60 years showed a positive relationship with disaster damage, but this coefficient was not statistically significant (B = 0.05, p > 0.05). Housing density, however, showed a statistically significant negative relationship with disaster damage (B = −0.254, p < 0.01), meaning that compact communities experience less disaster damage than sprawling communities.
In summary, the more communities there are with many less-educated people and minorities, high precipitation, fewer manufacturers, fewer open spaces, lower densities, and high slope, the more those regions are exposed to economic losses from a natural disaster.
5. Discussion and Conclusions
The aim of this study is to analyze the relationship between disaster damage and several vulnerability indicators related to social, economic, and environmental features to pinpoint the factors of uneven distribution of natural disaster impact among communities. The OLS regression model was employed to examine the effect of 10 vulnerability indicators on disaster damage. Several tests were performed to confirm the assumptions of the OLS regression model, and recognized the existence of spatial autocorrelation in the OLS residuals. The LISA analysis showed a space cluster in the model residuals, supporting the presence of spatial autocorrelation. Some regions (east of Gangwon province, parts of Gyeongnam province, and parts of Jeonbuk province) indicated a hot spot, whereas other areas (parts of Gyeonggi and Jeonnam provinces) showed cold spots for disaster damage (Figure 4). The regions located in the same cluster are spatially autocorrelated, having similar features in terms of economic losses. For the reduction of spatial autocorrelation and better model performance, the SAM was employed, and the SEM was identified as the most suitable model, based on an LM diagnostic test. The results of this study are in line with earlier studies in other fields [15,16,17], and confirm that the SAM can be used to identify statistically significant relationships among variables, using the spatially autocorrelated model residuals. Through a spatial error model, this study showed that vulnerable people (less-educated people, minorities) and places (high precipitation, fewer manufacturers, fewer open spaces, lower densities, and high slope) are more likely to experience disaster damage.
The findings of this study have value for policymakers who are developing vulnerability reduction policies for populations and places considered at risk. First, identifying unique vulnerability factors is important in predicting where disaster losses may occur, recognizing the relationship between vulnerability factors and disaster damage. Second, providing education to less-educated people and minorities is key for improving disaster awareness. More education helps vulnerable people access and act on hazard information, which helps them to prepare for, respond to, and recover from natural disasters [12,47]. Third, activities related to risk reduction are necessary to reduce the degree of vulnerability. Risk itself can be removed by understanding the types of hazards in a community, protecting the environment, and preventing development in hazardous areas. Protecting the environment could reduce disaster risk by enlarging the open spaces which function as buffer zones. If development is necessary, compact development in a safe area can be a way not only to preserve open spaces, but also accommodate residents in a safe area.
Some significant limitations of this study need to be considered. First, this study has a limitation stemming from its use of indicator-based approaches for the identification of vulnerability factors. There is room for debate on what kinds of indicators should be used [47], and for the study’s dependence on statistical analysis, such as the OLS linear regression [46]. Among the various types of candidate indicators, this study selected 10 vulnerability indicators, not only representing social, economic, and environmental aspects, but also satisfying the multicollinearity assumption. Second, this study is limited to finding the local parameters of vulnerability indicators, although both the OLS linear regression and SAM can examine global parameters of independent variables. Although this study found that socially vulnerable people are likely to incur disaster damage, this does not imply that minorities and those who are less educated in Korea are equally vulnerable to a natural disaster [46]. Further studies are needed to examine local vulnerability indicators for local-based disaster management. A GWR model could be an alternative tool for identifying locally vulnerable people and places associated with disaster damage.
Author Contributions
Both authors contributed to the idea of the paper. S.J. analyzed the data, interpreted the results, and drafted the article. D.K.Y. provided core advice and extensive revisions to the manuscript.
Funding
This research was funded by the Yonsei University Future-leading Research Initiative of 2017 [2017-22-0077].
Conflicts of Interest
The authors declare no conflict of interest.
References
- Yoon, D.K. Assessment of social vulnerability to natural disasters: A comparative study. Nat. Hazards. 2012, 63, 823–843. [Google Scholar] [CrossRef]
- Yoon, D.K.; Jeong, S. Assessment of Community Vulnerability to Natural Disasters in Korea by Using GIS and Machine Learning Techniques. In Quantitative Regional Economic and Environmental Analysis for Sustainability in Korea; Springer: Singapore, 2016; pp. 123–140. [Google Scholar]
- Toya, H.; Skidmore, M. Economic development and the impacts of natural disasters. Econ. Lett. 2007, 94, 20–25. [Google Scholar] [CrossRef]
- Guha-Sapir, D.; Hoyois, P.; Wallemacq, P.; Below, R. Annual Disaster Statistical Review 2015: The Numbers and Trends; Centre for Research on the Epidemiology of Disasters (CRED): Brussels, Belgium, 2015. [Google Scholar]
- Emrich, C.T.; Cutter, S.L. Social vulnerability to climate-sensitive hazards in the southern United States. Weather, Clim. Soc. 2011, 3, 193–208. [Google Scholar] [CrossRef]
- Gao, X.; Yuan, H.; Qi, W.; Liu, S. Assessing the social and economic vulnerability of urban areas to disasters: A case study in Beijing, China. Int. Rev. Spat. Plan. Sustain. Dev. 2014, 2, 42–62. [Google Scholar] [CrossRef]
- Cutter, S.L.; Boruff, B.J.; Shirley, W.L. Social vulnerability to environmental hazards. Soc. Sci. Q. 2003, 84, 242–261. [Google Scholar] [CrossRef]
- Uitto, J.I. The geography of disaster vulnerability in megacities: A theoretical framework. Appl. Geogr. 1998, 18, 7–16. [Google Scholar] [CrossRef]
- Brody, S.D.; Zahran, S.; Highfield, W.E.; Grover, H.; Vedlitz, A. Identifying the impact of the built environment on flood damage in Texas. Disasters 2008, 32, 1–18. [Google Scholar] [CrossRef] [PubMed]
- Hamilton, L.C. Regression with Graphics: A Second Course in Applied Statistics; Duxbury Press: Belmont, CA, USA, 1992. [Google Scholar]
- Tu, J.; Xia, Z.G. Examining spatially varying relationships between land use and water quality using geographically weighted regression I: Model design and evaluation. Sci. Total Environ. 2008, 407, 358–378. [Google Scholar] [CrossRef] [PubMed]
- Zhou, Y.; Li, N.; Wu, W.; Wu, J.; Shi, P. Local spatial and temporal factors influencing population and societal vulnerability to natural disasters. Risk Anal. 2014, 34, 614–639. [Google Scholar] [CrossRef] [PubMed]
- Armas, I.; Gavris, A. Social vulnerability assessment using spatial multi-criteria analysis (SEVI model) and the Social Vulnerability Index (SoVI model): A case study for Bucharest, Romania. Nat. Hazards Earth Syst. Sci. 2013, 13, 1481–1499. [Google Scholar] [CrossRef]
- Grineski, S.; Collins, T.W.; Chakraborty, J.; Montgomery, M. Hazardous air pollutants and flooding: A comparative interurban study of environmental injustice. GeoJournal 2014, 80, 145–158. [Google Scholar] [CrossRef]
- Highfield, W.E.; Brody, S.D.; Blessing, R. Measuring the impact of mitigation activities on flood loss reduction at the parcel level: The case of the clear creek watershed on the upper Texas coast. Nat. Hazards 2014, 74, 687–704. [Google Scholar] [CrossRef]
- Anselin, L. Exploring Spatial Data with GeoDa: A Work Book; University of Illinois: Champaign, IL, USA, 2005. [Google Scholar]
- Mitchell, B.C.; Chakraborty, J. Urban heat and climate justice: A landscape of thermal inequity in Pinellas county, Florida. Geogr. Rev. 2014, 104, 459–480. [Google Scholar] [CrossRef]
- Anderson, M.B. Disaster prevention for sustainable development: Economic and policy issues. In Vulnerability to Disaster and Sustainable Development: A General Framework for Assessing Vulnerability; World Bank: Washington, DC, USA, 1995; Chapter 3. [Google Scholar]
- Boulle, P.; Vrolijks, L.; Palm, E. Vulnerability reduction for sustainable urban development. J. Conting. Crisis Manag. 1997, 5, 179–188. [Google Scholar] [CrossRef]
- Cardona, O.D. Mapping vulnerability: Disasters, development and people. In The Need for Rethinking the Concepts of Vulnerability and Risk from a Holistic Perspective: A Necessary Review and Criticism for Effective Risk Management; Routledge: London, UK, 2004; Chapter 3; p. 17. [Google Scholar]
- Green, C. The evaluation of vulnerability to flooding. Disaster Prev. Manag. Int. J. 2004, 13, 323–329. [Google Scholar] [CrossRef]
- Vatsa, K.S. Risk, vulnerability, and asset-based approach to disaster risk management. Int. J. Sociol. Soc. Policy. 2004, 24, 1–48. [Google Scholar] [CrossRef]
- Hewitt, K. Regions of Risk: A Geographical Introduction to Disasters; Routledge: New York, NY, USA, 2014. [Google Scholar]
- Birkmann, J. Measuring vulnerability to natural hazards: Towards disaster resilient societies. In Measuring Vulnerability to Promote Disaster-Resilient Societies: Conceptual Frameworks and Definitions; United Nations University Press: Tokyo, Japan, 2006; Chapter 1. [Google Scholar]
- Pelling, M.; Uitto, J.I. Small island developing states: Natural disaster vulnerability and global change. Glob. Environ. Chang. Part B Environ. Hazards 2001, 3, 49–62. [Google Scholar] [CrossRef]
- McEntire, D. Understanding and reducing vulnerability: From the approach of liabilities and capabilities. Disaster Prev. Manag. Int. J. 2012, 20, 294–313. [Google Scholar] [CrossRef]
- Perrow, C. The Next Catastrophe: Reducing Our Vulnerabilities to Natural, Industrial, and Terrorist Disasters; Princeton University Press: Princeton, NJ, USA, 2011. [Google Scholar]
- Schipper, L.; Pelling, M. Disaster risk, climate change and international development: Scope for, and challenges to, integration. Disasters 2006, 30, 19–38. [Google Scholar] [CrossRef] [PubMed]
- Brody, S.D.; Highfield, W.E.; Ryu, H.C.; Spanel-Weber, L. Examining the relationship between wetland alteration and watershed flooding in Texas and Florida. Nat. Hazards 2007, 40, 413–428. [Google Scholar] [CrossRef]
- Flax, L.K.; Jackson, R.W.; Stein, D.N. Community vulnerability assessment tool methodology. Nat. Hazards Rev. 2002, 3, 163–176. [Google Scholar] [CrossRef]
- Kim, Y.O.; Seo, S.B.; Jang, O.J. Flood risk assessment using regional regression analysis. Nat. Hazards 2012, 63, 1203–1217. [Google Scholar] [CrossRef]
- Yang, S.; He, S.; Du, J.; Sun, X. Screening of social vulnerability to natural hazards in China. Nat. Hazards 2015, 76, 1–18. [Google Scholar] [CrossRef]
- Zhou, Y.; Li, N.; Wu, W.; Wu, J. Assessment of provincial social vulnerability to natural disasters in China. Nat. Hazards 2014, 71, 2165–2186. [Google Scholar] [CrossRef]
- Prashar, S.; Shaw, R.; Takeuchi, Y. Assessing the resilience of Delhi to climate-related disasters: A comprehensive approach. Nat. Hazards 2012, 64, 1609–1624. [Google Scholar] [CrossRef]
- Adelekan, I.O. Vulnerability assessment of an urban flood in Nigeria: Abeokuta flood 2007. Nat. Hazards 2011, 56, 215–231. [Google Scholar] [CrossRef]
- Fekete, A.; Damm, M.; Birkmann, J. Scales as a challenge for vulnerability assessment. Nat. Hazards 2010, 55, 729–747. [Google Scholar] [CrossRef]
- Cutter, S.L.; Finch, C. Temporal and spatial changes in social vulnerability to natural hazards. Proc. Natl. Acad. Sci. USA 2008, 105, 2301–2306. [Google Scholar] [CrossRef] [PubMed]
- Wood, N.J.; Burton, C.G.; Cutter, S.L. Community variations in social vulnerability to Cascadia-related tsunamis in the US Pacific Northwest. Nat. Hazards 2010, 52, 369–389. [Google Scholar] [CrossRef]
- Azar, D.; Rain, D. Identifying population vulnerable to hydrological hazards in San Juan, Puerto Rico. GeoJournal 2007, 69, 23–43. [Google Scholar] [CrossRef]
- Myers, C.A.; Slack, T.; Singelmann, J. Social vulnerability and migration in the wake of disaster: The case of Hurricanes Katrina and Rita. Popul. Environ. 2008, 29, 271–291. [Google Scholar] [CrossRef]
- Ebert, A.; Kerle, N.; Stein, A. Urban social vulnerability assessment with physical proxies and spatial metrics derived from air-and spaceborne imagery and GIS data. Nat. Hazards 2009, 48, 275–294. [Google Scholar] [CrossRef]
- Burton, C.G. Social vulnerability and hurricane impact modeling. Nat. Hazards Rev. 2010, 11, 58–68. [Google Scholar] [CrossRef]
- Osborne, J.W.; Waters, E. Four assumptions of multiple regression that researchers should always test. Pract. Assess. Res. Eval. 2002, 8, 1–7. [Google Scholar]
- Gujarati, D.N. Basic Econometrics; Tata McGraw-Hill Education: New York, NY, USA, 2012. [Google Scholar]
- Baller, R.D.; Anselin, L.; Messner, S.F.; Deane, G. Structural covariates of US county homicide rates: Incorporating spatial effects. Criminology 2001, 39, 561–588. [Google Scholar] [CrossRef]
- Kuhlicke, C.; Scolobig, A.; Tapsell, S.; Steinführer, A.; De Marchi, B. Contextualizing social vulnerability: Findings from case studies across Europe. Nat. Hazards 2011, 58, 789–810. [Google Scholar] [CrossRef]
- Chen, W.; Cutter, S.L.; Emrich, C.T.; Shi, P. Measuring social vulnerability to natural hazards in the Yangtze River Delta region, China. Int. J. Disaster Risk Sci. 2013, 4, 169–181. [Google Scholar] [CrossRef]
- Qiu, Z.; Prato, T.; Boehrn, G. Economic valuation of riparian buffer and open space in a suburban watershed. J. Am. Water Resour. Assoc. 2006, 42, 1583–1596. [Google Scholar] [CrossRef]
- Zahran, S.; Brody, S.D.; Peacock, W.G.; Vedlitz, A.; Grover, H. Social vulnerability and the natural and built environment: A model of flood casualties in Texas. Disasters 2008, 32, 537–560. [Google Scholar] [CrossRef] [PubMed]
- Felsenstein, D.; Lichter, M. Social and economic vulnerability of coastal communities to sea-level rise and extreme flooding. Nat. Hazards 2014, 71, 463–491. [Google Scholar] [CrossRef]
- Adie, C.E. Holistic Disaster Recovery: Ideas for Building Local Sustainability after a Natural Disaster; DIANE Publishing: Collingdale, PA, USA, 2001. [Google Scholar]
- Berke, P.R.; Campanella, T.J. Planning for post disaster resiliency. Ann. Am. Acad. Political Soc. Sci. 2006, 604, 192–207. [Google Scholar] [CrossRef]
Figure 1.
Administrative boundaries of Korea.

Figure 2.
Flowchart of examining vulnerability factors to a natural disaster with SAM.

Figure 3.
Disaster economic damages (2001–2010) in Korea.

Figure 4.
LISA cluster analysis map.


Table 1.
Social and physical vulnerability indicators from worldwide countries.
| Country | Author (Year) | Social Aspects (Demographic/Economic Aspect) | Physical Aspects (Natural/Built Environment Aspect) |
|---|---|---|---|
| United States | Brody et al. (2007) [29] | Household income, population density | Dams, impervious surface, mean percent slope; precipitation; stream length |
| United States | Flax et al. (2002) [30] | Age, poverty, minority, public assistance, rental households, types of job. female households | Discharge sites, oil and toxic facilities, roads and bridges, ports, schools, police/fire/hospital/shelter |
| South Korea | Yoon and Jeong (2016) [2] | Household size, small business, urban population, less educated and young people, property tax | Greenhouse, industry density, low-lying area, precipitation, old building, open space |
| South Korea | Kim et al. (2012) [31] | Low-income household, senior citizens, manufacturing output, population density, property tax, number of dwellings and population, rental dwellings | Average building age, ratio of urban use, ratio of recreational use, underground dwellings |
| China | Yang et al. (2015) [32] | Population growth rate, female, population density, children and elderly, wage, income, GDP per capita, female labors, social security recipients, employment rate, disadvantaged groups | Water and energy use per capita, rate of construction land, transport and infrastructure density |
| China | Zhou et al. (2014) [33] | Average wage, GDP per capita, illiteracy rate, income of rural households, population density, population growth rate, savings deposit, sex ratio, agricultural population, total investment in fixed assets, unemployment rate | Area of old housing, length of railways, length of waterway, length of roads, number of building floors, number of old housing, public transportation vehicles, reinforcement concrete building, urbanization rate |
| India | Prashar et al. (2012) [34] | Budget and subsidy, education and awareness, employment, finance and savings, household assets, income, population, social capital | Road accessibility, land use residential area, sanitation and waste disposal, ecosystem service, intensity/severity/frequency of natural hazards, electricity/water |
| Nigeria | Adelekan (2011) [35] | Occupation, awareness of flood hazard, education level, gender, age, monthly income, relief and assistance resources, perception of flood risks | Depth of flood waters, distance from dwelling to a river, past flood experience, types of the building structure |
| Germany | Fekete et al. (2010) [36] | Age, apartment type, education level, GDP per capita, living space per person, population density, rate of farmers, unemployment | Dominating land use, organic farms, buffer capacity, percent of farmland, potential contaminating sites, protected areas, soil erosion potential, water-retaining capacity |
Table 2.
Description of vulnerability factors and expected influence on disaster damage.
| Indicators | Description | Year | Effect | Source |
|---|---|---|---|---|
| Social aspects | ||||
| Less educated people | Percentage of population over age 15 without elementary school completion | 2010 | + | KOSIS 1 |
| Minority | Percentage of foreigners | 2010 | + | KOSIS 1 |
| Economic aspects | ||||
| Tax | Amount of property tax per capita | 2010 | − | KOSIS 1 |
| Manufacturer | Number of manufacturing establishments per square kilometer | 2010 | − | KOSIS 1 |
| Natural environmental aspects | ||||
| Precipitation | Average precipitation from 2001 to 2010 | 2001–2010 | + | KMA 2 |
| Frequency | Annual frequency of natural disasters including typhoon, heavy rain, heavy snow, and snowfall | 2001–2010 | + | MOIS 3 |
| Open space | Green tract of land as a percent of a total land | 2010 | − | KOSIS 1 |
| Average slope | Average slope | 2010 | + | KOSIS 1 |
| Built environmental aspects | ||||
| Old building | Percentage of housing units built before 1959 | 2005 | + | KOSIS 1 |
| Housing density | Number of housing units per square kilometer | 2010 | +/− | KOSIS 1 |
Note: KOSIS 1 = Korea Statistical Information Service; KMA 2 = Korea Meteorological Administration; MOIS 3 = Ministry of the Interior and Safety.
Table 3.
Results of OLS regression model and spatial error model (SEM).
| Variable | OLS Regression Model Coefficients | Spatial Error Model (1st Order Queen-Based Contiguity) Coefficients | Spatial Error Model (1st Order Rook-Based Contiguity) Coefficients |
|---|---|---|---|
| Social aspects | |||
| Less educated people | 0.232 † | 0.267 † | 0.261 † |
| Minority | 0.072 * | 0.069 * | 0.068 * |
| Economic aspects | |||
| Tax | −0.001 | 0.024 | 0.018 |
| Manufacturer | −0.137 † | −0.133 † | −0.131 † |
| Natural environmental aspects | |||
| Precipitation | 0.098 † | 0.086 * | 0.086 * |
| Frequency | 0.104 † | 0.118 † | 0.117 † |
| Open space | −0.201 † | −0.176 † | −0.180 † |
| Average slope | 0.325 † | 0.312 † | 0.310 † |
| Built environmental aspects | |||
| Old building | 0.050 | 0.048 | 0.050 |
| Housing density | −0.254 † | −0.237 † | −0.243 † |
| constant | 2.343 † | 2.346 † | 2.345 † |
| Spatial error parameter(λ) | - | 0.427 † | 0.379 † |
| Global Moran’s I | 0.205112 † | 0.000306125 | −0.0168871 |
| Adjusted R-squared (Pseudo R-squared) | 0.816 | 0.847 | 0.842 |
| AIC | 286.147 | 264.352 | 269.181 |
| SC | 323.966 | 302.17 | 307 |
| Log likelihood | −132.073 | −121.176 | −123.59 |
| Multicollinearity Condition Number | 4.852 | - | - |
| Jarque-Bera | 0.055 | - | - |
| Breusch-Pagan | 15.12 | 19.979 * | 17.786 |
| Koenker-Bassett | 15.37 | - | - |
| LM-Lag | 4.574 * | - | - |
| Robust LM-Lag | 0 | - | - |
| LM-Error | 20.712 † | - | - |
| Robust LM-Error | 16.138 † | - | - |
| Significance | 0 | - | - |
* p < 0.05, † p < 0.01.
© 2018 by the authors. Licensee MDPI, Basel, Switzerland. This article is an open access article distributed under the terms and conditions of the Creative Commons Attribution (CC BY) license (http://creativecommons.org/licenses/by/4.0/).
Share and Cite
MDPI and ACS Style
Jeong, S.; Yoon, D.K. Examining Vulnerability Factors to Natural Disasters with a Spatial Autoregressive Model: The Case of South Korea. Sustainability 2018, 10, 1651. https://0-doi-org.brum.beds.ac.uk/10.3390/su10051651
AMA Style
Jeong S, Yoon DK. Examining Vulnerability Factors to Natural Disasters with a Spatial Autoregressive Model: The Case of South Korea. Sustainability. 2018; 10(5):1651. https://0-doi-org.brum.beds.ac.uk/10.3390/su10051651
Chicago/Turabian StyleJeong, Seunghoo, and D. K. Yoon. 2018. "Examining Vulnerability Factors to Natural Disasters with a Spatial Autoregressive Model: The Case of South Korea" Sustainability 10, no. 5: 1651. https://0-doi-org.brum.beds.ac.uk/10.3390/su10051651
Note that from the first issue of 2016, this journal uses article numbers instead of page numbers. See further details here.