Article

A Spatial DEA-Based Framework for Analyzing the Effectiveness of Disaster Risk Reduction Policy Implementation: A Case Study of Earthquake-Oriented Urban Renewal Policy in Yongkang, Taiwan

Department of Urban Planning, National Cheng Kung University, Tainan City 70101, Taiwan
*
Author to whom correspondence should be addressed.
Sustainability 2018, 10(6), 1751; https://0-doi-org.brum.beds.ac.uk/10.3390/su10061751
Submission received: 22 April 2018 / Revised: 19 May 2018 / Accepted: 25 May 2018 / Published: 27 May 2018
(This article belongs to the Special Issue Disasters, Crisis, Hazards, Emergencies and Sustainable Development)

Abstract

:
Due to the many large earthquakes that have occurred in recent years, the role of seismic risk reduction in building resilient cities has become a matter of concern. The serious disaster damage brought by seismic hazards causes the adoption of migration policies such as building control in the preparedness phase. However, the restricted budget of governments resulting from the global state of economic distress generates a prioritization problem. A decision support framework could be helpful for governments to systematically integrate the complex information when implementing disaster risk reduction policies toward sustainable development. The purpose of this study was to construct an analytical framework based on Geographic Information System (GIS) and Data Envelopment Analysis (DEA) for addressing the prioritization problem by calculating policy efficiency. The spatial DEA-based framework combines indices calculation, spatial database construction, and DEA. Taiwan is an island located in the Circum-Pacific Belt, and has paid long-term attention to adopting policies for earthquake disaster prevention. A policy of earthquake-oriented urban renewal combining enhanced building capacity and city resilience has recently been implemented. A case study of the Yongkang district of the Tainan Metropolis in Taiwan was conducted in this study. The results show an operable framework and propose a suggestion for planning efficient policy priorities in each decision-making unit. In sum, the analytical framework proposed in this study could be a component of a decision support system for governments to adopt disaster risk reduction policies in the process of policy-making and implementation.

1. Introduction

How to build resilience to unknown events is the most important concept in working towards sustainable development with the high-frequency occurrence of natural hazards [1]. These environmental crises seem to be increasingly unpredictable, often with serious damages and casualties beyond expectation. A paradigm shift shown in disaster risk management in recent academic and theoretical research provides insight into the impact of climate change on natural disasters [2,3]. The importance of disaster risk reduction (DRR) has been outlined by the Sendai Framework [4,5,6]. For governments, the concept of resilience emphasizes the increase of capacity for rapidly reacting to dynamic environmental change and crises rather than recovering to the original state when facing the present and future hazards.
Seismic risk reduction (SRR) has garnered increased interest since the occurrence of several large earthquakes, such as the Tohoku (Japan) and Christchurch (New Zealand) earthquakes of 2011 and the Nepal earthquake of 2015. Ground shaking creates serious casualties and property loss and even economic disorder in urban areas [7,8]. From a long-term perspective, SRR is regarded as a useful policy due to its cost effectiveness for governments in the areas of building control [8,9], land use planning [10], and disaster prevention education, which enhance a city’s resilience and ease disaster losses caused by earthquakes during the preparation stage [11]. However, the unpredictability and rarity of earthquakes render people ambivalent about disaster preparedness [12,13,14]. People in high-risk areas such as Taiwan and New Zealand could increase susceptibility to seismic hazard resulting from prior experience without suffering disaster losses [14]. To solve this problem, governments often employ economic incentives to enhance residential supports. Deploying economic instruments for disaster management is a useful approach that encourages residential behavioral change. However, the financial burden subsidies for governments may increase when implementing SRR policies.
Efficiency in implementing public policies is always an important goal, and has been studied by researchers using various methodologies [15,16]. Seeking cost-effective outputs is important when governments invest resources in the policymaking process. This critical problem also exists when adopting SRR policies. However, governments generally find the implementation of SRR policies to be financially difficult due to the global financial crisis. When governments encounter financial difficulties, they generally adopt less-expensive DRR policies rather than deploying emergency disaster relief due to the uncertainty of disaster occurrence [13]. Governments cannot draft enough budgets to adopt policies in various areas. Thus, the prioritization problem may appear in the process of decision making. In general, areas with a high seismic hazard risk may be prioritized for policy implementation to reduce disaster losses. Several studies identifying high SRR by measuring hazard, vulnerability, and exposure, or by assessing damage losses have been discussed and applied to actual disaster management [17,18,19]. In addition to considering the degree of hazard risk, various factors affecting policy implementation (e.g., wide public acceptance) should be included when discussing the prioritization problem for adopting SRR policies. Earthquake prediction remains unreliable, and residents may be unwilling to pay additional taxes to implement SRR policies [14]. In sum, the prioritization problem in the decision-making process should consider not only the seismic hazard risk, but also policy feasibility in each unit.
Adopting SRR policies to ensure that governments use resources efficiently is imperative, particularly during times of economic difficulty. By comparing the efficiency in each decision-making unit (DMU), Data Envelopment Analysis (DEA) has proven to be a useful approach for evaluating performance and identifying alternatives and competitive positions. Reviewing the methods of policy performance evaluation, the difficulty of calculating the weight of each variable and selecting limited numbers of variables from the restrictions of alternative methods has been shown in past research. DEA methodology is based on multiple unweighted factors, and calculates the efficiency of DMUs using a linear programming-based function. Additionally, DEA provides various extended models that use information to resolve research issues. In using a combined analysis stemming from various models, DEA is particularly appropriate for comparing diversified recourse profiles [12,20,21] and providing suggestions for adopting policy. Moreover, it can have the capacity to handle several input and output variables simultaneously without methodological restrictions in a multiple-dimension decision-making process. Azadeh et al. (2011) [22] employed DEA to solve the location optimization of wind plants. Pawar et al. (2007) [23] used DEA to conduct conservation assessments and prioritize areas for wildlife preservation. Yang and Wang (2013) [24] measured the environmental efficiency of energy utilization and environmental regulation cost using DEA.
This study proposes a research design for handling the prioritization question and provides suggestions for implementing SRR policy. DEA is applied in this study to examine the ranking of implementation areas. To strengthen the methodology’s application for public policy adoption, the DEA framework of input and output variables is integrated with a GIS (Geographic Information System)-based database for the construction of a spatial decision support system. Each variable is separately calculated or simulated by existing regulations or software. Most importantly, the public willingness is measured through a questionnaire survey to increase the possibility of practical application when implementing policies. The selection of input variables includes indicators representing the degree of seismic risk and policy feasibility, and the output variables show the improvement of city resilience and government money savings in each unit. This paper proceeds as follows: Section 2 explains the SRR policy in Taiwan. Section 3 introduces the case study. Section 4 presents the study’s research design. Section 5 presents the results of a case study area, and Section 6 discusses those results. Section 7 concludes the paper.

2. Seismic Risk Reduction Policy in Taiwan
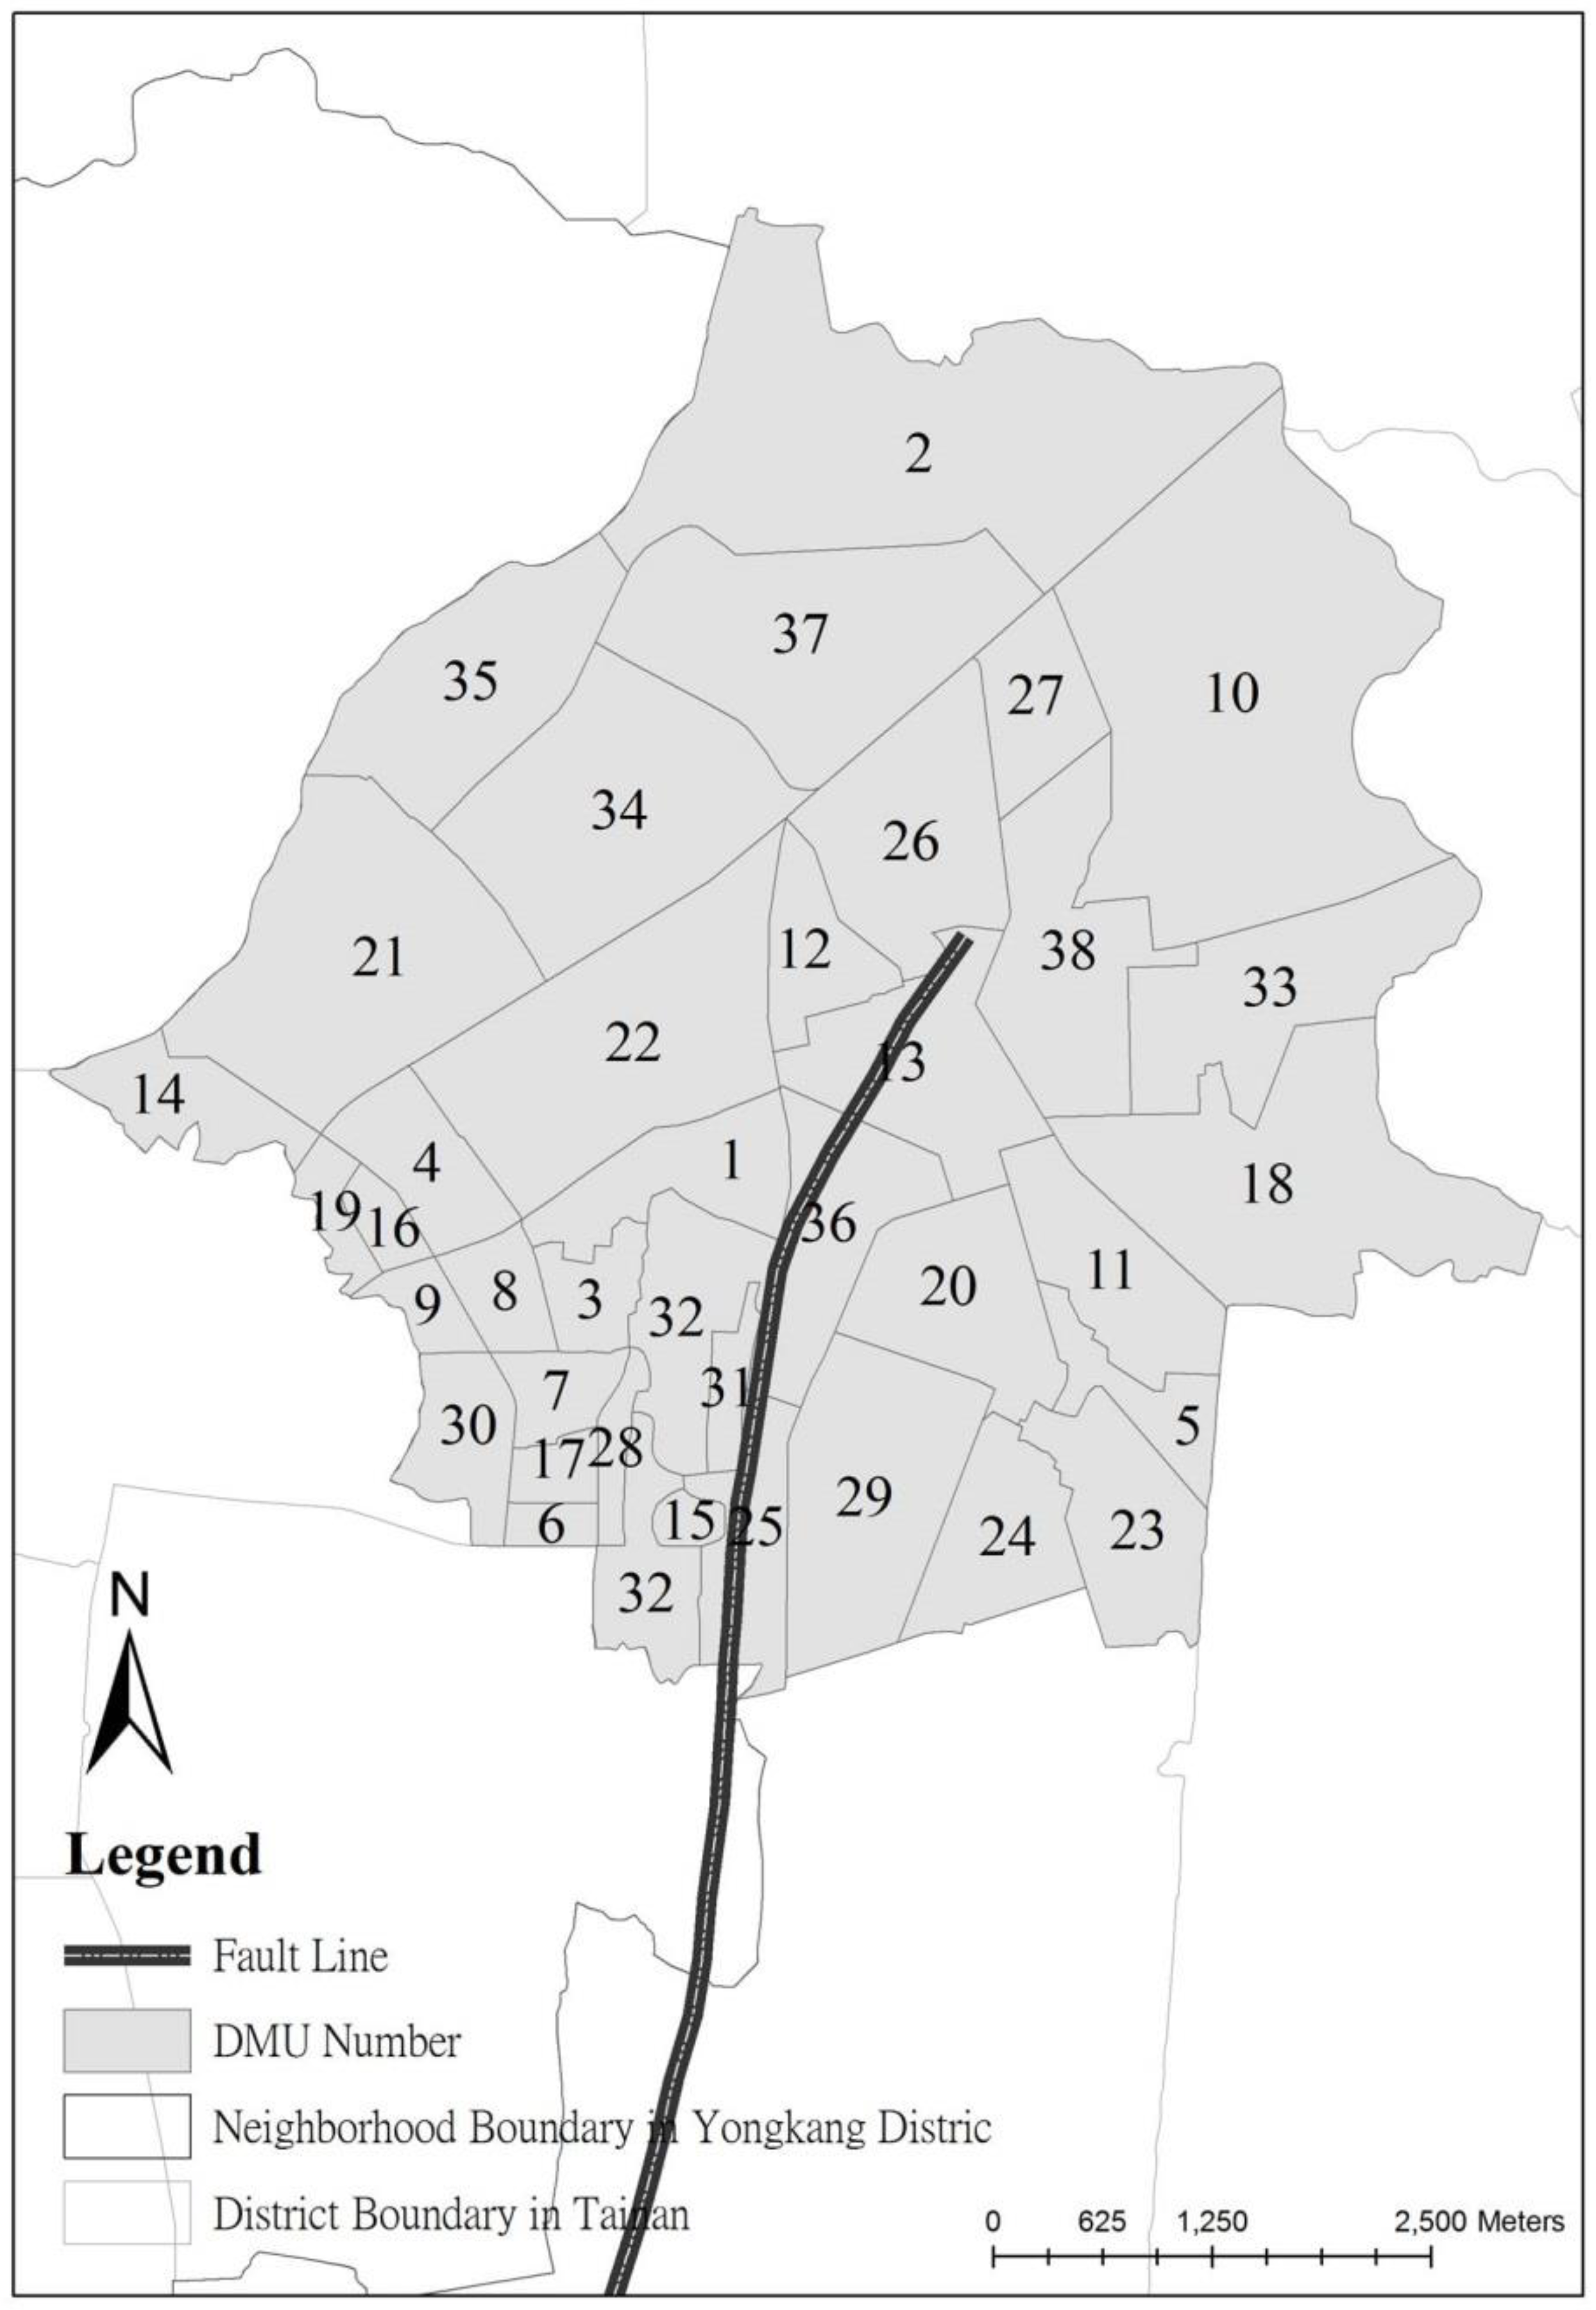
Eighty percent of the world’s earthquakes occur in the Circum-Pacific Belt, and this region is thus a significant focus of Asian SRR policies. The countries in the belt follow chains of island arcs and have long focused on enhancing city dwellings’ resilience by implementing SRR policies. Taiwan is situated at the convergent boundary between the Eurasia Plate and the Philippine Sea Plate, resulting in a high frequency of earthquakes. Indeed, Taiwan experiences more than 600 earthquakes each year. Scarce land resources mean that many high-density Taiwanese cities are located along the fault zone. Thus, the central government emphasizes seismic monitoring and the development of loss estimation systems within its SRR policies.
In 1999, the Chi-Chi Earthquake, measuring a magnitude 7.6 on the Richter scale, struck Taiwan, resulting in 13,720 casualties and the collapse of 105,479 buildings. Since the Chi-Chi earthquake, Taiwan has attempted to redistribute spatial arrangements in seismically active areas through land use planning and zoning control. The frequency of large earthquakes has increased in the ten years since the Chi-Chi earthquake. According to the historical record of the past one hundred years, a strong spatial relationship exists between the occurrence of large-scale earthquakes in Japan and Taiwan. That is, Taiwan may experience a large earthquake if Japan experiences a large earthquake [25]. This argument has also been confirmed by the 2016 Meinong Earthquake (magnitude 6.6) and the 2018 Hualien Earthquake (magnitude 6.4). Thus, the Taiwanese government strengthened its earthquake disaster mitigation and preparedness plans when the Tohoku earthquake occurred in Japan.
As was observed in the aftermath of the Chi-Chi earthquake, building collapse is the main cause of death resulting from earthquakes. In Taiwan, there are a number of buildings that are not earthquake-safe due to a previously unenforced regulation, and thus major casualties and losses are likely to occur due to earthquakes, particularly in major cities. Earthquake-resistant buildings are less likely to collapse or take longer to collapse, giving inhabitants more time to flee during an earthquake. To avoid the collapse of vulnerable buildings in urban areas, the Taiwanese government encourages inhabitants to strengthen those buildings through the deployment of an “earthquake-oriented urban renewal (EUR)” policy for enhancing city resilience. The EUR policy is based on the framework of the present urban renewal policy and encourages residents to repair or rebuild their buildings through economic incentives and increasing building bulk incentives. In contrast to general urban renewal policies emphasizing land activation, EUR focuses on reducing the seismic hazard risk and enhancing building resistance. EUR also redistributes spatial patterns to lessen the hazard risk and enhances the preparedness system by improving narrow roads and alleys, for example, in addition to enhancing the safety of vulnerable urban buildings. However, the low willingness of residents to adopt EUR could be predicted by the past research or reports. A lower level of preparedness for disasters is shown in households of Taiwan [6]. Without prior experience, residents may worry more about the occurrence of earthquakes than the collapse of their houses.
In designing the EUR, the Taiwanese government aimed to increase residents’ willingness to pay to repair or rebuild their houses by releasing unused public land and promoting a cooperation model through the deployment of economic incentives. A government-led partnership model was applied to implement EUR. The spatial arrangement for improving disaster relief or reducing disaster damage in highly seismic areas can be redistributed by integrating private and public land. Major metropolises such as Tainan would be given priority for implementation. However, it is financially difficult for local governments to redistribute spatial arrangements due to restricted budgets for the adoption of EUR. Therefore, local governments may implement a multi-phase plan in releasing hard incentive expenditures. This study employs a spatial DEA-based framework to calculate policy efficiency in deciding which areas should adopt the EUR policy during each phase.

3. Case Study Area

EUR focuses on improving building vulnerability in urban areas, and this study selects one area in the Tainan metropolis as a case study area. Yongkang District has the largest population (229,777) in the Tainan Metropolis, as well as a high population density (2024.12 people/km2), making it a well-developed industrial hub. The Houchiali fault is located at the center of Yongkang District (Figure 1). Taking the historical record and earthquake frequency into account, domestic researchers have concluded that there is a high probability of an earthquake occurring along this fault.
In 2016, a magnitude-5 earthquake in Yongkang District caused hundreds of deaths. Thus, the Tainan government chose to implement EUR in Yongkang District. According to the tax survey, there were nearly 10,000 units requiring seismic retrofits exist in Yongkang. A debt held by the local government of approximately 1.7 billion US dollars caused a prioritization problem in implementing EUR with a limited budget. A policy efficiency evaluation is conducted here with a case study of Yongkang to solve the core issue in practice.

4. Material and Methods

4.1. Data Envelopment Analysis

Data Envelopment Analysis (DEA) is a non-parametric method for estimating production frontiers without specific mathematical forms for measuring the productive efficiency of decision-making units (DMU) [26,27]. The main reason for employing DEA results from its several advantages in the process of efficiency calculation. The ability of this method to handle multiple inputs and outputs is required in a multiple-dimension decision-making process. Moreover, each input–output variable with different measurements can be analyzed and compared in each DMU. DEA’s capacity can address this problem and calculate the efficiency in each unit. Moreover, a series of analytical processes can make possible a thorough discussion of ranking policy implementation efficiency and sensitivity analysis.
DEA’s structure employs the linear programming technique to find the set of coefficients that will obtain the highest value from the ratio of outputs to inputs. The following introduces each symbol in this model.
  • j = number of decision-making units in DEA
  • DMUj = decision-making unit number j
  • yrj = amount of output r used by decision-making unit j
  • xij = amount of input i used by decision-making unit j
  • i = number of inputs used by DMUs
  • r = number of outputs produced by DMUs
  • ur = coefficient or weight assigned by DEA to output r
  • vi = coefficient or weight assigned by DEA to input i
DEA is composed of multiple input–output variables. Equations (1) and (2) describe the calculation of input and output:
Input = v 1 x 1 + + v i x i = i = 1 m v i x i ,
Output = u 1 y 1 + + u r y r = r = 1 s u r y r .
The efficiency is the ratio of outputs to inputs, by Formula (3):
Efficiency = Output Input = r = 1 s u r y r i = 1 m v i x i ,
where vi (i = 1, …, m) and ur (r = 1, …, s) are input and output weights.
DEA has been widely employed in relevant studies. Numerous models, such as the input-oriented model, have been improved by researchers. The input-oriented model of CCR and BCC used in the literature proportionally reduces the input resource without varying the output resource in the process of calculation. In this study, CCR input-oriented (CCR-I) and BCC input-oriented (BCC-I) models are employed to address multiple input-output variables.
The purpose of the CCR-I model, which measures overall technical efficiency (OTE), is to seek the maximized weightings. The linear programming is shown in Equation (4).
M a x h k = r = 1 s u r Y r k s . t . i = 1 m v i X i k = 1 r = 1 s u r Y r j i = 1 m v i X i j 0 u r ε > 0 u i ε > 0 r = 1 , 2 , 3 , , s i = 1 , 2 , 3 , , m j = 1 , 2 , 3 , , n
where μ0 is the variable recognizing the state of the returns to scale, including increasing, constant, or decreasing returns; and ε represents a small positive number.
The main difference between the CCR and BCC models is the assumption of returns-to-scale. CCR assigns each DMU with constant-returns-to-scale, and the BCC model sets variable returns-to-scale for calculating pure technical efficiency (PTE). The linear programming of BCC-I is shown in Equation (5).
M a x h k = r = 1 s u r Y r k μ 0 s . t . i = 1 m v i X i k = 1 r = 1 s μ r Y r j i = 1 m v i X i j u 0 0 u r ε > 0 u i ε > 0 r = 1 , 2 , 3 , , s i = 1 , 2 , 3 , , m j = 1 , 2 , 3 , , n
The scale efficiency (SE) is the proportion of OTE to PTE for determining the returns-to-scale of each unit. SE provides a measurement for identifying the optimum size of investing resources between input and output. To discriminate the power of efficient DMUs, Sexton et al. (1986) [28] provided a method called cross efficiency (CE) in DEA. The purpose of cross efficiency is to perform a peer evaluation for comparison in each DMU. A weighted average of the cross efficiency for the calculation is shown in Equation (6):
E k j = r = 1 s u r k Y r j i = 1 m v i k x i j .
The slack analysis and sensitivity analysis can be combined into the results of DEA models for a cross analysis. The slack analysis calculates the proportional change in the input or the output of inefficient DMUs for achieving efficiency, and the sensitivity analysis shows the efficient score change when reducing input–output resources. In sum, this study employs the CCR-I, BCC-I, SE, and CE models of DEA to calculate the efficiency of the EUR policy. A series of analytical tools also provides a useful process for discussing the prioritization issue in adopting policies.

4.2. The Conceptual Framework of DEA

The DEA framework is constructed by the input–output variables and is defined according to the research goals. In this study, the main issue is to calculate the policy efficiency of EUR for prioritizing the locations of implementation. In general, the degree of seismic hazard risk is the only factor for ranking a priority for achieving the purpose of enhancing building earthquake-resistance capacity. In this study, policy feasibility is the other necessary factor that should be considered as a limited input resource. To create a clear description of the DEA framework, four stages of disaster management are employed to explain the relationship between the input–output variables of DEA. The government invests resources to adopt EUR during the mitigation and preparedness phase (input) to reduce disaster losses during the response and recovery phase (output).

4.3. Input Variable

The input variables represent the investment of resources when adopting EUR during the pre-disaster phase. For governments, input resources include the costs of economic incentives, communication, and administration. Governments should pay these transaction costs when the EUR policy is regarded as a product that is successfully merchandised to customers (residents). In this study, policy feasibility and the degree of seismic risk are selected to reflect the amount of resources invested in each DMU.

4.3.1. Policy Feasibility

Policy feasibility represents a difficulty for policy implementation due to the unique advantages of adopting policy in each DMU. A DMU with high policy feasibility suggests that a government can invest fewer resources in adopting the policy. The number of private properties in each unit is a critical problem for successfully implementing urban renewal policy [29,30]. The existence of a large number of private properties can mean spending too much time communicating, which can increase the risk of disagreement. According to the description of the EUR policy in Section 2, the government releases public land to enhance residents’ willingness to support the policy. The communication cost can be decreased if the land owners partly belong to public administrations. In this study, the ratio of private land area in each unit is applied to describe the number of private land owners. The variables of policy budget and residential acceptance are selected as the input variables. The policy budget is the total number of subsidies calculated according to Taiwanese government rules if all vulnerable buildings are addressed by EUR in each unit.

4.3.2. Seismic Hazard Risk

The seismic hazard risk in this study is measured by the concept of vulnerability to disaster loss. To identify the scale of the seismic hazard risk in each unit, this study calculates the variables in a density equation. Two types of vulnerability, including vulnerable building density (DB) and the household density of vulnerable buildings (HD), are used to evaluate the degree of earthquake-resistant capacity in each unit. The DB represents the scale of vulnerable buildings, and the building age and construction materials are used to identify vulnerable buildings. The HD shows the number of vulnerable households in each unit. The vulnerable households are the total number of households living in the vulnerable buildings.

4.4. Output Variable

The output variables for describing the results of adopting the EUR used in this study are the degree of disaster loss and government revenue. In each DMU, the higher the value of disaster loss, the more the seismic hazard risk is reduced. The hardship assistance household unit density (HA) represents the degree of disaster losses, and the variables of property tax (PT) and disaster compensation (DS) show the increase and decrease of government revenue in the post-disaster recovery phase.

4.4.1. Disaster Losses

This study uses HA to represent the degree of disaster loss. The other purpose of the EUR is to enhance city resilience by deploying disaster relief to strengthen vulnerable areas, and this variable in the density equation is employed to show the scale of saved lives due to the difference of the area in each unit. Households are determined to be vulnerable by the fact that they are built on a narrow road.

4.4.2. Government Revenue

Two variables, including property PT and DS, represent the change in government revenue following adoption of the EUR. The taxation revenue is the main income of governments, and is a combined index calculated using the social and economic information of each data unit. For example, the house tax is calculated according to the building age, floor areas, material construction, build price, and building story. In this study, the PT, summarized by house tax and income tax, reveals the change in government revenue. The house tax shows an increase in taxation resulting from the EUR. Building prices rise when residents improve or rebuild them. Income tax shows savings on taxes when governments avoid tax decreases stemming from the casualty deduction. Residents can claim a casualty deduction for property loss if they suffer property damage as a result of a sudden event, such as a natural disaster. In other words, residents can avoid property losses due to building collapse if they strengthen their houses. DS represents the compensation of casualties and building collapses resulting from earthquakes. When building resistance is enhanced, the amount of emergency compensation that governments must pay is reduced.

4.5. The Assessment of Variables, Data Resource, and Research Unit

The definition and calculation formula of input–output variables are presented in Table 1 and Table 2. The input variables describe the seismic hazard risk and policy feasibility in each DMU. The variables of DB and HD represent the scale of SRR, and the variables of private land (PL), policy budget (PB), and public willingness (PW) show the conditions when implementing the policy. The neighborhood unit is used as the basic research unit. The neighborhood unit is the smallest district unit in Taiwan (Figure 1). Neighborhoods are divided according to socio-economic conditions through artificial boundaries.
The study constructed a spatial database by GIS. A combination of statistical data and survey questionnaires were collected in this database. The value of each input–output variable in each DMU can be shown by GIS to support policy implementation. A database of more than 10 thousand units can be examined by the door plate, and a total of 426 residents in each research area were surveyed between October and December 2014.

4.6. Descriptive Statistical and Correlation Analysis

Table 3 presents descriptive statistics. The high standard deviation of each input–output variable with diverse measurements describes the various features in each DMU and confirms the purpose of employing DEA in constructing an analytical framework to solve the prioritization problem. For example, the minimum value of DS was 0, and the maximum value was 330,578,293. The results also reveal that one DMU in the case study area had no vulnerable buildings. Additionally, the result of the Pearson correlation between each input–output variable is shown in Table 4. An examination did not find a significantly negative relationship in preventing an inconsistent principle of DEA.

5. Result

5.1. The Rank of Policy Adaptation Based on the Efficiency Scores

The prioritization problem in adapting EUR was solved by the CCR-I model of DEA, and the results are shown in Table 5. In the 39 DMUs, fourteen units—defined as the best practice or efficient frontier—were shown to be technically efficient, with OTE scores of 1. The remaining 25 units had OTE scores of less than 1, with technical inefficiency. According to the definition from Norman and Stoker [31], four factors describe the characteristics of each DMU: (1) The robust efficient unit displays a high level of performance and appears with high frequency in the reference set (RS) of inefficient policy adopting units (E = 1, RS greater than 3). These units may remain efficient unless there is a major shift in the input or output. In this study, nine units, including DMUs 4, 7, 21, 26, 30, 32, 33, 34, and 39, belonged to this type of unit. (2) The marginal efficient unit achieves the efficient frontier (E = 1, RS less than 2), including DMUs 1, 6, 15, 25, and 38. An unusual input or output in this type of unit causes a rare set of inefficient units. This type of unit may become inefficient due to a small increase and decrease in the input and output. (3) The marginal inefficient unit (0.9 ≤ E ≤ 1), including DMUs 8, 11, and 31, can achieve the efficient frontier by improving resource utilization processes. (4) The distinctly inefficient unit (E < 0.9) is the most inefficient DMU. Half of the DMUs belonged to this type of unit, including DMUs 2, 3, 5, 9, 10, 12, 13, 14, 16, 17, 18, 19, 20, 22, 23, 24, 27, 28, 29, 35, 36, and 37. This type of DMU is difficult to move on the efficiency frontier in a short period of time. A peer appraisal of efficient units calculated by the cross-efficiency (CE) model is shown in Table 5. In the efficient DMUs, the most efficient unit was number 7, the second most efficient was number 33, and the third most efficient was number 30.

5.2. The Improvement of Policy Efficiency in DMUs

An efficient unit is the result of pure technical inefficiency or scale inefficiency. A deeper analysis of inefficient units can be revealed through PTE and SE for improving the policy efficiency of each DMU. According to the results of PTE in Table 5, the number of efficient units in the BCC-I model was 18, which is greater than the number of efficient units in the CCR-I model. Compared to the CCR-I model, the BCC-I model with the assumption of VRS formed a convex hull of intersecting planes enveloping the data points more tightly than CCR-I of returns-to-scale (CRS). Thus, the number of efficient units measured by BCC-I was greater than the number measured by CCR-I. The scale efficiency examines the ratio of input and output on an optimal scale. In this study, 15 units had the most productive scale size with CRS and 24 units belonging to increasing returns-to-scale (IRS). The status of CRS in a unit shows whether the government should minimize costs and maximize outcomes for adoption of the EUR. Overall, 15 units achieved the efficiency frontier in all models (CCR-I, BCC-I, and SE). Out of those 15 efficient units measured by CCR-I, 3 units attained a PTE score equal to 1 and achieved an efficient frontier under the VRS assumption. The inefficiency of these three units is attributed to scale inefficiency rather than to the inefficiency of the resource utilization. The unit of IRS can enhance OTE by increasing the scale of policy adoption.
A deeper analysis of the efficiency improvement is discussed by slack and sensitivity analysis. Slack analysis provides information for promoting each inefficient unit in attaining efficiency. Table 6 presents the results of slack analysis for 14 inefficient units. These 14 units represent the proportional reduction in inputs or increase in outputs for achieving an efficient frontier. For example, DMU 14 could make adjustments to move on the efficient frontier by reducing its input to 1.81% of DB and increasing its output to 29.66% of PT. The slack analysis can reveal the improvement of each inefficient unit toward efficiency. Additionally, two types of results can be found in the slack analysis. In addition to units 2, 20, and 37, all units showed an adjustment rate for improvement. For these three units, an extra resource in input was shown for achieving the efficiency frontier.
The sensitivity analysis describing the OTE score changed when the input–output variable was employed to reveal the characteristics of efficiency in each unit. The results of sensitivity analysis in Table 7 provide the change in each DMU unit when governments attempt to alter the input or output resource in adopting the EUR if the slack analysis observes an inefficient unit. The OTE average of the original model (Model 1) was 0.7303, and the averages of Model 2 to Model 9 were lower than the average of Model 1. Model 2 without the PL input had the lowest distance (average = 0.7298) and Model 9 without the DS output had the largest distance to Model 1 (average = 0.5554). These results show that DS was the most effective variable in this DEA framework. The differences in the OTE score in each model can be considered to be a reference when governments adopt the EUR. For example, to increase residential acceptance of the EUR, the government reduces property taxes. However, policy efficiency does not rise when providing this economic incentive. In each unit, the characteristic of each input–output variable affecting the OTE can be observed. For example, Unit 7 could reduce OTE to 0.3478. In other words, this unit achieved efficiency through the high output of HA. When governments change the principle of a policy, OTE can fall and the unit becomes inefficient. That is, a low policy budget input in Unit 7 contributed to high efficiency. However, Unit 7’s rank can be influenced when government alters the policy budget subsidy.

6. Discussion

This paper provides a serial analysis process for a spatial DEA-based framework to discuss the prioritization of policy implementation. Combining all the findings in this study, discussions in this section can be divided into two parts, describing the application of the proposed framework to policy-making, and implementation in each DEA model.
Firstly, CCR-I and CE models calculate the OTE value as the rank of prioritization. Prioritization of each unit can be achieved through a phased EUR implementation according to the OTE score classification. Efficient DMUs can adopt the EUR during the first phase. When concluding the first phase, a successful experience could increase policy acceptance in other areas and improve policy efficiency. Implementing units in the second stage include marginally efficient and marginally inefficient units. The distinctly inefficient units can be implemented during the last phase. In the OTE score results derived from the CCR-I model, half of the units were shown to be inefficient. Moreover, the analysis of the BCC-1and SE models describes the efficient improvement of inefficient units. The factors contributing to inefficient units can be changed by increasing the scale of policy adoption or improving the use of input resources. The former can be improved by merging the units when adopting the EUR policy, and the latter can reduce the input resource according to the results of the slack analysis. On the whole, the comparison of each DMU by DEA helps decision-makers solve the ranking problem [21,22].
Secondly, slack analysis concludes the adjustment of inefficient units for efficient frontier by decomposing the OTE value. The slack analysis suggests the proper units for combination. The units without output shortage represent the units that possess extra input. In this situation, these units could be merged in adopting the policy if they were adjacent to other units with an inefficient scale. Furthermore, the sensitivity analysis observes the policy efficiency of the input–output change. The sensitivity analysis provides a feature of policy efficiency when the input–output variables are altered. The EUR policy may be implemented in the future. Raising subsidies is a challenge that must be overcome by governments. The results of the sensitivity analysis can be considered as a reference for reducing the cost of economic incentives or changing the standard of identifying building vulnerability.
In practice, the implementation of DRR policies can face the same problem. To respond to the dramatic environmental change, public participation is a critical point in modern disaster risk management [2,3]. A dynamic policy planning process could increase the policy acceptance by diminishing the residents’ doubt without suffering major damage [14]. DRR policies are closed to human life and property. The framework in this study could also be integrated as a platform through GIS to exchange opinions in the process for all participators, including residents, non-governmental organizations (NGOs), and public and private sectors to make the decisions. It is believed that the most effective manner to reduce the disaster risk is to improve public disaster risk perception. A cooperative model of public–private partnership surely has become the global trend to enhance city resilience for facing the known events in a paradigm shift of modern disaster risk management.

7. Conclusions

Building a resilient city to increase the capacity for a rapid response to natural hazards is regarded as the main purpose of sustainable development. This study constructs a spatial DEA-based framework for solving the prioritization problem of DPP policy adoption. According to the results, two main findings are shown in this study. Firstly, an operable planning support framework is provided for official or non-governmental organizations to achieve successful disaster risk reduction programs. The policy planner could realize the priority for implementation and observe the alterations of policy performance in each decision unit when changing the situation of resource investment or available outcomes with restricted resources and limited disaster risk management Budgets. Secondly, the suggestion of policy implementation is proposed in this study: (1) the classification of each DMU by efficiency scores could help in the prioritization for a multi-phase plan of EUR policy; (2) the descriptions of how to improve inefficient units is proposed by slacks analysis; (3) the results of sensitivity analysis could make the suggestions to revise EUR policy for enhancing the effectiveness. An integration of multiple dimensions by a systemic framework is required in the process of decision-making when confronting the prioritization problem in policy implementation. The results in this study could be helpful for disaster risk reduction policy-making and implementation.

Author Contributions

Conceptualization, H.-T.C.; Methodology, H.-T.C.; Software, H.-T.C.; Formal Analysis, H.-T.C.; Investigation, H.-S.C.; Data Curation, H.-S.C.; Writing-Original Draft Preparation, H.-T.C.; Writing-Review & Editing, H.-S.C.; Supervision, H.-S.C.; Funding Acquisition, H.-T.C.

Acknowledgments

This building data is supported by the research project from Tainan City Government of Taiwan. Furthermore, the authors appreciate Professor Tsou’s suggestions in the whole research framework.

Conflicts of Interest

The authors declare no conflict of interest. The founding sponsors had no role in the design of the study; in the collection, analyses, or interpretation of data; in the writing of the manuscript, and in the decision to publish the results.

References

  1. Sim, T.; Wang, D.; Han, Z. Assessing the disaster resilience of megacities: The case of Hong Kong. Sustainability 2018, 10, 1137. [Google Scholar] [CrossRef]
  2. Oxley, M.C. A “people-centred principles-based” Post-Hyogo framework to strengthen the resilience of nations and communities. Int. J. Disaster Risk Reduct. 2018, 4, 1–9. [Google Scholar] [CrossRef]
  3. Scolobig, A.; Prior, T.; Schröter, D.; Jörin, J.; Patt, A. Towards people-centred approaches for effective disaster risk management: Balancing rhetoric with reality. Int. J. Disaster Risk Reduct. 2015, 12, 202–212. [Google Scholar] [CrossRef]
  4. United Nations International Strategy for Disaster Reduction. Sendai Framework for Disaster Risk Reduction 2015–2030; UNISDR: Geneva, Switzerland, 2015. [Google Scholar]
  5. Chun, H.; Chi, S.; Hwang, B.G. A spatial disaster assessment model of social resilience based on geographically weighted regression. Sustainability 2017, 9, 2222. [Google Scholar] [CrossRef]
  6. Han, Z.; Wang, H.; Du, Q.; Zeng, Y. Natural hazards preparedness in Taiwan: A comparison between households with and without disabled members. Health Secur. 2017, 15, 575–581. [Google Scholar] [CrossRef] [PubMed]
  7. Rashed, T.; Weeks, J. Assessing vulnerability to earthquake hazards through spatial multicriteria analysis of urban areas. Int. J. Geograph. Inf. Sci. 2003, 17, 547–576. [Google Scholar] [CrossRef]
  8. Ainuddin, S.; Mukhtar, U.; Ainuddin, S. Public perception about enforcement of building codes as risk reduction strategy for seismic safety in Quetta, Baluchistan. Int. J. Disaster Risk Reduct. 2014, 9, 99–106. [Google Scholar] [CrossRef]
  9. Taylan, A. Factors influencing homeowners’ seismic risk mitigation behavior: A case study in Zeytinburnu district of Istanbul. Int. J. Disaster Risk Reduct. 2015, 13, 414–426. [Google Scholar] [CrossRef]
  10. Saunders, W.S.A.; Becker, J.S. A discussion of resilience and sustainability: Land use planning recovery from the Canterbury earthquake sequence, New Zealand. Int. J. Disaster Risk Reduct. 2015, 14, 73–81. [Google Scholar] [CrossRef]
  11. Godschalk, D.R. Urban hazard mitigation: Creating resilient cities. Nat. Hazards Rev. 2003, 4, 136–143. [Google Scholar] [CrossRef]
  12. Coelli, T.J.; Prasada Rao, D.S.; O’Donnell, C.; Battese, G.E. Data envelopment analysis. In An Introduction to Efficiency and Productivity Analysis; Springer: New York, NY, USA, 2005; pp. 161–181. [Google Scholar]
  13. Neumayer, E.; Plümper, T.; Barthel, F. The political economy of natural disaster damage. Glob. Environ. Chang. 2014, 24, 8–19. [Google Scholar] [CrossRef] [Green Version]
  14. Jang, L.J.; Wang, J.J.; Paton, D.; Tsai, N.Y. Cross-cultural comparisons between the earthquake preparedness models of Taiwan and New Zealand. Disasters 2016, 40, 327–345. [Google Scholar] [CrossRef] [PubMed]
  15. Afonso, A.; Schuknecht, L.; Tanzi, V. Public sector efficiency: Evidence for new EU member states and emerging markets. Appli. Econ. 2010, 42, 2147–2164. [Google Scholar] [CrossRef]
  16. Madden, G.; Savage, S.; Kemp, S. Measuring public sector efficiency: A study of economics departments at Australian universities. Educ. Econ. 1997, 5, 153–168. [Google Scholar] [CrossRef]
  17. El Ezz, A.A.; Nollet, M.J.; Nastev, M. Assessment of earthquake-induced damage in Quebec City, Canada. Int. J. Disaster Risk Reduct. 2015, 12, 16–24. [Google Scholar] [CrossRef]
  18. Godfrey, A.; Ciurean, R.L.; van Westen, C.J.; Kingma, N.C.; Glade, T. Assessing vulnerability of buildings to hydro-meteorological hazards using an expert based approach—An application in Nehoiu Valley, Romania. Int. J. Disaster Risk Reduct. 2015, 13, 229–241. [Google Scholar] [CrossRef]
  19. Rahman, N.; Ansary, M.A.; Islam, I. GIS based mapping of vulnerability to earthquake and fire hazard in Dhaka city, Bangladesh. Int. J. Disaster Risk Reduct. 2015, 13, 291–300. [Google Scholar] [CrossRef]
  20. Alfonso Pina, W.H.; Pardo Martinez, C.I. Development and urban sustainability: An analysis of efficiency using data envelopment analysis. Sustainability 2016, 8, 148. [Google Scholar] [CrossRef]
  21. Lo Storto, C. Ecological efficiency based ranking of cities: A combined DEA cross-efficiency and shannon’s entropy method. Sustainability 2016, 8, 124. [Google Scholar] [CrossRef]
  22. Azadeh, A.; Ghaderi, S.F.; Nasrollahi, M.R. Location optimization of wind plants in Iran by an integrated hierarchical Data Envelopment Analysis. Renew. Energy 2011, 36, 1621–1631. [Google Scholar] [CrossRef]
  23. Pawar, S.; Koo, M.S.; Kelley, C.; Ahmed, M.F.; Chaudhuri, S.; Sarkar, S. Conservation assessment and prioritization of areas in Northeast India: Priorities for amphibians and reptiles. Biol. Conserv. 2007, 136, 346–361. [Google Scholar] [CrossRef]
  24. Yang, L.; Wang, K.L. Regional differences of environmental efficiency of China’s energy utilization and environmental regulation cost based on provincial panel data and DEA method. Math. Comput. Model. 2013, 58, 1074–1083. [Google Scholar] [CrossRef]
  25. Chen, L.C.; Liu, C.Y.; Chen, H.E.; Ke, S.S.; Chang, K.C.; Hwang, S.J.; Hsu, C.C.; Lin, C.H.; Ma, K.F.; Liu, C.H. Large Earthquake Disaster Prevention Strategy Proposal; Report 2015; Academia Sinica: Taipei, Taiwan, 2015. [Google Scholar]
  26. Charnes, A.; Cooper, W.W.; Rhodes, E. Measuring the efficiency of decision making units. Euro. J. Oper. Resear. 1978, 2, 429–444. [Google Scholar] [CrossRef]
  27. Cook, W.D.; Green, R.H. Project prioritization: A resource-constrained data envelopment analysis approach. Socio-Econ. Plan. Sci. 2000, 34, 85–99. [Google Scholar] [CrossRef]
  28. Sexton, T.R.; Silkman, R.H.; Hogan, A.J. Data envelopment analysis: Critique and extensions. New Dir. Program Eval. 1986, 32, 73–105. [Google Scholar] [CrossRef]
  29. Adams, D.; Hastings, E.M. Urban renewal in Hong Kong: Transition from development corporation to renewal authority. Land Use Policy 2010, 18, 245–258. [Google Scholar] [CrossRef]
  30. Wang, H.; Shen, Q.; Tang, B.; Lu, C.; Peng, Y.; Tang, L. A framework of decision-making factors and supporting information for facilitating sustainable site planning in urban renewal projects. Cities 2014, 40, 44–55. [Google Scholar] [CrossRef]
  31. Norman, M.; Stoker, B. Data Envelopment Analysis: The Assessment of Performance; John Wiley & Sons, Inc.: New York, NY, USA, 1991. [Google Scholar]
Figure 1. The location of decision-making units (DMUs) in Yongkang District of Tainan, Taiwan.
Sustainability 10 01751 g001
Table 1. The definition and assessment of the input variables. EUR: earthquake-oriented urban renewal.
Variable nameInitialDefinitionCalculationUnitSource
Private LandPLThe proportion of the private land area to the total area in each unit. A lower proportion is easier for implementing policy.The area of private land divided by the area of total number.%Tainan City Government.
Public WillingnessPWPublic willingness means the disagreement of residents in implementing EUR in each research unit. High public disagreement could increase the communication cost when implementing policies.The number of disagreeing residents divided by the total number of residents.%Questionnaire survey.
Policy BudgetPBThis variable shows the total number of subsidies of EUR policies in each unit when all private buildings are improved or rebuilt. The calculation of subsidies is according to the regulations in Taiwan.The sum of each vulnerable building subsidy.NTDCalculation by the authors.
Density of Vulnerable BuildingsDBThe proportion of vulnerable building units to total building units in each unit. Buildings that are not earthquake safe are determined to be so based on age and construction materials. Buildings over 40 years old constructed of brick and wood are determined to be vulnerable buildings.The number of vulnerable building units divided by the total number of building units.%The basic information of each building was taken from the Local Tax Bureau of the Tainan City Government.
Household Density of Vulnerable BuildingsHDThe ratio of household units in vulnerable buildings to total households in each unit. This variable assesses the scale of potential casualties in an earthquake.The number of household units in vulnerable buildings divided by the total number of households.%The basic information was taken from the Household Registration Office and Local Tax Bureau of the Tainan City Government.
Table 2. The definition and assessment of the output variables.
Variable nameInitialDefinitionCalculation UnitSource
Density of Hardship Assistance Household UnitHAThe ratio of hardship assistance households in each unit. The identification is according to households living along narrow roads and having hardship assistance when a disaster occurs. A narrow alley can disturb disaster relief and increase casualties.The number of hardship assistance households divided by the total number households in each unit.%The basic information was taken from the Fire Bureau of the Tainan City Government.
Property TaxPTThe property tax combines house tax and income tax. The property tax is an annual tax that residents must pay. The study calculated the difference in the tax earnings of governments when adopting the EUR policy. P T i j = Δ I T i j + Δ H T i j
I T i j = ( I i j E i j D i j B i j ) × T I i j
H T i j = B T i j × F i j × ( 1 R i j × D L i j ) × S i j × T B i j
i: the i-th household
j: the j-th DMU
IT: the household income
E: household exemptions
D: household deduction
B: natural disaster deduction
TI: tax ratio of income
BT: basic tax of each building
F: total floor areas of the building
D: rate of deprecation
R: rate of deprecation life
DL: deprecation life of each building
S: the adjustment rate of road level
T: the basic rate of building usage
NTDThe basic information of each building was taken from the Local Tax Bureau of the Tainan City Government. The calculation was by the authors.
Disaster compensationDSGovernments provide compensation for private building collapse and casualties. Therefore, governments can save money when all buildings are strengthened through the EUR policy.S = (N × D) + (N × AH × D)
N: the total number of households living in unsafe buildings
D: the compensation of settlement
AH: the average number of people in each household in each unit
NTDThe basic information of each building was from the Local Tax Bureau of the Tainan City Government.
Table 3. The descriptive statistical results of the input–output variables.
AspectNameNumberMin.Max.MeanStd. Deviation
InputPrivate Land (PL)390.12330.89710.69220.1943
Policy Budget (PB)390.000023,935,212.98006,470,133.60976,482,256.8262
Public Willingness (PW)390.00001.00000.53130.2190
Household Density of Vulnerable Building (DB)390.00000.11210.04040.0307
Household Density of Vulnerable Building (HD)390.00000.28260.09210.0760
OutputDensity of Hardship Assistance Household Unit (HA)390.00000.41710.05600.0850
Property Tax (PT)390.00007,910,423.54301,686,074.95532,288,593.1014
Disaster compensation (DS)390.0000330,578,293.100066,506,629.984683,843,594.6033
Table 4. The results of Pearson correlation.
(I) PL(I) PB(I) PW(I) DB(I) HD(O) HA(O) PT(O) DS
(I) PL10.3050.010−0.0120.019−0.1990.0820.163
(I) PB0.3051−0.1740.392 *0.488 **−0.1640.588 **0.614 **
(I) PW0.010−0.1741−0.027−0.0440.179−0.103−0.089
(I) DB−0.0120.392 *−0.02710.882 **−0.1650.742 **0.803 **
(I) HD0.0190.488 **−0.0440.882 **1−0.1050.767 **0.846 **
(O) HA−0.199−0.1640.179−0.165−0.1051−0.208−0.227
(O) PT0.0820.588 **−0.1030.742 **0.767 **−0.20810.921 **
(O) DS0.1630.614 **−0.0890.803**0.846 **−0.2270.921 **1
** Significant at 0.01, * Significant at 0.05.
Table 5. The DEA efficiency analysis.
DMU NumberCCR-IBCC-ISERTS
OTERSRankCEPTE
11.00002100.04281.00001.0000CRS
20.34940350.16790.67860.5149IRS
30.68590240.16150.81160.8452IRS
41.0000480.0981.00001.0000CRS
50.37230340.01210.68800.5412IRS
61.00001120.08421.00001.0000CRS
71.00001411.04311.00001.0000CRS
80.975601500.98410.9914IRS
90.000003901.00000.0000IRS
100.381003300.54150.7036IRS
110.95650160.160.95651.0000CRS
120.802302100.82590.9714IRS
130.84250190.04651.00000.8425IRS
140.42500320.07230.44710.9506IRS
151.000011201.00001.0000CRS
160.88090180.02840.99220.8878IRS
170.60060280.17570.70030.8577IRS
180.83170200.33061.00000.8317IRS
190.48880290.08610.60430.8090IRS
200.73090220.05650.90570.8070IRS
211.0000940.09511.00001.0000CRS
220.68380250.00850.88950.7687IRS
230.45920300.21890.70410.6522IRS
240.44010310.10380.66750.6594IRS
251.00001120.06021.00001.0000CRS
261.000011301.00001.0000CRS
270.247803700.74640.3320IRS
280.250403601.00000.2504IRS
290.66100260.02560.78230.8450IRS
301.0000390.14351.00001.0000CRS
310.914501700.96600.9467IRS
321.000013201.00001.0000CRS
331.0000570.51681.00001.0000CRS
341.0000850.02241.00001.0000CRS
350.65020270.03150.78470.8286IRS
360.155903800.62720.2485IRS
370.69610230.00820.82400.8448IRS
381.00002100.08681.00001.0000CRS
391.00007601.00001.0000CRS
OTE = overall technical efficiency; RS = reference set; CE = cross efficiency; PTE = pure technical efficiency; SE = scale efficiency; RTS = returns-to-scale.
Table 6. The DEA slack analysis.
DMU NumberInputOutput
(I) PL(I) PB(I) PW(I) DB(I) HD(O) HA(O) PT(O) DS
2−0.0108−0.06700.00000.0000−0.01080.00000.00000.0000
3−0.11580.0000−0.1435−0.1332−0.11580.00005.32610.0000
5−0.2050−0.2306−0.22040.0000−0.20500.00002.33080.0000
8−0.34990.0000−0.1898−0.4312−0.3499-2.18350.0000
10−0.17520.0000−0.27650.0000−0.1752-0.15870.0000
11−0.6416−0.7422−0.61980.0000−0.64160.00000.43590.0000
120.0000−0.0607−0.3103−0.09970.0000-0.17540.0000
13−0.1463−0.2924−0.6374−0.2704−0.14630.00000.00000.0000
140.00000.00000.0000−0.01810.00000.00000.29660.0000
16−0.34970.00000.0000−0.5764−0.34970.72680.00330.0000
17−0.06880.00000.0000−0.2813−0.06880.00003.07660.0000
18−0.6651−0.5882−0.3530−0.2141−0.66510.00000.58940.0000
19−0.14490.00000.0000−0.1375−0.14490.00000.41530.0000
20−0.6226−0.5825−0.5728−0.0407−0.62260.00000.00000.0000
22−0.2669−0.0609−0.4338−0.2907−0.26692.77300.00000.0000
23−0.0915−0.2721−0.04750.0000−0.09150.00002.25310.0000
24−0.1829−0.2797−0.07440.0000−0.18290.00005.30540.0000
27−0.2326−0.0143−0.2409−0.0373−0.2326-0.16800.0000
28−0.20300.0000−0.2367−0.1756−0.2030-27.11820.0000
29−0.3542−0.5170−0.26760.0000−0.35420.00000.41720.0000
31−0.82240.0000−0.8422−0.5842−0.8224-1.51320.0000
35−0.37070.0000−0.41060.0000−0.37070.00000.09260.0000
36−0.1204−0.0151−0.10100.0000−0.1204-4.95060.0000
37−0.5305−0.20630.00000.0000−0.53050.00000.00000.0000
Table 7. The results of sensitivity analysis.
Unit NumberCCR-1Delete InputDelete Output
OTEPLPBPWDBHDHAPTDS
Model number123456789
11.00001.00001.00000.86381.00001.00001.00001.00001.0000
20.34940.34940.34940.32990.32590.34940.22870.32930.3388
30.68590.68590.34160.68590.68590.57190.64290.68590.2795
41.00001.00001.00001.00001.00001.00001.00000.62951.0000
50.37230.37230.37230.37230.33530.34970.36950.37230.0809
61.00001.00000.38121.00001.00001.00000.92250.84651.0000
71.00001.00001.00001.00001.00001.00000.34781.00001.0000
80.97560.97560.53600.97560.97560.93790.97560.97560.3039
90.00000.00000.00000.00000.00000.00000.00000.00000.0000
100.38100.38100.35810.38100.30160.38100.38100.38100.3150
110.95650.95650.95650.95650.90530.88850.88780.95650.5008
120.80230.78770.80230.80230.80230.68000.80230.80230.5077
130.84250.84250.84250.84250.84250.51460.82520.84000.4600
140.42500.42100.40450.34140.42500.42500.27940.42500.3596
151.00001.00001.00000.19181.00001.00001.00001.00000.3290
160.88090.88090.48890.86310.88090.88090.88090.88090.8780
170.60060.60060.48750.59520.60060.57590.34150.60060.4526
180.83170.83170.83170.83170.83170.54110.59910.83170.4955
190.48880.48880.35130.47450.48880.45480.39370.48880.3997
200.73090.73090.73090.73090.73090.60080.69750.72260.4305
211.00001.00000.51901.00001.00001.00001.00001.00001.0000
220.68380.68380.68380.68380.68380.48600.68380.44500.6144
230.45920.45920.45920.45920.43320.43510.37790.45920.3407
240.44010.44010.44010.44010.39490.41860.41000.44010.2147
251.00001.00000.19021.00001.00001.00000.51111.00000.7919
261.00001.00001.00001.00001.00000.99311.00001.00000.7405
270.24780.24780.24780.24780.24780.17210.24780.24780.1148
280.25040.25040.11260.25040.25040.21710.25040.25040.0088
290.66100.66100.66100.66100.58890.62400.65590.66100.3283
301.00001.00000.79961.00001.00000.86871.00001.00001.0000
310.91450.91450.71370.91450.91450.67320.91450.91450.3474
321.00001.00001.00001.00001.00001.00001.00001.00001.0000
331.00001.00001.00001.00001.00001.00000.39191.00001.0000
341.00001.00001.00001.00000.89451.00001.00001.00000.8435
350.65020.65020.58670.65020.64380.64630.61640.65020.5676
360.15590.15590.15590.15590.14330.14750.15590.15590.0188
370.69610.69610.62730.69610.69610.51710.69230.68800.5994
381.00001.00001.00000.21451.00001.00001.00001.00001.0000
391.00001.00001.00001.00001.00001.00001.00001.00001.0000
Average0.73030.72980.62650.68240.71860.67560.65340.70980.5554
Number of Efficient Unit141410111312101210

