Article

The Role of Planning and Implementation of ICT in Operational Benefits

by
Rubén Jesús Pérez-López
1,
Jesús Everardo Olguín-Tiznado
1,*,
Jorge Luis García-Alcaraz
2,
Claudia Camargo-Wilson
1 and
Juan Andrés López-Barreras
3
1
Faculty of Engineering, Architecture and Design, Universidad Autónoma de Baja California, Ensenada 22860, Mexico
2
Department Industrial Engineering and Manufacturing, Universidad Autónoma de Ciudad Juárez, Juárez 32310, Mexico
3
School of Chemical Sciences and Engineering, Universidad Autónoma de Baja California, Tijuana 22390, Mexico
*
Author to whom correspondence should be addressed.
Sustainability 2018, 10(7), 2261; https://0-doi-org.brum.beds.ac.uk/10.3390/su10072261
Submission received: 30 May 2018 / Revised: 24 June 2018 / Accepted: 28 June 2018 / Published: 30 June 2018
(This article belongs to the Section Sustainable Engineering and Science)

Abstract

:
This article reports a model of structural equations that integrates four latent variables and six hypotheses among them: Integration of information and communication technology (ICT), investment in ICT, training in ICT, and operational benefits obtained in the supply chain (SC). The model is validated with information obtained from 80 surveys applied to manufacturing companies in the municipalities of Ensenada, Mexicali, Tecate, and Tijuana in Mexico. The information is validated by the Cronbach alpha index for internal validity and the R-square index for predictive validity. Partial least-squares algorithms are used to validate the hypotheses in the model and the results indicate that the integration of technology is the basis for the success of the implementation of information technologies, and that the application of these guarantees the obtaining of operational benefits in the productive system.

1. Introduction

Currently, organizations manage their resources to be more competitive and stay in the globalized market by following several strategies, including the optimization of the supply chain (SC) [1], which is integrated by all those parties directly or indirectly involved in the satisfaction of a client’s request [2]. Here, there is an exchange of information with customers and suppliers, and a flow of materials and economic resources [3], which generates networks of companies, services, and production processes [4].
To achieve the above, effective communication and synchronization is required among members of the SC. Companies resort to the implementation of information and communication technologies (ICT), which are defined as a set of elements and techniques that allow the manipulation, storage, management, transmission, and facilitation of information through the use of computers, software, and computer networks [5].
One advantage of ICT is that they allow information to be processed and disseminated simultaneously and in real time [6], since they include integrated information systems, data exploration, and intelligent systems, among others. Specifically, the application of ICT in the SC can improve the speed of information exchange [7], which allows for greater agility and flexibility. Similarly, with the use of ICT, online commercial transactions (e-commerce) are carried out and, because of this, ICT is rapidly changing the conventional way to create business enterprises and SC management [8] while also diminishing SC uncertainty [9].
Another of the applications of ICT in SC refers to the integration of parties involved directly or indirectly in the satisfaction of a client, such as the reception and fulfillment of the client’s order [2]. Currently, there are reports relating to ICT importance applied to different stages in the SC; for example, Yunis et al. [10] report their application in innovation and how it can improve organizational performance, Moon et al. [11] report the use of ICT in outsourcing and safety programs, Martino et al. [12] report their application in risk reduction in the SC, and Yuce et al. [13] indicate the importance of ICT in detecting errors and defects for facilitating material flow along the SC.
Also, ICT applications associated to the services sector are widely reported; for example, Tob-Ogu et al. [14] report their use in road freight transport, Vogel [15] reports application in healthcare, and Alt [16] makes an analysis related to ICT uses in education and training. More specifically, ICT applications in sustainability are reported by Pattinson [17], which demonstrates the importance of this technology in sustainable operation, focusing on green production and social responsibility; Asongu et al. [18] report the special case of ICT application in the Sub Saharan region and Añón Higón et al. [19] report an important global analysis associated to ICT applied to environmental development.
On the other hand, some companies, due to the lack of ICT use, hardly survive in a global, dynamic, and changing market [20]. However, poor ICT integration in companies has caused many markets to be considered as volatile and turbulent, and this has led many organizations with reports of failures in their implementation to seek to improve their administration [21]. Likewise, these ICT facilitate SC management in companies that are geographically distributed in different countries and, in this context, Meindl and Chopra [22] declare that the exchange of information with appropriate technologies facilitates this process and, in turn, Avelar-Sosa et al. [23] mention that these ICTs favor SC integration with partners and that their implementation must be carefully planned.
Other benefits gained from ICT use in the SC refers to the flexibility and agility of a better response to clients, reduction of inventory, and improving the financial structure of the company [24]. However, Gunasekaran, McGaughey, Ngai, and Rai [8] declare that, when ICT is used, the complexity of the production process is diminished and Cachon and Fisher [25] mention that companies using ICT have more visibility in the SC, an easy material tracking process, and better resource optimization associated to the material flow. In addition, ICT provides an advantage associated with the reduction of inventories and improves the effectiveness of distribution channels [26]. Therefore, for the company to have a chance to survive and compete in the current global economy, the manufacturing sector needs to create, share, and disseminate information, as well as having up-to-date and adequate knowledge [27]. Finally, Valeria Martínez et al. [28] declare that ICT facilitates globalized and geographical distribution of production systems.
In this context, with the globalization phenomenon of production systems, many foreign companies are established in Mexico, which are commonly called maquiladoras. These companies import raw materials from other countries and export them as finished products, where they take advantage of the low cost of the workforce and their level of experience, proximity to markets, and tariff preferences, thus, requiring high levels of ICT integration to establish communication among subsidiaries, manage resources, and monitor the SC, among others. Specifically, in March 2018, there were 5118 maquiladora companies in Mexico, which directly employ 2,634,734 people who are users of high technological levels in their production and ICT processes. More specifically, in the Mexican state of Baja California, there are 911 maquiladora companies, which represents 17.79% of the national total and employs 246,190 people directly. Therefore, it is concluded that this industrial sector is of vital economic importance for the country and so the research question is: How are these maquiladora companies planning ICT implementation? Are the benefits offered by these ICT being obtained?
Unfortunately, there are not enough studies that address these questions for the maquiladora industrial sector, so the objective of this research is to know the planning process for ICT in SC and how are they gaining the operative benefits in the Mexican state of Baja California. To achieve this goal, the ICT implementation process was divided into three stages: Planning, execution, and control. This first informing is related activities associated to the planning stage, as well as the impact of ICT on the benefits gained.

2. Review of Literature and Hypothesis

Although the literature regarding ICT in SC is extensive, usually research focuses on some of the basic activities and external functions, such as decision making, inventory, and production programming, among others. According to Avelar-Sosa, García-Alcaraz, Cedillo-Campos, and Adarme-Jaimes [23] and Rai et al. [29], there are different aspects to consider in planning when integrating ICT in companies. According to the literature, there are some activities that are subjectively applied in the development of ICT integration in the SC and that are mentioned below.

2.1. ICT Integration

The support of top management ensures a correct integration of ICT in the administration of the company’s SC, which implies its good use in the decision making support system [30,31,32,33]. In this context, the studies of dos Reis and Freitas [31] and Kumar, Singh, and Shankar [33] argue that management commitment is crucial in the decision making of the SC, which is initiated by trust and a shared attitude, with the senior management team having primary responsibility to provide financial support and sufficient resources to integrate a functional system.

2.2. Investment in ICT

Investment in ICT is related to the use of capabilities and assets with partners in the SC [34]. The importance of investing in innovation to determine the success and competitiveness of an organization, in this sense, the planning of investment in ICT, has been underlined [35] when adopting a system of technological information is positive in the exchange of information in a timely and relevant manner [36]. Considering that the use of ICT in the productive processes and the SC of the company, as well as the demand for them, is affected by the amount of investment that is made in this area, the following hypothesis is proposed:
Hypothesis 1 (H1).
The needs of ICT integration in the SC have a direct and positive effect on investment in ICT.

2.3. Training in ICT

Training in ICT is an element that serves to disseminate important information about an information system that is implemented in an organization and how it fits into the organizational environment, allowing users to become familiar with the system and to make good use of it [31]. Therefore, it is observed that training is an important factor for the use of information systems looking for an internal cooperative environment in the use of the system, as well as a fluid communication within the company regarding the use of the software by means of the technical support after the sale [31]. In the work of Autry et al. [37], it is concluded that training in the use of ICT is fundamental in the beneficial operations of the company.
Therefore, it is concluded that the training of personnel is crucial. Personnel must be provided with the necessary knowledge to participate more actively in the system of continuous improvement. This increases confidence at work and helps the company to face new changes and to do them quickly [1,38]. Likewise, the work of Li and Lin [39] reveals that the management technology of education and training of personnel helps to integrate ICTs in SC activities. According to Fuentes et al. [40] and Llach and Alonso-Almeida [41], education and training supports the sharing of adequate information and is a great support for the content of technology management, which helps meet the needs of clients and suppliers; however, it is the responsibility of senior management to carry out these training plans and follow up on them. Based on the above, the following hypothesis is proposed:
Hypothesis 2 (H2).
The needs of ICT integration in the SC have a direct and positive effect on the training in ICT required for them.
However, not all ICT have the same forming and training needs and, in this sense, Ngai and Gunasekaran [42] identified that to implement ICT favorably in the activities of the SC, it is necessary to invest; in other words, Investment in ICT refers to the purchasing of computer equipment, software, and media [43]. Therefore, investing in ICT will increase productivity, but it is also necessary to train staff in new technologies at the business level [43]. Training is important given that investment in ICT is often complemented by changes in the content and organization of workplaces in companies [44]. Nowadays, companies are more likely to invest in ICT when the proportion of unskilled workers is lower, which suggests that technology and digital skills are complementary [45], meaning that investment in ICT allows users to share access to databases, interconnect their workplaces with better communication, and coordinate business processes with suppliers and clients. Based on the above, this hypothesis is proposed:
Hypothesis 3 (H3).
Investment in ICT in a SC has a direct and positive impact on training in ICT that occurs in its use and management.

2.4. The Operational Benefits of ICTs Integration

According to Fuentes, Jurado, Marín, and Cámara [40], the benefit of the company is measured objectively and subjectively by integrating ICT. That is, operational benefits are reflected by the performance of the company. Kumar, Singh, and Shankar [33], Devaraj et al. [46], and Zailani et al. [47] mention that the performance of the company helps to reduce costs, to deliver complete information, rotation, and control of inventories, to maintain flexibility in shipping orders, and to have a quality service for the customer. In other words, by integrating ICT into activities, the SC is benefited in the reduction of cycles time, greater flexibility in orders and deliveries, improvement in the administration of suppliers and clients, decrease in inventory levels, and support in the exchange of information [48]. In addition, when top management plans to integrate ICT into processes, the company benefits significantly in internal communication, reduced transaction costs, greater interaction with clients and suppliers, increased productivity, stimulated internal communication, greater operational efficiency and process improvement, greater access to information on market needs, and, therefore, better quality, reliability, and accuracy of the information is obtained, which allows appropriate decision making, leading to a competitive advantage [32,49,50]. Based on the above, the following hypothesis is proposed:
Hypothesis 4 (H4).
ICT integration needs have a direct and positive effect on the operational benefits obtained by the company.
Investment in ICT affects the performance of the company so top management can plan and control operations, indicating that investments in ICT brings a competitive performance in the market and implies investing in equipment. Studies show that it is a recoverable investment, if its use is optimized [51]. When investing in ICT, the company has greater benefits in better management and the availability of information in the activities of the company, allows the exchange of information with clients and suppliers, helps to learn new methods to organize the company, perform operations in real time, better inventory management, helps streamline processes and flexibility [52], and reduces times [53]. In conclusion, investment in ICT is reflected as a beneficial resource to improve competitiveness [35]. Taking into account these ideas, the following hypothesis is proposed:
Hypothesis 5 (H5).
The amount of investment in ICT has a direct and positive effect on the operational benefits obtained by the company.
Training in ICT is a fundamental part of any process in companies where the best performance of activities is sought. Workers must be motivated when seeking cooperation from employees, trying to increase confidence in work as otherwise ICT will not help improve organizational competitiveness [54,55]. It is desired that human resources have adequate training in terms of knowledge and management of ICT to seek beneficial operations of the company. This means that the training in ICT helps to obtain access to more information, obtain better internal communication, encourage interaction with clients and suppliers, and reduce costs, which allows appropriate decisions to be made [49]. Based on the above, the following hypothesis is proposed:
Hypothesis 6 (H6).
Training in ICT use and management has a direct and positive effect on the operational benefits obtained by the company.
In Figure 1, the hypotheses in which the analysis variables are related in this research are graphically represented.

3. Methodology

The methodology for the validation of the hypotheses presented in this study consists of 5 stages. According to the objective that has been set for this research, a questionnaire was designed to collect data, the questionnaire was applied and validated, a descriptive analysis of the sample was done, then, a descriptive analysis of items was carried out, and, finally, the hypotheses were validated with a structural equation model. Next, the different stages of this work are described.

3.1. Build Questionnaire

In this stage, we seek to obtain a questionnaire that serves as a tool to collect the appropriate information and to know the perceptions of the use of ICT in SC by companies located in the state of Baja California, Mexico. Therefore, for the structure and elaboration of the questionnaire, the following databases were consulted: Emerald, EBSCO, Elsevier, SpringerLink, and a search engine called Google Scholar, where the selection of research works was done by using connectors, such as: Small and medium-sized enterprises (SMEs), information technology (IT), information and communication technology (ICT), and supply chains (SC). The initial list covered 145 articles reviewed in the mentioned databases and, due to the multidisciplinary nature of ICT performance, it was reduced to only 55. For this search, in each of the databases, the following inclusion criteria, written in English and the type of journal, were considered.
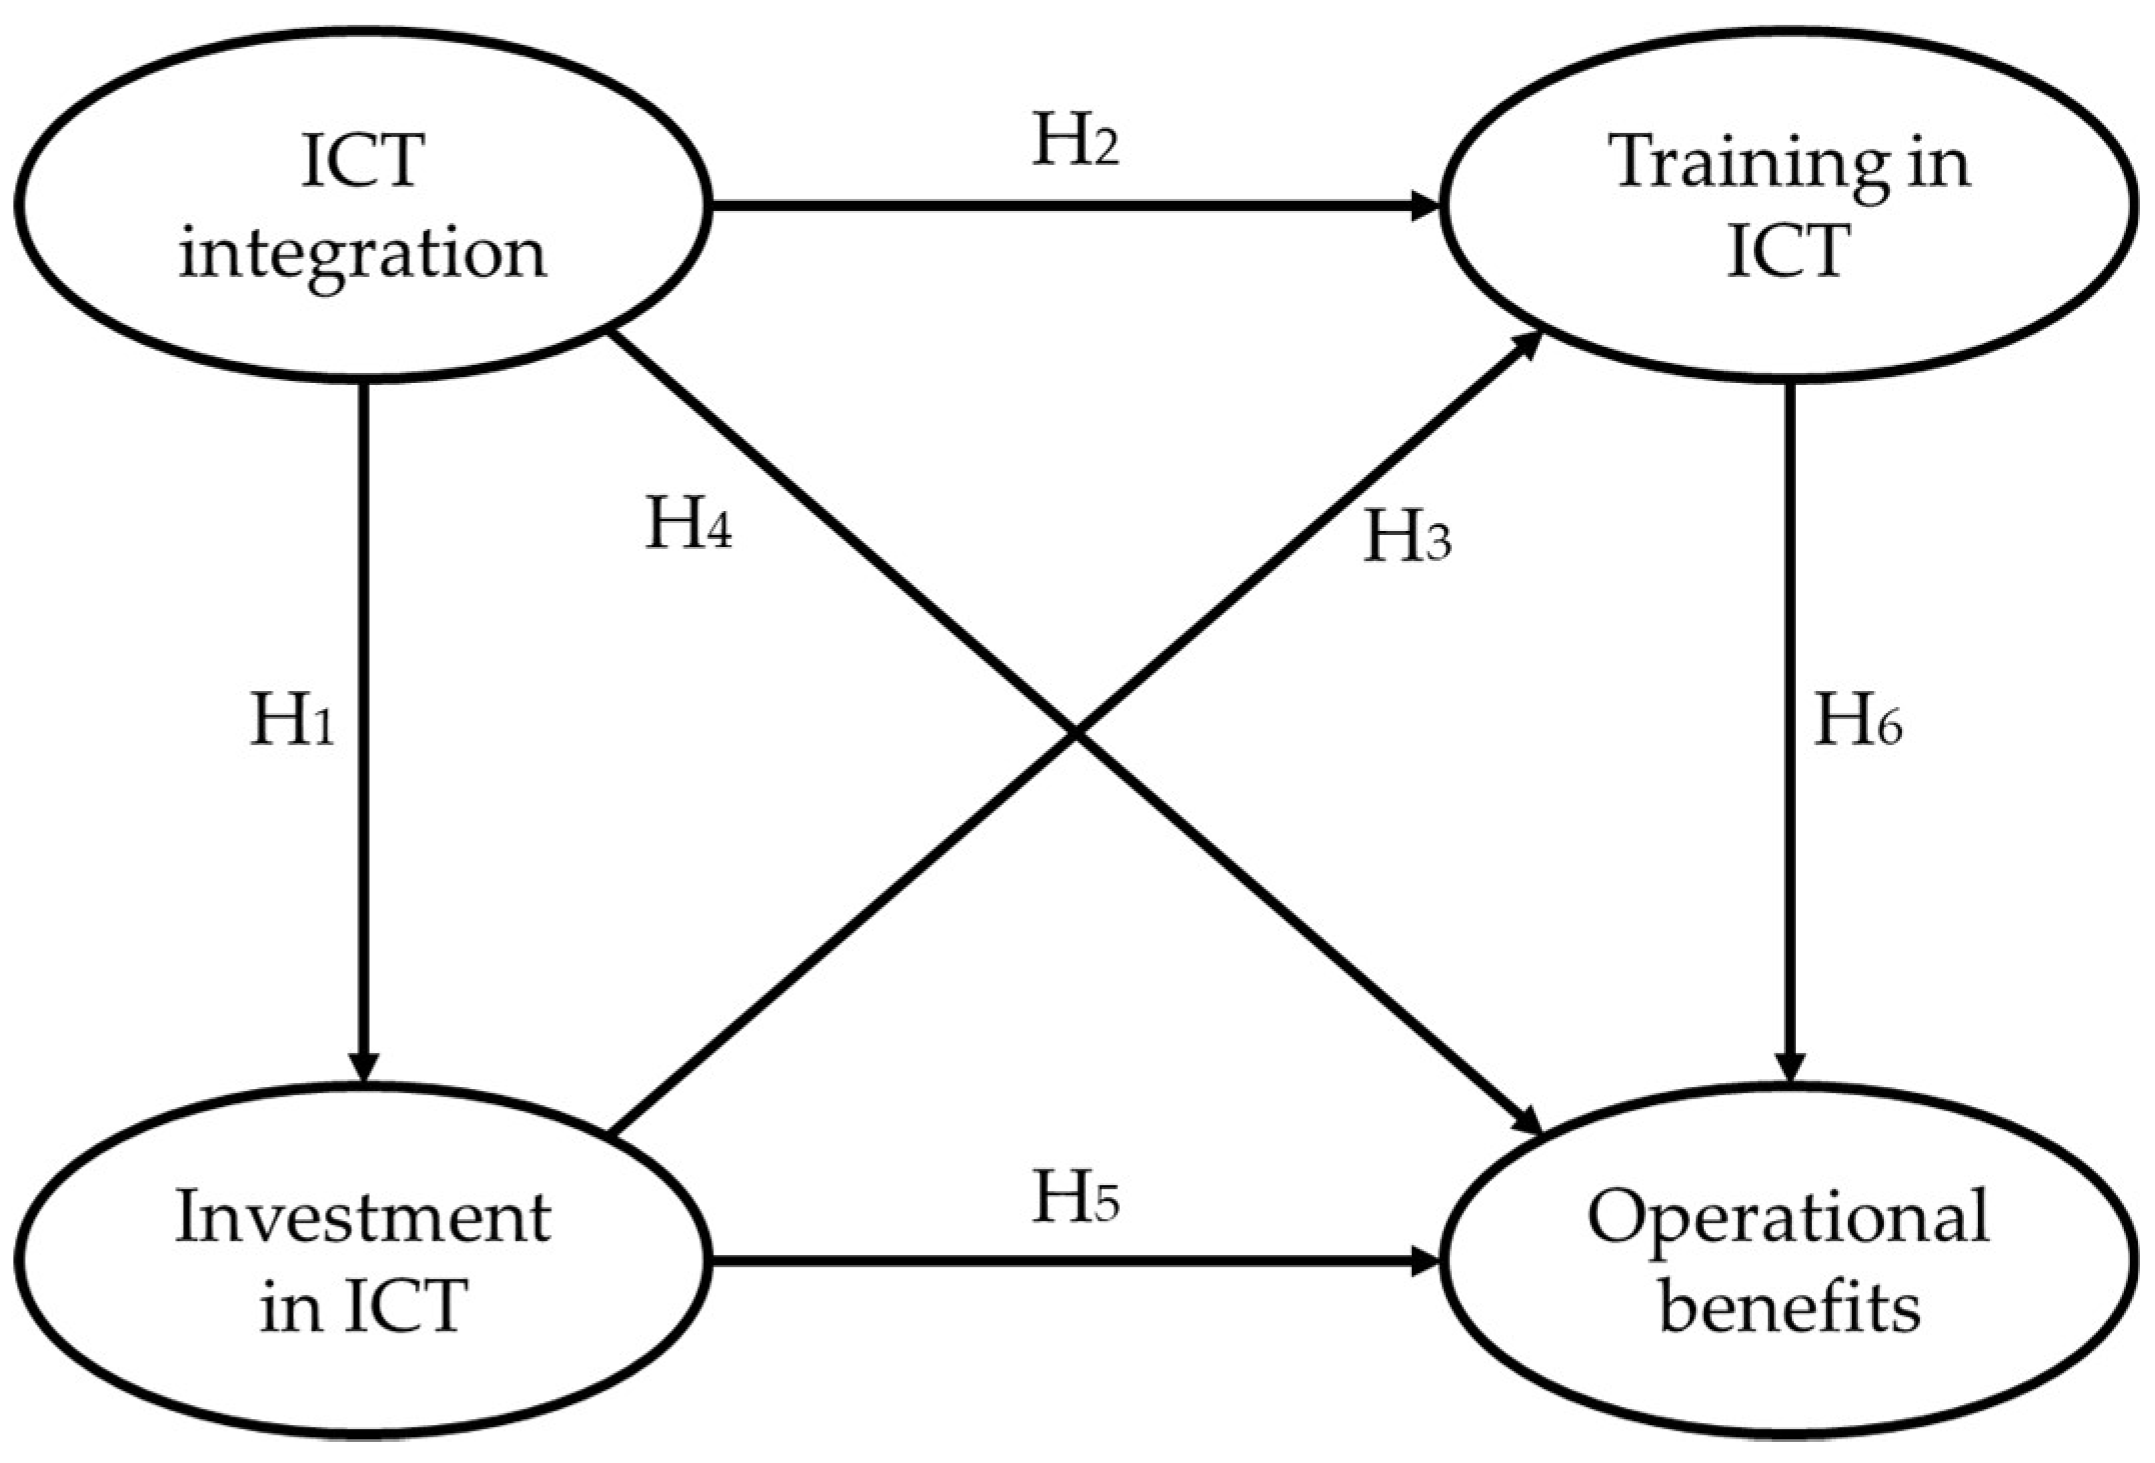
Once the works related to research were selected, the questionnaire was divided into 6 sections: The first consists of general information of the company surveyed and of the person responsible for filling it out, which also allows knowledge to be gained about other things, such as the industrial sector to which it belongs, the profile of the respondent, and the time of permanence in that position; from the second to the fourth section, information was collected about planning, execution, and control, respectively (stages in ICT implementation); the fifth and sixth sections were related to the benefits, having a total of 91 items (activities and benefits). However, it is important to mention that, in this research, only the items corresponding to the planning stage were reported, which consists of four latent variables: ICT integration, investment in ICT, training in ICT, and operational benefits. From the literature, it is determined that the items that help measure the variables that make up the model in Figure 1 are those listed below:
  • ICT integration [32,56]:
    • Use of ICT in periodic meetings;
    • use of ICT in the activities of the company;
    • use of ICT in changes within the company;
    • use of ICT in business processes;
    • use of ICT in decision making; and
    • use of ICT in the investment of new products.
  • Investment in ICT [30,33,34,36,43,51]:
    • Sufficient computer equipment in your organization;
    • sufficient ICT professionals in your organization;
    • knowledge required for the use of ICT;
    • developer available to give support in the software;
    • retrieve information about suppliers, clients, and competitors; and
    • collect and process the data to know the needs of the client.
  • Training in ICT [31,55,57]:
    • Training for the users of the information technology about the changes, skills, and importance of the accuracy of the data and responsibilities;
    • training for the users of the information system with regular assistance by a formal training program that meets the required requirements; and
    • training for the users of the information system with training teams for each job.
  • Operational benefits [32,33,40,46,47,49]:
    • Flexibility in systems to meet clients’ needs;
    • strengthen the relationship with suppliers;
    • cost competitiveness;
    • shorter order cycles; and
    • flexibility of response to the client.

3.2. Application and Capture of Information

To apply the questionnaire, a letter was prepared addressed to the main manufacturing chambers of commerce in the state of Baja California, Mexico, given that, through this agency, the largest number of manufacturing companies in the region could be encompassed. This letter explained the objective of the study and the scope that is intended to be obtained. The survey was digital and was designed with the Google Docs computer tool in such a way that the user would respond quickly and dynamically.
Responses were in a Likert scale [58] with values between one and five, with one indicating that the activity is not performed or that the benefit is not obtained, and a five indicating that the activity is always carried out or that the benefit is always obtained [59]. This scale has been used in productivity and manufacturing in recent research [23,54,60,61].
A database with the statistical software SPSS 23® (IBM, Armonk, New York, USA), which groups and represents information in an orderly manner, thus, allowing the identification of characteristic aspects of the behavior of the treated data [62].

3.3. Debugging the Information Base

Once the information was obtained, it was captured as a database and the initial debugging of the data was done with EXCEL, which is part of the Office package software, and an analysis of the data was also carried out. The process for the debugging was to identify the questionnaires with duplicate answers, then the missing values were replaced by the median, and, finally, the extreme values were eliminated [63]. The first step was to estimate the variance by line, where values equal to zero were searched and, therefore, eliminated [64].
The next step was to replace the missing values. The median of each item was calculated, and then the empty cells were replaced with the median value in the corresponding column. The median and range are appropriate parameters for analyzing data based on the Likert scale due to the ordinal nature of the data, which is the case for the present study [65]. Finally, to eliminate any possible extreme values in the sample, the median and the interquartile range were obtained for their analysis.

3.4. Validation of the Variables

Validation of the captured information was carried out to determine if it is reliable, given that it is useless to generate a model if the information is not reliable [60]. For the validation of latent variables, the following indexes were used [66]:
  • R squared and R squared adjusted to measure parametric predictive validity, and values higher than 0.2 were accepted;
  • Q squared to measure nonparametric predictive validity, and values greater than zero and similar to square R were accepted;
  • Cronbach’s alpha and composite reliability index to measure the internal validity of the variables, and values greater than 0.7 were accepted;
  • average variance extracted for convergent validity, and values greater than 0.5 were accepted; and
  • variance inflation index to measure collinearity, and values less than 3.3 and up to 5 were accepted.

3.5. Descriptive Analysis of the Simple

Once the data was obtained, a descriptive analysis was carried out where the behavior of the collected information was appreciated. The SPSS 23 ® software, which groups and represents the information in an orderly manner, allows identification of the characteristic aspects of the behavior of the data treated [62]. This description refers to the sample where the years of experience of the respondents are detailed, the position they occupy in the organization, the sector that the company belongs to, and the number of employees currently working, among others.

3.6. Descriptive Analysis of Items

By means of each of the items in the questionnaires, the central tendency and dispersion of the data was analyzed. In this investigation, the median was obtained as a measure of central tendency, given that these data were obtained on an ordinal scale with values from one to five, and represent only assessments [67]. The arithmetic mean could not be used because the values were not on an interval scale [54] and, as a measure of dispersion, the interquartile range of each item was estimated.

3.7. Structural Equation Model (SEM)

Specialized software called WarpPLS 6.0® (ScriptWarp Systems, Laredo TX, USA) was used to evaluate the SEM in Figure 1 because it uses algorithms based on partial least squares regression (PLS), as recommended for small samples by [66].

3.7.1. Efficiency Ratios Model

To evaluate the SEM and to know if it is feasible to interpret it, the following efficiency ratios were evaluated [54,66,68]:
  • The average path coefficient (APC), if the model is efficient and if it has predictive validity, it was estimated statistically with a p-value equal to or less than 0.05;
  • average R-square (ARS) is a measure of the explanatory power of a model; it was statistically tested with a p-value equal to or less than 0.05;
  • average adjusted R-squared (AARS), in general measures the prediction and explanation of the model; it was statistically tested with a p-value equal to or less than 0.05;
  • the average variance inflation factor (AVIF) measures the phenomenon of collinearity between the underlying variables; the ideal value was less than 3.3;
  • the complete collinearity index VIF (AFVIF) measures the collinearity between internal factors, with values less than 3.3 being accepted;
  • Tenenhaus Index (GoF) measures the fit of the data to the model; the appropriate value was greater than 0.36, medium if it was less than 0.25, and small if it was less than or equal to 0.01;
  • Simpson’s Paradox Ratio (SPR), helps to know that the meanings of the relationships were not wrong, with values above 0.7 being accepted;
  • index of the of R-squared contribution ratio (RSCR) is a measure that expresses that the model is free of negative R-squared values; values greater than or equal to 0.9 were accepted;
  • index of the statistical suppression ratio (SSR) is a measure that indicates that the relationship between the variables is positive, with values greater than or equal to 0.7 being accepted; and
  • index of the non-linear bivariate causality direction ratio (NLBCDR) is used to measure if the directionality between the latent variables is correct, with values greater than or equal to 0.7 being accepted.

3.7.2. Effects of the Model

To indicate the relationships that exist between the latent variables that make up the model, the impact between them was measured; these effects were validated by considering the following hypothesis in each parameter value:
H0: βi = 0 
H1: βi ≠ 0
The relationship between latent variables was measured in different effects, which are [60,68]:
  • Direct effects [60,69] were the effects that indicate the impact between the latent variables, referring to the initial hypotheses in Figure 1;
  • the indirect effects [70] were the indirect impact that exists between the variables, that is, they occur through a third variable, therefore, at least two segments or more were used [60]. Therefore, the indirect effect between two variables is given through a mediating variable.
  • Total effects, these represent the arithmetic sum of the direct and indirect effects of each of the relationships [71].

4. Results

In this results section, the evidence of the validation of the hypotheses between variables, the descriptive analysis of the sample, and a descriptive analysis of items of the information obtained, as well as the adjustment of the model of structural equations obtained, is discussed.

4.1. Descriptive Analysis of the Sample

After the process of data cleansing, we worked with 80 valid surveys from different manufacturing companies in the state of Baja California, Mexico. Table 1 shows the descriptive analysis of the sample, with the industrial sector of the companies surveyed being indicated. It was observed that the manufacturing industry is the most representative with 45% participation and that, joining the sectors of the food industry, as well as the manufacturing of garments, computer equipment, and electronic accessories, have 35% participation; the rest of the sectors have 20%. In the workplace, supervisors stand out with 44% participation, followed by managers with 30%, and, finally, department heads with 26%. Table 2 shows the years in the job, with the majority those who have less than two years in the position (37%), then those who have two to four years in the workplace (33%), and workers with more than five years of experience (24%). Men had a greater participation with 68% and, consequently, women only had 32% participation. It should be noted that all the respondents were working in the Logistics area.

4.2. Validation of Variables

According to the results obtained, the values of the coefficients of the latent variables are shown in Table 3, where it is observed that the adjusted R-squared and R-squared indexes are greater than or equal to 0.2, therefore, it is concluded that each of the variables had parametric predictive validity. When reviewing the reliability index and the Cronbach alpha, it is observed that all the variables have values higher than 0.7 and, therefore, there is internal validity. In the same way, the average of variance extracted in all the variables was greater than 0.5 and, therefore, the conclusion that there is sufficient convergent validity. In the same way, the inflation index of variance indicates that there are no problems of collinearity, with the latent variables having a value less than 3.3., and, finally, in the Q-squared index, all the variables were greater than zero and, therefore, have non-parametric predictive validity. It is important to mention that during this validation process a case has been eliminated, given that the variance of the emitted values was zero.

4.3. Descriptive Analysis of Items

The results of the descriptive analysis of items are shown in Table 4 where the median and the interquartile range are exposed. In the column corresponding to the median, there are nine items with a value greater than four, which means that, according to the perceptions of the respondent, these activities are important and are frequently carried out in the companies. In the column corresponding to the interquartile range, an attribute with the highest value of 2252 is shown; this means that there were probably doubts when interpreting the question about a developer that gives support in the software and that is the reason why it has a lot of variability. In the same column, there is an item with the lowest value of 1500, which refers to the use of ICT in the activities of the company; in other words, there was much concordance and consensus among the respondents for this attribute.

4.4. Model Efficiency Index

To measure the efficiency of the SEM proposed in Figure 1, a series of indexes must be estimated to know the suitability of this. The results of the efficiency indexes are illustrated in Table 5, where the APC has a p-value less than 0.001, so, it is concluded that, statistically, the model is efficient and has predictive validity. In the same way, the average R-square [25], with a p-value less than 0.001, was estimated, concluding that the model has sufficient explanatory power. In the same context, the index of the average adjusted R-squared (AARS) has a p-value less than 0.001, statistically concluding that the model in general has a predictive validity and explanation of the model.
When reviewing the average variance inflation of blocks (AVIF), it is observed that there are no problems of the collinearity phenomenon among the variables analyzed, given that it has a value less than 3.3. Similarly, the average full VIF (AFVIF) shows that there is no collinearity among the internal factors, having a value less than 3.3. Also, the Tenenhaus index (Gof) shows the adjustment of the data to the model with an adequate value, given that it is greater than 0.36. Finally, the other indexes indicate that the sense in which the hypotheses have been raised in the model is adequate, since they are greater than 0.7. The results of the model obtained are illustrated in Figure 2.

4.5. Model Effects

With the help of the WarpPLS 6.0® software, at the time of modeling, three types of effects were obtained in this study: The direct effects to test the hypotheses proposed, the sum of the indirect effects, and the total effects.

4.5.1. Direct Effects

Based on the direct effects and β values in Figure 2, we can conclude, in relation to the hypotheses, the following:
Hypothesis 1 (H1).
There is enough statistical evidence to state that the needs of ICT integration in the supply chain have a direct and positive effect on investment in ICT, given that when the first variable increases its standard deviation by one unit, the second variable increases by 0.67 units.
Hypothesis 2 (H2).
There is enough statistical evidence to state that the needs of ICT integration in the SC have a direct and positive effect on the training in ICT required in them, given that when the first variable increases its standard deviation by one unit, the second does so in 0.35 units.
Hypothesis 3 (H3).
There is enough statistical evidence to state that the investment in ICT in a supply chain has a direct and positive impact on the training in ICT that occurs in its use and handling, given that when the first variable increases its standard deviation by one unit, the second does it in 0.50 units.
Hypothesis 4 (H4).
There is enough statistical evidence to state that the needs of ICT integration have a direct and positive effect on the operational benefits obtained by the company, given that when the first variable increases its standard deviation by one unit, the second variable does so by 0.27 units.
Hypothesis 5 (H5).
There is enough statistical evidence to state that the amount of investment in ICT has a direct and positive effect on the operational benefits obtained by the company, given that when the first variable increases its standard deviation by one unit, the second variable increases by 0.31 units.
Hypothesis 6 (H6).
There is not enough statistical evidence to state that training in ICT use and management has a direct and positive effect on the operational benefits obtained by the company, given that the associated p-value is 0.05.
A summary of the information obtained in the direct effects is shown in Table 6, where the effect size is also added with a p value as a statistical test for the β value.

4.5.2. Sum of Indirect Effects

In the model proposed in Figure 1, the sum of the indirect effects of each of the indirect relationships between the latent variables is also estimated, which are shown in Table 7. In the indirect relationship between ICT integration and training in ICT, there was an effect, β = 0.338, with a p-value of p ≤ 0.001, concluding that it is statistically significant and, therefore, there is an indirect relationship between the variables as the p-value is less than 0.05. It is the same case for the relationship of ICT integration to operational benefits, where the value of the effect is β = 0.313 and the value of p-value is p = 0.001, where it is observed that the p-value is less than 0.05, concluding that it is statistically significant and there is an indirect relationship between the variables. The opposite happens with the indirect relation of investment in ICT to operational benefits, where values of the effect of β = 0.078 were obtained and with a p-value of p = 0.158, where the p-value is greater than 0.05; it is concluded that it is not statistically significant and, therefore, there is no indirect relationship between these variables.

4.5.3. Total Effects

The sum of the total effects is the sum of the direct effects and the indirect effects that were exposed previously. The values of the total effects, the estimate of the p-value, and the size of the effect are shown in Table 8. Shown as an example, from ICT integration to training in ICT, there is an effect of 0.687 (which was calculated with the sum of 0.349 + 0.338), with a p-value less than 0.05, statistically concluding that there is a significant total effect between the variables. The calculation of the other total effects is carried out in the same way and it should be mentioned that the p-value for the other relations between the factors is less than 0.05. The opposite happens with the variables of training in ICT and operational benefits, where there is a total effect of 0.156 with a p-value equal to 0.074; it is concluded that there is no total indirect effect between the variables.
In relation to the value of R2 in Figure 2, this indicates the percentage of the variance explained by each latent variable, which is expressed as follows according to each of its value. For the investment in ICT, a value of R2 = 0.455 was obtained, which indicates that 45.5% of the variance of this variable is explained by the ICT integration. For the TIC training variable, the value of R2 = 0.60 was obtained, indicating that 60% of the variance is explained by the variables ICT integration and investment in ICT. For the operational benefits variable, there is an R2 = 0.43, which indicates that 43% of the variance is explained by the ICT integration, investment in ICT, and training in ICT. Therefore, the values of the R-squared coefficient have a considerable percentage and it can be mentioned that they are good predictors of the latent variable in the model.

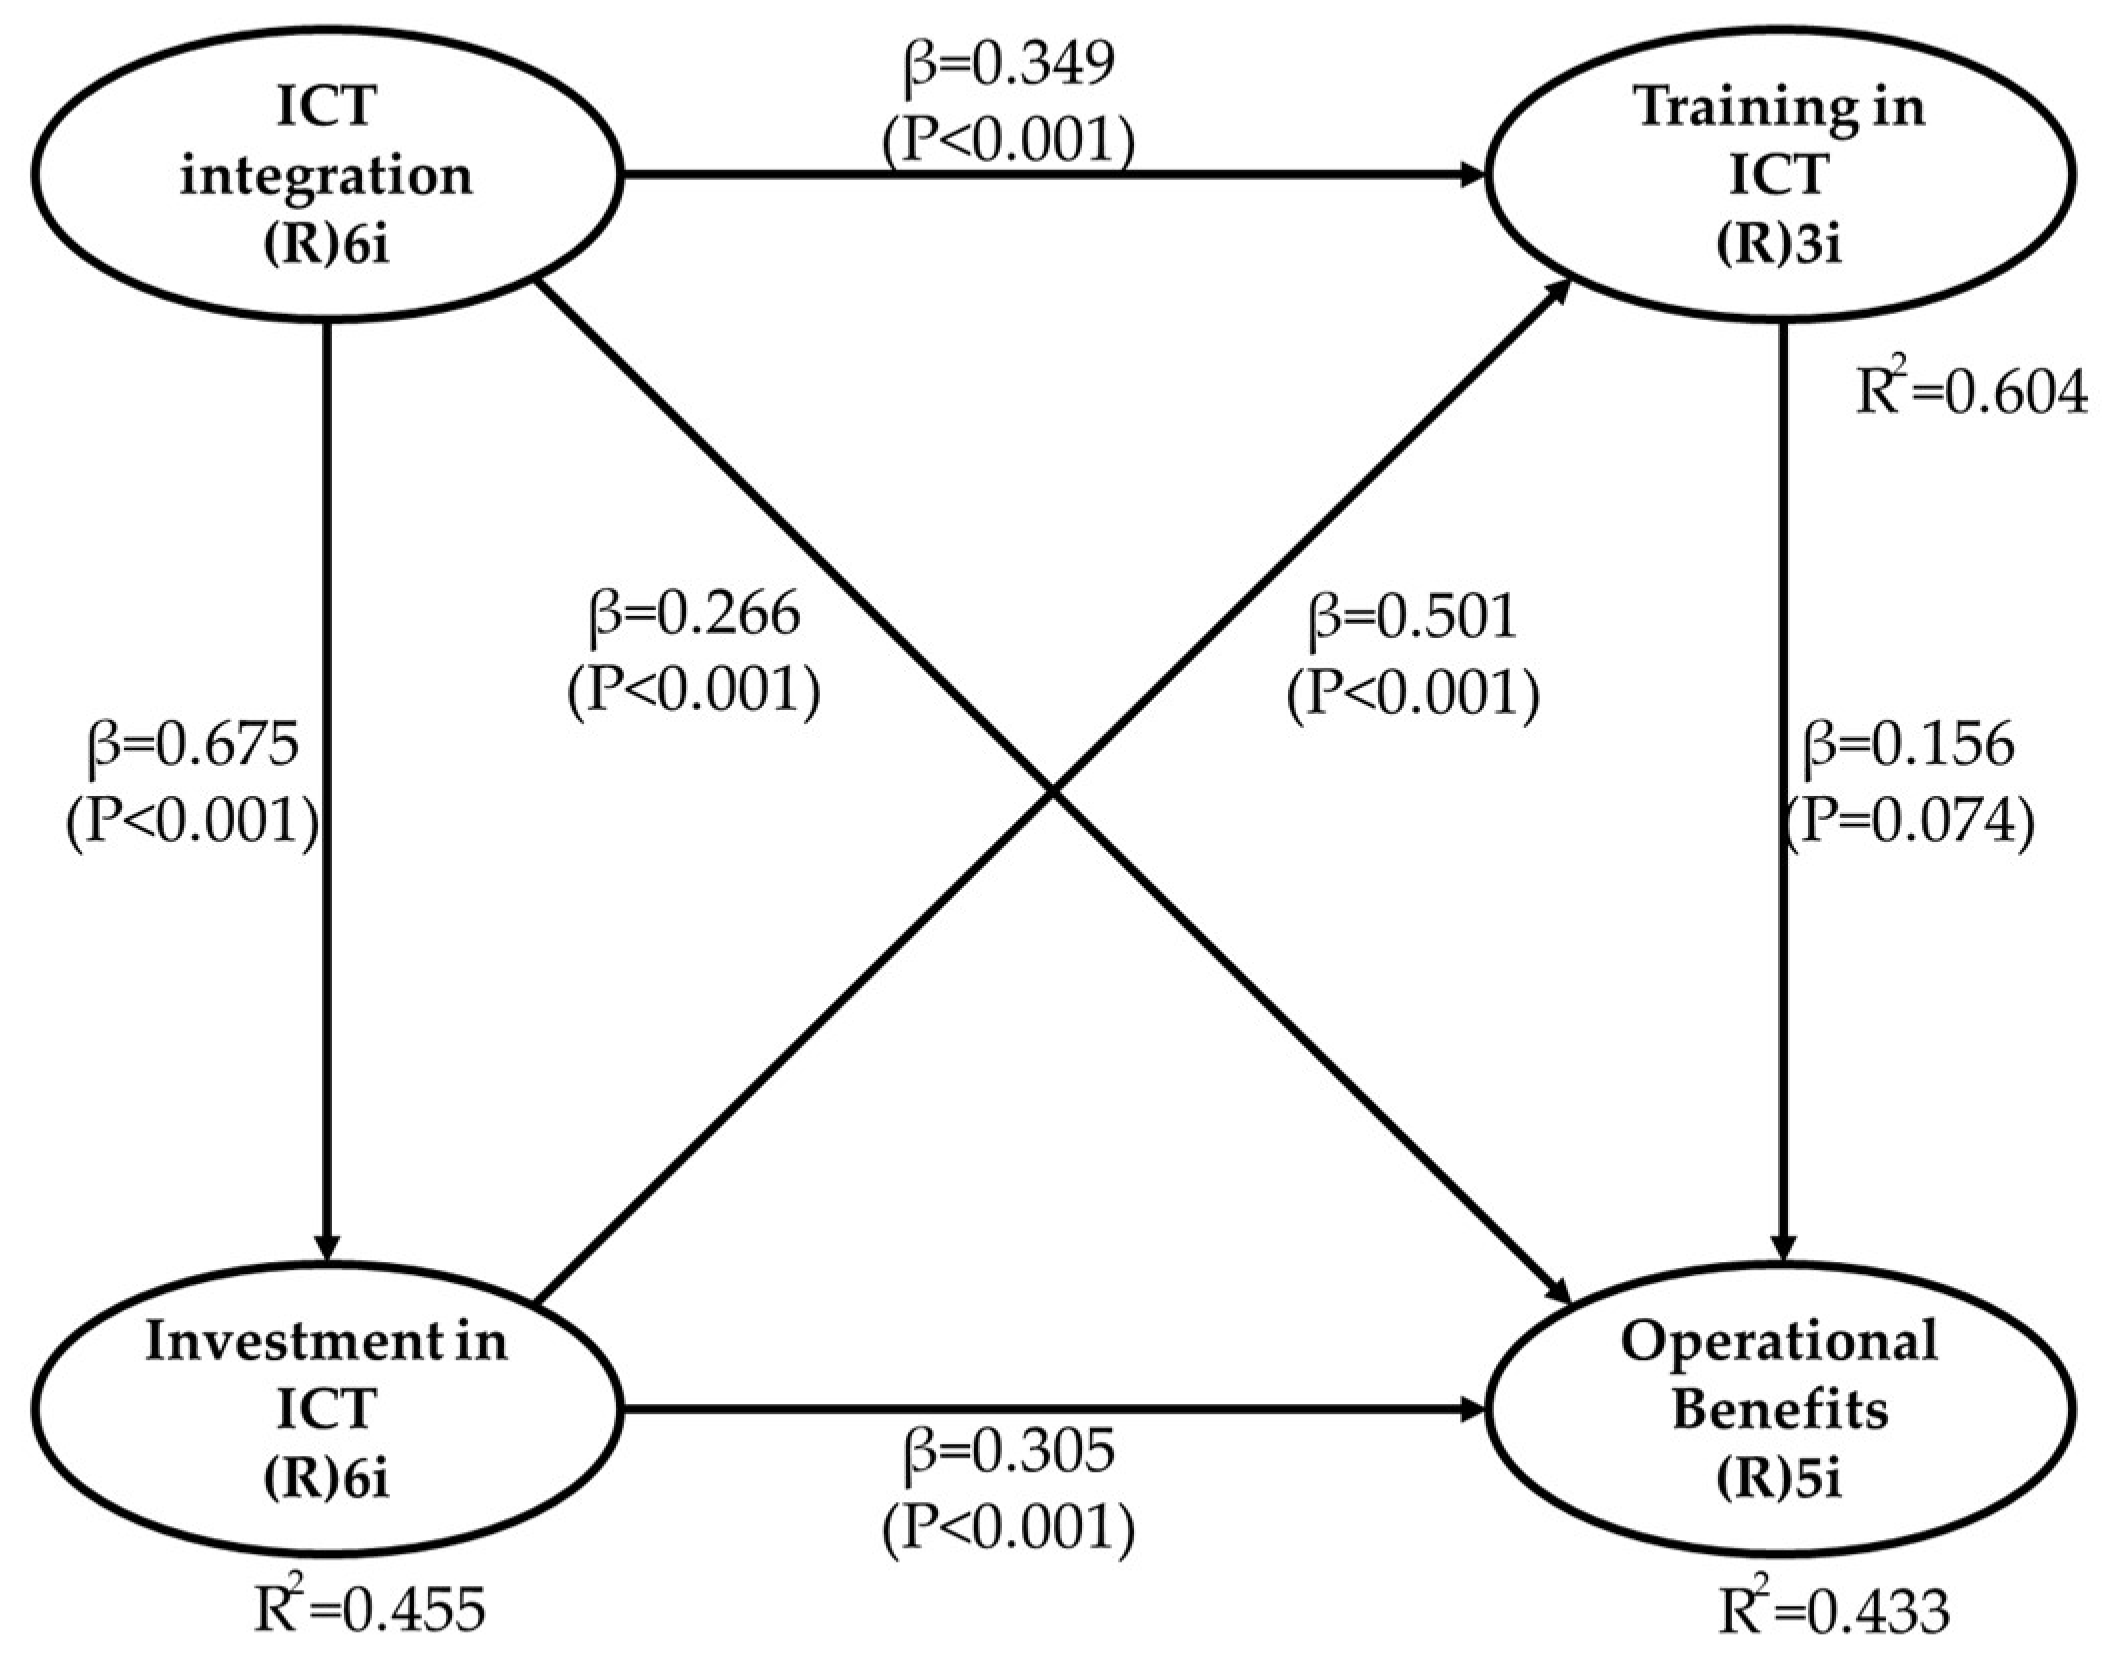
5. Discussion and Conclusions

Table 9 shows a summary of the six hypotheses proposed, with which this work concludes that the companies in Baja California, Mexico must pay attention to the ICT integration process in SC activities, since this will affect investment in ICT. That is, nowadays, companies handle a greater volume of information that is more complex, and, consequently, decision making is more confusing, which implies investing in technology to organize and manage information in a timely and reliable manner. Within the same needs to integrate ICT in production processes, it was found that it directly affects training in ICT, which implies that management must train staff on the use of computer equipment and software and this research has similar conclusions to Kiritsis et al. [72], who stated that training in ICT is important for guaranteeing performance.
At the same time, it is recommended that when investing in ICT, training in ICT is considered, given that this variable is affected by investment in technology, which means that not only should there be investment in ICT, but also the company must work hard to train the staff to manage, program, and maintain the specialized software, resulting in greater confidence to solve the existing needs of the productive processes. This finding is similar to reports from Skorupinska and Torrent-Sellens [73] who argue that ICT is associated to productivity and innovation. Within the same results, it was found that the variable of ICT integration directly affects the variable of operational benefits, where the company benefits in reducing costs in inventory, greater flexibility in orders and deliveries, greater interaction with clients and suppliers, and the reliability and accuracy of the information, gaining a competitive advantage for the organization. This mean that managers must make an effort to integrate ICT in SC because, according to Arica and Powell [74], ICT allows the planning and control of all the production process. In the same sense, it was found that the company must take into account the investment in ICT variable, since it directly affects operational benefits, which means that the activities of the SC that are carried out in the company make up a clear and precise information system, allowing quick and reliable exchange of information and knowing the status of processes in real time and with better inventory management; these benefits are reflected in greater competitiveness to make better decisions for the organization. The results also showed that the company must consider that the training in ICT variable does not directly affect operational benefits, but is, nevertheless, part of the indirect effects of the variables, ICT integration and investment in ICT.
Some final industrial recommendations for managers are as follows:
  • Managers must maintain an adequate technological level in their supply chain. Not always the most advanced ICTs are what they need, and they should always make an effort to be able to determine their needs in the handling and sharing of information among partners;
  • strong investments in ICT in the supply chain can be responsible for the bankruptcy of the company. The manager must ensure that all ICT functions are exploited for the benefit of the company, since an investment in ICT that is underutilized is a risk to financial performance; and
  • training is basic after an ICT investment and managers must ensure that the technology provider offers the first training in the production system and must be established in a contract. The training ensures that ICTs are given the best use and the risk of failure in the implementation process is reduced.

Author Contributions

The five authors participated in this manuscript. C.C.-W. made the questionnaire design and validation. R.J.P.-L. and J.E.O.-T. made the data analysis. R.J.P.-L. and J.L.G.-A. developmented the methodology and the validation of the structured equation model. R.J.P.-L. and J.A.L.-B. made the final revision of the document and the corrections.

Funding

This research received support from Program for Professional Teacher Development (PRODEP).

Acknowledgments

The authors acknowledge the Mexican National Council for Science and Technology (CONACYT).

Conflicts of Interest

The authors declared no conflict of interest.

References

  1. Lotfi, Z.; Sahran, S.; Mukhtar, M. A product quality—Supply chain integration framework. J. Appl. Sci. 2013, 13, 36–48. [Google Scholar] [CrossRef]
  2. Meindl, P.; Chopra, S. Administración de la cadena de suministro. In Estrategia, Planeación y Operación, 3rd ed.; Peter Pearson Educación: New York, NY, USA, 2008. [Google Scholar]
  3. Datta, P.P.; Christopher, M.G. Information sharing and coordination mechanisms for managing uncertainty in supply chains: A simulation study. Int. J. Prod. Res. 2011, 49, 765–803. [Google Scholar] [CrossRef]
  4. Sosa, M.L.A.; Alcaraz, J.L.G.; de la Hoya, E.S.; Contreras, J.O. La cadena de suministro: Atributos y evaluación del desempeño revisión bibliográfica. Acad. J. 2012, 4, 1948–2353. [Google Scholar]
  5. Shirazi, F. Information and communication technology and women empowerment in Iran. Telemat. Inf. 2012, 29, 45–55. [Google Scholar] [CrossRef]
  6. Apulu, I.; Latham, A. Drivers for information and communication technology adoption: A case study of Nigerian small and medium sized enterprises. Int. J. Bus. Manag. 2011, 6. [Google Scholar] [CrossRef]
  7. Yanhuia, J.; Xiana, L. A study on supply chain information integration of commodity circulation based on grid. Procedia Eng. 2012, 29, 553–557. [Google Scholar] [CrossRef]
  8. Gunasekaran, A.; McGaughey, R.E.; Ngai, E.W.; Rai, B.K. E-procurement adoption in the southcoast smes. Int. J. Prod. Econ. 2009, 122, 161–175. [Google Scholar] [CrossRef]
  9. Fera, M.; Fruggiero, F.; Lambiase, A.; Macchiaroli, R.; Miranda, S. The role of uncertainty in supply chains under dynamic modeling. Int. J. Ind. Eng. Comput. 2017, 8, 119–140. [Google Scholar] [CrossRef]
  10. Yunis, M.; Tarhini, A.; Kassar, A. The role of ICT and innovation in enhancing organizational performance: The catalysing effect of corporate entrepreneurship. J. Bus. Res. 2018, 88, 344–356. [Google Scholar] [CrossRef]
  11. Moon, J.; Lee, C.; Park, S.; Kim, Y.; Chang, H. Mathematical model-based security management framework for future ict outsourcing project. Discret. Appl. Math. 2018, 241, 67–77. [Google Scholar] [CrossRef]
  12. Martino, M.; Fera, M.; Lannone, R.; Miranda, S. Supply chain risk assessment in the fashion retail industry: An analytic network process approach. Int. J. Appl. Eng. Res. 2017, 12, 140–154. [Google Scholar]
  13. Yuce, B.; Mastrocinque, E.; Packianather, M.S.; Pham, D.; Lambiase, A.; Fruggiero, F. Neural network design and feature selection using principal component analysis and taguchi method for identifying wood veneer defects. Prod. Manuf. Res. 2014, 2, 291–308. [Google Scholar]
  14. Tob-Ogu, A.; Kumar, N.; Cullen, J.; Ballantyne, E. Sustainability intervention mechanisms for managing road freight transport externalities: A systematic literature review. Sustainability 2018, 10, 1923. [Google Scholar] [CrossRef]
  15. Vogel, D. Adults use of ICT in healthcare: The persuasive impact of children. Procedia Comput. Sci. 2016, 98, 236–242. [Google Scholar] [CrossRef]
  16. Alt, D. Science teachers’ conceptions of teaching and learning, ict efficacy, ict professional development and ict practices enacted in their classrooms. Teach. Teach. Educ. 2018, 73, 141–150. [Google Scholar] [CrossRef]
  17. Pattinson, C. ICT and green sustainability research and teaching. IFAC PapersOnLine 2017, 50, 12938–12943. [Google Scholar] [CrossRef]
  18. Asongu, S.A.; Le Roux, S.; Biekpe, N. Enhancing ICT for environmental sustainability in sub-saharan Africa. Technol. Forecast. Soc. Chang. 2018, 127, 209–216. [Google Scholar] [CrossRef]
  19. Añón Higón, D.; Gholami, R.; Shirazi, F. ICT and environmental sustainability: A global perspective. Telemat. Inf. 2017, 34, 85–95. [Google Scholar] [CrossRef]
  20. Nguyen, T.H.; Newby, M.; Macaulay, M.J. Information technology adoption in small business: Confirmation of a proposed framework. J. Small Bus. Manag. 2015, 53, 207–227. [Google Scholar] [CrossRef]
  21. Ariza, A.P.G.; Müller, R.; Stephan, R.; Wollenschläger, F.; Schulz, A.; Elkhouly, M.; Scheytt, C.; Trautwein, U.; Müller, J.; Thomä, R.S. 60 ghz polarimetric mimo sensing: Architectures and technology. In Proceedings of the 2012 6th European Conference on Antennas and Propagation (EUCAP), Prague, Czech Republic, 26–30 March 2012; pp. 2578–2582. [Google Scholar]
  22. Meindl, S.C.; Chopra, S. Supply Chain Management: Strategy, Planning Operation, 5th ed.; Pearson Education: New York, NY, USA, 2013. [Google Scholar]
  23. Avelar-Sosa, L.; García-Alcaraz, J.L.; Cedillo-Campos, M.G.; Adarme-Jaimes, W. Effects of regional infrastructure and offered services in the supply chains performance: Case ciudad juarez. Dyna 2014, 81, 208–217. [Google Scholar] [CrossRef]
  24. Reichhart, A.; Holweg, M. Creating the customer-responsive supply chain: A reconciliation of concepts. Int. J. Oper. Prod. Manag. 2007, 27, 1144–1172. [Google Scholar] [CrossRef]
  25. Cachon, G.P.; Fisher, M. Supply chain inventory management and the value of shared information. Manag. Sci. 2000, 46, 1032–1048. [Google Scholar] [CrossRef]
  26. Levary, R.R. Better supply chains through information technology. Ind. Manag. 2000, 42. Available online: https://www.questia.com/magazine/1P3-57810034/better-supply-chains-through-information-technology (accessed on 30 June 2018).
  27. Baptista Nunes, M.; Annansingh, F.; Eaglestone, B.; Wakefield, R. Knowledge management issues in knowledge-intensive smes. J. Doc. 2006, 62, 101–119. [Google Scholar] [CrossRef]
  28. Valeria Martínez, L.; Jorge Luis García, A.; José Roberto Díaz, R.; Deysi Guadalupe Marquez, G. The impact of ict on supply chain agility and human performance. In Handbook of Research on Information Management for Effective Logistics and Supply Chains; George Leal, J., António Lucas, S., Cláudio Roberto Magalhães, P., Eds.; IGI Global: Hershey, PA, USA, 2017; pp. 180–198. [Google Scholar]
  29. Rai, A.; Patnayakuni, R.; Seth, N. Firm performance impacts of digitally enabled supply chain integration capabilities. MIS Q. 2006, 30, 225–246. [Google Scholar] [CrossRef]
  30. Denolf, J.M.; Trienekens, J.H.; Wognum, P.N.; van der Vorst, J.G.; Omta, S.O. Towards a framework of critical success factors for implementing supply chain information systems. Comput. Ind. 2015, 68, 16–26. [Google Scholar] [CrossRef]
  31. Dos Reis, R.A.; Freitas, M.d.C.D. Critical factors on information technology acceptance and use: An analysis on small and medium brazilian clothing industries. Procedia Comput. Sci. 2014, 31, 105–114. [Google Scholar] [CrossRef]
  32. Hudnurkar, M.; Jakhar, S.; Rathod, U. Factors affecting collaboration in supply chain: A literature review. Procedia Soc. Behav. Sci. 2014, 133, 189–202. [Google Scholar] [CrossRef]
  33. Kumar, R.; Singh, R.K.; Shankar, R. Critical success factors for implementation of supply chain management in indian small and medium enterprises and their impact on performance. IIMB Manag. Rev. 2015, 27, 92–104. [Google Scholar] [CrossRef]
  34. Hwang, D.; Yang, M.G.M.; Hong, P. Mediating effect of it-enabled capabilities on competitive performance outcomes: An empirical investigation of erp implementation. J. Eng. Technol. Manag. 2015, 36, 1–23. [Google Scholar] [CrossRef]
  35. Lang, T.M.; Lin, S.H.; Vy, T.N.T. Mediate effect of technology innovation capabilities investment capability and firm performance in Vietnam. Procedia Soc. Behav. Sci. 2012, 40, 817–829. [Google Scholar] [CrossRef]
  36. Barnes, J.; Liao, Y. The effect of individual, network, and collaborative competencies on the supply chain management system. Int. J. Prod. Econ. 2012, 140, 888–899. [Google Scholar] [CrossRef]
  37. Autry, C.W.; Grawe, S.J.; Daugherty, P.J.; Richey, R.G. The effects of technological turbulence and breadth on supply chain technology acceptance and adoption. J. Oper. Manag. 2010, 28, 522–536. [Google Scholar] [CrossRef]
  38. García, J.L.; Rivera, D.G.; Iniesta, A.A. Critical success factors for kaizen implementation in manufacturing industries in Mexico. Int. J. Adv. Manuf. Technol. 2013, 68, 537–545. [Google Scholar] [CrossRef]
  39. Li, S.; Lin, B. Accessing information sharing and information quality in supply chain management. Decis. Support Syst. 2006, 42, 1641–1656. [Google Scholar] [CrossRef]
  40. Fuentes, J.M.; Jurado, P.J.M.; Marín, J.M.M.; Cámara, S.B. El papel de las tecnologías de la información y las comunicaciones (tic) en la búsqueda de la eficiencia: Un análisis desde lean production y la integración electrónica de la cadena de suministro. Cuad. Econ. Dir. Empres. 2012, 15, 105–116. [Google Scholar]
  41. Llach, J.; Alonso-Almeida, M.d.M. Integrating ICTS and supply chain management: The case of micro-sized firms. Hum. Factors Ergon. Manuf. Serv. Ind. 2015, 25, 385–397. [Google Scholar] [CrossRef]
  42. Ngai, E.W.; Gunasekaran, A. Implementation of edi in Hong Kong: An empirical analysis. Ind. Manag. Data Syst. 2004, 104, 88–100. [Google Scholar] [CrossRef]
  43. Alderete, M.; Gutiérrez, L. Tic y productividad en las industrias de servicios en Colombia. Lect. Econ. 2012, 77, 163–188. [Google Scholar]
  44. Hempell, T. Do Computers Call for Training? Firm-Level Evidence on Complementarities between ICT and Human Capital Investments; Center for European Economic Research: Mannheim, Germany, 2003. [Google Scholar]
  45. Brambilla, I.; Tortarolo, D. Investment in ICT, Productivity, and Labor Demand: The Case of Argentina; World Bank Group: Washington, DC, USA, 2018. [Google Scholar]
  46. Devaraj, S.; Krajewski, L.; Wei, J.C. Impact of ebusiness technologies on operational performance: The role of production information integration in the supply chain. J. Oper. Manag. 2007, 25, 1199–1216. [Google Scholar] [CrossRef]
  47. Zailani, S.; Jeyaraman, K.; Vengadasan, G.; Premkumar, R. Sustainable supply chain management (sscm) in Malaysia: A survey. Int. J. Prod. Econ. 2012, 140, 330–340. [Google Scholar] [CrossRef]
  48. Cossío, N.S.; Flores, J.L.M.; Suárez, J.A.A.; Urquiaga, A.J.A. El plan de negocio conjunto, herramienta que facilita la planificación colaborativa en la cadena de suministro. Unian. Epistem. 2017, 4, 117–134. [Google Scholar]
  49. González Torres, L.A.; Ibarra Cisneros, M.A.; Cervantes Collado, K.E. El impacto de las tecnologías de la información y comunicación en la industria manufacturera de baja california. Reg. Soc. 2017, 29, 153–183. [Google Scholar] [CrossRef]
  50. Tonelli, F.; Demartini, M.; Loleo, A.; Testa, C. A novel methodology for manufacturing firms value modeling and mapping to improve operational performance in the industry 4.0 era. Procedia CIRP 2016, 57, 122–127. [Google Scholar] [CrossRef]
  51. Flores, M.d.R.; Nava, R.M.; Gómez, M.d.R. Las Tecnologías de Información y Comunicación en Las Pequeñas y Medianas Empresas; Revista Iberoamericana para la Investigación y el Desarrollo Educativo, 2015; Available online: http://ride.org.mx/1-11/index.php/RIDESECUNDARIO/article/viewFile/730/713 (accessed on 27 July 2018).
  52. Burger, N.; Demartini, M.; Tonelli, F.; Bodendorf, F.; Testa, C. Investigating flexibility as a performance dimension of a manufacturing value modeling methodology (mvmm): A framework for identifying flexibility types in manufacturing systems. Procedia CIRP 2017, 63, 33–38. [Google Scholar] [CrossRef]
  53. Ravenna, M.C.; González, M.L. Las tecnologías de la información en las pequeñas y medianas empresas mexicanas. Scr. Nova 2004, 8, 21. [Google Scholar]
  54. García-Alcaraz, J.L.; Oropesa-Vento, M.; Maldonado-Macías, A.A. Kaizen Planning, Implementing and Controlling; Springer: New York, NY, USA, 2016. [Google Scholar]
  55. Gunasekaran, A.; Ngai, E.W. Information systems in supply chain integration and management. Eur. J. Oper. Res. 2004, 159, 269–295. [Google Scholar] [CrossRef]
  56. Yam, R.C.; Lo, W.; Tang, E.P.; Lau, A.K. Analysis of sources of innovation, technological innovation capabilities, and performance: An empirical study of Hong Kong manufacturing industries. Res. Policy 2011, 40, 391–402. [Google Scholar] [CrossRef]
  57. Youn, S.H.; Yang, M.G.M.; Kim, J.H.; Hong, P. Supply chain information capabilities and performance outcomes: An empirical study of korean steel suppliers. Int. J. Inf. Manag. 2014, 34, 369–380. [Google Scholar] [CrossRef]
  58. Likert, R. A Technique for the Measurement of Attitudes; Scientific Research Publishing: Wuhan, China, 1932. [Google Scholar]
  59. AL-Tahat, M.D.; Bataineh, K.M. Statistical analyses and modeling of the implementation of agile manufacturing tactics in industrial firms. Math. Probl. Eng. 2012, 2012. [Google Scholar] [CrossRef]
  60. Alcaraz, J.L.G. Modelos Multivariables Para la Toma de Decisiones en Sistemas Productivos: Estudios de Caso en la Industria Vitivinícola (España) y Maquiladora (México); Universidad de La Rioja: Logroño, Spain, 2016. [Google Scholar]
  61. García-Alcaraz, J.L.; Martínez-Loya, V.; Reza, J.R.D.; Fong, J.R.M. El rol de la gerencia y black belts en el éxito de seis sigma. 2017. Available online: https://www.researchgate.net/profile/Jorge_Garcia-Alcaraz/publication/320559710_EL_ROL_DE_LA_GERENCIA_Y_BLACK_BELTS_EN_EL_EXITO_DE_SEIS_SIGMA/links/59edda0e4585158fe5340ed2/EL-ROL-DE-LA-GERENCIA-Y-BLACK-BELTS-EN-EL-EXITO-DE-SEIS-SIGMA.pdf (accessed on 27 June 2018).
  62. Castañeda, M.B. Procesamiento de Datos y Análisis Estadísticos Utilizando Spss: Un Libro Práctico Para Investigadores y Administradores Educativos; Edipucrs: Porto Alegre, Brazil, 2010. [Google Scholar]
  63. Manenti, F.; Buzzi-Ferraris, G. Criteria for outliers detection in nonlinear regression problems. In Computer Aided Chemical Engineering; Elsevier: New York, NY, USA, 2009; Volume 26, pp. 913–917. [Google Scholar]
  64. Lindell, M.K.; Whitney, D.J. Accounting for common method variance in cross-sectional research designs. J. Appl. Psychol. 2001, 86, 114–121. [Google Scholar] [CrossRef] [PubMed]
  65. Allen, I.E.; Seaman, C.A. Likert scales and data analyses. Qual. Prog. 2007, 40, 64–65. [Google Scholar]
  66. Kock, N. Warppls 5.0 User Manual; Scripwarp Systems: Laredo, TX, USA, 2015. [Google Scholar]
  67. Iacobucci, D.; Posavac, S.S.; Kardes, F.R.; Schneider, M.J.; Popovich, D.L. Toward a more nuanced understanding of the statistical properties of a median split. J. Consum. Psychol. 2015, 25, 652–665. [Google Scholar] [CrossRef]
  68. Ketchen, D.J. A Primer on Partial Least Squares Structural Equation Modeling; SAGE Publications Inc.: Thousand Oaks, CA, USA, 2013. [Google Scholar]
  69. Wold, S.; Trygg, J.; Berglund, A.; Antti, H. Some recent developments in pls modeling. Chemomet. Intell. Lab. Syst. 2001, 58, 131–150. [Google Scholar] [CrossRef]
  70. Willaby, H.W.; Costa, D.S.; Burns, B.D.; MacCann, C.; Roberts, R.D. Testing complex models with small sample sizes: A historical overview and empirical demonstration of what partial least squares (pls) can offer differential psychology. Personal. Individ. Differ. 2015, 84, 73–78. [Google Scholar] [CrossRef]
  71. Intakhan, P. Direct & indirect effects of top management support on abc implementation success: Evidence from iso 9000 certified companies in thailand. Procedia Soc. Behav. Sci. 2014, 164, 458–470. [Google Scholar]
  72. Kiritsis, D.; Bufardi, A.; Mavrikios, D.; Knothe, T.; Szigeti, H.; Majumdar, A. A competence-based industrial learning approach for factories of the future. Educ. Inf. Technol. 2013, 18, 331–350. [Google Scholar] [CrossRef]
  73. Skorupinska, A.; Torrent-Sellens, J. ICT, innovation and productivity: Evidence based on eastern European manufacturing companies. J. Knowl. Econ. 2017, 8, 768–788. [Google Scholar] [CrossRef]
  74. Arica, E.; Powell, D.J. A framework for ICT-enabled real-time production planning and control. Adv. Manuf. 2014, 2, 158–164. [Google Scholar] [CrossRef] [Green Version]
Figure 1. Hypotheses proposed.
Sustainability 10 02261 g001
Figure 2. Structural equation model.
Sustainability 10 02261 g002
Table 1. Sector and gender.
SectorManagersDepartment HeadsSupervisorsTotal
1Manufacturing industry8111736
2Food industry4127
3Manufacturing of garments2507
4Computer equipment1157
5Electronic accessories2147
6Plastic industry1236
7Metal products2035
8Printing industry2013
9Non-metallic mineral products1001
10Furniture, mattresses, and blinds1001
Total24213580
Table 2. Years on the job.
GenderTimeTotal
Less Than 2 Years2–5 Years5–10 YearsMore Than 10 Years
Male18217854
Female1263526
Total3027101380
Table 3. Validation of latent variables.
IndexesLatent Variables
ICT IntegrationInvestment in ICTTraining in ICTOperational Benefits
R-Squared 0.4550.6040.433
Squared R Adjusted 0.4480.5930.410
Reliability Index0.8960.9280.950.954
Alpha of Cronbach0.8600.9060.9220.939
Average Variance Extracted0.5910.6830.8650.806
Variance Inflation Index2.0162.3772.5251.713
Squared Q 0.4510.6050.439
Table 4. Descriptive analysis of the data.
ItemsMedianInterquartile Range
ICT integration
1Use of ICT in periodic meetings.3.5101.836
2Use of ICT in the activities of the company.4.0881.500
3Use of ICT in the necessary changes in collaboration within the company.3.7881.565
4Use of ICT in business processes.4.0361.539
5Use of ICT in decision making.4.1821.656
6Use of ICT in the investment of new products.4.1071.650
Investment in ICT
7Sufficient computer equipment in your organization.4.0351.509
8Sufficient ICT professionals in your organization.3.2001.631
9Knowledge required for the use of ICT.3.4621.707
10Developer available to give support in the software.3.3162.252
11Retrieve information about suppliers, clients, and competitors.3.5601.765
12Collect and process the data to know the needs of the client.3.7781.769
Training in ICT
13Training the users of information technology in the changes, skills, and importance of the accuracy of the data and responsibilities.3.5001.834
14Training the users of the information system with regular assistance to a formal training program that meets the required requirements.3.3181.953
15Training the users of the information system with training teams for each job.3.4681.878
Operational benefits
16Flexibility of the systems to cover the needs of the client.4.0911.630
17Strengthen the relationship with clients.4.0001.629
18Cost competitiveness4.0381.745
19Shorter order cycles.3.8781.820
20Flexibility of response towards the client.4.1231.609
Table 5. Model Efficiency Indexes.
IndexesResultsDecision
1Average Path Coefficient (APC)0.375, p < 0.001p ≤ 0.05
2Average R-Squared (ARS)0.497, p < 0.001p ≤ 0.05
3Average Adjusted R-Squared (AARS)0.484, p < 0.001p ≤ 0.05
4Average block VIF (AVIF)2.206acceptable if ≤5, ideally ≤ 3.3
5Average Full collinearity VIF (AFVIF)2.157acceptable if ≤5, ideally ≤ 3.3
6Tenenhaus GoF (GoF)0.605small ≥ 0.1, medium ≥ 0.25, large ≥ 0.36
7Sympson’s Paradox Ratio (SPR)1.000acceptable if ≥0.7, ideally = 1
8R-Squared Contribution Ratio (RSCR)1.000acceptable if ≥0.9, ideally = 1
9Statistical Suppression Ratio (SSR)1.000acceptable if ≥0.7
10Nonlinear Bivariate Causality Direction Ratio (NLBCDR)1.000acceptable if ≥0.7
Table 6. Direct effects.
ToFrom
ICT IntegrationInvestment in ICTTraining in ICT
Investment in ICT0.675 p < 0.001 ES = 0.455
Training in ICT0.349 p < 0.001 ES = 0.2370.501 p < 0.001 ES = 0.367
Operational benefits0.266 p = 0.006 ES = 0.1580.305 p = 0.002 ES = 0.1870.156 p = 0.074 ES = 0.088
Table 7. Sum of indirect effects.
ToFrom
ICT IntegrationInvestment in ICT
Training in ICT0.338 p < 0.001 ES = 0.230
Operational benefits0.313 p = 0.001 ES = 0.1860.078 p = 0.158 ES = 0.048
Table 8. Total effects.
ToFrom
ICT integrationInvestment in ICTTraining in ICT
Investment in ICT0.675 p < 0.001 ES = 0.455
Training in ICT0.687 p < 0.001 ES = 0.4670.501 p < 0.001 ES = 0.367
Operational benefits0.579 p < 0.001 ES = 0.3440.384 p < 0.001 ES = 0.2350.156 p = 0.074 ES = 0.088
Table 9. Validation of hypothesis.
HypothesisVariablesΒ Valuep-ValueConclusion
FromTo
H1ICT integrationInvestment in ICT0.675<0.001Accept H0
H2ICT integrationTraining in ICT0.349<0.001Accept H0
H3Investment in ICTTraining in ICT0.501<0.001Accept H0
H4ICT integrationOperational benefits0.266<0.001Accept H0
H5Investment in ICTOperational benefits0.305<0.001Accept H0
H6Training in ICTOperational benefits0.1560.07Reject H0

