Dual Chains Competition under Two Recycling Modes Based on System Dynamics Method

1
School of Computer Science and Technology, Harbin University of Science and Technology, Harbin 150000, China
2
School of Computer and Control Engineering, Qiqihar University, Qiqihar 161000, China
3
Newcastle Business School, Faculty of Business and Law, University of Newcastle, Australia, 1 University Drive, Callaghan 2308, Australia
*
Author to whom correspondence should be addressed.
Sustainability 2018, 10(7), 2382; https://0-doi-org.brum.beds.ac.uk/10.3390/su10072382
Submission received: 20 June 2018
/
Revised: 5 July 2018
/
Accepted: 7 July 2018
/
Published: 9 July 2018
Abstract
:The fast-growing accumulation of electronic waste (e-waste) around the world is resulting in environmental pollution and adverse human health and, thus, has become a global area of concern. As the world’s second largest producer of e-waste, China suffers significant pollution from e-waste because of inefficient recycling and management. This paper is a comparative systems dynamics study of two big home appliance manufacturers in China: Haier (Haier Group of Qingdao, China) and Gree (Gree Electric Appliances Inc. of Zhuhai, China). We used systems dynamics modeling to examine and compare the impact of closed-loop supply chain recycling and remanufacturing strategies on the total revenue of the supply chain and market shares of both manufacturers. Results show that an increase in third party service coverage and increased environmental awareness enhanced the total revenue of supply chain. Retailers showed more enthusiasm for recycling through contract development with manufacturers, thus resulting in reduced time of payment in closed-loop supply chains. We also found that an improvement of the recycling mechanism of retailers results in an increase in the share of the supply chain market. Hence, we propose a better supply chain mode.
1. Introduction
The flow of product returns has become a significant area of concern for many manufacturers and researchers as a result of the drive for value and efficiency as well as sustainability [1]. The total value of all products returned annually by consumers in the US alone has been estimated at US$642.6 billion [2]. Returns account for an estimated 4.4% of $14.5 trillion in global retail sales. Only 48% of what is returned can be resold at full price, according to a 2016 Gartner survey of 300 retailers. In the survey, most of those surveyed expect worldwide returns to grow as online sales and free returns with free shipping grow.
Similarly, e-waste, which refers to discarded electric appliances and equipment, such as old computers and refrigerators, is similarly growing at alarming proportions despite global environmental, ecological and public health concerns. China is ranked the second highest producer of e-waste in the world only after the United States. China has already entered a peak period of growth in e-waste with an average annual growth of 20% and the number of discarded electronic items is expected to surpass 137 million units per year by 2020 [3].
Given this scenario, sustainability agenda requires companies to consider and manage the impact that their supply chain has on both the ecological and social environment in which they operate and beyond. Hence, the business case for sustainable reverse supply chains is well documented as a means to managing: rapid technological product obsolescence [4,5]; compliance with increasing regulations and legislation [6,7]; supply chain risk [8,9]; a good green reputation with customers [10,11]; cost reduction [12]; and the search for competitive advantage and efficiency in managing product returns and higher profits [13].
Towards addressing these problems, much research has focused on: (1) easy and efficient product returns as part of company customer service policies [14,15]; (2) consumer recycling programs [16,17,18]; (3) product reuse, reconditioning, and remanufacturing [19,20]; and (4) design of closed loop supply chain model (CLSC) with third party enterprises to manage the reverse function [21,22,23]. Song et al., for instance, constructed a CLSC model with a third-party dominating and managing the recycling market [24]. However, research on extracting value from returns by companies and making reverse flows profitable has not received adequate attention in the context of China in studies of return flows. Indeed, until recently, reverse flows were not generally viewed as a potential source of additional value and service for customers or revenue for the manufacturer [25]. Hence, more research is required to develop and optimize traditional supply chain models with a view to extracting value and improving sustainability.
Although forward distribution and supply chain flow costs are usually well defined thus making trade-offs easier to analyze, care needs to be taken in developing realistic costs for reverse flows to analyze potential trade-offs and attain value for customers as part of a customer service agenda and revenue for the manufacturer as part of the efficiency and profitability agenda [26,27].
In the context of the alarming growth of e-waste in China and attendant adverse consequences, superior strategies on sustainable e-waste recycling and reuse need to be developed to effectively improve manufacturer extraction of value, customer service and protection of the environment. Sustainable e-waste recycling and reuse will also play an important role in solving China’s resource and energy shortage problems and promote longer term sustainable economic development. Hence, research needs to be undertaken, and simulation models developed to help manufacturers compare and contrast alternative courses of decision-making and action as regards whether to re-use, recycle or re-manufacture and for them to find out which course of action is most beneficial for the manufacturer [28]; hence, the importance of the new competing mode of recycling and/or remanufacturing and associated managerial decisions.
The contribution of this paper is that it simulates a scenario in which two three-step CLSC compete for the same market. The third-party recycling supply chain and retailer recycling supply chain construct two closed loops, respectively. The optimal strategies for these two supply chains are then proposed after adjusting the system parameters respectively. The rest of the paper is structured as follows: Section 2 is a summary of the literature review. Section 3 discusses the method used and the case studies undertaken. Section 4 is the discussion of the simulation and analysis of findings from the model. In Section 5, we draw and discuss conclusions from our model.
2. Literature Review
Research on recycling mode has been growing fast in the past two decades. Hu et al. proposed a recycling model which enables retailer cooperating with third-party by the two-stage Stackelberg game method [29]. In consideration of bullwhip effect and profit, Zhang et al. established a dynamic model of distribution network system for electronic product CLSC, and introduced the trade-in policy and a method of three types of electronic products recycling mode [30]. Zhang studied a CLSC consisting of manufacturers, retailers and third-party recycler and the pricing strategy based on carbon emission tax by Stackelberg theory in decentralized decision-making [31]. The result showed that the carbon tax mechanism can effectively increase the volume of collection and benefit for all supply chain members. Sasikumar and Haq investigated the CLSC for the case of battery recycling in automobile industry and found the cost deduction can be achieved through CLSC [32]. Georgiadis took paper industry as an example, and put forward a dynamic model of capacity planning based on recycling strategy [33]. Choi et al. studied the decision-making of CLSC under different channel forces, and compared its overall performance [21]. Hong et al. examined waste electronic product and compared the optimal strategy of the CLSC recycled by the retailers and the third parties, they identified when retailers recycled the waste electronic products, the recycling rate and total profit of channel and the manufacturer’s profit were not always better than those of the third parties [34]. Huang et al. studied the optimal decision-making of CLSC under double recycling channels and pointed out the dominant conditions of double recycling channels and single recycling channel [35]. Based on information symmetry or not, Wei et al. constructed four types of CLSC decision-making models under the channel leadership dominated by manufacturers and retailers, respectively, and pointed out the optimal strategy in different situations [36]. Furthermore, the CLSC decision-making model with advertising effect in three different recycling modes was constructed by Hong et al. [23]. Cao et al. put forward four innovative WEEE collection modes: unified collection channels mode, manufacturer alliance mode, innovative enterprise self-built network platform mode and third-party integrated network platform mode [37].
On the competition of CLSC, Savaskan et al. extended the “one-to-one” simple structure to the CLSC system with two competing retailers for the first time [17]. For a CLSC consisting of a manufacturer and two competing retailers, Yi studied the optimal decision-making under three different dominant forces [38]. Wang et al. studied the optimal strategy of CLSC to deal with unexpected events and put forward the coordination mechanism based on the contract of “benefit-sharing and risk-sharing” [39]. Huang et al. constructed a CLSC which consisted of one remanufacturer and two competing retailers, and pointed out that competitive retailers had a “first-move” advantage in product recycling [40]. For a CLSC consisting of two competing manufacturers and a leading retailer, Han et al. analyzed the evolution process of the recycling channel and pointed out that the competition strength among manufacturers, the difficulty degree of waste product recycling and manufacturing cost jointly decided the evolution result of the recycle channel [41]. Wu et al. analyzed the optimal decision-making in three kinds of disturbances and pointed out the relationship between the manufacturer’s competition strength and the robustness of the decision [42]. For a CLSC consisting of two leading competition manufacturers, a retailer and a recycler, Wang et al. analyzed the impact of reward and punishment mechanism on the optimal decision-making of CLSC, and pointed out that the government’s reward and punishment mechanism was beneficial to consumers and CLSC’s members [43]. Further, they also discussed the reward and punishment mechanism of manufacturers in reverse supply chain under carbon emission constraints [44]. Liu and Zhang constructed three models to investigate pricing and collecting decisions in CLSC under different power configurations and dual competitions [45].
The above studies have analyzed the waste electronic recycling mode and the CLSC’s competition strategy by means of optimization theory and game theory, and important research results have been obtained. However, most of these studies focused on the mathematical method to simulate the same-layer competition in the inter-chain and intra-chain of the CLSC rather than the system dynamics method or the whole chain competition. Thus, more studies are required to develop and optimize the inter-chain competition about remanufacturing and recycling of CLSC as current research scope is limited to the game relationship between the same-layer joints. To study the structure of two different recycling modes, this paper constructs the recycling and remanufacturing model in which the supply chain of a Chinese manufacturing company competes with the supply chain of another Chinese manufacturing company; and simulates the effects of the two competing modes on the total revenue of the supply chains and their market shares with system dynamics method [46,47].
3. Materials and Methods
3.1. Systems Dynamics
System dynamics (SD) is a computer-aided approach to policy analysis and design [46,47]. It applies to dynamic problems arising in complex social, managerial, economic, or ecological systems—literally any dynamic system characterized by interdependence, mutual interaction, information feedback, and circular causality [46,47]. It is an approach to understanding the nonlinear behavior of complex systems over time using stocks, flows, internal feedback loops, table functions and time delays. SD is based on systems thinking and system dynamics modeling and is often applied to strategy, assessing decision alternatives, organizational change, and policy design through the development and use of simulation models and case studies [46,47]. The SD approach is reliant on conceptual and modeling skills for the effective design and management of high-performance organizations in a dynamic rapidly changing world. SD is a discipline of close integration of scientific theory and computer simulation, comprising of feedback structure of research system and behavior [46,47]. The method is the combination of qualitative and quantitative research and the method of system comprehensive inference. Its modeling process is a combination of learning, investigation and research [46,47].
3.2. The Case Studies
Haier Group (Haier) was founded in 1984 and is the global leading brand in home appliances. It has transformed from the traditional home appliance products manufacturing enterprises into an open entrepreneurial platform. On 22 August 2015, Chinese Enterprise Federation and the Chinese Entrepreneur Association awarded Haier the “Top 500 Chinese Enterprises”. In the listed companies’ financial report, Haier is ranked as the Number 1 of home appliance industry. In the e-waste recycling and processing work, Haier is the leader of the industry and has become the first batch to carry out e-waste recycling exploration practice under the guidance of the national policy and has obtained the country’s waste electronic products dismantling qualification [48].
Zhuhai Gree Electric Appliance Co., Ltd. (Gree, Zhuhai, China) is an international home appliance enterprise including R&D, production, sales and service with the three brands Gree, Tosot (Zhuhai, China), and Kinghome (Hefei, China). Its main products and services are home air-conditioning, central air-conditioning, air heaters, mobile phones, living appliances, refrigerator and so on. Since 2005, Gree air-conditioning’s production and sales have led the world for 12 years. Since 2011, Gree has invested in the establishment of renewable resources companies in Changsha, Zhengzhou, Shijiazhuang and Wuhu, which mainly engaged in the recycling and processing of waste washing machine, TV, air-conditioning, refrigerator and computer. Gree does harmless treatment of waste electrical and electronic products through adopting the international advanced dismantling technology and equipment [49].
With the support of Chinese government, Haier mainly relies on the retailers to carry out trade-in activities and sets up effective after-sale service networks to recycle directly. It makes full use of existing sales outlets to gradually build efficient recycling system. Gree relies on the electronic product recycling institutions which have advantages in the recycling scale and specialization. Gree avoids substantial investment in establishing and maintaining recycling network to obtain better recycling effect at a lower cost. Therefore, our research to compare e-waste recycling system between Gree and Haier significantly contributes to e-waste recycling’s reform and optimization of China’s home appliance industry.
3.3. Competition Model
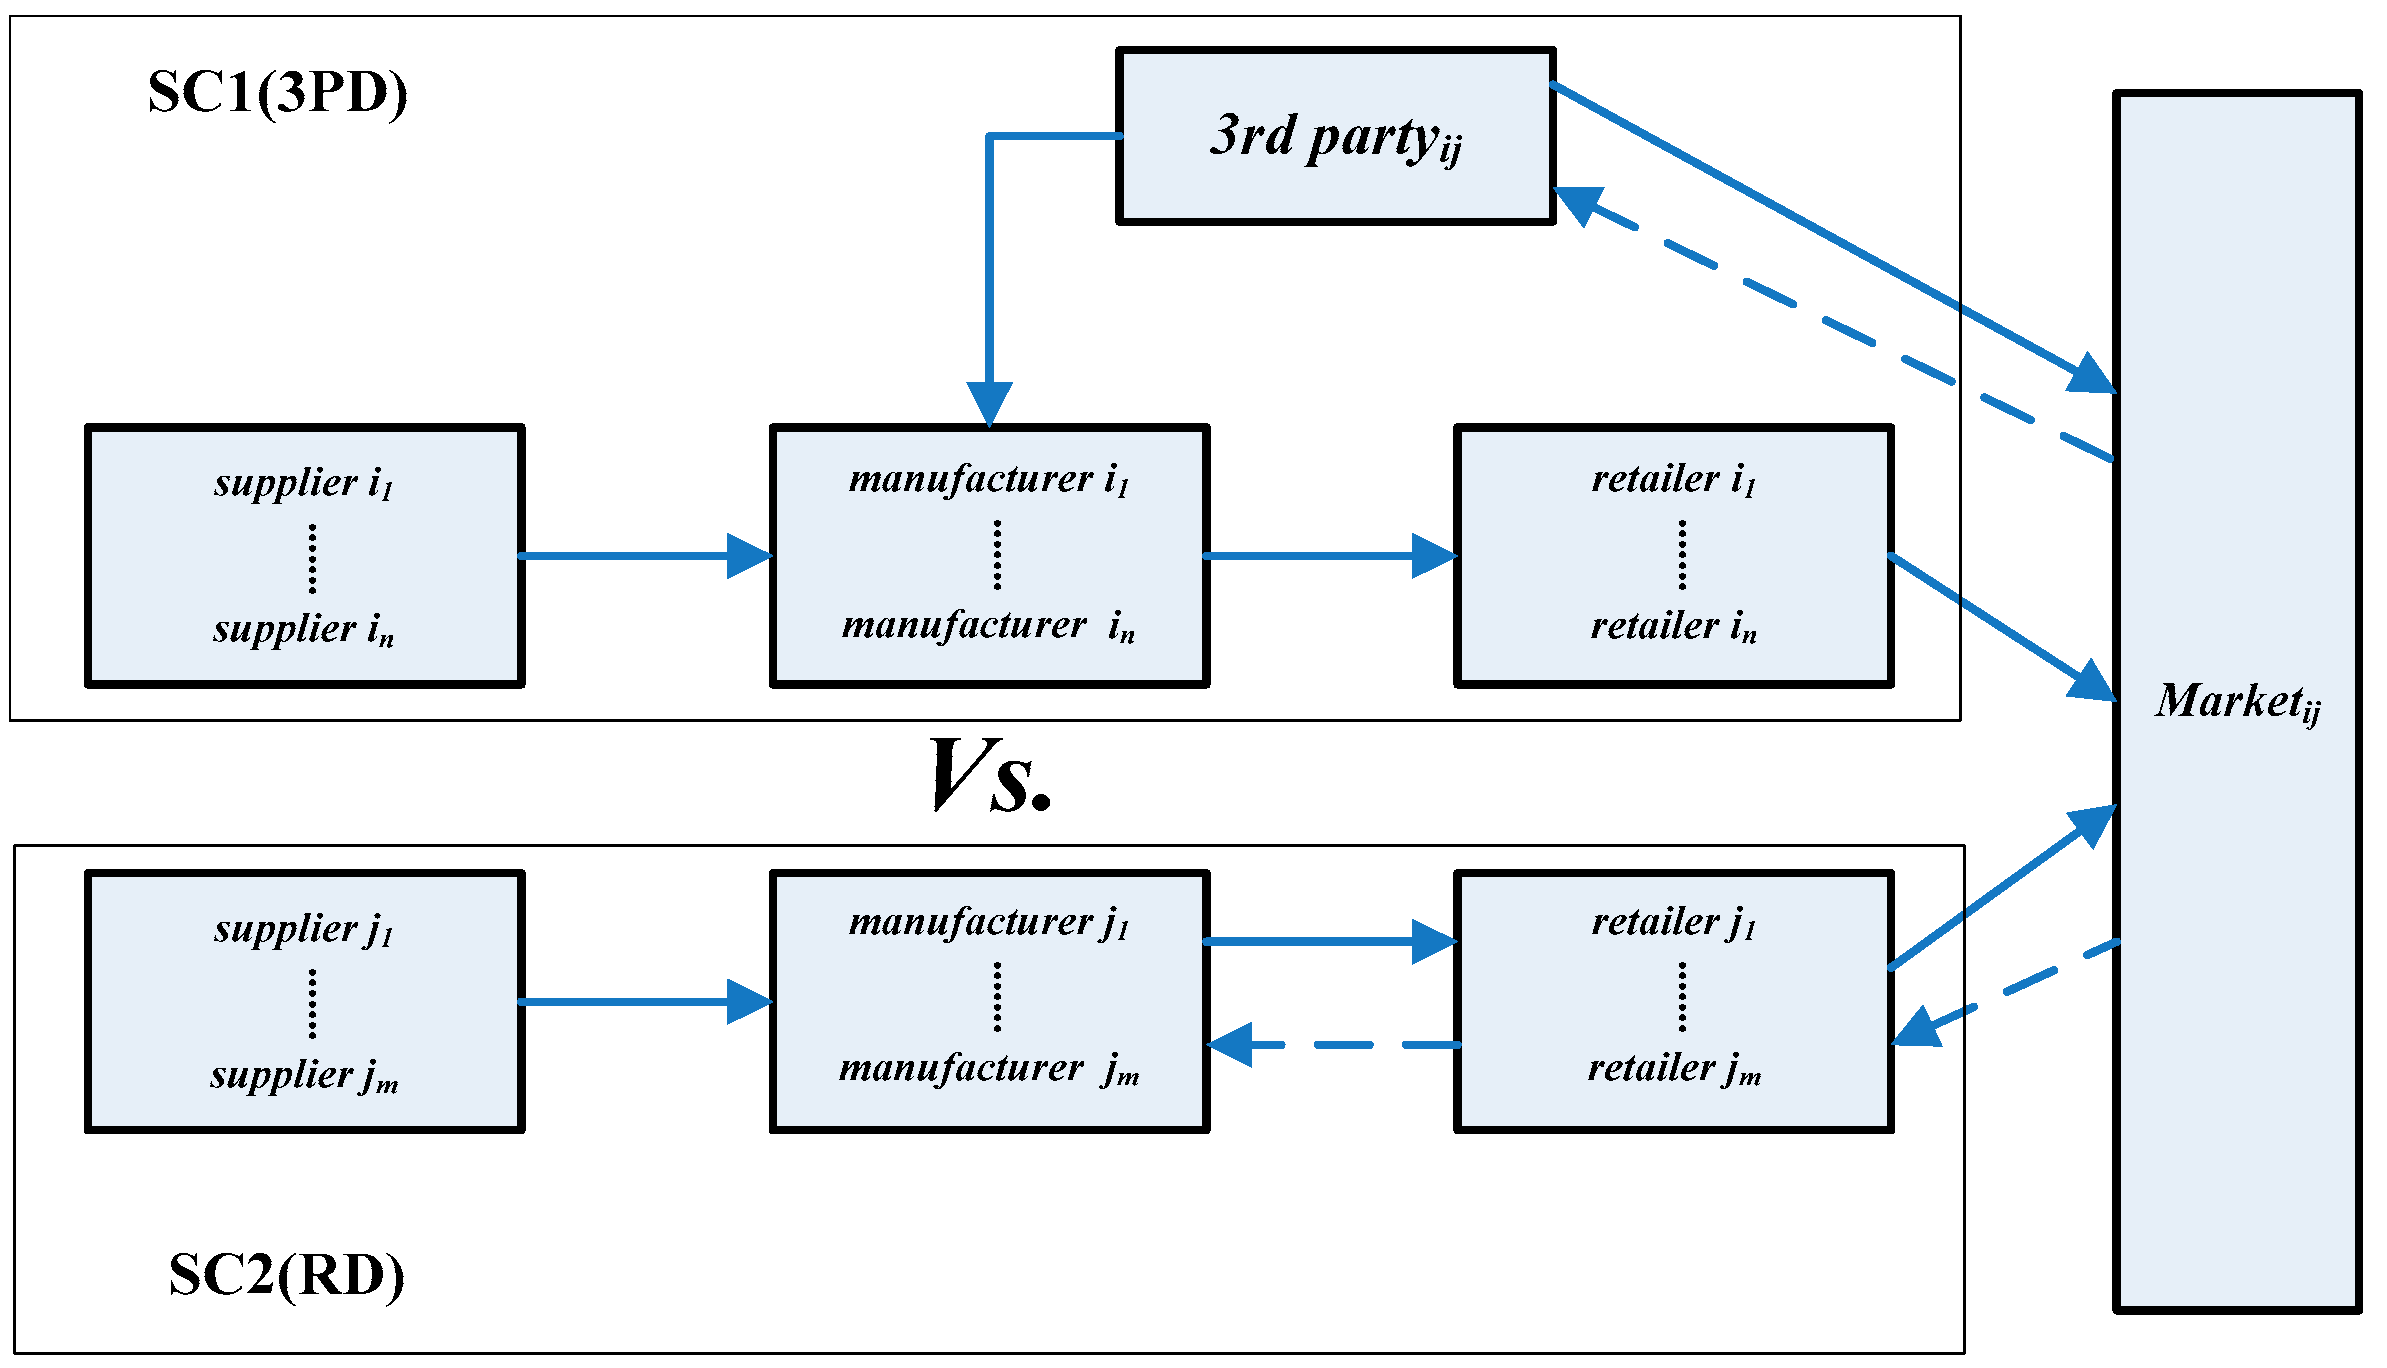
The model shows that Gree and Haier compete for the same consumer market and Gree’s recycling model is represented by Supply Chain 1. Manufacturers purchase raw materials from upstream suppliers for production and processing. Retailers order from manufacturers according to market’s demand. When electronic products are sold to the market, after a delay period, the waste electronic products’ recycling and further treatment will be carried out by third-party enterprises. Haier Group’s recycling model is represented by Supply Chain 2; the main participants include manufacturers and retailers. Manufacturers are responsible for producing electronic products, while retailers need to take charge of the dual responsibility of product sales and recycling. The competition model is shown in Figure 1.
The third-party enterprises are responsible for products recycling in Supply Chain 1. In this mode, manufacturers can focus on products’ R&D and production and the retailers can focus on products’ sales and the third-party enterprises can also focus on products’ recycling, which can maximize the core competitiveness of members in the supply chain and promote the professional development of the industry. Moreover, the third-party enterprises can recycle products through various channels such as street vendors, repair shops and so on. However, the model also has some limitations. If the recycling of waste products is low-priced, the third-party enterprises would be unprofitable. Moreover, the third-party’s recycling channels are prone to moral hazard issues, such as illegal street vendors or counterfeiters.
Supply Chain 2 adopts the mode that the retailers as the leaders are responsible for product recycling, which is more common in the electronics and home appliances industry. In this mode, retailers can recycle waste products in various ways, such as trade-in, low-cost takeover or green environmental activities. Retailers can recycle products through the existing sales channels and bring it to the manufacturers to avoid the cost of the other channels and make a second profit from the existing channels. Furthermore, retailers have a wide range of sales outlets so they can attract more consumers to participate in recycling waste products. However, the recycling mode also has some disadvantages. Retailers often need to be responsible for the sales and recycling of multiple brand manufacturers’ products. If manufacturers have no reasonable incentive mechanism and measures, it will lead to problems of choosing recycling channel and moral hazard.
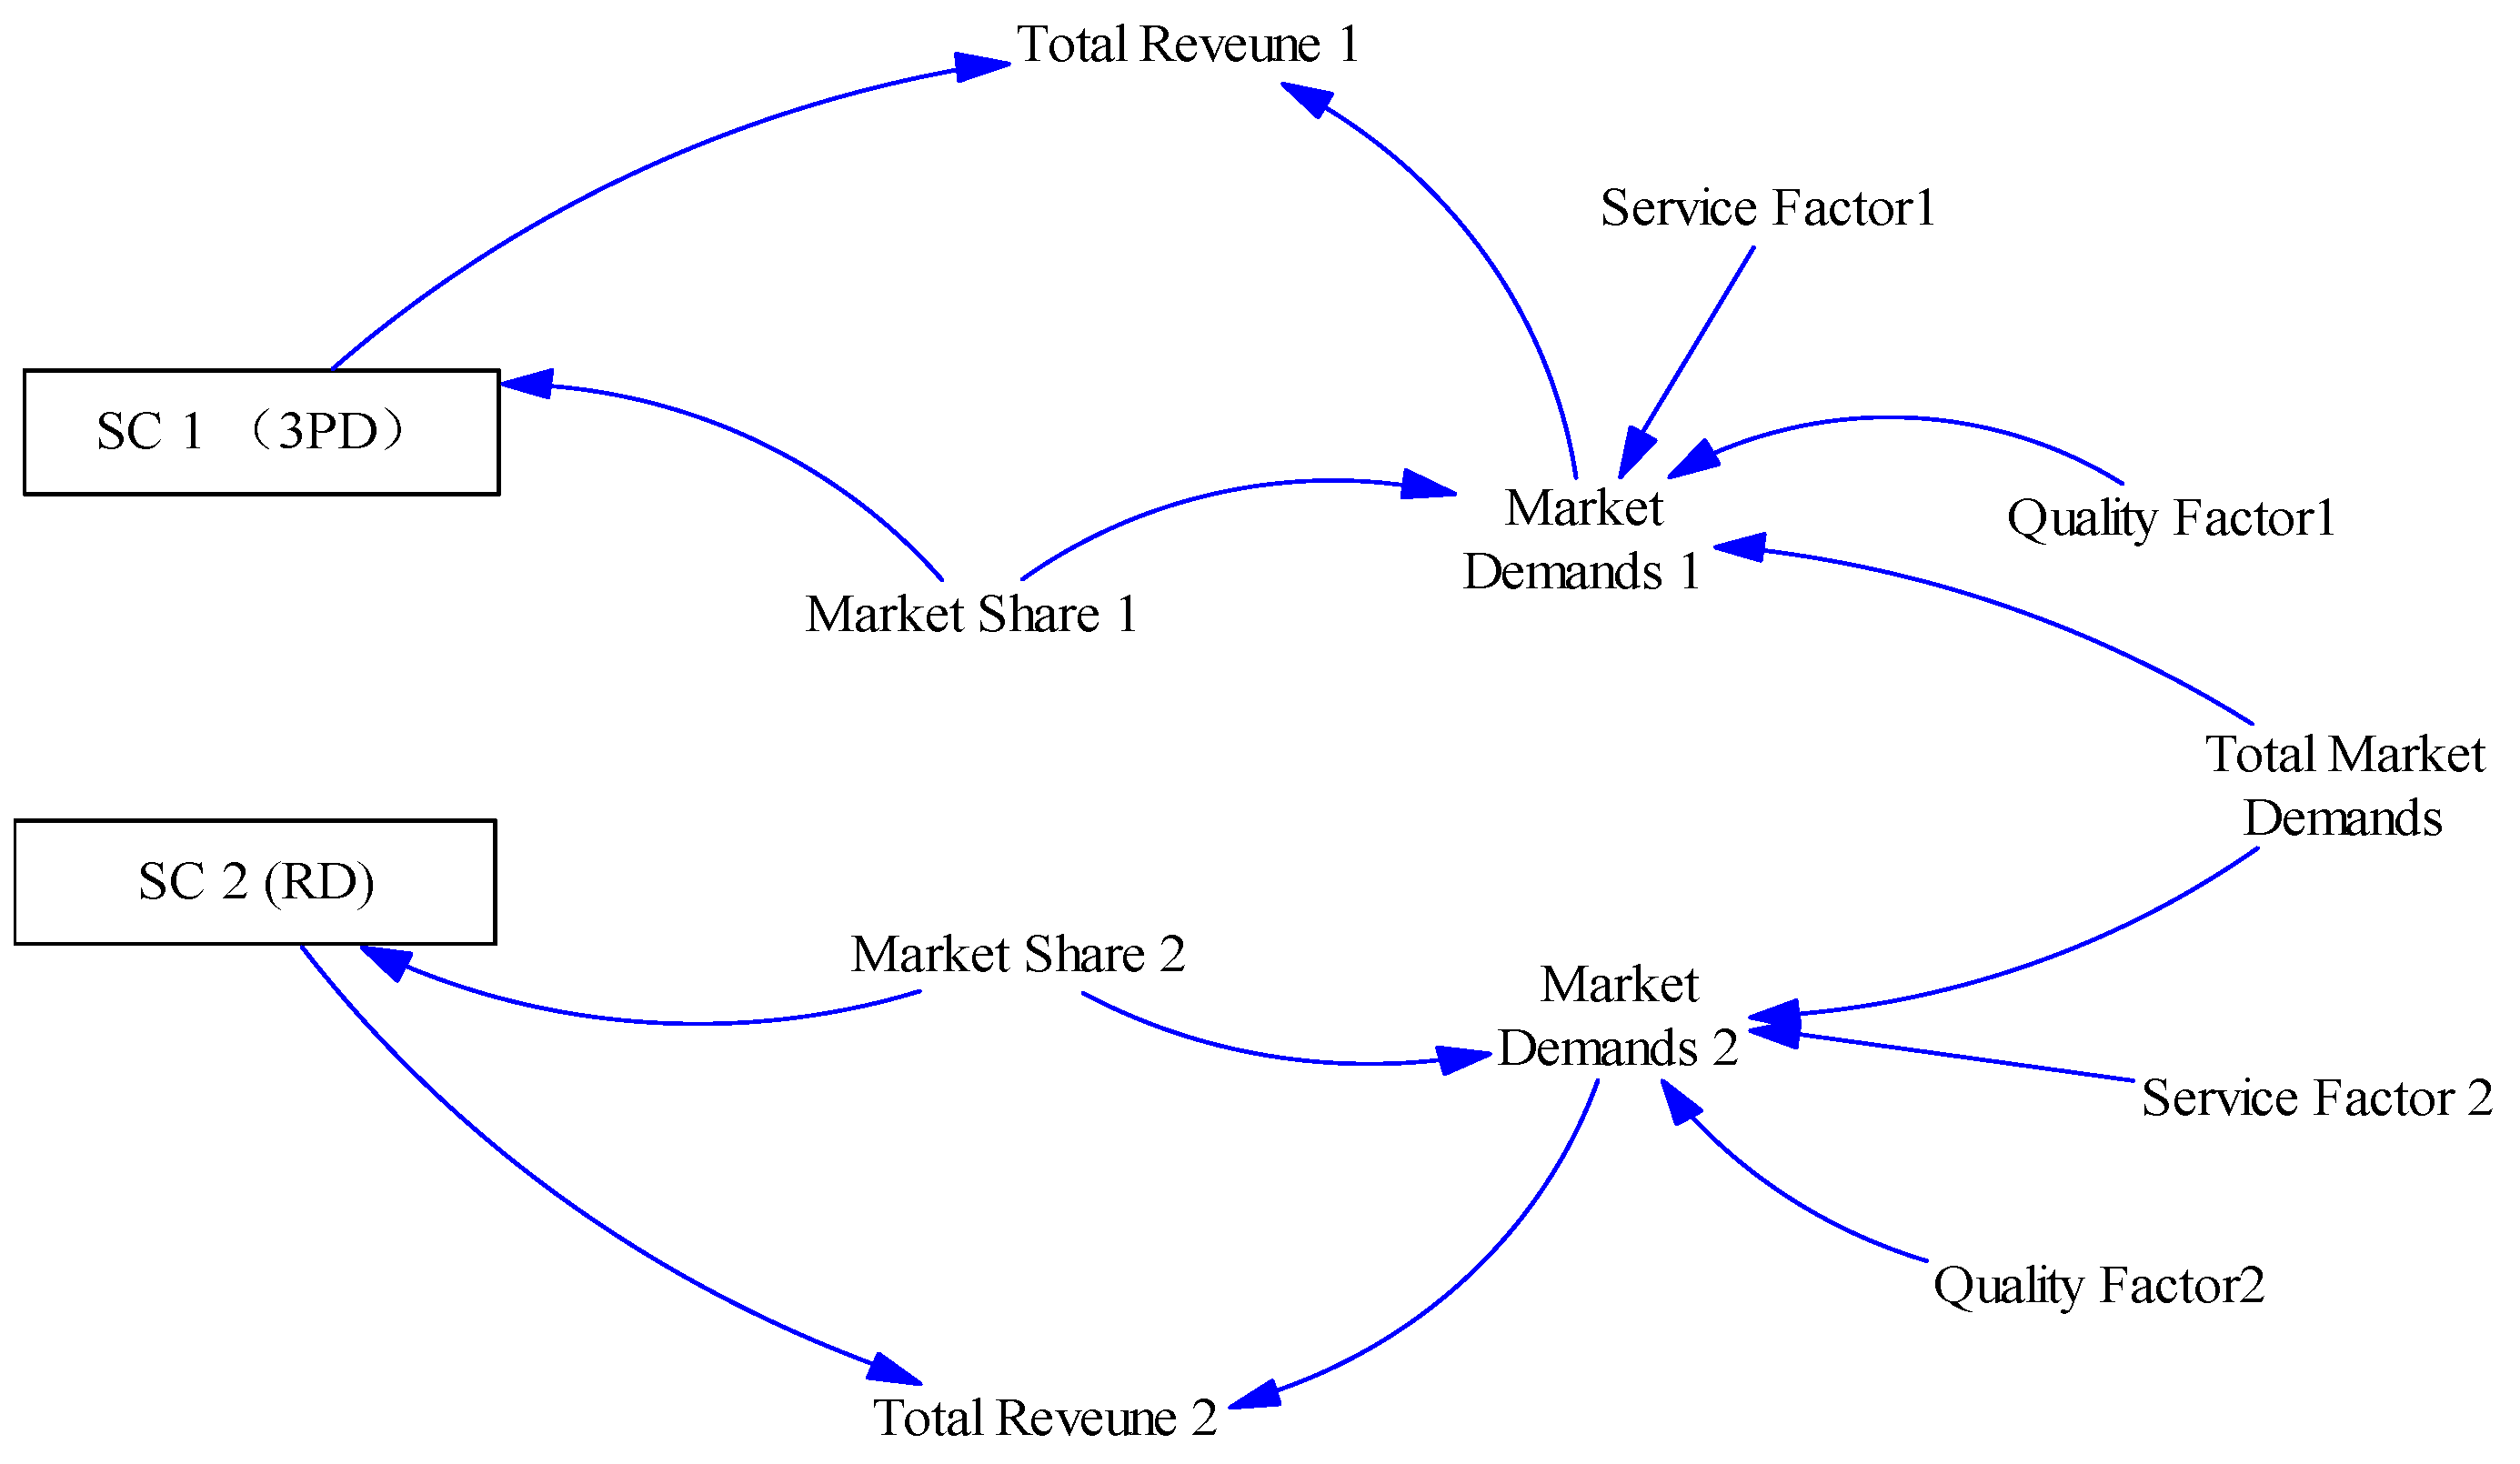
As shown in Figure 2, this paper assumes that the market demand is limited and it is jointly competed by Supply Chain 1 (3PD) and Supply Chain 2 (RD). Waste electronic product recycling and remanufacturing are the most important part to measure the competitiveness of supply chain. In this paper, service factor and quality factor are used as the main influencing factors to evaluate the ability to compete for market demand in Supply Chains 1 and 2. As the main participant in the recycling activities, manufacturers, retailers and third-party enterprises adopt the strategy of improving remanufacturing capacity, increasing recycling channels and expanding recycling point coverage to maximize their own interests, which even benefits the whole supply chain.
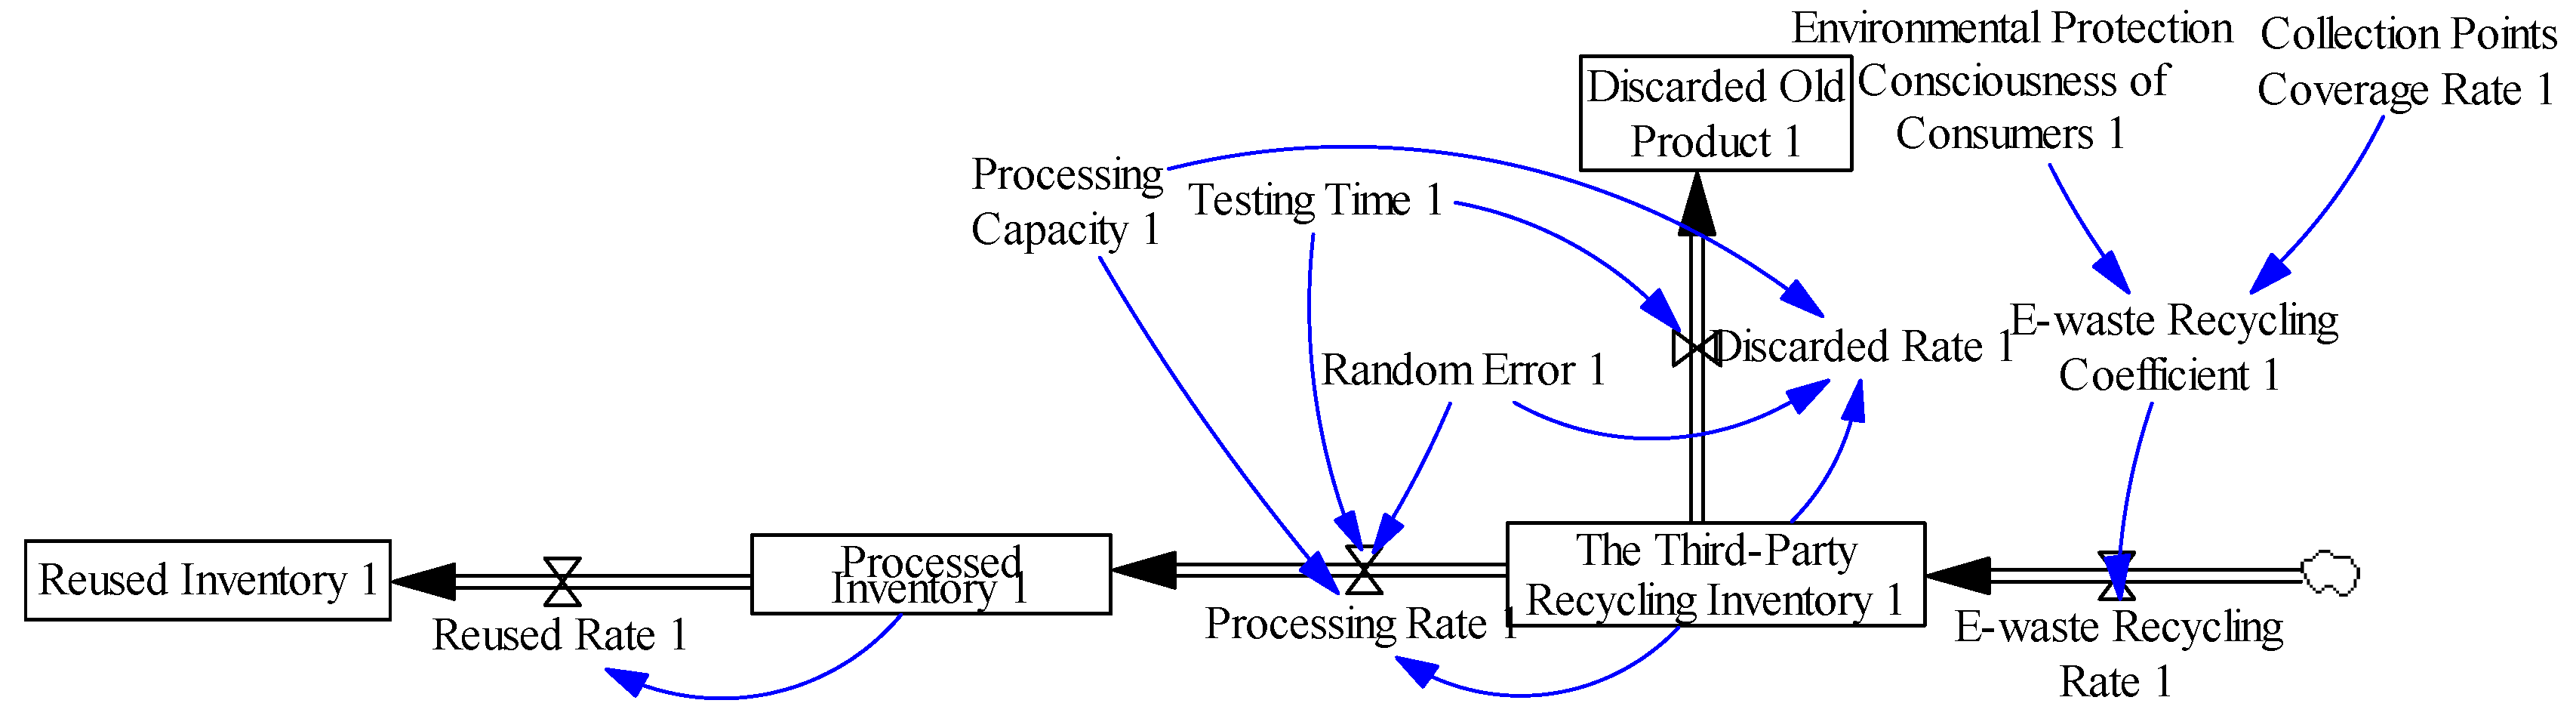
In Supply Chain 1, third-party enterprises are introduced as the recycling leader. The recycling processing mechanism is shown in Figure 3. In the model, we use the consumers’ environmental awareness and the coverage of recycling point to comprehensively measure the recycling capacity of third-party enterprises. If consumers have a good environment awareness it can help to cooperate with enterprises’ recycling activities and promote the recycling effectiveness of waste electronic products. Reasonable coverage of recycling point will help enterprises to realize the maximization of recycling efficiency while saving input cost. At the same time, the processing capacity of third-party enterprises also plays an important role in the recycling of waste electronic products. The enterprises with good processing capacity can facilitate the scientific treatment of waste electronic products thereby reducing the processing inputs and environmental pollution and improving recycling value. Related formulas in the model are as follows and the variable meaning of notations below are listed in Table 1.
Er 1 = Ec × E 1
Ec 1 = Cr 1 × Ce 1
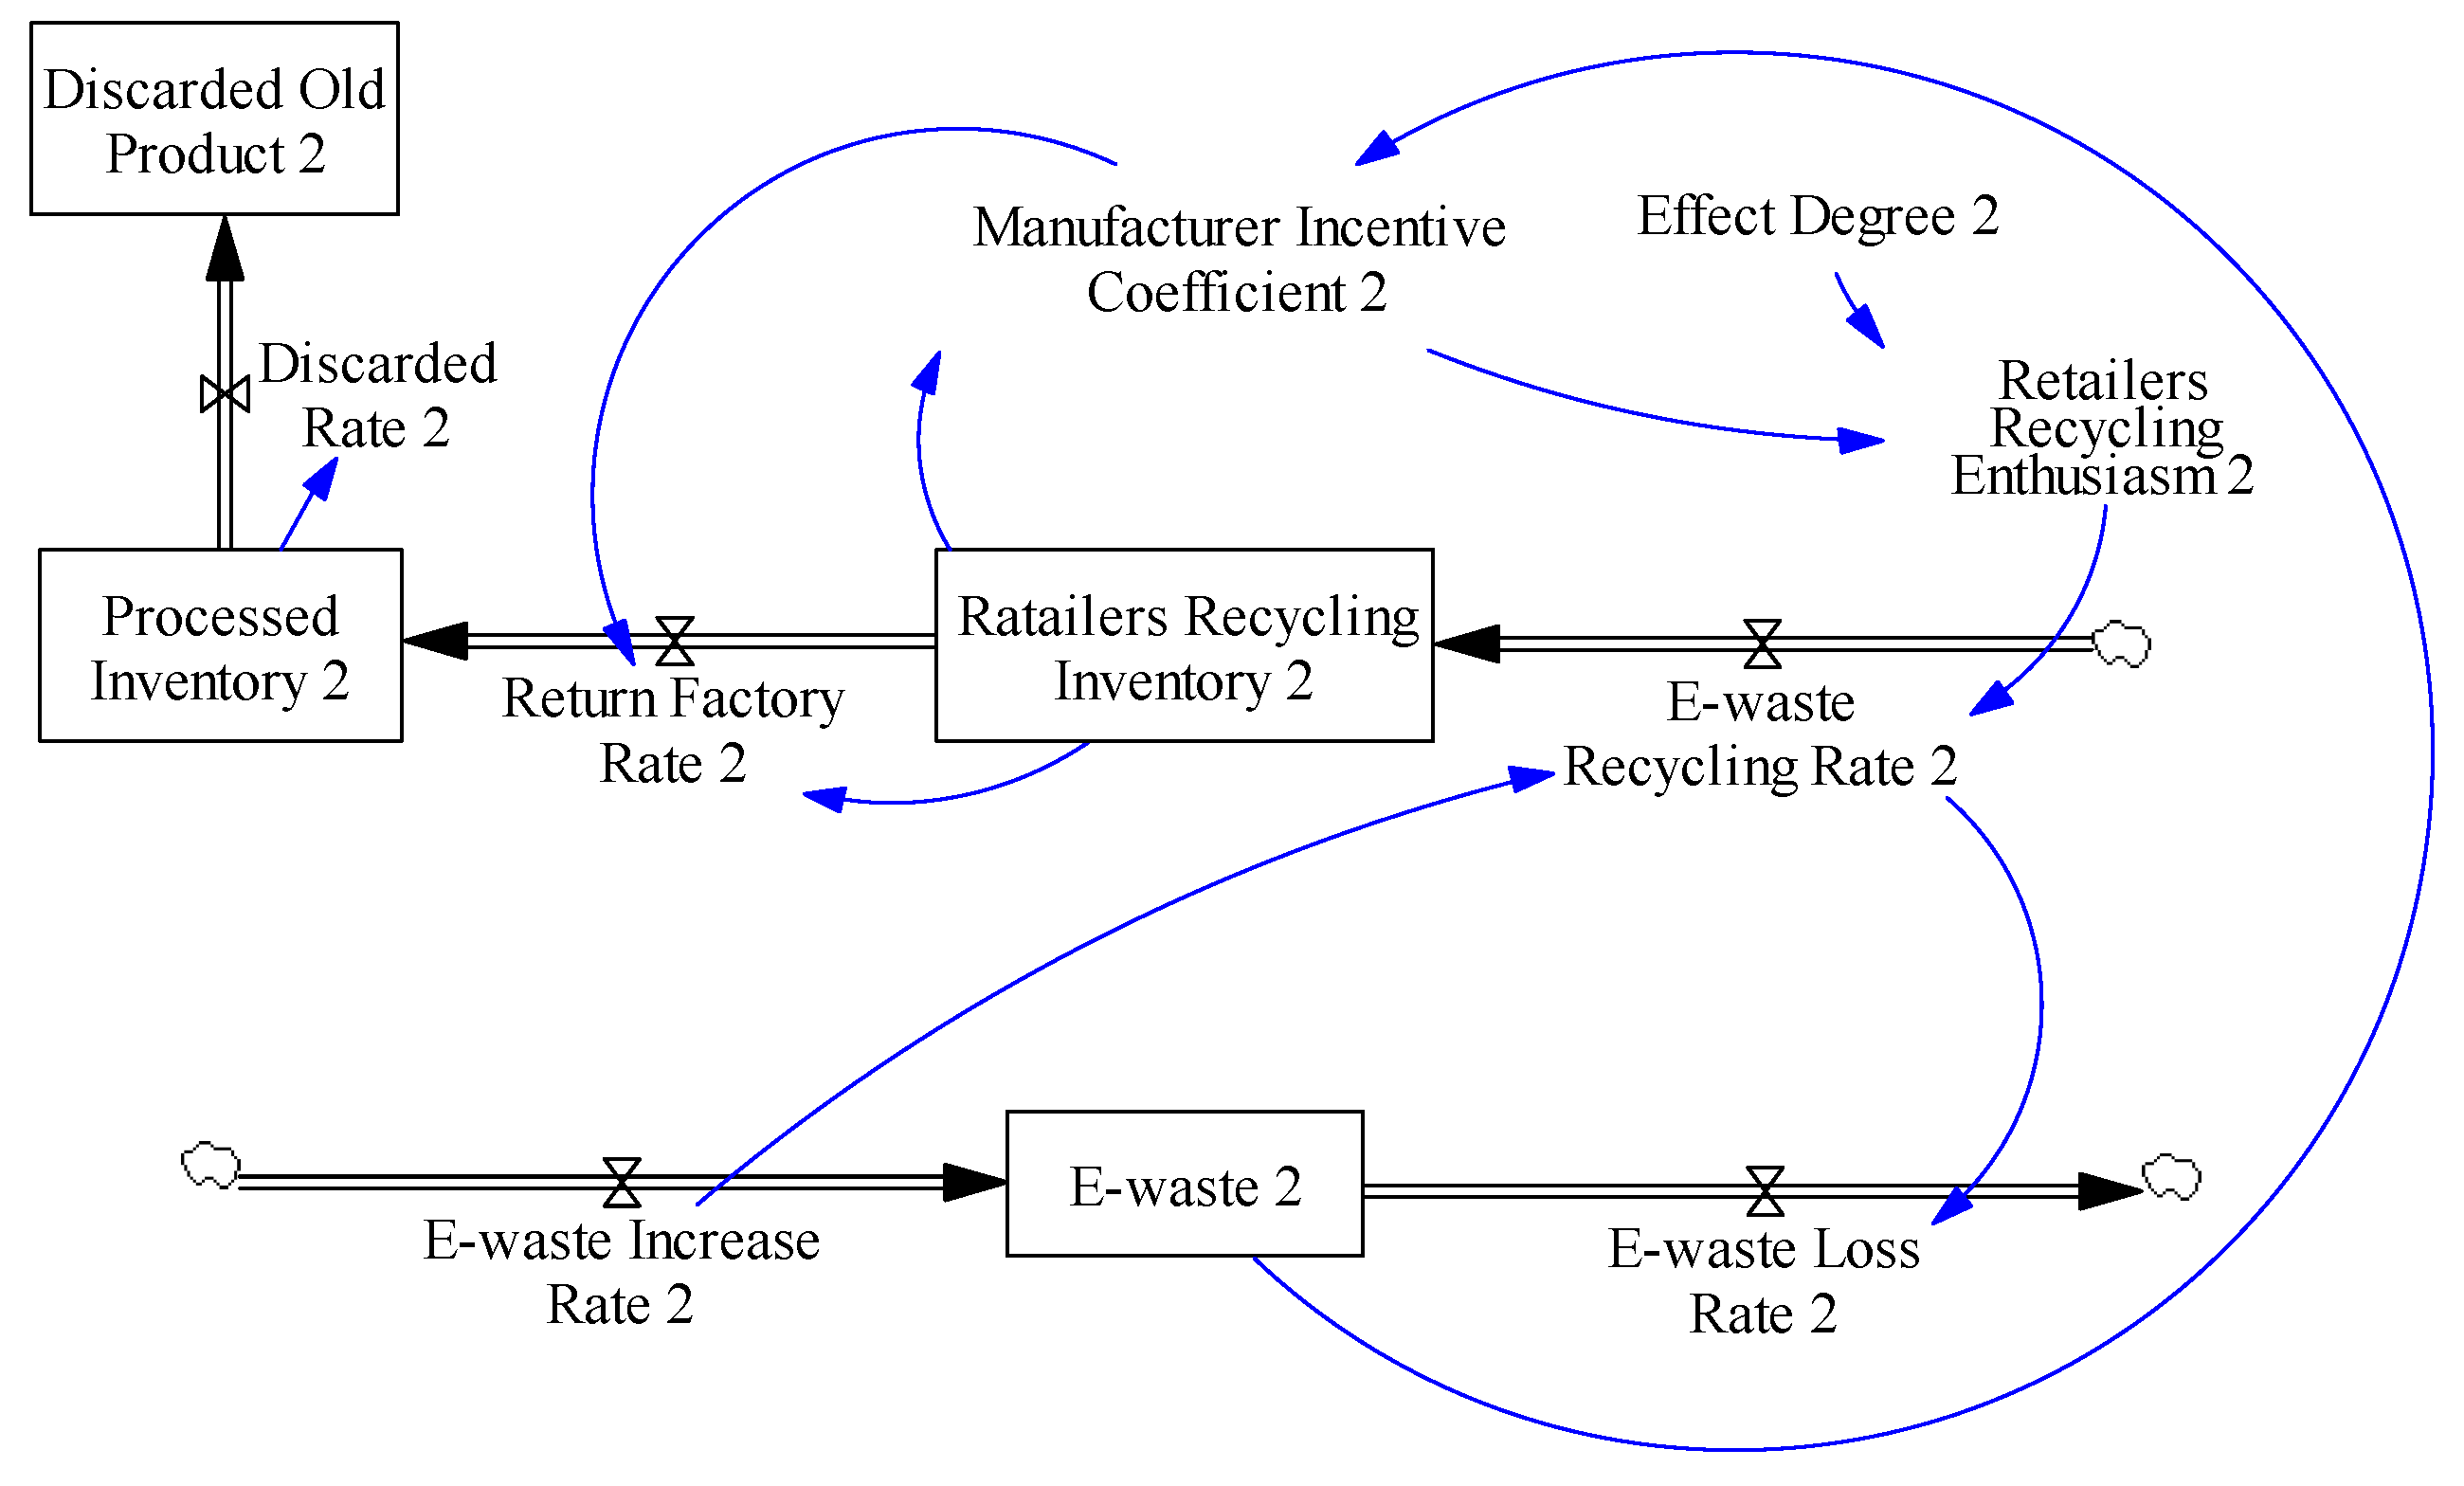
Supply Chain 2 introduces retailers as the recycling leader. The manufacturer of Supply Chain 2 determines the incentive strategy to subsidize retailers’ cost of recycling, which can improve retailers’ recycling initiative to achieve better recycling results. Related formulas in the model are as follows.
Manufacturer Incentive Coefficient = IF THEN ELSE (Retailers Recycling Inventory
≤ (0.7 × E-waste), IF THEN ELSE (Retailers Recycling Inventory
≤ (0.4 × E-waste), IF THEN ELSE (Retailers Recycling Inventory
≤ (0.1 × E-waste), 0.05, 0.25), 0.4), 0.55).
≤ (0.7 × E-waste), IF THEN ELSE (Retailers Recycling Inventory
≤ (0.4 × E-waste), IF THEN ELSE (Retailers Recycling Inventory
≤ (0.1 × E-waste), 0.05, 0.25), 0.4), 0.55).
In this incentive strategy, as shown in Figure 4, we determine the incentive coefficient by the ratio of the retailers’ recycling inventory in existing waste electronic products in the market. The incentive coefficient and the ratio are proportional. At the same time, the government can also adjust the Effect Degree by adopting relevant policies to improve retailers’ recycling initiative which can reduce the number of waste electronic products in the market.
3.4. Causal Loop Diagram of Inter-Chain Competition and Inner-Chain Competition
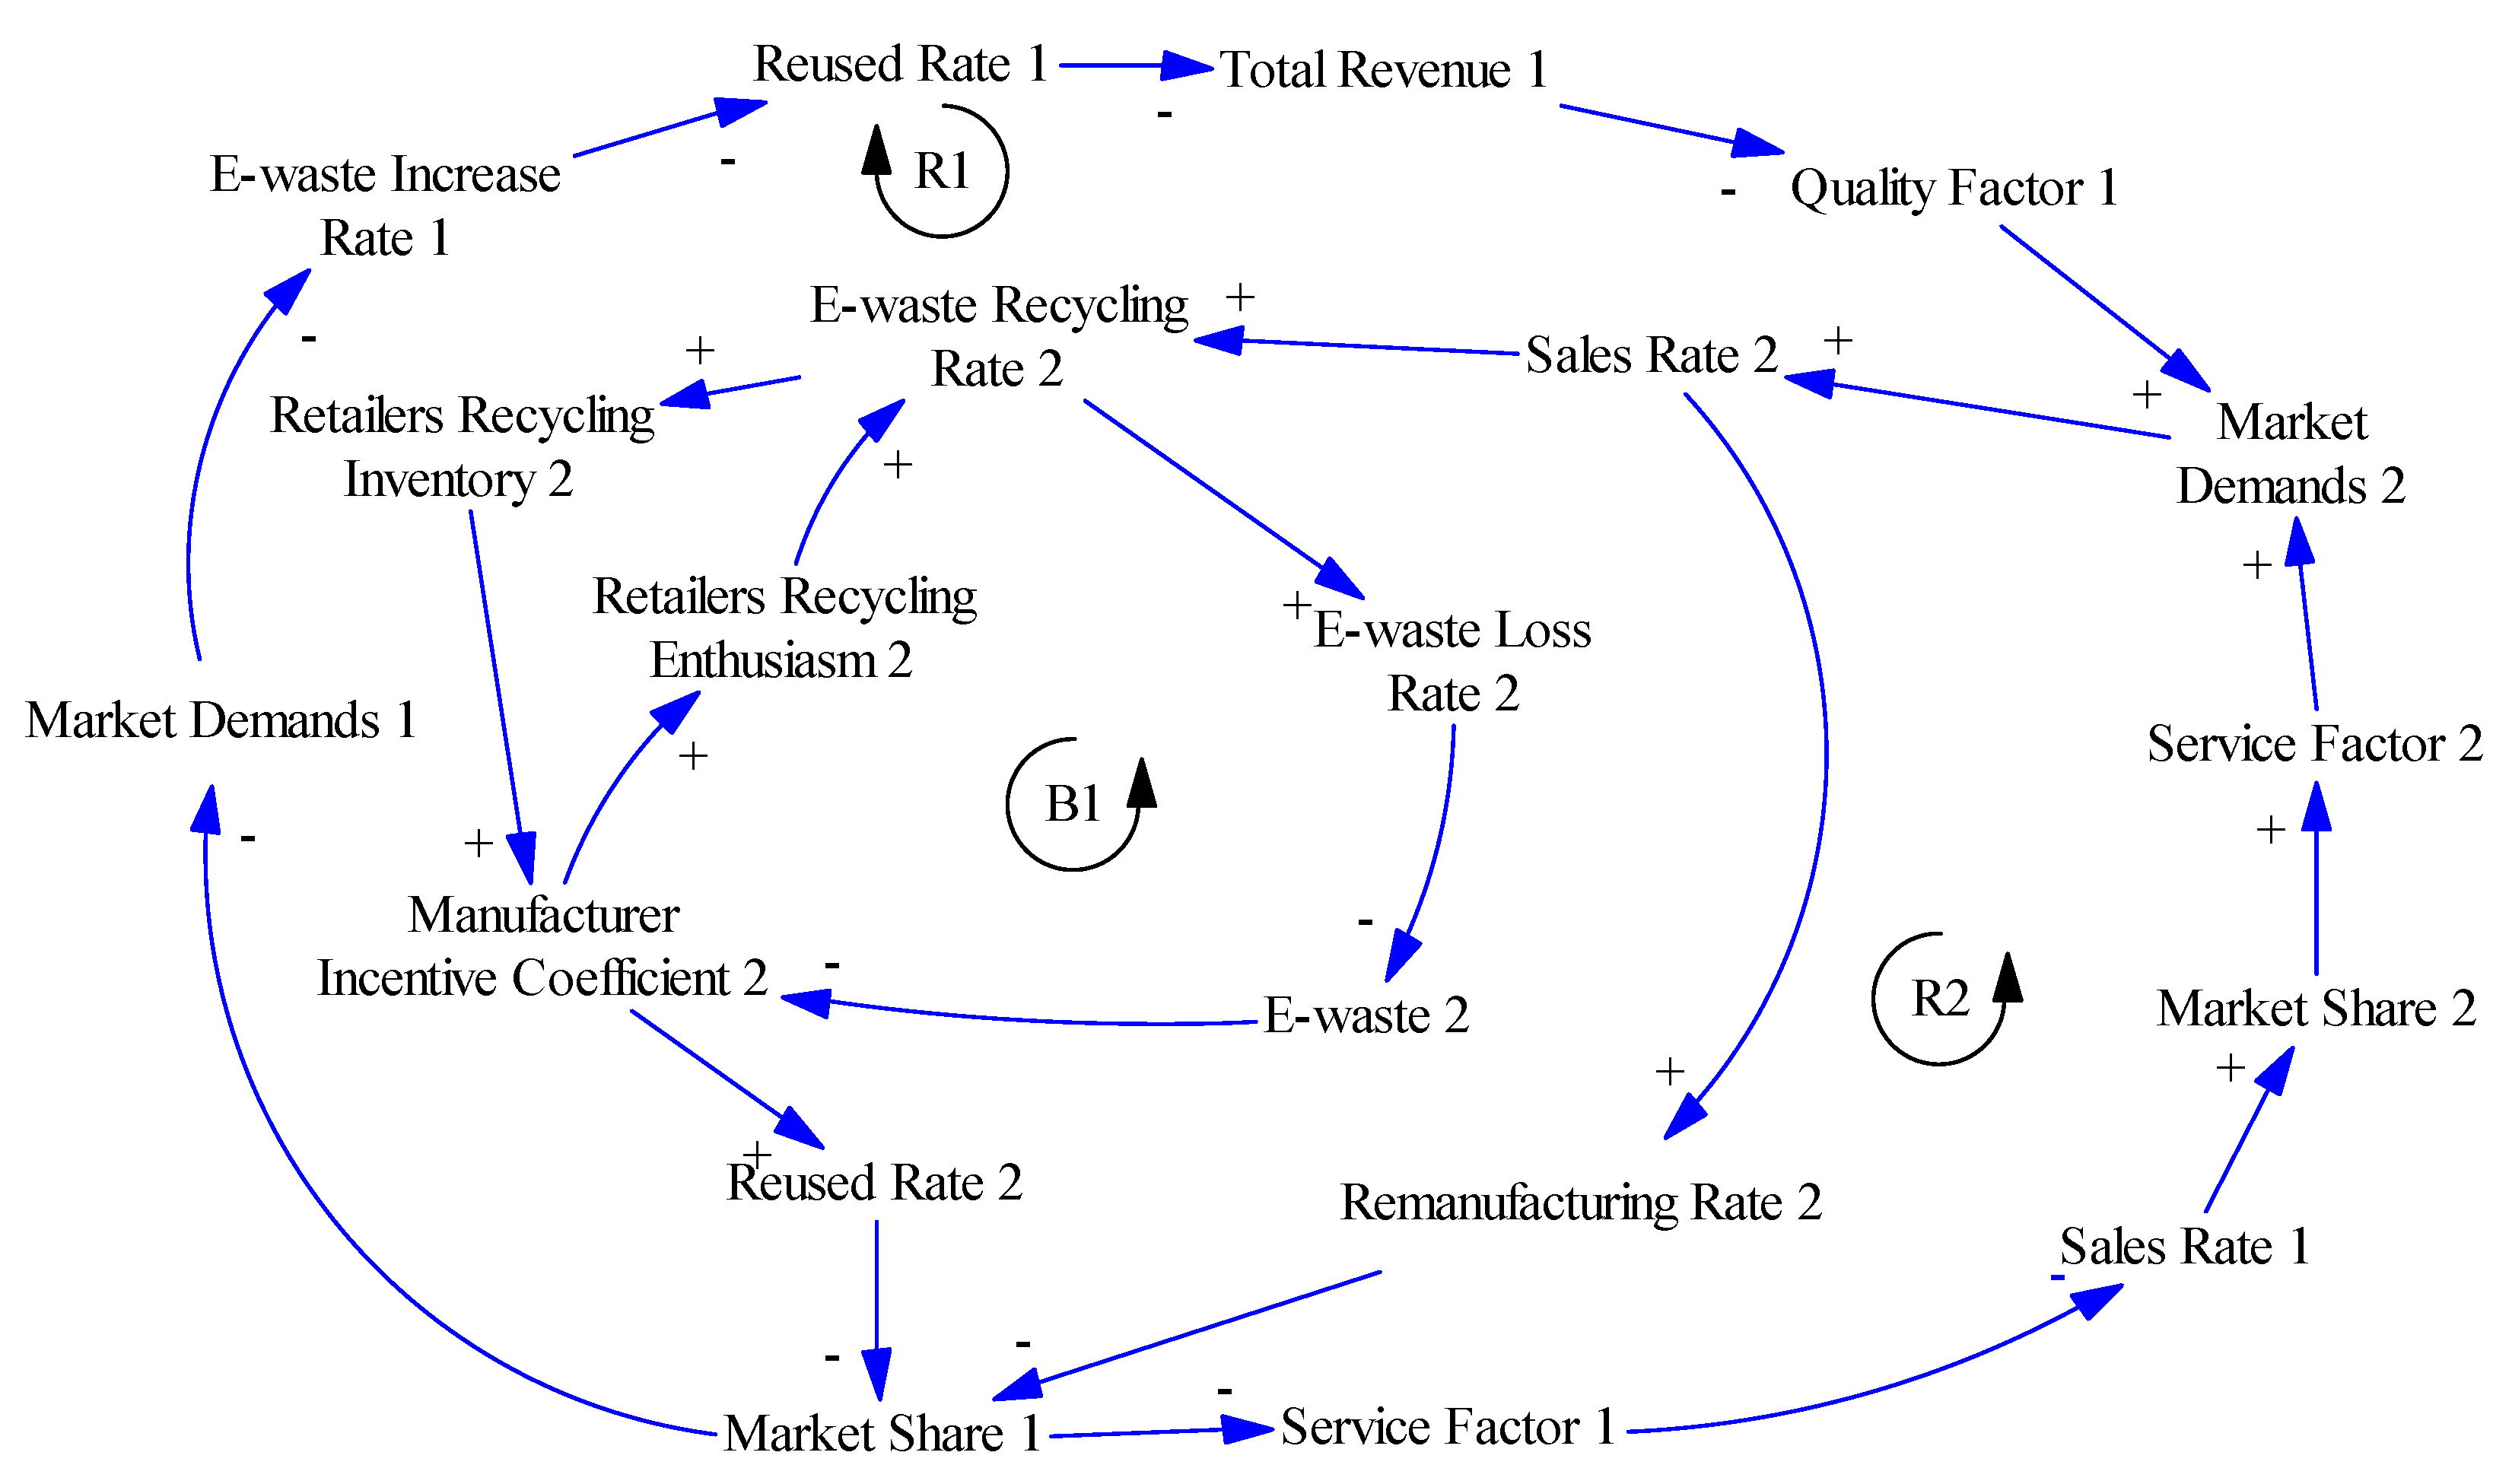
A causal loop diagram is used to reflect the correlation between elements and the feedback process of the system. In this analysis, the author considers the influential factors of each node in the closed-loop supply chain and establishes a causal loop diagram in Figure 5.
B1: Manufacturer Incentive Coefficient 2↑ → Retailers Recycling Enthusiasm 2↑ → E-waste Recycling Rate 2↑ → E-waste Loss Rate 2↓ → E-waste 2↓ → Manufacturer Incentive Coefficient 2↓.
B1 is an internal negative causal loop of the RD’s recycling mode. The increase of Manufacturer Incentive Coefficient 2 promotes Retailers Recycling Enthusiasm 2, the amount of e-waste in the market will also be reduced correspondingly, which causes the number of waste electronic products recycled by retailers not being able to meet the manufacturer’s requirements in the late period, so the manufacturers reduces their incentive coefficients appropriately.
R1: Remanufacturing Rate 2↑ → Market Share 1↓ → Market Demands 1↓ → E-waste Increase Rate 1↓ → Reused Rate 1↓ → Total Revenue 1↓ → Quality Factor 1↓ → Market Demands 2↑ → Sales Rate 2↑ → Remanufacturing Rate 2↑.
R1 is a causal loop of across-chain. To enhance the manufacturer‘s Remanufacturing Rate 2 in the recycling mode dominated by retailers, which affects the Market Share 1 of electronic products, Market Demands 1 and Total Revenue 1 in the 3PD’s recycling mode, it can effectively promote the market share of the enterprises in the RD’s recycling mode, which enhances Market demands 2 and Sales Rate 2 of electronic products.
R2: Manufacturer Incentive Coefficient 2↑ → Reused Rate 2↑ → Market Share 1↓ → Service Factor 1↓ →Sales Rate 1↓ → Market Share 2↑ → Service Factor 2↑ → Market Demands 2↑ → Sales Rate 2↑ → E-waste Recycling Rate 2↑ → Retailers Recycling Inventory 2↑ → Manufacturer Incentive Coefficient 2↑.
R2 is a causal loop of across-chain. In the RD’s recycling mode, manufacturers encourage retailers in e-waste recycling by setting up some incentive mechanisms to speed up the flow of electronic products in the market, which promotes their market competitiveness and enhancing Service Factor 2 and Market Demand 2.
4. Simulation and Discussion
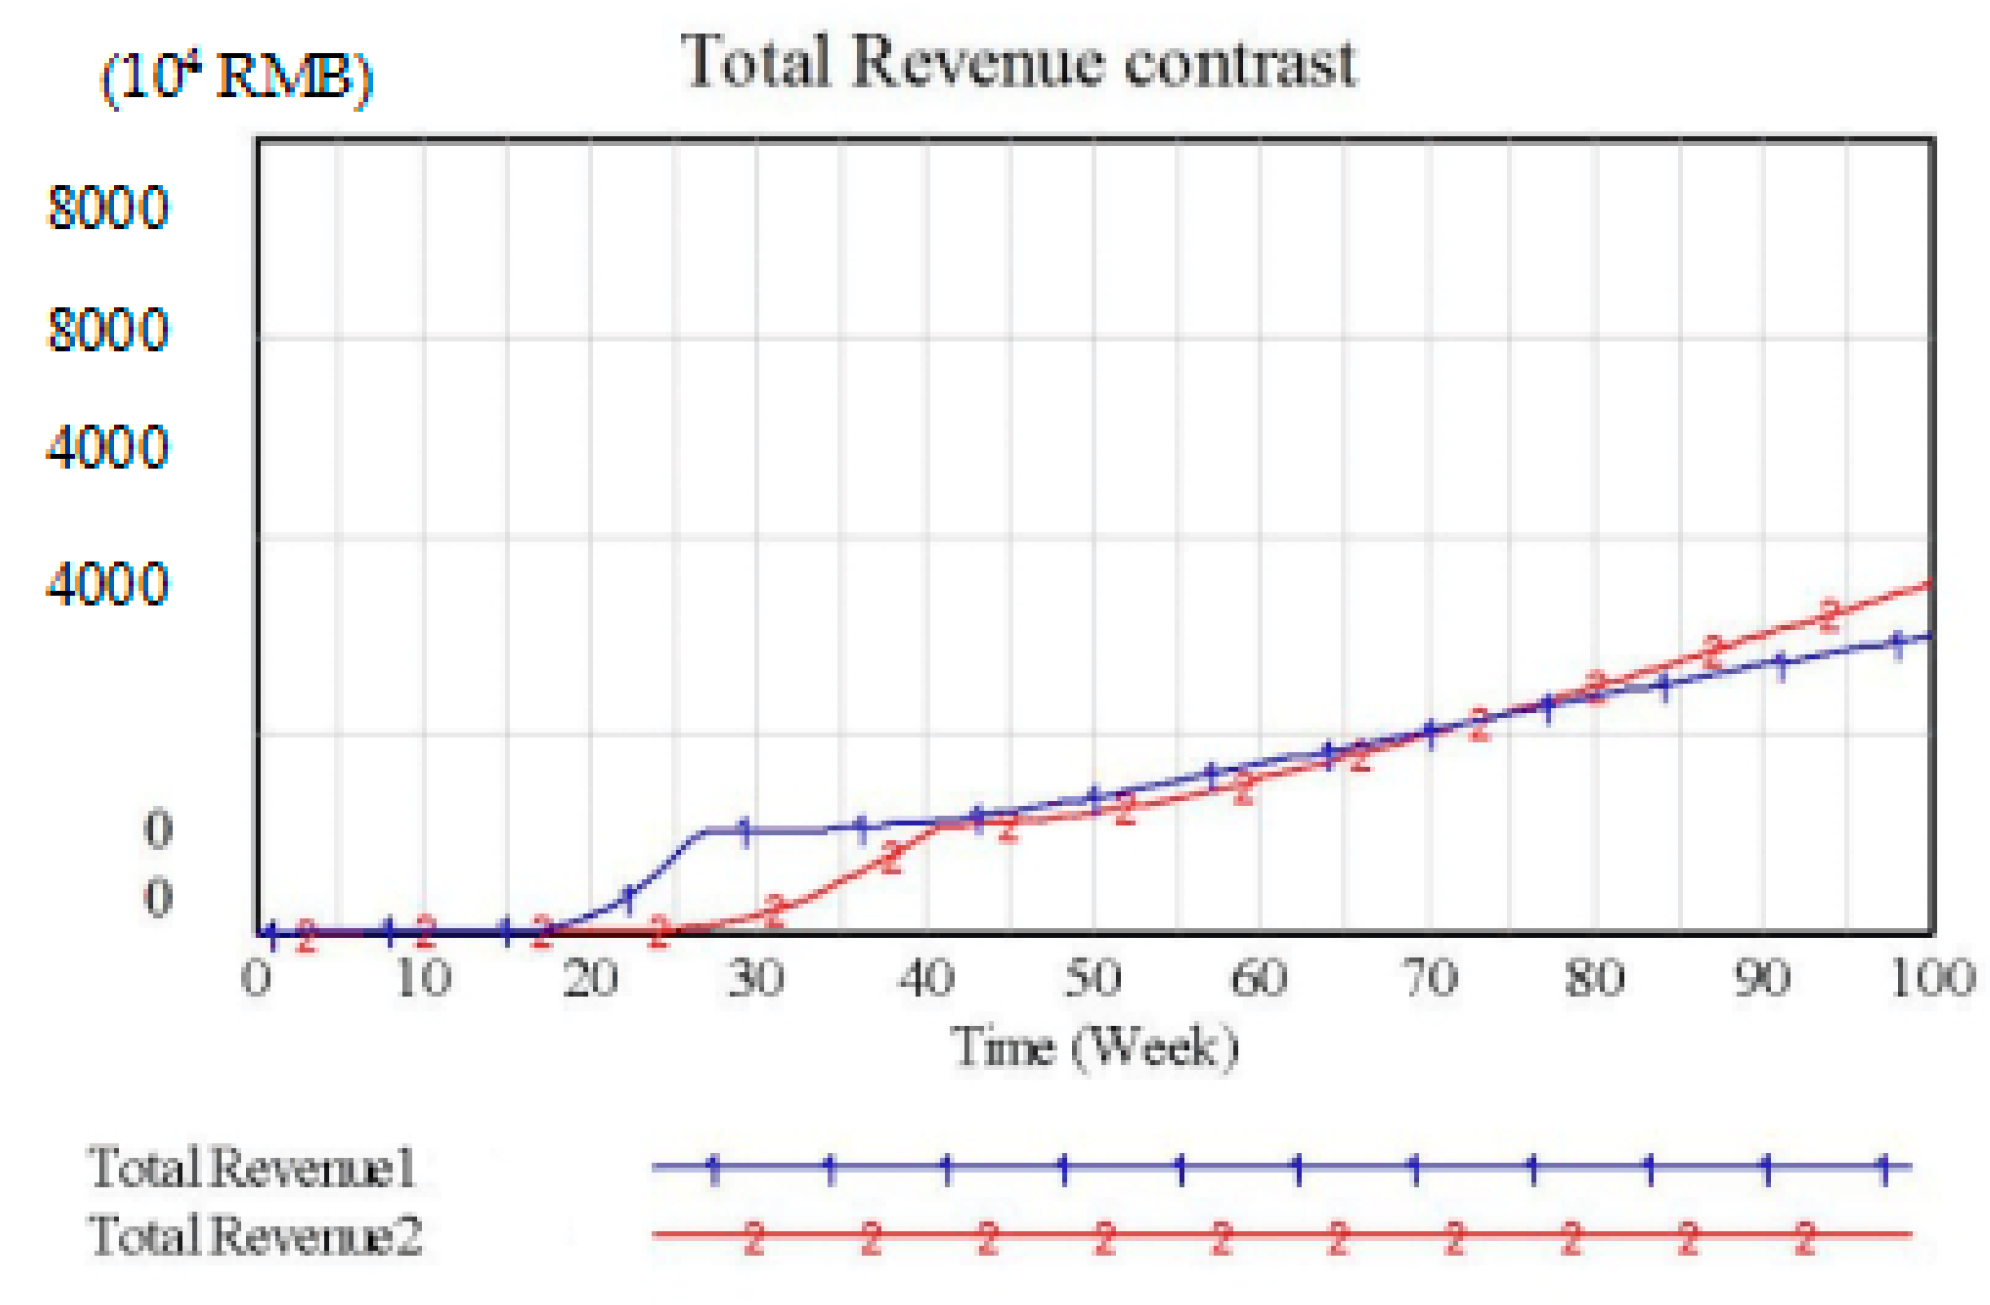
Because the recycling process of 3PD and RD is different, the cost difference obviously exists in the process. Therefore, the total revenue of both is necessarily different. To adjust the total revenue of the supply chain in both recycling modes to the same level, we set the recycling point coverage to 0.1875, consumer awareness to 0.3, manufacturers incentive coefficient to 0.2, and third-party’s processing capacity to 0.7 according to actual business operation research of Gree and Haier. The simulation results of the two supply chains’ total revenue are shown in Figure 6. Because of the time delay of production, sale, recycling, etc., the total revenue of the supply chain in both recycling modes is 0 in the initial period. Supply Chain 1 generates revenue from the 17th week, while Supply Chain 2 profits from the 25th week. We can see that the total revenue of Supply Chain 2 is slightly lower than Supply Chain 1, which has lasted until the 73rd week to produce a small margin of transcendence. However, overall, the trend of the two chains’ total revenue is basically the same.
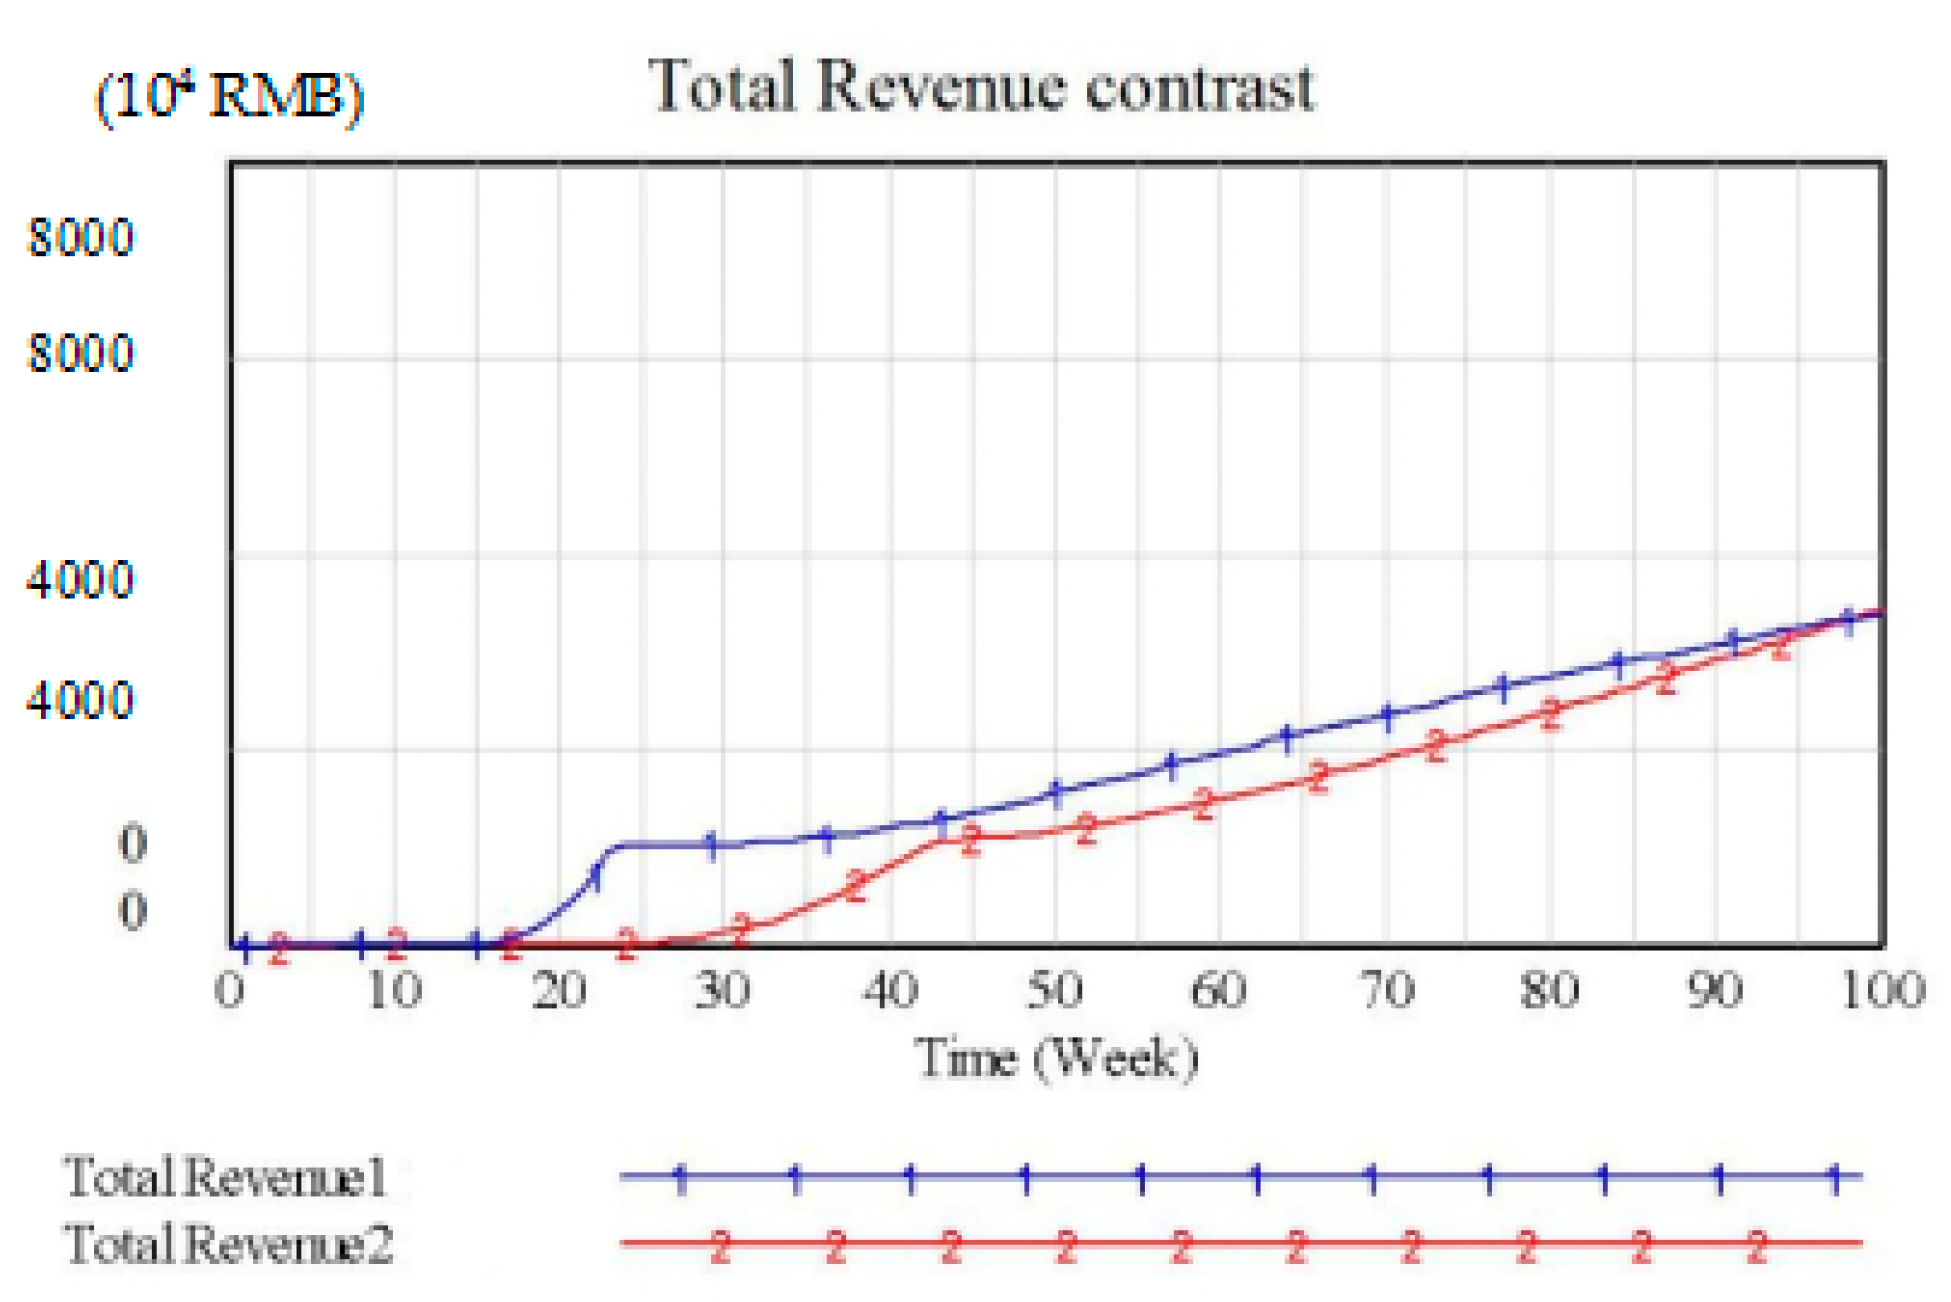
Government strengthening the propaganda of low-carbon environmental protection could effectively improve the consumers’ environmental awareness and promote consumers’ consciousness to classify and dispose waste electronic products. The simulation results are shown in Figure 7. In the figure, it can be seen that recycling can effectively improve the two supply chains’ total revenue. However, due to the third-party enterprise’s collection points are widely distributed, Supply Chain 1’s profit is relatively more obvious.
Supply Chains 1 and 2 compete for the same market. Due to limited market resources [50], the benefits of Supply Chain 2 will be compromised when Supply Chain 1 profits. Here, we can improve the retailer’s recycling enthusiasm to adjust recycling strategy of Supply Chain 2. First, the manufacturers improve recycling subsidies for retailers by adjusting the incentive strategy. Second, Effect Degree is increased through the government intervention and supporting retailers to carry out waste electronic products recycling activities from the perspective of environmental protection.
Here, we adjust the manufacturer’s incentive strategy for retailers:
Manufacturer Incentive Coefficient = IF THEN ELSE (Retailers Recycling Inventory
≤ (0.7 * E-waste), IF THEN ELSE (Retailers Recycling Inventory
≤ (0.4 * E-waste), IF THEN ELSE (Retailers Recycling Inventory
≤ (0.1 * E-waste), 0.15, 0.35), 0.45), 0.65).
≤ (0.7 * E-waste), IF THEN ELSE (Retailers Recycling Inventory
≤ (0.4 * E-waste), IF THEN ELSE (Retailers Recycling Inventory
≤ (0.1 * E-waste), 0.15, 0.35), 0.45), 0.65).
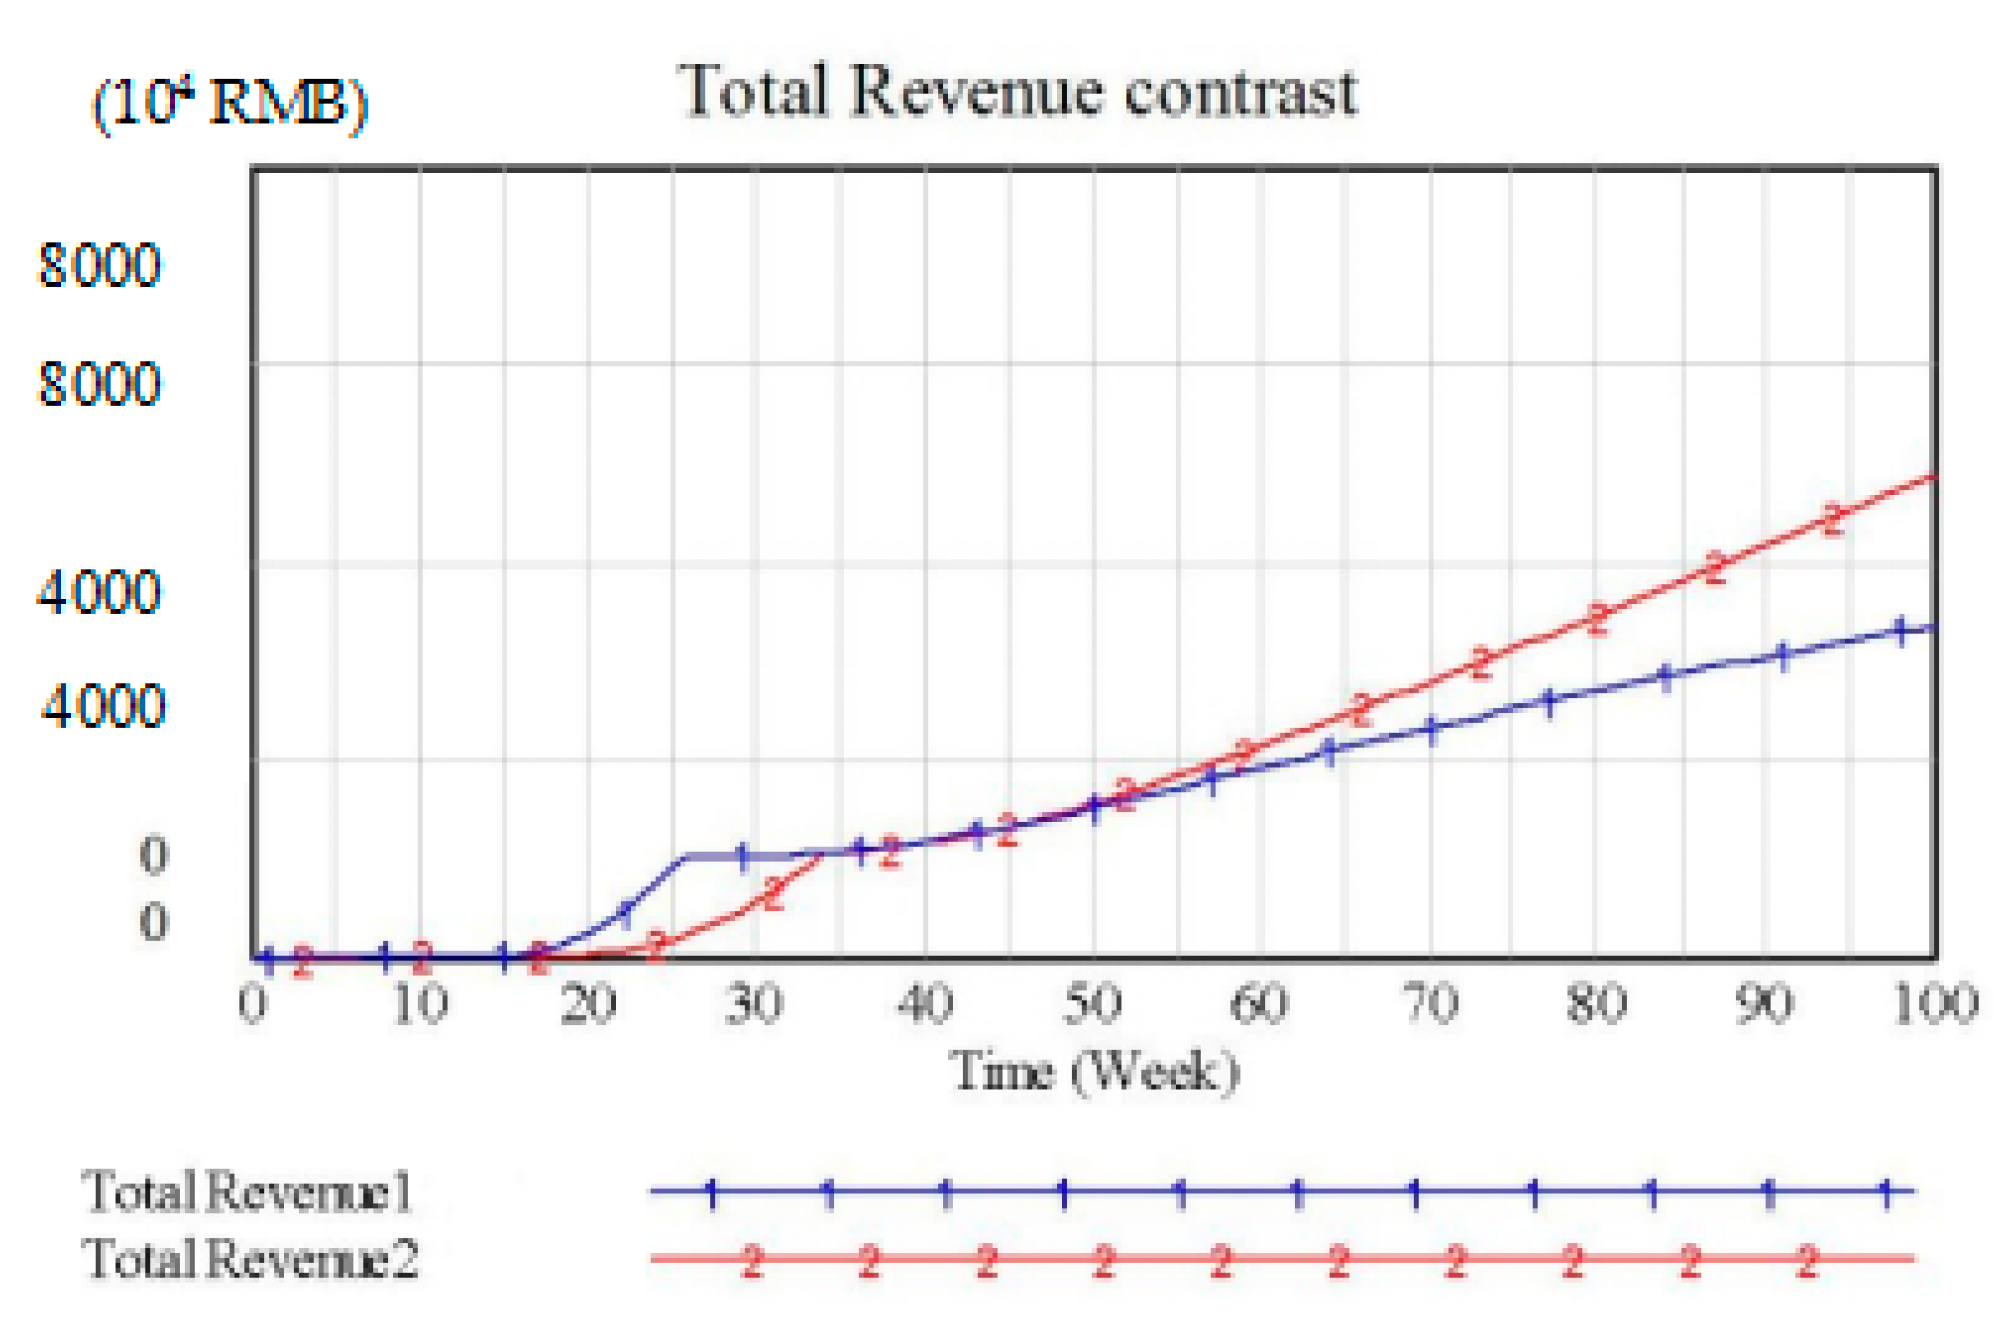
The simulation result is shown in Figure 8. When the incentive strategy is adjusted, the total revenue of Supply Chain 2 exceeds that of Supply Chain 1 from the 46th week. Because the manufacturer’s incentive strategy for retailers has boosted the reverse flow efficiency of waste electronic products, which stimulates market demand and shortens the profit cycle of the enterprise, we also found that the initial profit of Supply Chain 2 was put forward by six weeks. The effect of raising the Effect Degree through the government’s advocacy of environmental policies is similar.
In this model, we introduce quality factor and service factor to measure the market demand of two supply chains. The linear relation function between the quality factor and the total revenue (that is, the quality factor and the total revenue are mutually promoted) and the linear relation function between the service factor and the market share (that is, the service factor and the market share promote each other) are constructed separately. Related formulas in the model are as follows:
Market Demands 1 = (Total Market Demands * (Service Factor 1 * Service Factor
Proportion + Quality Factor 1 * (1 − Service Factor Proportion)))/(Service Factor 1 *
Service Factor Proportion + Quality Factor 1 * (1 − Service Factor Proportion) + Service
Factor 2 * Service Factor Proportion + Quality Factor 2 * (1 − Service Factor Proportion))
Proportion + Quality Factor 1 * (1 − Service Factor Proportion)))/(Service Factor 1 *
Service Factor Proportion + Quality Factor 1 * (1 − Service Factor Proportion) + Service
Factor 2 * Service Factor Proportion + Quality Factor 2 * (1 − Service Factor Proportion))
Market Demands 2 = (Total Market Demands *(Service Factor 2 * Service Factor
Proportion + Quality Factor 2 * (1 − Service Factor Proportion)))/(Service Factor 1 *
Service Factor Proportion + Quality Factor 1 * (1 − Service Factor Proportion) + Service
Factor 2 * Service Factor Proportion + Quality Factor 2 * (1 − Service Factor Proportion))
Proportion + Quality Factor 2 * (1 − Service Factor Proportion)))/(Service Factor 1 *
Service Factor Proportion + Quality Factor 1 * (1 − Service Factor Proportion) + Service
Factor 2 * Service Factor Proportion + Quality Factor 2 * (1 − Service Factor Proportion))
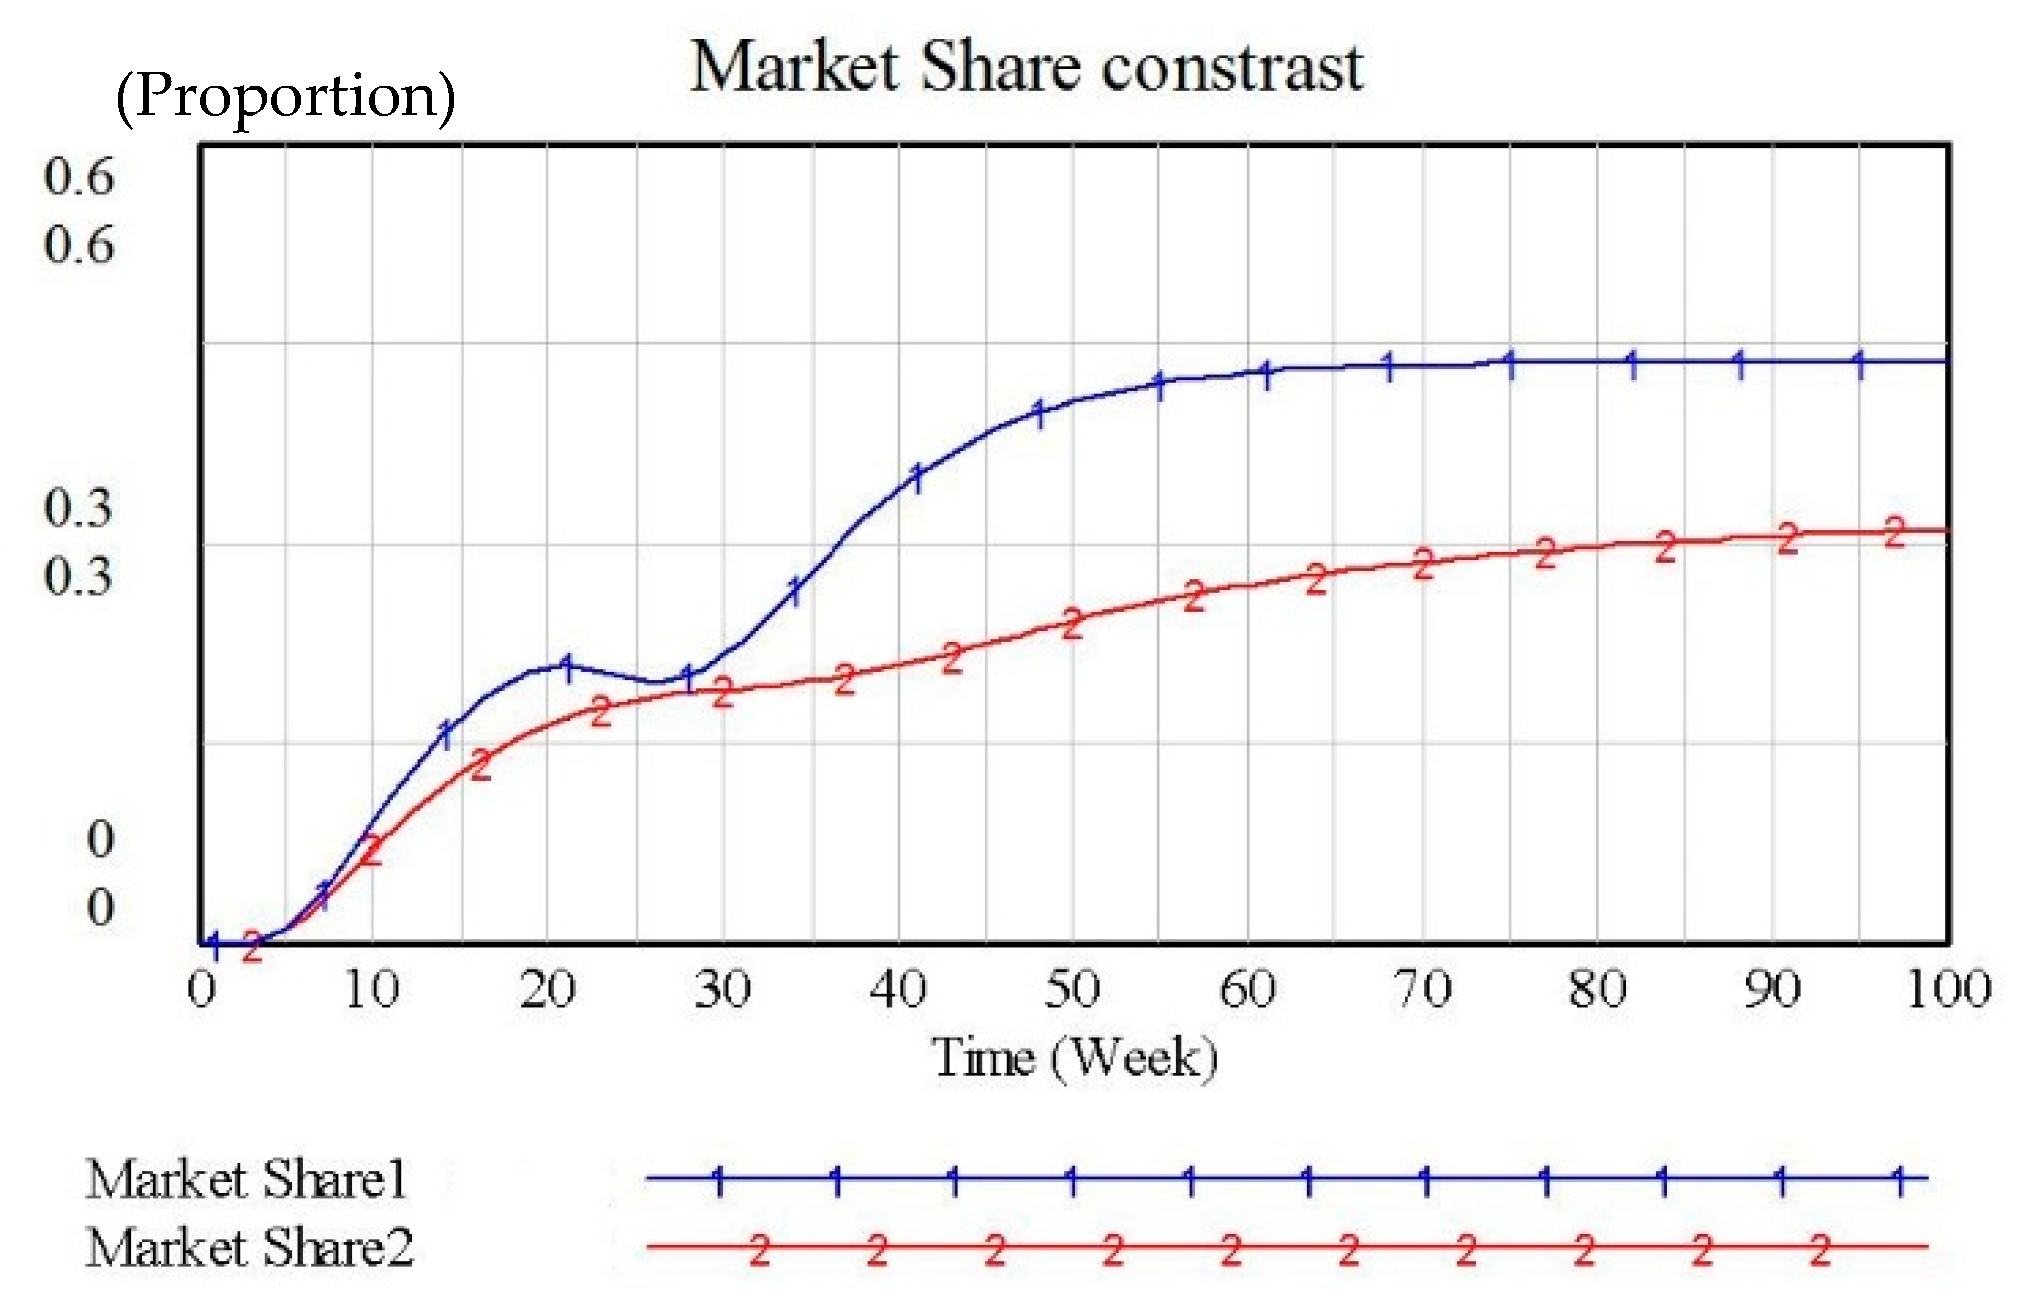
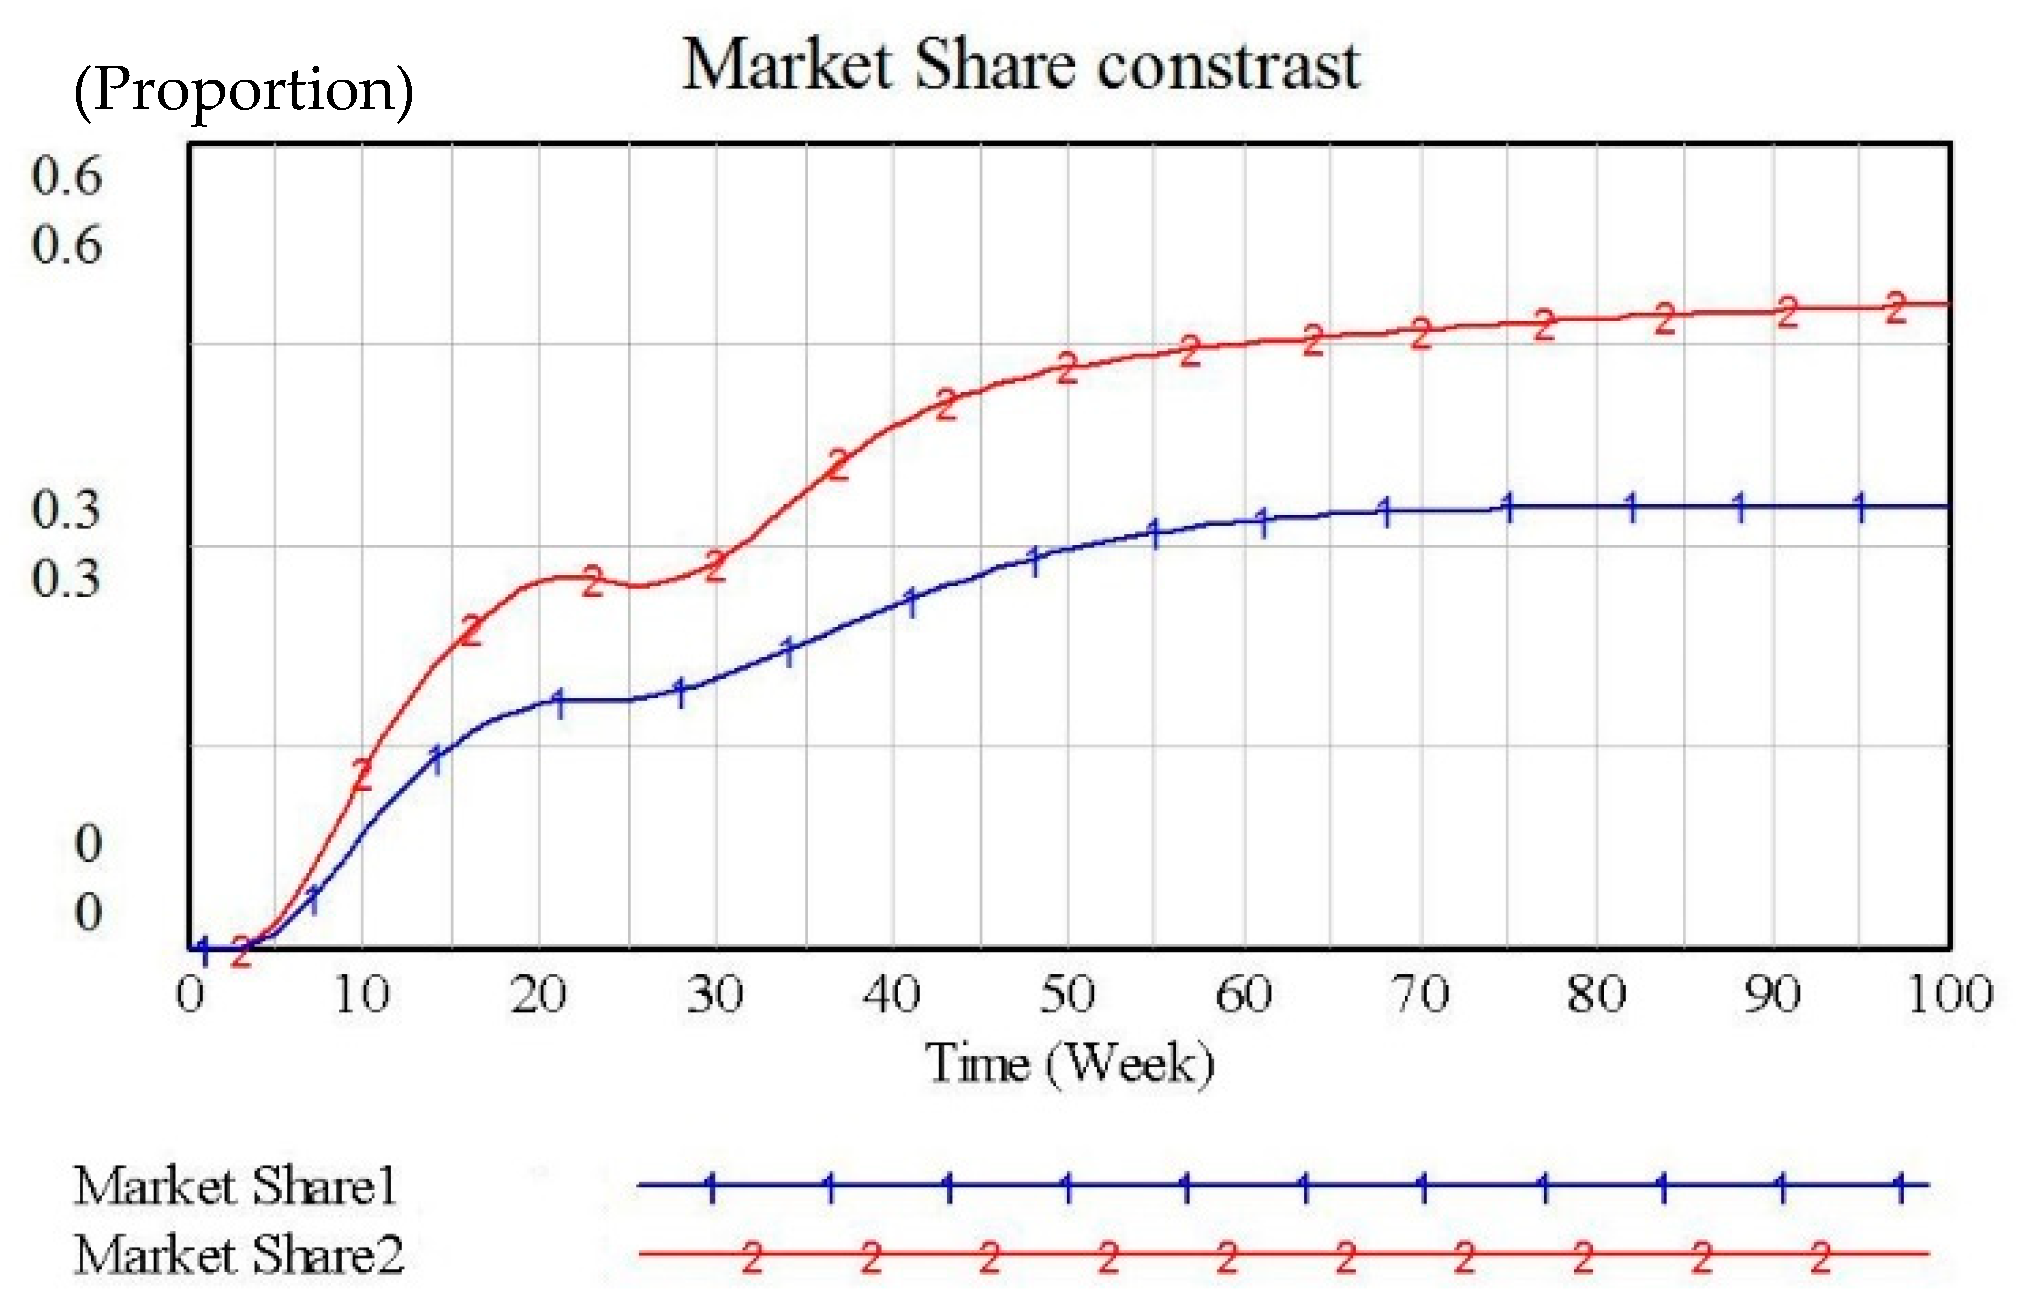
Although Supply Chain 2 has a higher total revenue than Supply Chain 1 in Figure 9, it is still in an inferior position in market share competition. To change this situation, we have increased the remanufacturing influence coefficient of Supply Chain 2 from 0.3 to 0.6, that is, retailers have increased their recycling efficiency by increasing recycling channels (such as increasing recycling price, undertaking trade-in activities, etc.). The simulation result is shown in Figure 10.
5. Conclusions
The e-waste recycling model contains high economic value and social value. It has a great significance to the society, enterprises and consumers. The choice of recycling mode also gradually becomes an important step in determining the competitiveness of the supply chain. Combining the implementation of renewable resources projects of Gree and Haier, this paper studies 3PD and RD’s recycling structures, respectively; constructs the dual chains competition model of recycling and remanufacturing of Gree and Haier by means of system dynamics approach; and simulates this model. By adjusting their model variables, this paper explores the optimal strategy of two recycling modes, which can provide the theoretical guidance for enterprises and governments to choose the appropriate recycling mode. Appropriately increasing recycling point will help improve the total revenue. The publicity for environmental protection can effectively improve consumers’ awareness of environmental protection and the consciousness of classifying waste electronic products. However, it will increase the cost of third-party enterprises. Optimizing the incentive strategy between manufacturers and retailers can effectively improve the retailer’s recycling enthusiasm and promote the reverse flow efficiency. It can stimulate the market demand and shorten the profit cycle of the enterprise. Retailers can enhance their recycling efficiency by increasing recycling channels (such as adjusting recycling prices, carrying out trade-in activities, etc.), which will help supply chain strengthen the competitive advantage.
This study only investigated Gree and Haier. Although it has certain practical significance, it is unique and cannot completely represent the entire appliance industry’s reality situation, which has enhanced the possibility that recycling mode’s construct is not comprehensively considered. In further research, it is necessary to collect the relevant recycling data of home appliance industry more extensively to describe, analyze and compare various recycling models more comprehensively.
Author Contributions
R.Z. conducted the study design, prepared data, performed the simulation analysis and drafted the manuscript. F.Z. organized this study, contributed to study design, and interpreted the analysis. F.T., R.O. and S.M. revised the manuscript.
Funding
This study was funded by the National Natural Science Foundation of China (Project No. 61172168), Heilongjiang Province Education Department Scientific Research Project (Project No. 135109248) and Qiqihar University Young Teacher Startup Project (Project No. 2014k-M11).
Conflicts of Interest
The authors declare no conflict of interest.
References
- Ahsan, K.; Rahman, S. An investigation into critical service determinants of customer to business (C2B) type product returns in retail firms. Int. J. Phys. Distrib. Logist. Manag. 2016, 46, 606–633. [Google Scholar] [CrossRef]
- Marketwatch. Consumers Return $642.6 Billion in Goods each Year. Available online: http://www.marketwatch.com/story/consumers-return-6426-billion-in-goods-each-year-201506-18 (accessed on 22 September 2017).
- The Guardian. China’s Booming Middle Class drives Asia’s Toxic e-Waste Mountains. Available online: https://www.theguardian.com/environment/2017/jan/16/chinas-booming-middle-class-drivesasias-toxic-e-waste-mountains 16/01/17 (accessed on 24 September 2017).
- Pantano, E.; Iazzolino, G.; Migliano, G. Obsolescence risk in advanced technologies for retailing: A management perspective. J. Retail. Consum. Serv. 2013, 20, 225–233. [Google Scholar] [CrossRef]
- Lu, B.; Liu, J.; Yang, J.; Li, B. The environmental impact of technology innovation on WEEE management by multi-Life cycle assessment. J. Clean. Prod. 2015, 89, 148–158. [Google Scholar] [CrossRef]
- Gunningham, N.; Sinclair, D. Leaders and laggards: Next-Generation Environmental Regulation. Routledge. Gree Website, Gree Electric Appliances Inc. of Zhuhai China, Company Profile. Available online: http://global.gree.com/ywb/aboutgree/companyintroduction/index.shtml (accessed on 23 September 2017).
- Ramanathan, R.; He, Q.; Black, A.; Ghobadian, A.; Gallear, D. Environmental regulations, innovation and firm performance: A revisit of the Porter hypothesis. J. Clean. Prod. 2017, 155, 79–92. [Google Scholar] [CrossRef] [Green Version]
- Shaharudin, M.R.; Govindan, K.; Zailani, S.; Tan, K.C.; Iranmanesh, M. Product return management: Linking product returns, closed-loop supply chain activities and the effectiveness of the reverse supply chains. J. Clean. Prod. 2017, 149, 1144–1156. [Google Scholar] [CrossRef]
- He, Y. Supply risk sharing in a closed-loop supply chain. Int. J. Prod. Econ. 2017, 183, 39–52. [Google Scholar] [CrossRef]
- Suki, N.M.; Suki, N.M. Correlations between awareness of green marketing, corporate social responsibility, product image, corporate reputation, and consumer purchase intention. In Green Marketing and Environmental Responsibility in Modern Corporations; IGI Global: Hershey, PA, USA, 2017; pp. 201–215. [Google Scholar]
- Sadovnikova, A.; Pujari, A. The effect of green partnerships on firm value. J. Acad. Mark. Sci. 2017, 45, 251–267. [Google Scholar] [CrossRef]
- Govindan, K.; Soleimani, H. A review of reverse logistics and closed-loop supply chains: A Journal of Cleaner Production focus. J. Clean. Prod. 2017, 142, 371–384. [Google Scholar] [CrossRef]
- Abbey, J.D.; Guide, V.D.R., Jr. Closed-Loop Supply Chains: A Strategic Overview; Springer: Berlin/Heidelberg, Germany, 2017; pp. 375–393. [Google Scholar]
- Zhang, J.; Li, H.; Yan, R.; Johnston, C. Examining the signaling effect of retailers’ return policies. J. Comput. Inf. Syst. 2017, 57, 191–200. [Google Scholar]
- Murfield, M.; Murfield, M.; Boone, A.; Rutner, P.; Thomas, R. Investigating logistics service quality in omni-channel retailing. Int. J. Phys. Distrib. Logist. Manag. 2017, 47, 263–296. [Google Scholar] [CrossRef]
- Savaskan, R.C.; Bhattacharya, S.; Van Eisenhower, L.N. Channel Choice and Coordination in a Remanufacturing Environment; INSEAD: Fontainebleau, France, 2000. [Google Scholar]
- Savaskan, R.C.; Wassenhove, L.N.V. Reverse channel design: The case of competing retailers. Manag. Sci. 2006, 52, 1–14. [Google Scholar] [CrossRef]
- Tansel, B. From electronic consumer products to e-wastes: Global outlook, waste quantities, recycling challenges. Environ. Int. 2017, 98, 35–45. [Google Scholar] [CrossRef] [PubMed]
- Xu, B.; Yang, J.M. Research on competition between two closed-loop supply chains and coordination within one closed-loop supply chain under stochastic demand. J. Nanchang Univ. (Eng. Technol.) 2012, 34, 300–306. [Google Scholar]
- Sun, J.Y.; Teng, C.X.; Chen, Z.B. Dynamic model of closed-loop supply chain network with product remanufacturing based on differential variational inequality. Syst. Eng. Theory Pract. 2015, 35, 1155–1164. [Google Scholar]
- Choi, T.M.; Li, Y.; Xu, L. Channel leadership, performance and coordination in closed loop supply chains. Int. J. Prod. Econ. 2013, 146, 371–380. [Google Scholar] [CrossRef]
- Masi, D.; Day, S.; Godsell, J. Supply chain configurations in the circular economy: A systematic literature review. Sustainability 2017, 9, 1602. [Google Scholar] [CrossRef]
- Hong, X.P.; Xu, L.; Du, P. Joint advertising, pricing and collection decisions in a closed-loop supply chain. Int. J. Prod. Econ. 2015, 167, 12–22. [Google Scholar] [CrossRef]
- Song, M.; Huang, M.; Wang, X.W. Selection strategies of channel structure for competing closed-loop supply chains. Control Decis. 2013, 28, 1247–1252. [Google Scholar]
- Tanskanen, P. Management and recycling of electronic waste. Acta Mater. 2013, 61, 1001–1011. [Google Scholar] [CrossRef]
- Varsei, M.; Soosay, C.; Fahimnia, B.; Sarkis, J. Framing sustainability performance of supply chains with multidimensional indicators. Supply Chain Manag. Int. J. 2014, 19, 242–257. [Google Scholar] [CrossRef]
- Ahi, P.; Searcy, C. An analysis of metrics used to measure performance in green and sustainable supply chains. J. Clean. Prod. 2015, 86, 360–377. [Google Scholar] [CrossRef]
- Golroudbary, S.R.; Zahraee, S.M. System dynamics model for optimizing the recycling and collection of waste material in a closed-loop supply chain. Simul. Model. Pract. Theory 2015, 53, 88–102. [Google Scholar] [CrossRef]
- Hu, H.C.; Hu, X.Y.; Meng, Z.W.; Zhai, W.T. Research on Recycling Strategy of Retailer cooperating with the Third-party in Closed-loop Supply Chain. In Proceedings of the International Conference on Education Technology, Management and Humanities Science, Xi’an, China, 21–22 March 2015; pp. 941–945. [Google Scholar]
- Zhang, X.Q.; Yuan, X.G. The System Dynamics Model in Electronic Products Closed-Loop Supply Chain Distribution Network with Three-Way Recovery and the Old-for-New Policy. Discrete Dyn. Nat. Soc. 2016, 3, 1–10. [Google Scholar] [CrossRef]
- Zhang, K. Research on Pricing Decision of Closed-Loop Supply Chain Based on Carbon Tax. Int. J. Econ. Financ. Manag. Sci. 2015, 3, 623–629. [Google Scholar]
- Sasikumar, P.; Haq, A.N. Integration of closed loop distribution supply chain network and 3PRLP selection for the case of battery recycling. Int. J. Prod. Res. 2011, 49, 3363–3385. [Google Scholar] [CrossRef]
- Georgiadis, P. An integrated System Dynamics model for strategic capacity planning in closed-loop recycling networks: A dynamic analysis for the paper industry. Simul. Model. Pract. Theory 2013, 32, 116–137. [Google Scholar] [CrossRef]
- Hong, I.H.; Yeh, J.S. Modeling closed-loop supply chains in the electronics industry: A retailer collection application. Transp. Res. Part E 2012, 48, 817–829. [Google Scholar] [CrossRef]
- Huang, M.; Song, M.; Loo, H.L. Analysis for strategy of closed-loop supply chain with dual recycling channel. Int. J. Prod. Econ. 2013, 144, 510–520. [Google Scholar] [CrossRef]
- Wei, J.; Govindan, K.; Li, Y.J. Pricing and collecting decisions in a closed-loop supply chain with symmetric and asymmetric information. Comput. Oper. Res. 2015, 54, 257–265. [Google Scholar] [CrossRef]
- Cao, J.; Xu, J.; Wang, H.; Zhang, X.; Chen, X.; Zhao, Y.; Yang, X.; Zhou, G.; Schnoor, J.L. Innovating Collection Modes for Waste Electrical and Electronic Equipment in China. Sustainability 2018, 10, 1446. [Google Scholar] [CrossRef]
- Yi, Y.Y. Study on closed-loop supply chain models under different marker power. J. Syst. Manag. 2010, 19, 389–396. [Google Scholar]
- Wang, X.; Gao, P.; Jing, Y. Closed-loop supply chain disruptions management with two retailers’ competition. Comput. Integr. Manuf. Syst. 2014, 20, 430–439. [Google Scholar]
- Huang, Z.S.; Nie, J.J.; Hu, P. Differential game model in closed-loop supply chain with competing retailers. J. Syst. Eng. 2015, 30, 779–789. [Google Scholar]
- Han, X.H.; Xue, S.J. Reverse channel decision for competition closed-loop supply chain based on evolutionary game. Comput. Integr. Manuf. Syst. 2010, 16, 1487–1493. [Google Scholar]
- Wu, H.Y.; Han, X.H. Production decision in manufacturer competing closed-loop supply chains under remanufacturing costs disruptions scenarios. Comput. Integr. Manuf. Syst. 2016, 2016 22, 1129–1138. [Google Scholar]
- Wang, W.B.; Chen, Q.; Da, Q.L. Decision and analysis of closed-loop supply chain with manufacturer-led and manufacturer-compete based on the reward-penalty mechanism. Chin. J. Manag. Sci. 2013, 21, 57–63. [Google Scholar]
- Wang, W.B.; Deng, W.W.; Bai, T. Design the Reward-penalty Mechanism for Reverse Supply Chains Based on Manufacturers’ Competition and Carbon Footprint Constraints. J. Ind. Eng. Eng. Manag. 2016, 30, 188–194. [Google Scholar] [CrossRef]
- Liu, Y.; Zhang, Y. Closed Loop Supply Chain under Power Configurations and Dual Competitions. Sustainability 2018, 10, 1617. [Google Scholar] [CrossRef]
- Forrester, J.W. Industrial dynamics. J. Oper. Res. Soc. 1997, 48, 1037–1041. [Google Scholar] [CrossRef]
- Forrester, J.W. System dynamics-the next fifty years. Syst. Dyn. Rev. 2007, 23, 359–370. [Google Scholar] [CrossRef]
- Haier Group. Haier 2011 Environmental Report. Available online: http: //www.haier.net/cn/social responsibility/environmental protection/book (accessed on 5 June 2012).
- Zou, X.L.; Zhao, M.Y. Renewable resources: Gree electric appliance “losing business”. China Econ. Wkly 2014, 17, 66–68. [Google Scholar]
- The Report of China’s Home Appliance Industry Market Development Status and investment Prospects Forecast from 2017 to 2022. Available online: http://www.chinabgao.com/report/3507227.html (accessed on 16 December 2017).
Figure 1.
Recycling competition structure model.

Figure 2.
Recycling competition flow diagram.

Figure 3.
The third-party recycling mechanism flow diagram.

Figure 4.
Contract structure flow diagram.

Figure 5.
Casual loop diagram of competition.

Figure 6.
Total Revenue Contrast 1.

Figure 7.
Total Revenue Contrast 2.

Figure 8.
Total Revenue Contrast 3.

Figure 9.
Market Share Contrast 1.

Figure 10.
Market Share Contrast 2.


Table 1.
The variables and parameters used.
| Variable Meaning | Variable Name |
|---|---|
| Collection Points Coverage Rate | Cr |
| Discarded Rate | Dr |
| Environmental Protection Consciousness of Consumers | Ce |
| E-waste | E |
| E-waste Recycling Coefficient | Ec |
| E-waste Recycling Rate | Er |
| Processed Inventory | Ip |
| Processing Rate | Pr |
| Reused Rate | Rr |
| The Third-Party Recycling Inventory | It |
© 2018 by the authors. Licensee MDPI, Basel, Switzerland. This article is an open access article distributed under the terms and conditions of the Creative Commons Attribution (CC BY) license (http://creativecommons.org/licenses/by/4.0/).
Share and Cite
MDPI and ACS Style
Xue, R.; Zhang, F.; Tian, F.; Oloruntoba, R.; Miao, S. Dual Chains Competition under Two Recycling Modes Based on System Dynamics Method. Sustainability 2018, 10, 2382. https://0-doi-org.brum.beds.ac.uk/10.3390/su10072382
AMA Style
Xue R, Zhang F, Tian F, Oloruntoba R, Miao S. Dual Chains Competition under Two Recycling Modes Based on System Dynamics Method. Sustainability. 2018; 10(7):2382. https://0-doi-org.brum.beds.ac.uk/10.3390/su10072382
Chicago/Turabian StyleXue, Renzheng, Fengbin Zhang, Feng Tian, Richard Oloruntoba, and Shidi Miao. 2018. "Dual Chains Competition under Two Recycling Modes Based on System Dynamics Method" Sustainability 10, no. 7: 2382. https://0-doi-org.brum.beds.ac.uk/10.3390/su10072382
Note that from the first issue of 2016, this journal uses article numbers instead of page numbers. See further details here.