Measuring Social Vulnerability to Flood Disasters in China

1
School of Political Science and Public Administration, Southwest University, Chongqing 400715, China
2
Department of Economics and Related Studies, University of York, York YO10 5NG, UK
3
International Business School, Guangdong University of Finance and Economics, Foshan 528100, China
4
Dpartment of Mathematics, The Army Engineering University of PLA, Nanjing 211101, China
*
Author to whom correspondence should be addressed.
Sustainability 2018, 10(8), 2676; https://0-doi-org.brum.beds.ac.uk/10.3390/su10082676
Submission received: 7 June 2018
/
Revised: 13 July 2018
/
Accepted: 18 July 2018
/
Published: 30 July 2018
(This article belongs to the Special Issue Conflict Analysis and Sustainable Management of Water Resources)
Abstract
:To proactively prevent losses from flood disasters and subsequent potential human conflicts, it is critical to measure the social vulnerability of a country or a region to flood. In this article, we first propose a list of potential indicators for measuring this social vulnerability. These indicators’ significances are then tested based on their correlation coefficients with a vulnerability index obtained using nonparametric Data Envelopment Analysis. In the final measurement system, there are nine indicators: the proportion of the primary industry, infrastructure development level, income gap between urban and rural residents, the proportion of population over 60 years old, the proportion of children under 14 years old, the number of people receiving minimum income assistance, and the number of disasters per year. We then conduct principal component analysis to evaluate the social vulnerability level. Our results show that the social vulnerability level is mostly impacted by the economic principal component and the demographic and social security principal component. Moreover, our results also confirm that the social vulnerability level to flood in China declined overall from 2003 to 2015.
1. Introduction
Periodic flood disasters have caused enormous losses in China. For example, the number of deaths caused by floods since 1950 in China totals around 280,000. The average annual economic loss is about 139 billion RMB since 1990 [1]. In addition, flood disasters may be a major non-traditional national security risk to sustainable economic and social development. Because traditional risk warning and management tools are more focused on natural aspects without sufficient focus on human and social aspects, integrated flood risk management has been developed recently. Integrated flood risk management emphasizes that flood disasters have important social dimensions and human society is “vulnerable” [2].
Social vulnerability means the inherent instability and sensitivity of social systems to issues such as poverty, inequality, marginalization, social deprivation and social exclusion [3]. Cutter and Finch [3] defined social vulnerability as “a measure of both the sensitivity of a population to natural hazards and its ability to respond to and recover from the impacts of hazards”. Catastrophic events have shown that countries or regions can face significantly different consequences while facing similar catastrophes, and a major reason is the different social vulnerability levels [4]. Assessing social vulnerability to flood is important because it can reveal the major contributing factors in flood disaster recovery [5]. It then can help establish appropriate defensive mechanisms and enhance the ability of flood disaster recovery. In China, a developing country with ineffective social institutions and profound changes in the demographic structure, assessing social vulnerability to floods is even more complicated but important. Some scholars studied social vulnerability measurement systems for floods, such as You and Zhang [6], Li et al. [7] and Feng et al. [8], but most of them from the perspectives of economics and demographics. However, as Gallopin [9] pointed out, special attention needs to be paid to more factors, such as disaster culture, because we can use past experience to develop disaster response strategies to reduce catastrophe risk. Furthermore, it is necessary to pay attention to the role of science and technology [10].
In this research, we make a major contribution by establishing a quantification method for the social vulnerability to flood disasters in China where we incorporate more comprehensive perspectives such as the technological perspective. Note that our empirical data are from China at the national level so our analysis and results are applicable to the national level, but not necessarily applicable to provincial level or other regional levels. Moreover, the common method adopted in the literature was the traditional factor analysis, which may not be effectively incorporate the actual performance of a region when a flood occurs. In our study, we make another major contribution by testing the validity of each indicator for social vulnerability measurement by calculating its correlation coefficient with a vulnerability index obtained using Data Envelopment Analysis (DEA). We then conduct principal component analysis and confirm that social vulnerability to flood is impacted the most by economic, demographic, and social security factors. Finally, we obtain the social vulnerability level to flood disasters in China from 2003 to 2015. This is our third contribution as little research has been done specifically on the social vulnerability to flood disasters using the combined methodologies of DEA, correlation coefficient analysis, and principal component analysis.
The remainder of this paper is arranged as follows. Section 2 presents a brief literature review. Section 3 introduces our methodology for measuring social vulnerability to flood disasters. Section 4 presents the empirical analysis and results. Finally, Section 5 provides conclusions and potential future research direction.
2. Literature Review
In the past few decades, numerous definitions of vulnerability have been proposed in different academic research fields and government policy documents [11]. In fact, Timmermann [12] argued that the concept of “vulnerability” has been defined differently in the literature. Newell et al. [13] emphasized that a conceptual framework for vulnerability is vitally needed. A major reason is that, in different fields, vulnerability is often given a different connotation. Moreover, even within the same research area, vulnerability may be understood differently. In disaster research, its most representative definition is from the International Strategy for Disaster Reduction (ISDR), which considers vulnerability as the degree of exposure, sensitivity and resilience of communities that are jointly identified by nature, society, economy, environment, etc. [14]. In addition, vulnerability research particularly should focus on its predictability and dynamics [15]. As there has been extensive research on vulnerability in general, we limit our review to social vulnerability.
Due to the comprehensive, systematic and multidimensional nature of the concept of social vulnerability, many scholars have worked to systematically hierarchize it. For instance, Moss et al. [16] defined social vulnerability from three dimensions: physical environment, socio-economic conditions and external assistance. Cutter et al. [4] divided studies on social vulnerability into three categories. The first category refers to vulnerability as a form of exposure, which is a natural condition when a person or region is in danger. The second category considers vulnerability as a social factor, measuring its resilience to disasters. The third category combines the potential exposure and resilience with specific areas. Adger [17] pointed out that social vulnerability had two basic connotations. The first one emphasizes the extent of harm from disasters from the traditional approach of disaster and impact assessment. That is, this approach measures the vulnerability of chemical and physical systems without considering humans’ response ability. The second one emphasizes that vulnerability is the state existing before the disaster. It is mainly concerned with the structural factors of human society or communities affected by disasters. Now, the role of social vulnerability in disaster prevention and preparation, emergency and rescue in disasters, recovery and reconstruction after a disaster has also drawn great attention. Increasingly, international organizations are concerned about the impact of the human social system on the social vulnerability, such as Intergovernmental Panel on Climate Change (https://www.ipcc.ch), US Global Change Research Information Office (http://www.gcrio.org), the United Nations University Institute for Environment and Human Security (https://ehs.unu.edu). As indicated before, the research focus of social vulnerability to catastrophes has shifted from cataclysmic characteristics, structural attributes and the resulting biophysical losses to social vulnerability which is characterized by the sensitivity of social systems and resilience.
Although different scholars have different definitions of social vulnerability from different perspectives, social vulnerability essentially relates to a social system that is exposed to natural or human factors. Due to its own potential sensitivity and inability to deal with unfavorable disturbances, the system can be adversely affected or damaged [18]. With the ever-changing dimensions and perspectives of social vulnerability, it is becoming more and more critical to assess or measure social vulnerability [4]. Moreover, the assessment of social vulnerability has also gradually moved away from the one-dimensional analysis typically found in earlier literature. Multi-dimensional measurement systems have gradually become mainstream for social vulnerability assessment as they can more comprehensively reflect the impact of disaster risk.
Many scholars and research institutions have designed more targeted social vulnerability measurement systems. Cutter et al. [4] proposed vulnerability assessment from the perspectives of socioeconomic and demographic. Khazai et al. [19] measured the social vulnerability of a country or region from six aspects: dependence on structure, social segmentation, financial deprivation, production potential, service availability and economic health. The Agency for Toxic Substances and Disease Registry, as well as the University of South Carolina, also designed a set of vulnerability assessment indicators from the demographic perspective. When it comes to social vulnerability to flood, Kablan et al. [5] evaluates the social vulnerability to floods using the Method for the Improvement of Vulnerability Assessment in Europe (MOVE) framework. The MOVE framework helped assess the major factors involved in the social vulnerability to floods. Balica et al. [20] focused on developing a Coastal City Flood Vulnerability Index (CCFVI) based on exposure, susceptibility and resilience to coastal flooding. With the aid of this index, it was demonstrated which cities are most vulnerable to coastal flooding. Koks et al. [21] found that a substantial proportion of the population could be defined as social vulnerable. In addition, the affected population could be very heterogeneous, which was often ignored in traditional flood risk management studies. Fekete [22] constructed social vulnerability indices employing factor analysis. Through a meta-analysis of 67 flood disaster case studies from 1997 to 2003, Rufat et al. [23] identified the leading drivers of social vulnerability to floods.
In China, scholars have also studied social vulnerability to disasters from different perspectives. For example, Yi et al. [24] applied the Hoovering assessment model to discuss the social vulnerability to floods based on the dimensions of population and economy. Zhang and Jia [25] analyzed the factors affecting social vulnerability to urban earthquake disaster in China, and a measurement system of social vulnerability including economic and population indicators was constructed. Chen et al. [26] combined Projection Pursuit Clustering Model with Real-Coded Accelerated Genetic Algorithm to assess the social vulnerability to natural disasters in Shanghai. Wen [27] evaluated the social vulnerability to natural disasters in Shanxi Province. Using population and socio-economic data of Shanghai, Zhang and You [28] constructed the social vulnerability indicators of disasters, and they used the Technique for Order Preference by Similarity to an Ideal Solution (TOPSIS) method to evaluate the social vulnerability in the 18 districts in Shanghai. Zhou et al. [29] used factor analysis to identify the dominant factors that influenced the provincial social vulnerability in China to natural hazards based on the socioeconomic and built environmental variables in 2000 and 2010. Since flood disaster is the most severe type of disaster in China, many researchers in China have carried out research on the social vulnerability to flood disasters. You and Zhang [6] constructed a social vulnerability measurement system for floods which was based on the disaster location model and emergency management cycle theory. Li et al. [7] investigated the socio-economic factors of Jingzhou City from 2001 to 2012 to establish an index system of social vulnerability to flood disaster from the perspectives of social sensitivity and social coping ability, and assessed the social vulnerability to floods based on entropy method. It was found that the social vulnerability of Jingzhou to floods improved in a fluctuating manner. Feng et al. [8] established an index system for evaluating the social vulnerability of floods. Five key factors were identified through factor analysis: comprehensive economics, agricultural and population, escape, social security and housing factor.
In summary, most existing studies evaluated the social vulnerability to flood disasters based on only the economic and demographic characteristics. In this paper, we follow some scholars’ suggestions and incorporate factors such as disaster culture and science and technology [9,10]. Moreover, most existing studies employ the traditional factor analysis to assess social vulnerability. This research differs by simultaneously employing the methodologies of DEA, correlation coefficient analysis, and principal component analysis.
3. Method of Measuring Social Vulnerability to Flood Disasters
3.1. Design of the Measurement System
The challenge for social vulnerability research, similar to other social research, has been how to quantify the related factors [4]. Existing studies show that two primary methods were used in selecting indices to measure social vulnerability: a deductive approach based on a theoretical understanding of relationships and an inductive approach based on statistical relationships. Following Cutter et al. [4], we chose the inductive approach because it can better incorporate all possible variables. Our measurement system consists of five types of potential indicators: economic indicators, demographic indicators, social security indicators, disaster culture indicators, and science and technology indicators. For an overview of the potential indicators in our measurement system, please refer to Appendix A.
(1) Economic indicators
The variables most frequently associated with social vulnerability are economic variables. Pre-disaster prevention and preparedness for floods, rescue in disasters, post-disaster recovery and reconstruction all require the “embedded governance” of the economic system [30]. In addition, the level of economic development, economic structure, financial resources, financial insurance, income inequality and infrastructure construction all have significant impacts on a social system’s resilience to flood [19]. Ample economic resources and their effective use can contribute to sufficient pre-disaster material reserves, building a defensive mechanism to withstand adverse external shocks, and achieving a better risk-resistance capability and disaster recovery capability. Hence, in this study, consistent with Cutter et al. [31], Puente [32], and Platt [33], we chose economic variables such as GDP per capita, infrastructure development level, income gap between urban and rural residents, per capita fiscal revenue, and per capita insurance. In addition, our paper incorporates the proportion of primary industry in the economy in our measurement system. This is because the primary industry in China is still relatively underdeveloped and more susceptible to flood. It can be argued that, if a region has a higher proportion of the primary industry in the economy, it is more socially vulnerable to flood.
(2) Demographic indicators
People have different physiological and living conditions, so their response and recover abilities to flood disasters will also be different [3]. People with lower vulnerability, even when exposed to higher risk of disasters, can better sustain disaster losses and recover faster from disasters. In comparison, people with higher social vulnerability may not be able to withstand even relatively minor disaster damage. When flood disasters strike, there are vulnerable groups including women, children, the poor, and the elderly [4,34]. Hence, in this paper, our measurement system of the social vulnerability to floods contains demographic structure variables. Those variables are the proportion of females, the proportion of population over the age of 60, the proportion of children under 14, demographic density, the number of workers in the mining industry, the number of workers in the primary industry, unemployment rate, the population of ethnic minority, the number of people receiving minimum income assistance, the number of healthcare workers, the number of criminal cases filed, the number of social workers, and illiteracy rate. In China, the divorced may be relatively more difficult to get help from family, hence may be more difficult to withstand flood. Therefore, we considered divorce rate as one possible indicator. People with higher education may possess more knowledge about floods, so our possible demographic indicators included the number of people with tertiary level education or above, and the number of college students. Moreover, we added the number of healthcare workers and the number of social workers into measure system, because they are important to disaster recovery.
(3) Social security indicators
To measure the social vulnerability to floods, we considered social security variables which can influence potential economic losses, injuries, and fatalities due to flood disasters [4]. Those variables include the number of beds in healthcare institutions, the proportion of rural housing built with bricks and woods instead of steel and concrete, and the proportion of the population covered by radios and televisions. Naturally, if a region is strong in terms of these variables, it can help minimize the damage before, during, and after a flood disaster. For example, health institutions can provide critical health services needed during and after flood disasters. In addition, rural houses are often not structurally well built, and these houses may be easier to be damaged [35]. Finally, radios and televisions can provide timely information so people can respond to floods more effectively.
(4) Disaster culture indicator
Gallopin [9] pointed out that special attention needs to be paid to the role of disaster culture. We can use past experience to develop disaster response strategies to reduce the potential negative impacts and improve the resilience of the social system. Hence, we included the number of previous disasters into our measurement system.
(5) Science and technology indicators
According to Liu et al. [10], the development of modern science and technology has enabled us to prevent and deal with catastrophes. We can use technologies in risk assessment, early warning, disaster monitoring, and disaster recovery. Hence, in our measurement system, we included the proportion of R&D funds as a percent of GDP, the number of patent granted, topographic maps, and the number of meteorological stations.
3.2. Evaluation
(1) Selecting indicators
We used a nonparametric Data Envelopment Analysis (DEA) method to derive an actual vulnerability index. DEA is a linear programming methodology with an objective function expressed as the ratio of output to input which is called efficiency. DEA generalizes an efficiency measure based on single input and single output to an efficiency measure based on multiple inputs and multiple outputs. By comparing the efficiency of a particular unit with a group of similar units, we can calculate relative efficiency of that unit. In this process, some units that achieve 100% efficiency are known as relatively efficient units, while other units that have an efficiency score less than 100% are referred to as inefficient units. Since the DEA method was developed, various DEA models have been proposed. A more detailed introduction of DEA can be found in a classic handbook [36]. In this study, we used the classical C2R model to evaluate vulnerability index. We used flood disaster’s affected population and area as input and flood disaster’s consequences in terms of loss of lives and economics loss as output.
If a region encounters a flood disaster, there will be a certain affected population () and affected area (). During the flood disaster, there may be the death () or loss of human lives and economic loss (). The process can be described as . represents the vulnerability to floods in a region, and is the output set. The input set for the ith year is . Consider the problem of evaluating the relative efficiency for any particular year, which will be identified as Year 0. The relative efficiency for Year 0 is calculated by forming the ratio of a weighted sum of outputs to a weighted sum of inputs, subject to the constraint that no year can have a relative efficiency score greater than unity. Mathematically, we have:
where , , , and are weights assigned to output (D, E) and input (P, S), respectively. Based on this, we construct linear programming models to assess the vulnerability index. The DEA model based on the invariable input-oriented scale returns is:
where represents a dual variable in a linear programming model, and the index is the vulnerability index when a flood breaks out in the ith year, where . means the vulnerability index in that year is the highest and is located on the frontier. The opposite is true for the index value of 0. The larger , the greater the vulnerability index in that year is. is the floods impact rating in the ith year. In this study, they are two factors: the affected population () and the affected area (). gives the output set for the number of deaths () and economic loss () for the corresponding year. The non-parametric DEA method is used to measure the vulnerability index at the time of flood. After that, we use Pearson’s correlation coefficient to investigate the relationship between each indicator in Table A1 and the vulnerability index. We keep only those indicators with significant correlation coefficients in our refined measurement system.
(2) Assessment of social vulnerability level
We assess the social vulnerability level based on the refined measurement system of social vulnerability to flood disasters. Our measurement system involves a number of indicators. Thus, appropriate weights need to be determined for those indicators. Existing methods for determining the weights are mainly divided into subjective evaluation and objective evaluation methods. The former determines the weight of each indicator using tools such as analytic hierarchy process and ranking method. These tools are often subjective and lack uniform standards, which can easily lead to some discrepancies in the evaluation results [37]. The latter determines the weight of each indicator using more objective tools such as principal component analysis, factor analysis, and entropy analysis. Overall, a growing number of researchers tend to choose the objective evaluation method, and the principal component analysis is a commonly used tool [38].
The main idea of the principal component analysis is to reduce the dimension of the data and convert multiple basic indicators into several comprehensive indicators under the premise of minimizing information loss. As the indicators used for statistical analysis reflect various “information”, this will result in cross-variable information between variables and the phenomenon of overlap, which would affect the trustworthiness of the results. In comparison, the law of principal component analysis satisfies the need of giving larger amount of information to fewer variables. It can handle potential major contradictions during development, reveal the inherent laws governing the changes, and improve the efficiency and credibility of the results.
Assume there are samples, each sample with indicators. Those are , , ,…, , which can be written in the following matrix:
where:
We conduct a linear transformation to matrix . That is, we use the indicators , , ,…, to make a liner transformation to obtain an integrative vector.
Next, we determine the number of the main components. For determining the number of the main components, econometricians put forward a variety of criteria, including the Kaiser and Cattell’s “Gravel Guidelines”. This article adopts the “Gravel Guidelines” to select the principal component with eigen value greater than 1. Finally, we use the principal components , , , …, to calculate the weighted sum to obtain the social vulnerability level, using variance contribution rate as the weight.
4. Empirical results and Analysis
4.1. Measuring the Vulnerability Index
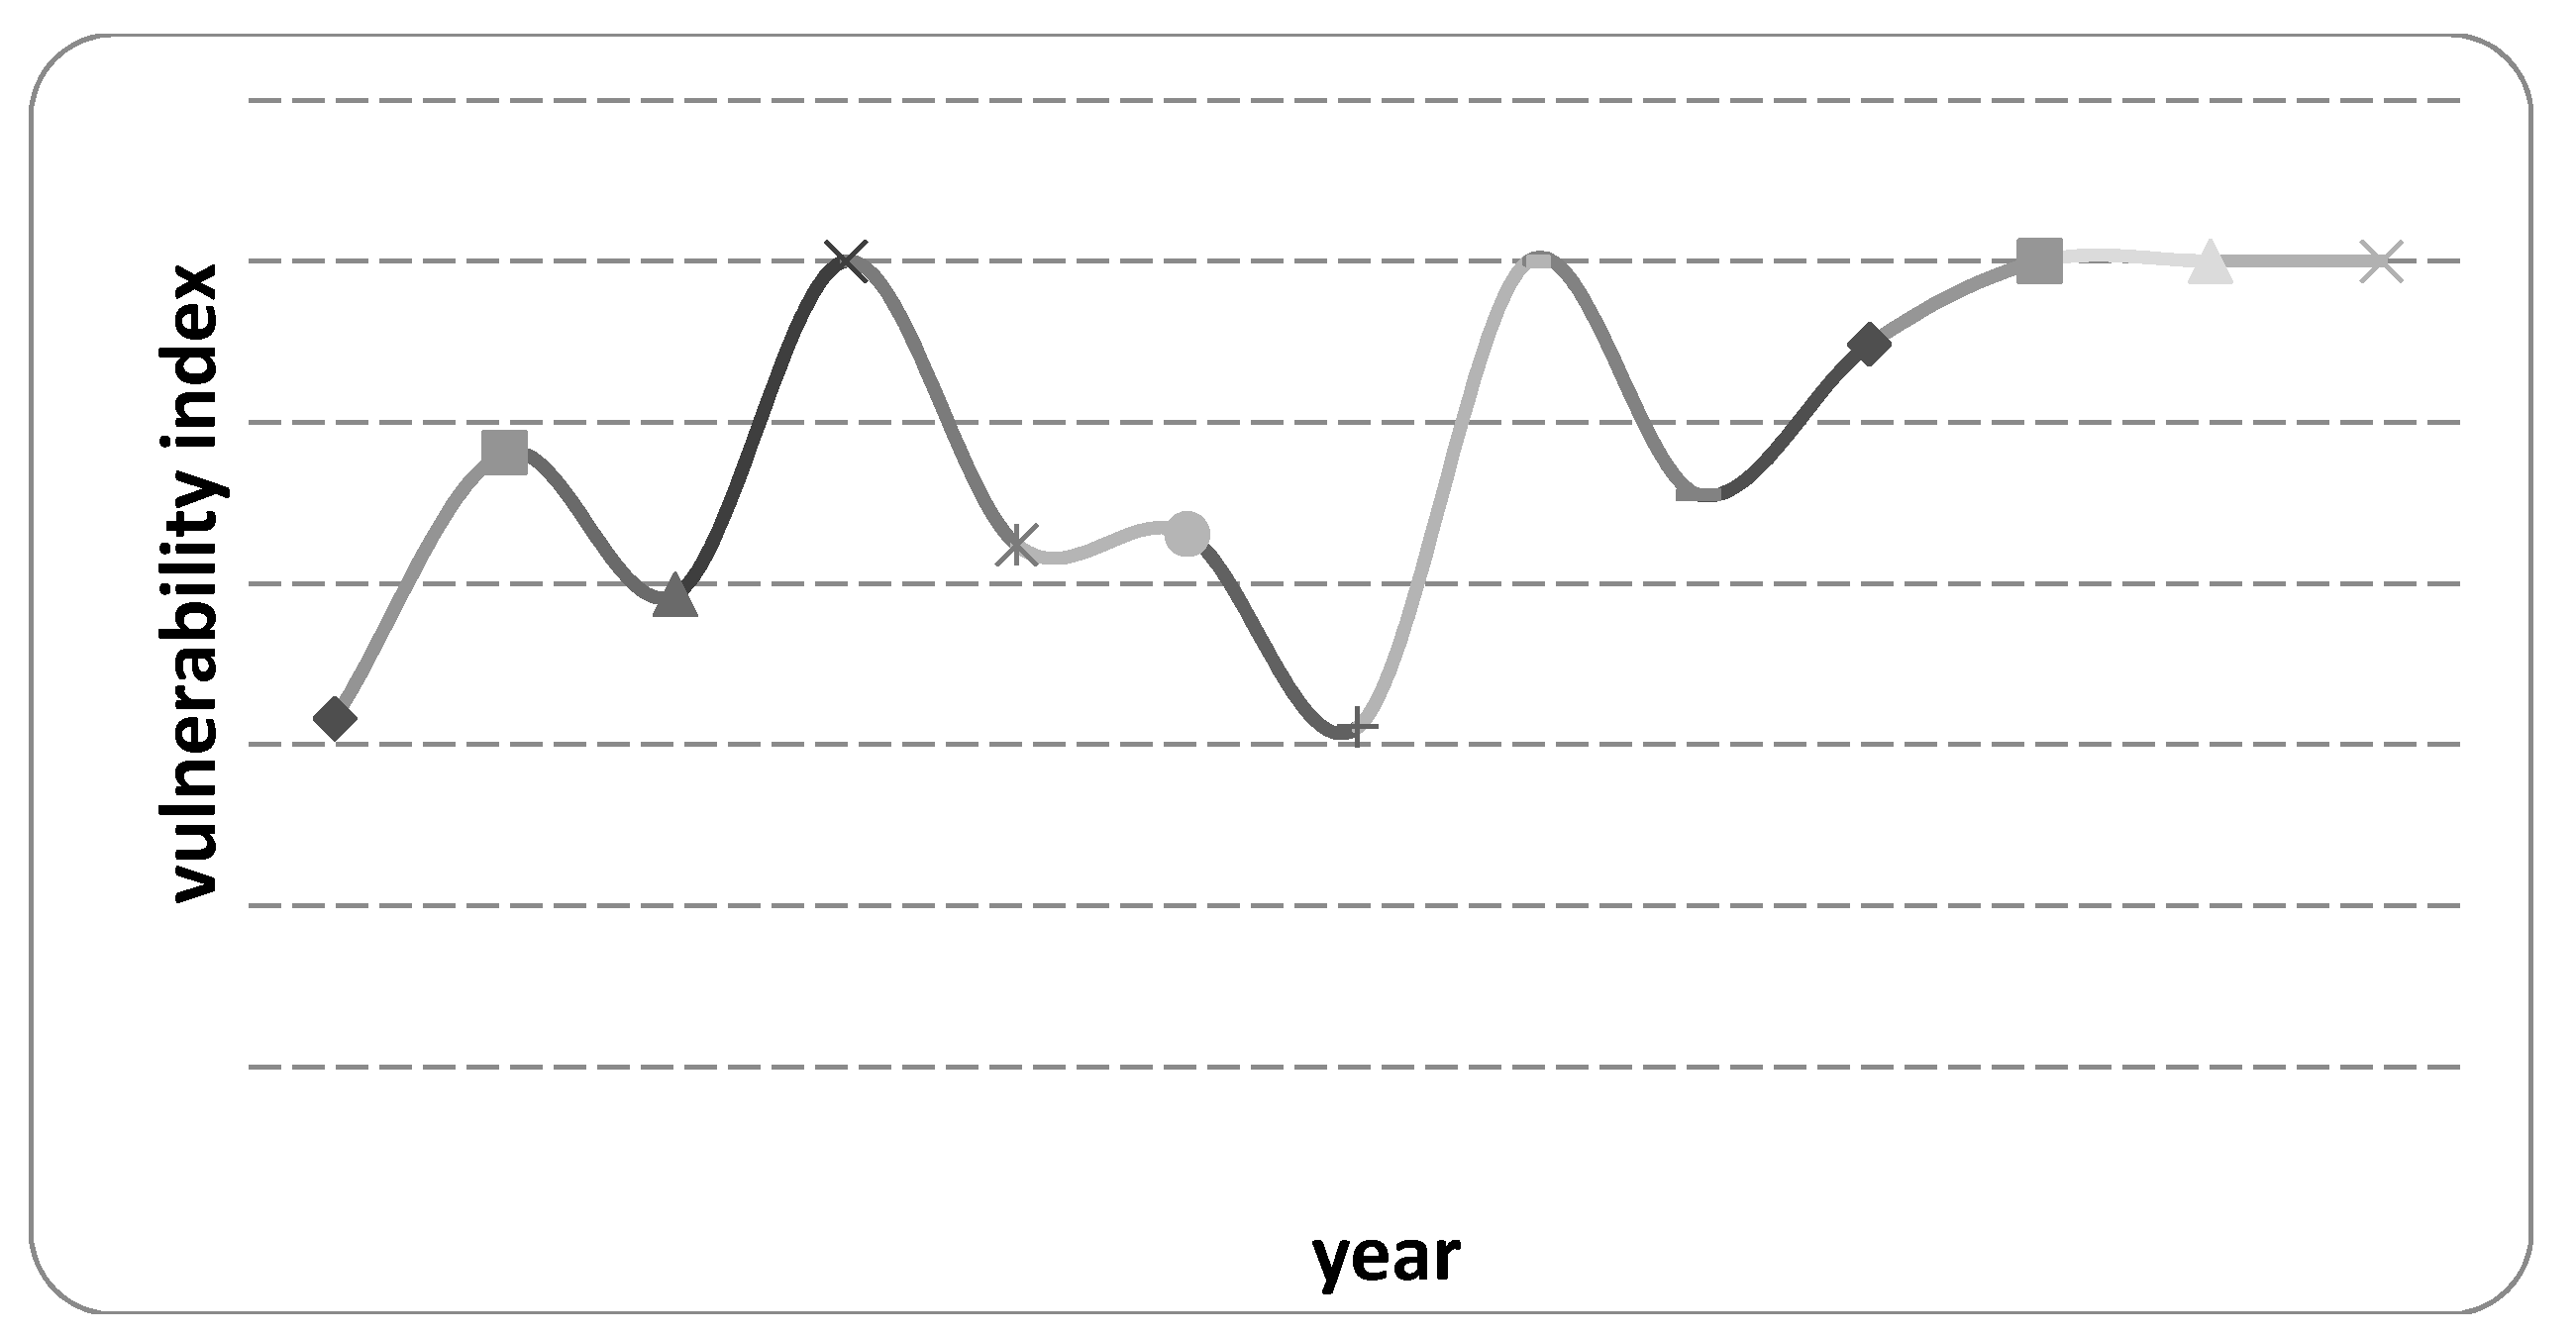
We obtained China’s vulnerability indices to floods from 2003 to 2015 based on the nonparametric DEA method (see Appendix B for details). The results are summarized in Figure 1. Figure 1 shows that the vulnerability index to flood in China fluctuates between 2003 and 2015. Out of these 13 years, the vulnerability index is 1 or at the frontier for five years (2006, 2010, 2013, 2014, and 2015). In our analysis, this means the ratio between the weighted sum of human loss and economic loss and the weighted sum of affected population and affected area is the highest.
4.2. Pearson’s Correlation Coefficient Analysis
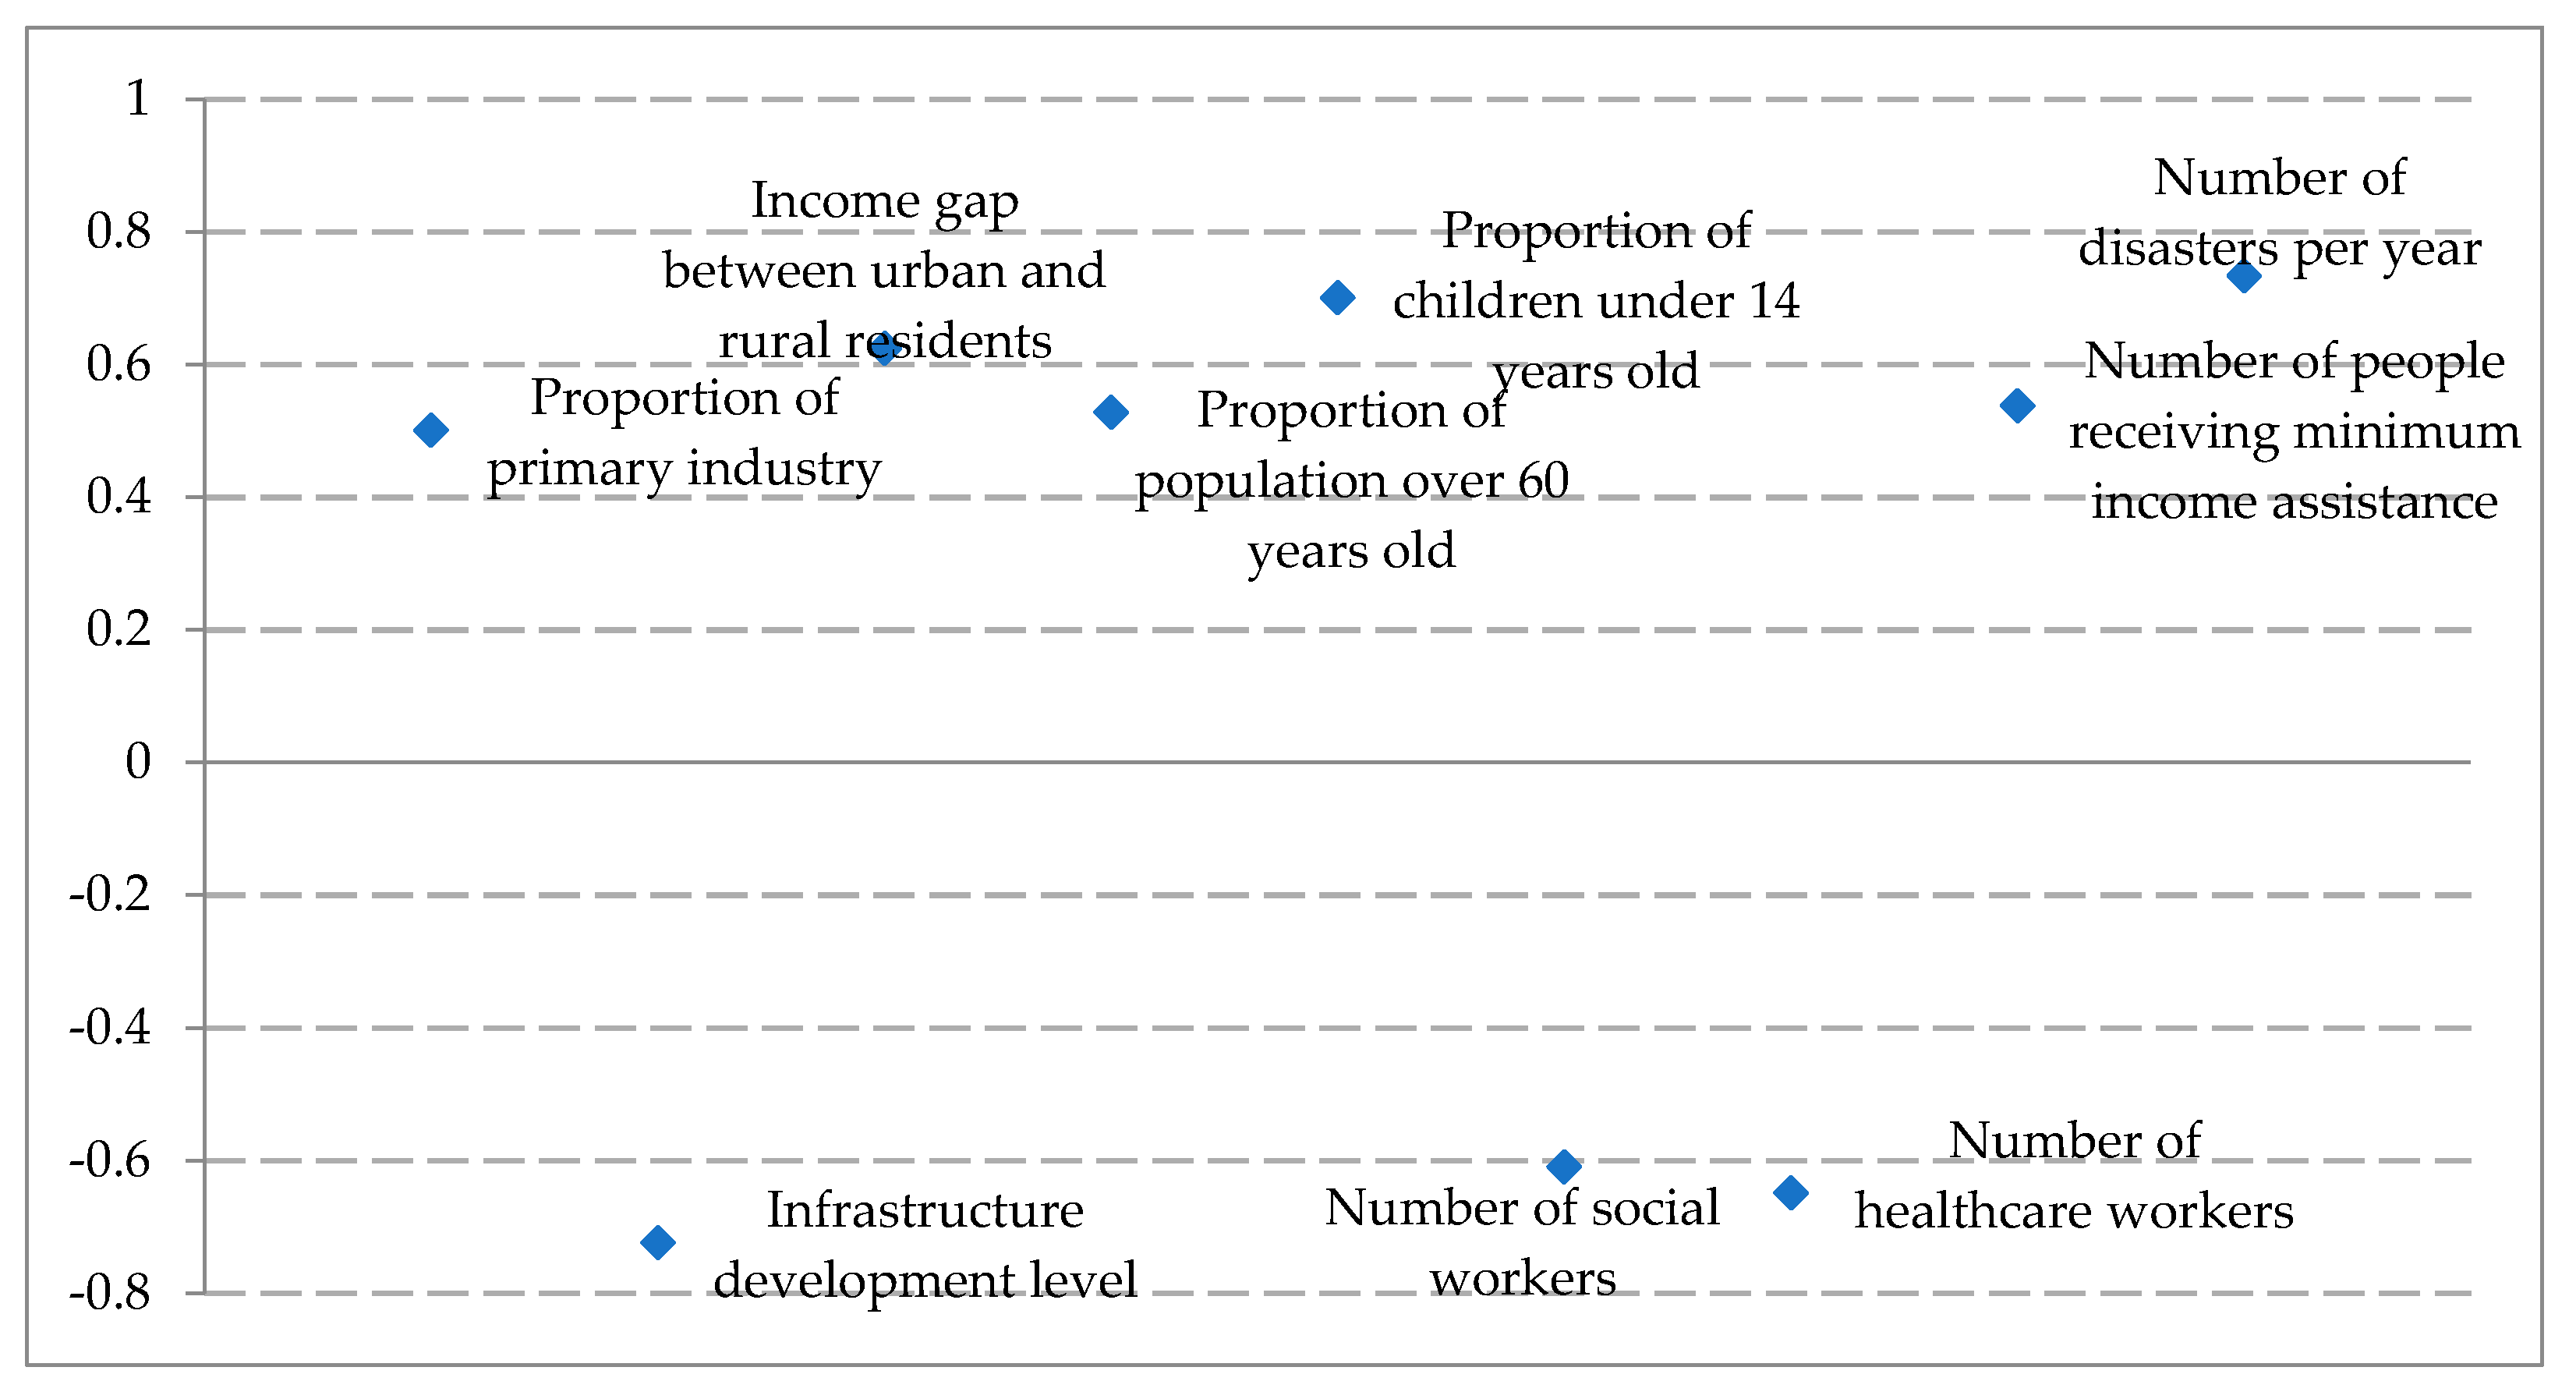
The vulnerability index to flood disasters reflects the actual performance of a social system that deals with flood. Naturally, if an indicator’s correlation coefficient with the vulnerability index is significant, it is suitable to be included in the measurement system. Using Pearson’s correlation coefficient method, we obtained the correlation coefficients. Our results show that a few indicators’ correlation coefficients with the vulnerability index were insignificant, so we dropped these indicators. On the other hand, nine indicators’ correlation coefficients were significant at the 10% level, including the proportion of the primary industry, infrastructure development level, income gap between urban and rural residents, the proportion of population over 60 years old, the proportion of children under 14 years old, the number of people receiving minimum income assistance, and the number of disasters per year. Figure 2 summarizes those indicators. The correlation coefficients of six indicators (the proportion of the primary industry, income gap between urban and rural residents, the proportion of population over 60 years old, the proportion of children under 14-year old, the number of people receiving minimum income assistance, and the number of disasters per year) are positive. This means those indicators positively influence the vulnerability index. The three remaining indicators (infrastructure development level, the number of social workers, and the number of healthcare workers) have negative correlation coefficients with the vulnerability index. This means these indicators negatively affect the vulnerability index.
4.3. Principal Component Analysis
Since there is information overlap among nine indicators in our final measurement system, and it is difficult to assign their appropriate weights, we used principal component analysis to convert these indicators into several more comprehensive indicators. We then determined the weight of each principal component according to the variance contribution rate. Specifically, first, we normalized all of variables based on annual data from 2003 to 2015 in Figure 2 and converted them into variables with a mean of 0 and a variance of 1. Then, we conducted the principal component analysis and extract the principal components with eigenvalues greater than 1. Our results are reported in Table 1. In Table 1, there are two principal components with eigenvalues higher than 1, which we called F1 and F2. The cumulative variance of F1 and F2 accounted for 85.31% of the sum of the variances, so they include most of the information.
The load matrix was established for the two principal components extracted, and the principal component load matrix after rotation was obtained by orthogonal rotation with maximized variance. Then, the principal component score coefficient matrix was obtained, as shown in Table 2.
According to Table 2, the first principal component scores high on the proportion of primary industry, infrastructure development level, income gap between urban and rural residents, and the number of disasters per year, so we called it the economic principal component. The second principal component scores high on the proportion of population over 60 years old, the proportion of children under 14 years old, the number of social workers, the number of healthcare workers, and the number of people receiving minimum income assistance. Thus, we called it the demographic and social security principal component. Then, we calculated the values of these two principal components based on the coefficient score matrix. Finally, we used these two principal components to calculate the weighted sum using variance contribution rates as the weights. In this way, we obtained the social vulnerability level to flood disasters in China from 2003 to 2015.
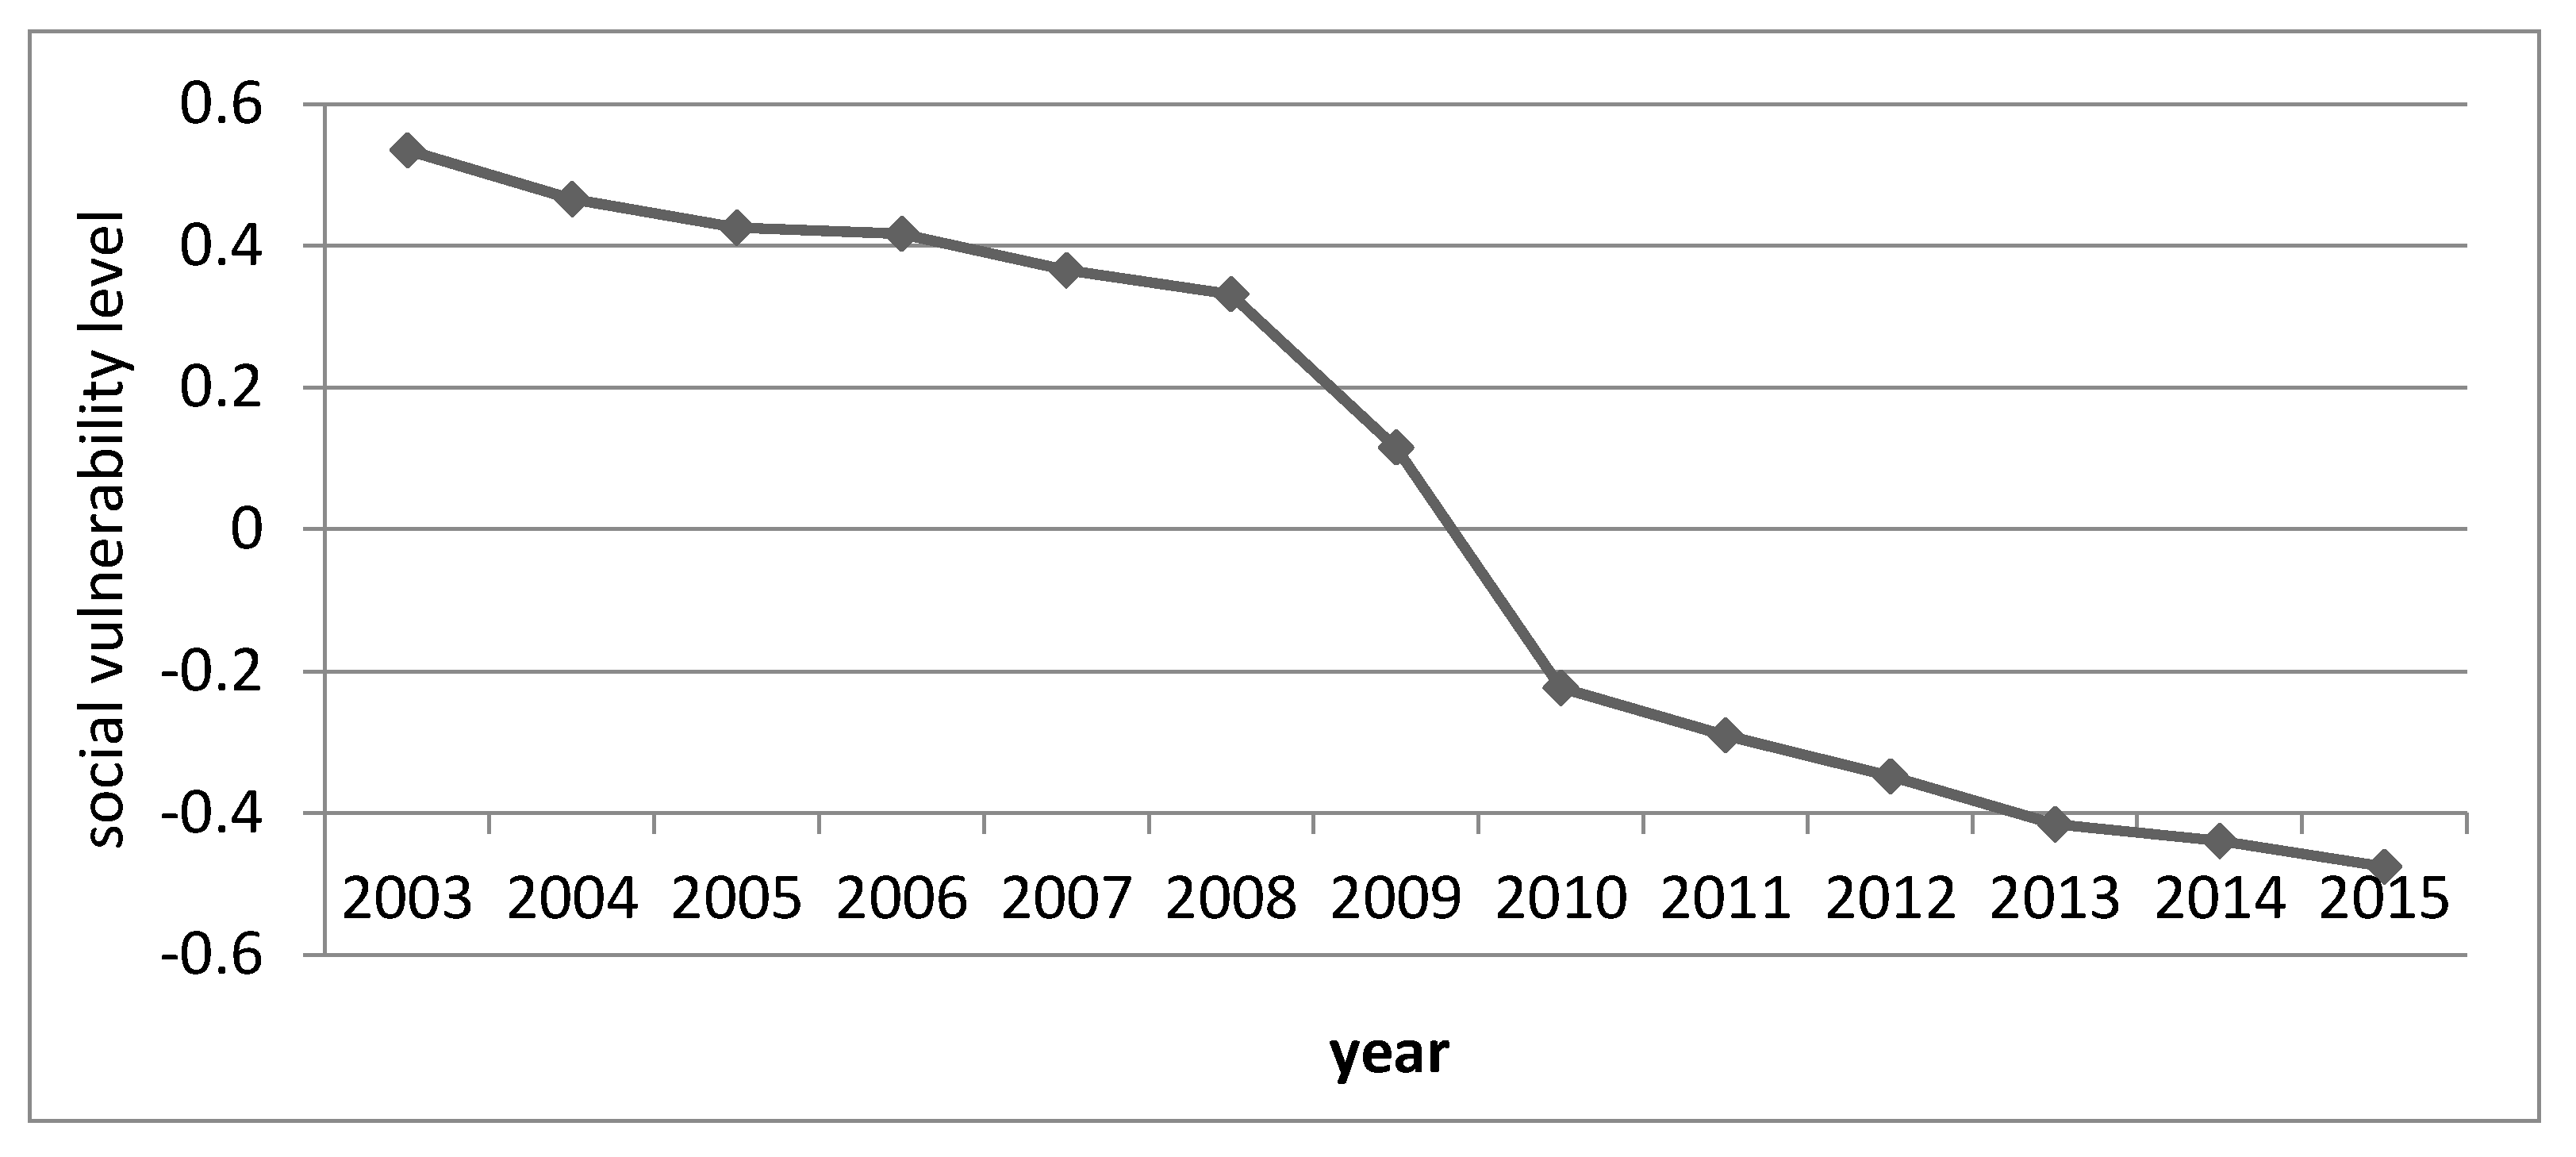
Figure 3 illustrates the social vulnerability level to floods in China from 2003 to 2015, which shows a downward trend. Obviously, a higher value indicates higher social vulnerability. According to this method, the social vulnerability level might be positive or negative. If the social vulnerability level is negative (positive) for a specific year, it means the social vulnerability level of that year is lower (higher) than the average. Specifically, from 2003 to 2015, the social vulnerability level declined significantly from 0.54 to −0.48. This decline was driven by the economic, demographic and social security factors as they are included in the two principal components. Furthermore, according to Figure 3, the social vulnerability level decreased more noticeably between 2008 and 2010. The reasons are as follow. In 2009, the Chinese central government began to implement the four trillion investment plan after the 2008 Financial Crisis, and massive amount of money was invested in infrastructure, social welfare and healthcare. This significantly increased the numbers of social workers and healthcare workers. Furthermore, the decline of the social vulnerability level is also caused by the income gap reduction between urban and rural residents. Specifically, China’s income gap between urban and rural residents narrowed quickly from 3.33 in 2009 to 3.23 in 2010 [39].
5. Conclusions and Future Research
To proactively minimize losses from flood disasters and subsequent potential human conflicts, it is critical to measure the social vulnerability to flood disasters. In this paper, we propose a measurement system for this social vulnerability. To this end, we first chose appropriate indicators in the system by testing the correlation coefficient between each indicator and a vulnerability index obtained using a nonparametric method based on DEA. In our first key finding, we established a measurement system with nine indicators: the proportion of primary industry, infrastructure development level, income gap between urban and rural residents, the proportion of population over 60 years old, the proportion of children under 14 years old, the number of social workers, the number of healthcare workers, the number of people receiving minimum income assistance, and the number of disasters per year. Furthermore, using principal component analysis, we obtained our second key finding that the social vulnerability to flood disasters is affected mostly by the economic principal component and the demographic and social security principal component. Finally, we obtained the social vulnerability level to flood disasters based on the principal components’ weighted sum. In our third key finding, we confirmed that the social vulnerability level to flood disasters in China declined from 2003 to 2015.
The measurement system of the social vulnerability to flood disasters we proposed and the analysis in this paper can be useful to support flood risk reduction in China. First, for a region to reduce social vulnerability from floods, an important factor is the economic development, including the infrastructure development. For example, this indicates the importance of developing the transportation capacities of railways, waterways, and roads. Second, our study shows the social vulnerability to flood disasters is significantly impacted by the number of social workers and the number of healthcare workers. Therefore, it is very beneficial to keep investing in social welfare and healthcare. Third, our research shows the proportion of primary industry and income gap between urban and rural residents affect the social vulnerability to floods significantly. This is because the primary industry in China is still relatively underdeveloped and people, mostly rural residents, working in the primary industry are more susceptible to flood disasters. Therefore, to reduce social vulnerability to flood disasters, it is essential to devise policy to help rural residents transform from traditional agriculture to modern agriculture which can better handle floods. Moreover, rural residents’ income level can be enhanced to reduce the income gap.
Admittedly, the factors that affect the social vulnerability to flood disasters in a country or a region may be numerous and complicated. It is quite possible that this study may not provide a sufficiently comprehensive framework. For example, social capital is an important factor affecting social vulnerability [40]. Households or individuals with higher social capital have more resources to deal with flood disasters. Hence, it is a good research direction to incorporate social capital in future measurement framework of the social vulnerability. It is also a good direction to study how regularization of the hydrographic network and human migration and re-settlement within China affect the social vulnerability to flood. Furthermore, in this paper, due to data availability, we focus on national level measurement. It will be interesting to employ our proposed method to measure and compare the different levels of social vulnerability to flood disasters at the provincial, regional, or city level. This can be done both inside and outside of China. In short, it is a worthwhile research direction to use more detailed and diverse data to obtain more specific research findings and policy implications.
Author Contributions
W.X. and M.Z. conceived the main idea of the theoretical framework and manuscript drafting. W.X., Z.M., and M.C. did literature review, related empirical analysis, and paper revisions.
Funding
This research was funded by the Fundamental Research Funds for Central Universities (No. SWU1709251 and No. SWU1709123) and the Chongqing Social Science Fund (No. 2017YBZX016 and No. 2016ZDSH04).
Conflicts of Interest
The authors declare no conflict of interest.
Appendix A

Table A1.
Potential indicators in the social vulnerability measurement system.
| Basic Indicator | Unit | Reference | Source |
|---|---|---|---|
| Per capita GDP | ¥ | Adger [17] | China Statistical Yearbook [39] |
| The proportion of primary industry | % | Proposed in this study | |
| Infrastructure development level | Mileage | Cutter [31]; Cutter et al. [4] | |
| Income gap between urban and rural residents | % | Proposed in this study | |
| Per capita fiscal revenue | ¥ | Cutter et al. [4] | |
| Per capita insurance | ¥ | Proposed in this study | |
| Number of criminal cases filed | Proposed in this study | ||
| Number of healthcare workers | out of a population of 1000 | Cutter et al. [4]; Zhou et al. [29] | |
| Number of social workers | Holand et al. [41] | ||
| Number of beds in healthcare facilities | Fekete [22] | ||
| The proportion of houses with brick and wood structure | % | Proposed in this study | |
| The proportion of population covered by radios and televisions | % | Proposed in this study | |
| The proportion of R&D funds in the GDP | % | Liu et al. [10] | |
| Number of patent granted | Liu et al. [10] | ||
| Number of topographic maps | Proposed in this study | ||
| Number of meteorological stations | Proposed in this study | ||
| Female percentage | % | Adger [17]; Cutter et al. [4] | China Population and Employment Statistics Yearbook [44] |
| Proportion of population over 60 years old | % | Cutter et al. [4] | |
| Proportion of children under 14 years old | % | Cutter et al. [4] | |
| Demographic density | population per km2 | Cutter and Finch [3] | |
| The number of mining workers | out of a population of 10,000 | Cutter et al. [4] | |
| The number of workers in the primary industry | out of a population of 10,000 | Cutter and Finch [3] | |
| Unemployment rate | % | Cutter et al. [4] | |
| Ethnic minority population | % | Cutter et al. [4] | |
| Number of people receiving minimum income assistance | Flanagan et al. [42] | ||
| Divorce rate | % | Holand et al. [41] | |
| Illiteracy rate | % | Brooks et al. [43] | |
| The number of people with tertiary level education or above | out of a population of 1000 | Flanagan et al. [42] | |
| Number of college students | out of a population of 1000 | Flanagan et al. [42] | |
| Number of disasters per year | Gallopin [9] | China Meteorological Disaster Yearbook [45] |
Appendix B
The dataset used for measuring the vulnerability index during floods is for 2003–2015 in China. It includes affected population and affected area as the input variables in the nonparametric DEA method, and the number of human lives lost and the economic loss as the output variables in the nonparametric DEA method. The relevant data are from the official website of National Flood Control and Drought Relief Headquarters [46], and are shown in Table A2.
Table A2.
The first dataset used for measuring the vulnerability index during floods.
| Year | Affected Population (10,000 People) | Affected Area (10,000 Hectares) | Death Population (People) | Economic Loss (100 Million RMB) |
|---|---|---|---|---|
| 2003 | 22,600 | 2036.6 | 1551 | 1300 |
| 2004 | 10,700 | 778.2 | 1282 | 714 |
| 2005 | 20,026 | 1496.8 | 1660 | 1662 |
| 2006 | 13,882 | 1052.2 | 2276 | 1333 |
| 2007 | 14,000 | 1046.3 | 1467 | 845 |
| 2008 | 10,372 | 668.2 | 915 | 652 |
| 2009 | 11,100 | 874.8 | 538 | 846 |
| 2010 | 21,084 | 1786.6 | 3222 | 3745 |
| 2011 | 8942 | 719.1 | 519 | 1301 |
| 2012 | 12,367 | 1121.8 | 673 | 2675 |
| 2013 | 12,022 | 1190.1 | 774 | 3145 |
| 2014 | 7382 | 591.9 | 485 | 1574 |
| 2015 | 7641 | 613.2 | 319 | 1661 |
References
- China Meteorological Administration. China Floods and Droughts Disasters Bullet in 2014. Available online: http://www.cma.gov.cn/2011zwxx/2011zxxgk/gzbg/ (accessed on 12 January 2018). (In Chinese)
- O’Keefe, K. Taking the naturalness out of natural disasters. Nature 1976, 260, 566–567. [Google Scholar] [CrossRef]
- Cutter, S.L.; Finch, C. Temporal and Spatial Changes in Social Vulnerability to Natural Hazards. Proc. Natl. Acad. Sci. USA 2008, 105, 2301–2306. [Google Scholar] [CrossRef] [PubMed]
- Cutter, S.L.; Boruff, B.J.; Shirley, W.L. Social vulnerability to environmental hazards. Soc. Sci. Q. 2003, 84, 242–261. [Google Scholar] [CrossRef]
- Kablan, M.; Dongo, K.; Coulibaly, M. Assessment of Social Vulnerability to Flood in Urban Côte d’Ivoire Using the MOVE Framework. Water 2017, 9, 292. [Google Scholar] [CrossRef]
- You, W.; Zhang, Y. Study on the vulnerability index system of flood disaster. Disaster Sci. 2013, 28, 215–220. (In Chinese) [Google Scholar]
- Li, C.; Feng, T.; Shi, Q. Flood Social Vulnerability Assessment Based on Entropy Method and Its Time Series Analysis: A Case of Jingzhou City from 2001 to 2012. J. Catastrophol. 2015, 30, 110–117. (In Chinese) [Google Scholar]
- Feng, T.; Li, C.; Huang, J. Assessment of Social Vulnerability to Flood and Its Spatial Variation in Jingzhou City. J. Yangtze River Sci. Res. 2015, 32, 52–57. (In Chinese) [Google Scholar]
- Gallopin, G.C. Linkages between vulnerability, resilience, and adaptive capacity. Glob. Environ. Chang. 2006, 16, 293–303. [Google Scholar] [CrossRef]
- Liu, K.; Ren, J.; Sun, X.; An, X. Science and Technology Vulnerability’s Connotation, Evaluation and Regulation Based on the Empirical Research in Shandong Province. Sci. Technol. Manag. Res. 2016, 21, 74–78. (In Chinese) [Google Scholar]
- Janssen, M.A.; Schoon, M.L.; Ke, W. Scholarly networks on resilience, vulnerability and adaptation within the human dimensions of global environmental change. Glob. Environ. Chang. 2007, 16, 240–252. [Google Scholar] [CrossRef]
- Timmermann, P. Vulnerability, Resilience and the Collapse of Society. No. 1 in Environmental Monograph; Institute for Environmental Studies, University of Toronto: Toronto, ON, Canada, 1981. [Google Scholar]
- Newell, B.; Crumley, C.L.; Hassan, N. A conceptual template for integrative human environment research. Glob. Environ. Chang. 2005, 15, 299–307. [Google Scholar] [CrossRef]
- ISDR. Gender Perspectives: Integrating Disaster Risk Reduction into Climate Change Adaptation: Good Practices and Lessons Learned; United Nations International Strategy for Disaster Reduction: Geneva, Switzerland, 2008. [Google Scholar]
- Birkmann, J. Indicators and criteria for measuring vulnerability: Theoretical bases and requirements. In Measuring Vulnerability to Natural Hazards—Towards Disaster Resilient Societies; Birkmann, J., Ed.; United Nations University: New York, NY, USA, 2006; pp. 55–77. [Google Scholar]
- Moss, R.H.; Brenkert, A.L.; Malone, E.L. Vulnerability to Climate Change: A Quantitative Approach; PNNL-SA-33642, Advances in Science & Research; U.S. Department of Commerce: Springfield, VA, USA, 2001.
- Adger, W.N. Vulnerability. Glob. Environ. Chang. 2006, 16, 268–281. [Google Scholar] [CrossRef]
- Huang, X.; Huang, X.; Cui, C.; Yang, X. Concepts, Analysis Framework and Evaluation Methods of Social Vulnerability. Prog. Geogr. 2014, 11, 1512–1525. (In Chinese) [Google Scholar]
- Khazai, B.; Merz, M.; Schulz, C. An Integrated Indicator Framework for Spatial Assessment of Industrial and Social Vulnerability to Indirect Disaster Losses. Nat. Hazards 2013, 67, 145–167. [Google Scholar] [CrossRef]
- Balica, S.F.; Wright, N.G.; van der Meulen, F. A flood vulnerability index for coastal cities and its use in assessing climate change impacts. Nat. Hazards 2012, 64, 73–105. [Google Scholar] [CrossRef] [Green Version]
- Koks, E.E.; Jongman, B.; Husby, T.G.; Botzen, W.J. Combining hazard, exposure and social vulnerability to provide lessons for flood risk management. Environ. Sci. Policy 2015, 47, 42–52. [Google Scholar] [CrossRef]
- Fekete, A. Validation of a social vulnerability index in context to river-floods in Germany. Nat. Hazards Earth Syst. Sci. 2009, 9, 393–403. [Google Scholar] [CrossRef] [Green Version]
- Rufat, S.; Tate, E.; Burton, C.G.; Maroof, A.S. Social vulnerability to floods: Review of case studies and implications for measurement. Int. J. Disaster Risk Reduct. 2015, 14, 470–486. [Google Scholar] [CrossRef]
- Ge, Y.; Shi, P.; Liu, J. Improvement and Application of Assessment Methods of Social Vulnerability in Floods in China—A Case Study of Changsha Area. J. Nat. Disaster 2008, 6, 54–58. (In Chinese) [Google Scholar]
- Zhang, J.; Jia, Z. Urban Vulnerability Assessment Index System of Social Vulnerability. Sci. Technol. Wizard 2010, 36, 12–14. (In Chinese) [Google Scholar]
- Chen, L.; Xu, W.; Zhou, X. Assessment of Social Vulnerability of Natural Disasters—A Case Study of Shanghai. Disaster Sci. 2012, 27, 98–100. (In Chinese) [Google Scholar]
- Wen, Y. Analysis of Social Vulnerability of Natural Disasters in Shaanxi Province. Acta Metall. Sin. 2012, 27, 77–81. (In Chinese) [Google Scholar]
- Zhang, Y.; You, W. An Assessment on Natural Disasters Social Vulnerability based on TOPSIS. Disaster Sci. 2014, 29, 109–114. (In Chinese) [Google Scholar]
- Zhou, Y.; Li, N.; Wu, W.; Wu, J. Assessment of provincial social vulnerability to natural disasters in China. Nat. Hazards 2014, 71, 2165–2186. [Google Scholar] [CrossRef]
- Molyneaux, L.; Brown, C.; Wagner, L.; Foster, J. Measuring Resilience in Energy Systems: Insights from a Range of Disciplines. Renew. Sustain. Energy Rev. 2016, 59, 1068–1079. [Google Scholar] [CrossRef]
- Cutter, S.L.; Mitchell, J.T.; Scott, M.S. Revealing the Vulnerability of People and Places: A Case Study of Georgetown County, South Carolina. Ann. Assoc. Am. Geogr. 2000, 90, 713–737. [Google Scholar] [CrossRef]
- Puente, S. Social Vulnerability to Disaster in Mexico City. In Crucibles of Hazard: Mega-Cities and Disasters in Transition; Mitchell, J.K., Ed.; United Nations University Press: Tokyo, Japan, 1999. [Google Scholar]
- Platt, R. Hurricane Andrew and the Reshaping of Miami: Ethnicity, Gender, and the Socio-Political Ecology of Disasters; Florida International University, International Hurricane Center: Miami, FL, USA, 2000. [Google Scholar]
- Dumenu, W.K.; Obeng, E.A. Climate change and rural communities in Ghana: Social vulnerability, impacts, adaptations and policy implications. Environ. Sci. Policy 2016, 55, 208–217. [Google Scholar] [CrossRef]
- Morrow, B.H. Identifying and Mapping Community Vulnerability. Disasters 1999, 23, 11–18. [Google Scholar] [CrossRef]
- Cooper, W.W.; Seiford, L.M.; Zhu, J. Handbook on Data Envelopment Analysis; Springer: New York, NY, USA, 2011. [Google Scholar]
- Carlucci, F.; Pisani, S. A Multiattribute Measure of Human Development. Soc. Indic. Res. 1995, 36, 145–176. [Google Scholar] [CrossRef]
- Yang, Y.; Hu, A.; Zhang, N. An Alternative to Human Development Index with Principal Component Analysis. Econ. Res. 2005, 7, 4–17. (In Chinese) [Google Scholar]
- National Bureau of Statistics of the People’s Republic of China. China Statistical Yearbook. Available online: http://data.stats.gov.cn/easyquery.htm?cn=C01 (accessed on 12 January 2018). (In Chinese)
- Ge, Y.; Dou, W.; Zhang, H. A New Framework for Understanding Urban Social Vulnerability from a Network Perspective. Sustainability 2017, 9, 17–23. [Google Scholar] [CrossRef]
- Holand, I.S.; Lujala, P.; Rød, J.K. Social vulnerability assessment for Norway: A quantitative approach. Norsk Geografisk Tidsskrift-Norwegian J. Geogr. 2011, 65, 1–17. [Google Scholar] [CrossRef] [Green Version]
- Flanagan, B.E.; Gregory, E.W.; Hallisey, E.J. A Social Vulnerability Index for Disaster Management. J. Homel. Secur. Emerg. Manag. 2011, 8, 1–22. [Google Scholar] [CrossRef]
- Brooks, N.; Adger, W.N.; Kelly, P.M. The determinants of vulnerability and adaptive capacity at the national level and the implication for adaptation. Glob. Environ. Chang. 2005, 15, 151–163. [Google Scholar] [CrossRef]
- National Bureau of Statistics of the People’s Republic of China. China Population and Employment Statistics Yearbook. Available online: http://cnki.heinfo.gov.cn/csydkns/navi/HomePage.aspx?id= N2016010131&name=YZGRL&floor=1 (accessed on 12 April 2018). (In Chinese)
- China Meteorological Administration. China Meteorological Disaster Yearbook. Available online: http://cyfd.cnki.com.cn/N2015100147.htm (accessed on 12 April 2018). (In Chinese).
- National Flood Control and Drought Relief Headquarters. China Flood & Drought Management. Available online: http://fxkh.mwr.gov.cn/ (accessed on 12 April 2018). (In Chinese)
Figure 1.
Vulnerability index to flood disasters in China.

Figure 2.
Pearson’s correlation coefficient.

Figure 3.
The social vulnerability level to flood disasters from 2003 to 2015 in China.

Table 1.
Principal component eigenvalues and variance contribution rate.
| Principal Component | Eigenvalues | Variance Contribution Rate (%) | Cumulative Variance Contribution Rate (%) |
|---|---|---|---|
| F1 | 5.3525 | 51.16 | 51.16 |
| F2 | 2.7973 | 34.15 | 85.31 |
Table 2.
Principal component score coefficient matrix.
| Indicator | F1 | F2 |
|---|---|---|
| Proportion of primary industry | 0.6231 | 0.1577 |
| Infrastructure development level | −0.5891 | 0.2839 |
| Income gap between urban and rural residents | 0.7157 | 0.3673 |
| Proportion of population over 60 years old | 0.3661 | 0.7467 |
| Proportion of children under 14 years old | 0.1452 | 0.6349 |
| Number of social workers | −0.2571 | −0.5831 |
| Number of healthcare workers | −0.1677 | −0.5672 |
| Number of people receiving minimum income assistance | −0.3045 | 0.7470 |
| Number of disasters per year | 0.5567 | 0.2532 |
© 2018 by the authors. Licensee MDPI, Basel, Switzerland. This article is an open access article distributed under the terms and conditions of the Creative Commons Attribution (CC BY) license (http://creativecommons.org/licenses/by/4.0/).
Share and Cite
MDPI and ACS Style
Zhang, M.; Xiang, W.; Chen, M.; Mao, Z. Measuring Social Vulnerability to Flood Disasters in China. Sustainability 2018, 10, 2676. https://0-doi-org.brum.beds.ac.uk/10.3390/su10082676
AMA Style
Zhang M, Xiang W, Chen M, Mao Z. Measuring Social Vulnerability to Flood Disasters in China. Sustainability. 2018; 10(8):2676. https://0-doi-org.brum.beds.ac.uk/10.3390/su10082676
Chicago/Turabian StyleZhang, Ming, Wenbo Xiang, Meilan Chen, and Zisen Mao. 2018. "Measuring Social Vulnerability to Flood Disasters in China" Sustainability 10, no. 8: 2676. https://0-doi-org.brum.beds.ac.uk/10.3390/su10082676
Note that from the first issue of 2016, this journal uses article numbers instead of page numbers. See further details here.