Sustainability Performance of National Bio-Economies


1
Center for Development Research, University of Bonn, D-53113 Bonn, Germany
2
Institute for Ecological Economics, Vienna University of Economics and Business, 1020 Vienna, Austria
*
Author to whom correspondence should be addressed.
Sustainability 2018, 10(8), 2705; https://0-doi-org.brum.beds.ac.uk/10.3390/su10082705
Submission received: 28 June 2018
/
Revised: 24 July 2018
/
Accepted: 27 July 2018
/
Published: 1 August 2018
(This article belongs to the Special Issue Advances in Food and Non-Food Biomass Production, Processing and Use in Sub-Saharan Africa: Towards a Basis for a Regional Bioeconomy)
Abstract
:An increasing number of countries develop bio-economy strategies to promote a stronger reliance on the efficient use of renewable biological resources in order to meet multiple sustainability challenges. At the global scale, however, bio-economies are diverse, with sectors such as agriculture, forestry, energy, chemicals, pharmaceuticals, as well as science and education. In this study, we developed a typology of bio-economies based on country-specific characteristics, and describe five different bio-economy types with varying degrees of importance in the primary and the high-tech sector. We also matched the bio-economy types against the foci of their bio-economy strategies and evaluated their sustainability performance. Overall, high-tech bio-economies seem to be more diversified in terms of their policy strategies while the policies of those relying on the primary sector are focused on bioenergy and high-tech industries. In terms of sustainability performance, indicators suggest that diversified high-tech economies have experienced a slight sustainability improvement, especially in terms of resource consumption. Footprints remain, however, at the highest levels compared to all other bio-economy types with large amounts of resources and raw materials being imported from other countries. These results highlight the necessity of developed high-tech bio-economies to further decrease their environmental footprint domestically and internationally, and the importance of biotechnology innovation transfer after critical and comprehensive sustainability assessments.
1. Introduction
Despite the current drop in price, many fossil fuel resources are becoming increasingly scarce [1], and their consumption is associated with climate change, and harmful effects on ecosystems and human health. At the same time, population growth and corresponding pressures on natural resources have risen beyond safe ecological limits [2]. In response to these societal challenges, countries have adopted ambitious global goals such as the 2 °C limit to global warming, the Aichi Biodiversity Targets, and the Sustainable Development Goals (SDGs). However, the unprecedented global awareness of sustainability issues has yet to be matched with appropriate action towards achieving tangible goals and targets.
An increasing number of countries look to the bio-economy as a strategy to (a) reduce reliance on fossil fuels and (b) enable sustainable development through a “biologization” of the regular economy [3,4,5]. As a consequence, the conceptual development of the bio-economy has been driven by the fossil fuel substitution perspective, as well as the biotechnology innovations perspective, leading to multiple definitions for the bio-economy (see [6,7]). While early publications adopted sector specific definitions or focused purely on biotechnology [8,9], the bio-economy is increasingly being understood to include all kinds of economic activity that rely on biological processes, products, and principles [10]. In this study we adopt a broad definition that includes traditionally bio-based sectors such as agriculture and forestry, but also bio-based pharmaceutics, waste treatment, energy, bio-plastics, and chemicals.
Bugge et al. [11] identified three different visions of bio-economy that have developed simultaneously: (1) the bio-technology vision focusing on research, application, and commercialization of bio-technology innovations, (2) the bio-resource vision with an emphasis on the efficient and upgraded use of raw materials, and (3) the bio-ecology vision centered around the concept of sustainability and ecosystem conservation through increased efficiency. Similarly, Hausknost et al. [12] categorized four different visions of a bio-economy along the dichotomies of sufficiency versus capitalist growth and agro-ecology versus industrial (bio-)technology. These “ideal types”, however, correspond to political visions of the bio-economy and do not necessarily reflect real world conditions [13]. Behind such visions are fundamentally different views and expectations about the costs and benefits of a bio-based transformation of the economy. Proponents expect economic growth, employment opportunities, and environmental benefits [14,15,16], whereas critics fear the uncontrolled spread of risk technologies, unequal benefit sharing outcomes, and environmental damage [17]. A balanced view requires a better understanding and predictive tools to assess the complex cause-effect relationships involved in international trade and innovation/knowledge systems, which act as key mediators in a global bio-based transformation. Therefore, in order to strengthen social acceptance of bio-economy policies, a better understanding of sustainability implications and a consideration of this knowledge when designing bio-economy policies is necessary to avoid negative impacts from policy measures [18].
This paper aims at improving our understanding of the determinants and sustainability implications of the supply and demand of bio-based products, and our knowledge about the global bio-economy by answering the following research questions: (1) How do countries differ in terms of their bio-economy and comparative advantages? (2) Can these differences be explained by the adoption of different national policies? And (3) what are the sustainability implications of these different bio-economy pathways? First, we characterize bio-economy types based on a set of indicators that we expect to be associated with countries’ strategic decisions to embark on a particular bio-based development pathway. We then show that these bio-economy types have in fact adopted considerably distinct national bio-economy strategies. However, we also find that the current and anticipated bio-economy developments bear both opportunities and risks in multiple SDG dimensions.
National bio-economies, as well as frameworks to assess their implementation, often focus on economic benefits but often ignore other aspects of sustainability such as resource and waste management along the whole value chain, and competition between biomass needs [19,20]. As in our study, a cluster approach was also applied by Philippidis et al. [21] to characterize different bio-economies of the European Union (EU) based on sector-specific backward and forward-linkages, as well as employment multipliers. Ronzon et al. [22] characterized and grouped all countries of the EU based on the productivity, turnover, and job generation of different bio-economy sectors. However, while they focused on the implications of growth in different bio-economy sectors for employment opportunities and wealth generation, we assess the sustainability of the different sectors, including an ecological dimension and link the typology to existing bio-economy policy strategies within each respective country. The enormous diversity of country contexts and bio-economy development potential around the world is likely to be reflected in the strategies adopted by governments to promote bio-based growth [3,23]. The national bio-economy policy strategy of Nigeria, for example, focuses on bioenergy, whereas India pursues high-tech, research, and innovation issues. Denmark´s strategy broadly advocates for a green economy (a sustainable economy), and Portugal concentrates on the blue economy (fisheries and other marine and coastal economic sectors, see [3]). We expect countries’ bio-economy strategies to reflect key contextual determinants, such as: (1) global comparative advantages in specific bio-economy sectors (e.g., agriculture, forestry, biotechnology, etc.), (2) current or anticipated sustainability threats, and (3) consumer, i.e., voter, preferences. Given the complexities of the cause-effect relationships involved in bringing about sustainable development, we also expect the current global mix of national contextual conditions to result in a portfolio of bio-economy strategies that requires an appropriate governance regime to minimize negative social and environmental externalities and maximize opportunities for sustainable development. Our subsequent analysis includes social development indicators, but focuses on current performance and performance trends in key environmental outcome dimensions, such as CO2 emissions, biodiversity, and related footprint indicators.
2. Materials and Methods
We identified a set of globally available indicators supported by targeted literature e.g., [19,22,24] and data review that reflect the three key contextual dimensions introduced in the previous section (Table 1). The selection of specific indicators was mainly driven by the availability of comprehensive and up-to-date datasets, which were available in open access databases (e.g., of the Food and Agriculture Organisation, International Labour Organisation, and the World Bank). This included the overall importance of different bio-economy sectors, i.e., the primary and the high-tech sector, as well as the overall comparative advantages for these sectors, such as the availability of bioproductive land and skilled labor.
We measured the importance of the primary and the high-tech bio-economy sectors, which was likely to reflect comparative advantages, and to some degree, social choice and voter preferences. Additionally, specific bio-economy sectors are likely to be the result of certain sustainability threats but may have their own sustainability implications that need to be considered. While we tried to capture the economic importance of the primary sector based on indicators reflecting the economic significance, employment opportunity and overall land occupied, we employed indicators reflecting economic importance in terms of international trade and patent applications for the high-tech sector. We assumed a stronger concentration of high-tech innovations in knowledge-, investment- and research-intensive sectors such as pharmacy, biotechnology, biochemical, and bioplastics. A vibrant, innovative, and economically viable bio-economy is likely to be reflected in the number of patent applications by residents, as well as non-residents and exports of high-tech products.
Comparative advantages are also reflected by the availability of resources, such as the availability of bioproductive land, which we used interchangeably with biocapacity, as well as the availability of skilled labor. According to the definition of the Global Footprint Network [37] biocapacity refers to “the capacity of a particular surface to renew what people demand. In the National Footprint Accounts, the biocapacity of an area is calculated by multiplying the actual physical area by the yield factor and the appropriate equivalence factor”. Yield and equivalence factors are conversion factors used to translate hectares into global hectares. While the availability of bioproductive land is more or less determined by bioclimatic factors, the availability of skilled labor usually depends strongly on specific policies as well as on investments in education, and therefore is controlled, at least in democratic countries, by the consumer and voters’ choice. Both the availability of bioproductive land and of skilled labor have certain sustainability implications in terms of land use intensification, decent work, and education.
For the availability of skilled labor, we selected indicators reflecting the share of the population enrolled in the tertiary sector, as well as employees with an advanced education, to account for immigration and emigration of trained staff; to reflect the actual output of the scientific community we applied the number of scientific publications per million people. The availability of skilled labor reflected a comparative advantage, which is likely to play an important role for the knowledge intensive high-tech sector.
Mean values were calculated, for those data with multiple years. Some indicators, which were not yet standardized by area or population size, were calculated accordingly. All values xi,j were normalized by calculating the z-scores zi,j for each country i and each indicator j (Equation (1)).
The normalized indicator values zi,j were combined in multivariate indices calculated as mean values for each country i over all normalized indicators j (Equation (2)).
This approach was chosen to sufficiently reflect and summarize different aspects related to the importance of different bio-economy sectors, the availability of resources including bioproductive land and skills, as well as the international role of trade in a comprehensive way. Furthermore, the combination of indicators in multivariate indices calculated as mean values across all indicators allowed us to also include indicators with incomplete datasets. In these cases, only values for available indicators were used. Countries with missing index values were excluded from the cluster analysis. All indices were combined in a new dataset and used for cluster analysis.
Initially, various clustering algorithms were applied to the dataset leading to the result-based selection of a Gaussian finite mixture model-based clustering. Different parameterized Gaussian mixture models were fitted through an Expectation-Maximization-Algorithm, setting the volume, shape, and orientation of the covariance to be either equal or variable [38]. The optimal model according to the highest BIC value (Bayesian information criterion) was selected for clustering and further analysis. The cluster-based typology was evaluated and interpreted by the calculation of the F-Statistic and t-value of the different types. The F-value indicates whether an indicator significantly contributes to the clustering of a type, by comparing the variance of the cluster to the variance of the whole dataset (the smaller the F-value, the more homogenous the cluster). The t-value indicates how a cluster is characterized by each indicator comparing the means (a positive value indicates a higher mean and a negative value a lower mean for the cluster). Additionally, boxplots as well as pairwise Wilcoxon Rank Sum Tests with Bonferroni correction were calculated and interpreted.
The clustering results were evaluated against the number and foci of existing bio-economy strategies of the different countries according to data from the German Bio-economy Council [3]. The selection of the documents by the German Bio-economy council was based on an Internet-based desk study using publicly available government documents published between 2005 and 2015. In the absence of dedicated bio-economy strategies, policy documents linking to bio-economy such as biotechnology, bioenergy, or biobased-economy/industry were included. Other papers, such as agricultural, forestry, or marine strategies were only included if they had a strong focus on bio-economy or innovative bio-based approaches.
Furthermore, sustainability performance was assessed using a selection of the SDG indicators database, as well as indicators for footprints associated with international trade (Table 2). We focused on indicators for SDGs that are frequently mentioned to be considerably affected by growth in bio-economy sectors, especially SDG 2 (no hunger), SDG 7 (affordable and clean energy), and SDG 12 (responsible consumption and production). These are among the SDGs most commonly referred to in literature [39,40] and mentioned by experts, as part of an online survey, with respect to the potential benefits from the bio-economy (e.g., increasing agricultural production, emission reduction from renewable energy production, effective waste treatment), as well as its risks, such as the competition between food and energy and biodiversity loss. However, this does not imply that there are no potential impacts on the other SDGs. Other indicators were also evaluated, but due to inconclusive or insignificant results, they were not included in this publication.
We complemented this dataset with additional data on the ecological footprint, and the ecological deficit or reserve, as well as the foreign and domestic biomass footprint that could be attributed to the consumption of food as well as non-food products. The biomass footprint for food as well as non-food purposes was calculated using the Leontief inverses [41] for the years 2000 and 2013 from the multi-region input-output (MRIO) database Eora in the harmonized 26-sector classification [42], together with the UN Environmental Program material extraction data set [43]. We classified the sectors into food and non-food categories, assuming that upstream biomass inputs of mining, non-food manufacturing as well as transport sectors are used for non-food purposes. Final products from agriculture, fishing, and food processing sectors, as well as biomass uses in the service sectors (mainly restaurants and public services) are attributed to food uses.
Sustainability performance was assessed for the current status, calculated as average values between 2010 and 2015, and for the change in performance, calculated as the change between the current status and the average values for the years 2000 to 2005. Since not all indicators were available for each year, missing years were ignored for the mean calculation.
Boxplots and pairwise Wilcoxon Rank Sum Tests with Bonferroni correction were used to compare the clusters for the different sustainability indicators. The statistical computing environment R was used for all analyses and figure preparations. The packages used were mclust 5.3 [38] for clustering, ggplot2 [44], factoextra [45], rworldmap [46], gridExtra [47], and cowPlot [48] for visualization, and Hmisc [49], matrixStats [50], and multcompView [51] for statistical evaluation.
3. Results
3.1. Bio-Economy Classification
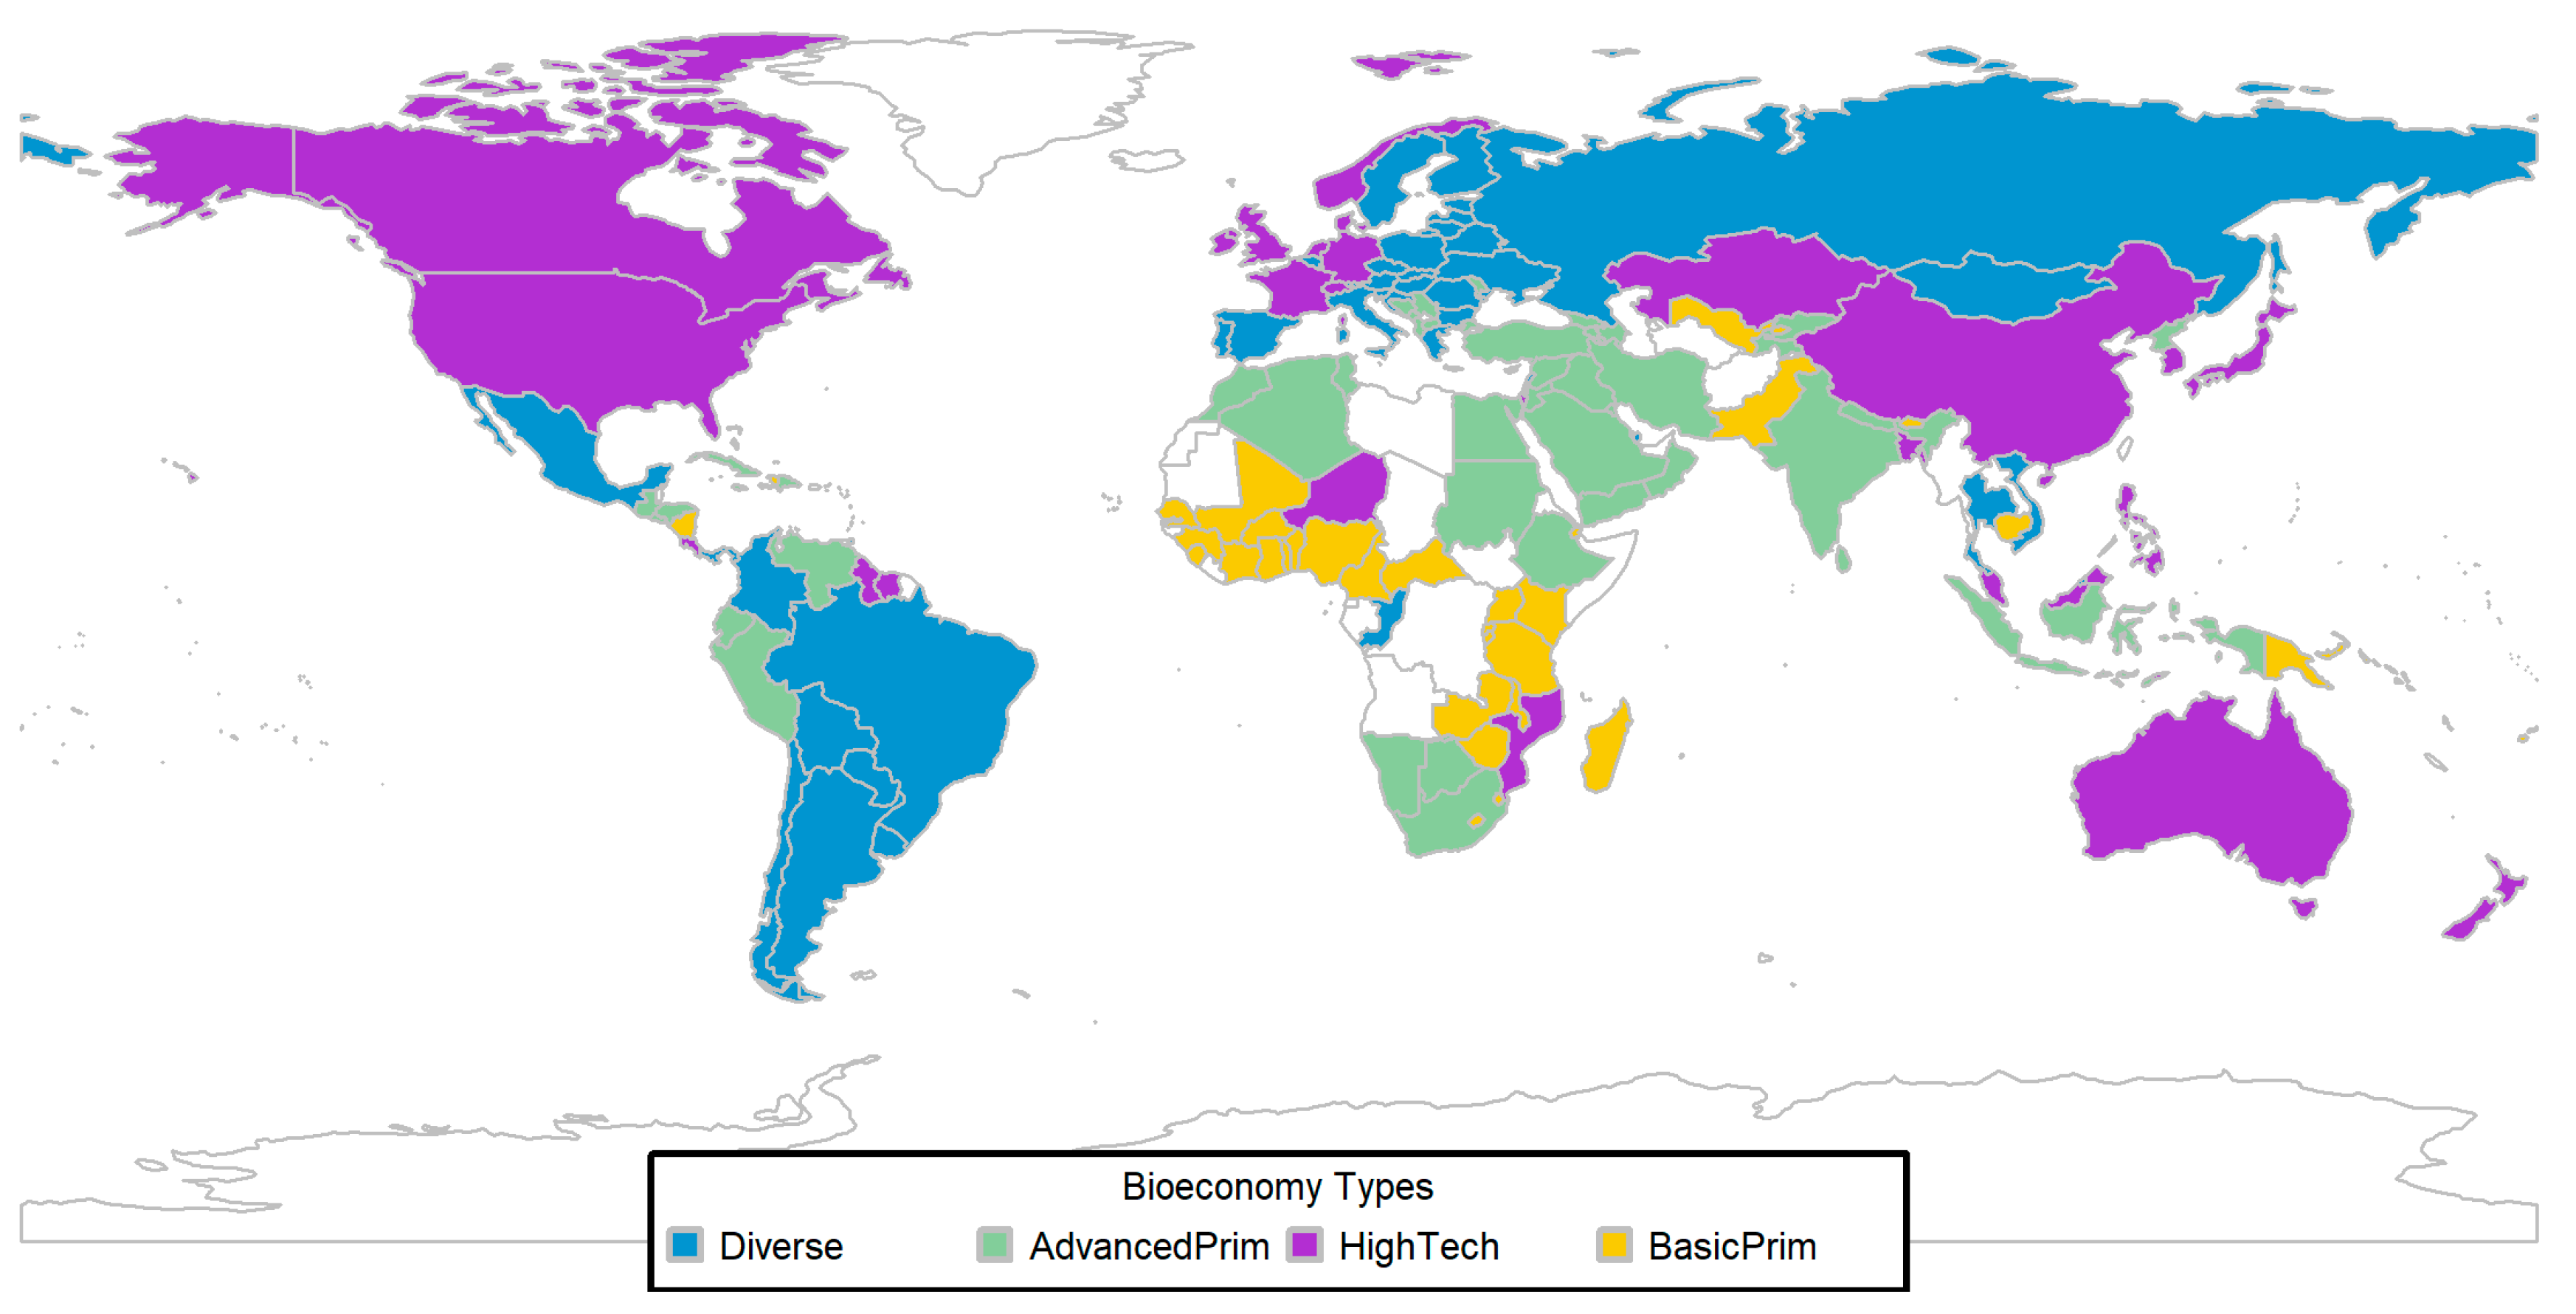
Statistical evaluations of different Gaussian models indicated that the VVI model (diagonal distribution, varying volume and shape) with four components (clusters) received the highest BIC value and was therefore selected for further analyses. Based on the selected indicators and clustering algorithm countries were grouped into four different clusters, the Diversified Bio-economies (Diverse), the Advanced Primary Sector Bio-economies (AdvancedPrim), the High-Tech Bio-economies (HighTech), and the Basic Primary Sector Bio-economies (BasicPrim) (Figure 1). The different bio-economy clusters were considerably different from each other according to F and t-values (Table 3), and showed significant characteristics (Figure 2).
The Diverse cluster, which included 50 countries, was mainly comprised of different countries in South and Central America (Antigua and Barbuda, Argentina, Aruba, The Bahamas, Barbados, Bolivia, Brazil, Chile, Colombia, Panama, Paraguay, St. Lucia, St. Vincent and the Grenadines, Trinidad and Tobago, Uruguay), countries in Southeast and Central Asia (Brunei Darussalam, Lebanon, Mongolia, Qatar, Samoa, Thailand, Tonga, Vietnam), eastern and southern Europe (Austria, Belarus, Belgium, Bulgaria, Croatia, Cyprus, Czech Republic, Estonia, Finland, Greece, Hungary, Italy, Latvia, Lithuania, Luxembourg, Poland, Portugal, Romania, the Russian Federation, Slovak Republic, Slovenia, Spain, Sweden, Ukraine), plus a few others (Congo, Mauritius, Mexico). Poland was identified as the most representative country of the Diverse cluster, characterized by a middling importance of both the high-tech and the primary sectors. This was matched by a mediocre availability of bioproductive land and skilled labor (the latter one not being significantly lower than the HighTech cluster).
The 45 countries belonging to the AdvancedPrim cluster were mainly found in Africa (Algeria, Sudan, Botswana, Cabo Verde, Ethiopia, Morocco, Namibia, South Africa, Tunisia, Egypt), Asia (North Korea, India, Indonesia, Iran, Iraq, Jordan, Kuwait, Kyrgyz Republic, Nepal, Oman, Saudi Arabia, Sri Lanka, Syrian Arab Republic, Tajikistan, Yemen), Central and South America (Cuba, Dominican Republic, Ecuador, El Salvador, Guatemala, Honduras, Jamaica, Peru, St. Kitts and Nevis, Venezuela) and eastern Europe (Albania, Armenia, Azerbaijan, Bosnia and Herzegovina, Georgia, Moldova, Macedonia, Turkey, Serbia). For AdvancedPrim countries, which were best represented by Botswana, the primary sector was more important for the economy than the high-tech sector, despite a relatively low availability of bioproductive land. However, the primary sector was not as important as for the BasicPrim cluster. Skill availability was at a mediocre level, which was significantly lower than for the Diverse and HighTech clusters. Corresponding to this limited availability of skilled labor, we found a rather low importance of the high-tech sector.
In the HighTech cluster, 32 countries from North America (Canada and the United States), parts of central and northern Europe (Denmark, France, Germany, Ireland, Malta, the Netherlands, Norway, Switzerland, UK), some parts of Asia (Bahrain, Bangladesh, Kazakhstan, Malaysia, Israel, Japan, Philippines, South Korea, Singapore, Timor-Leste, Vanuatu and China), South and Central America (Bermuda, Costa Rica, Grenada, Guyana, Suriname) as well as Australia, Mozambique, New Zealand, and Niger were summarized.
The high-tech sector played a very important role for the economies belonging to this cluster, best represented by countries such as Japan, South Korea, and Singapore, while the primary sector was of very little importance. This was matched by a significantly higher availability of skilled labor compared to all other clusters except the diversified cluster. The importance of the primary sector was very variable within this cluster and correspondingly, we found a high variation for the availability of bioproductive land.
Countries from Africa (Benin, Burkina Faso, Burundi, Cameroon, Central African Republic, Comoros, Côte d’Ivoire, Djibouti, the Gambia, Ghana, Guinea, Kenya, Lesotho, Madagascar, Malawi, Mali, Nigeria, Rwanda, Sao Tome and Principe, Senegal, Sierra Leone, Swaziland, Togo, Uganda, Tanzania, Zambia, and Zimbabwe), Southeast and Central Asia (Bhutan, Cambodia, Fiji, Pakistan, Papua New Guinea, Solomon Islands, Uzbekistan) and some South and Central American countries (Dominica, Haiti, Nicaragua) were included in the BasicPrim cluster (37 countries). These countries, best represented by the case of Tanzania, were characterized by a very high importance of the primary sector (significantly higher than for all other types) and a very low importance of the high-tech sector. The availability of skilled labor and bioproductive land were extremely poor (skill availability being significantly lower than for all other types). Compared to the AdvancedPrim, BasicPrim countries show a significantly higher importance of the primary sector coupled with a significantly lower skill availability.
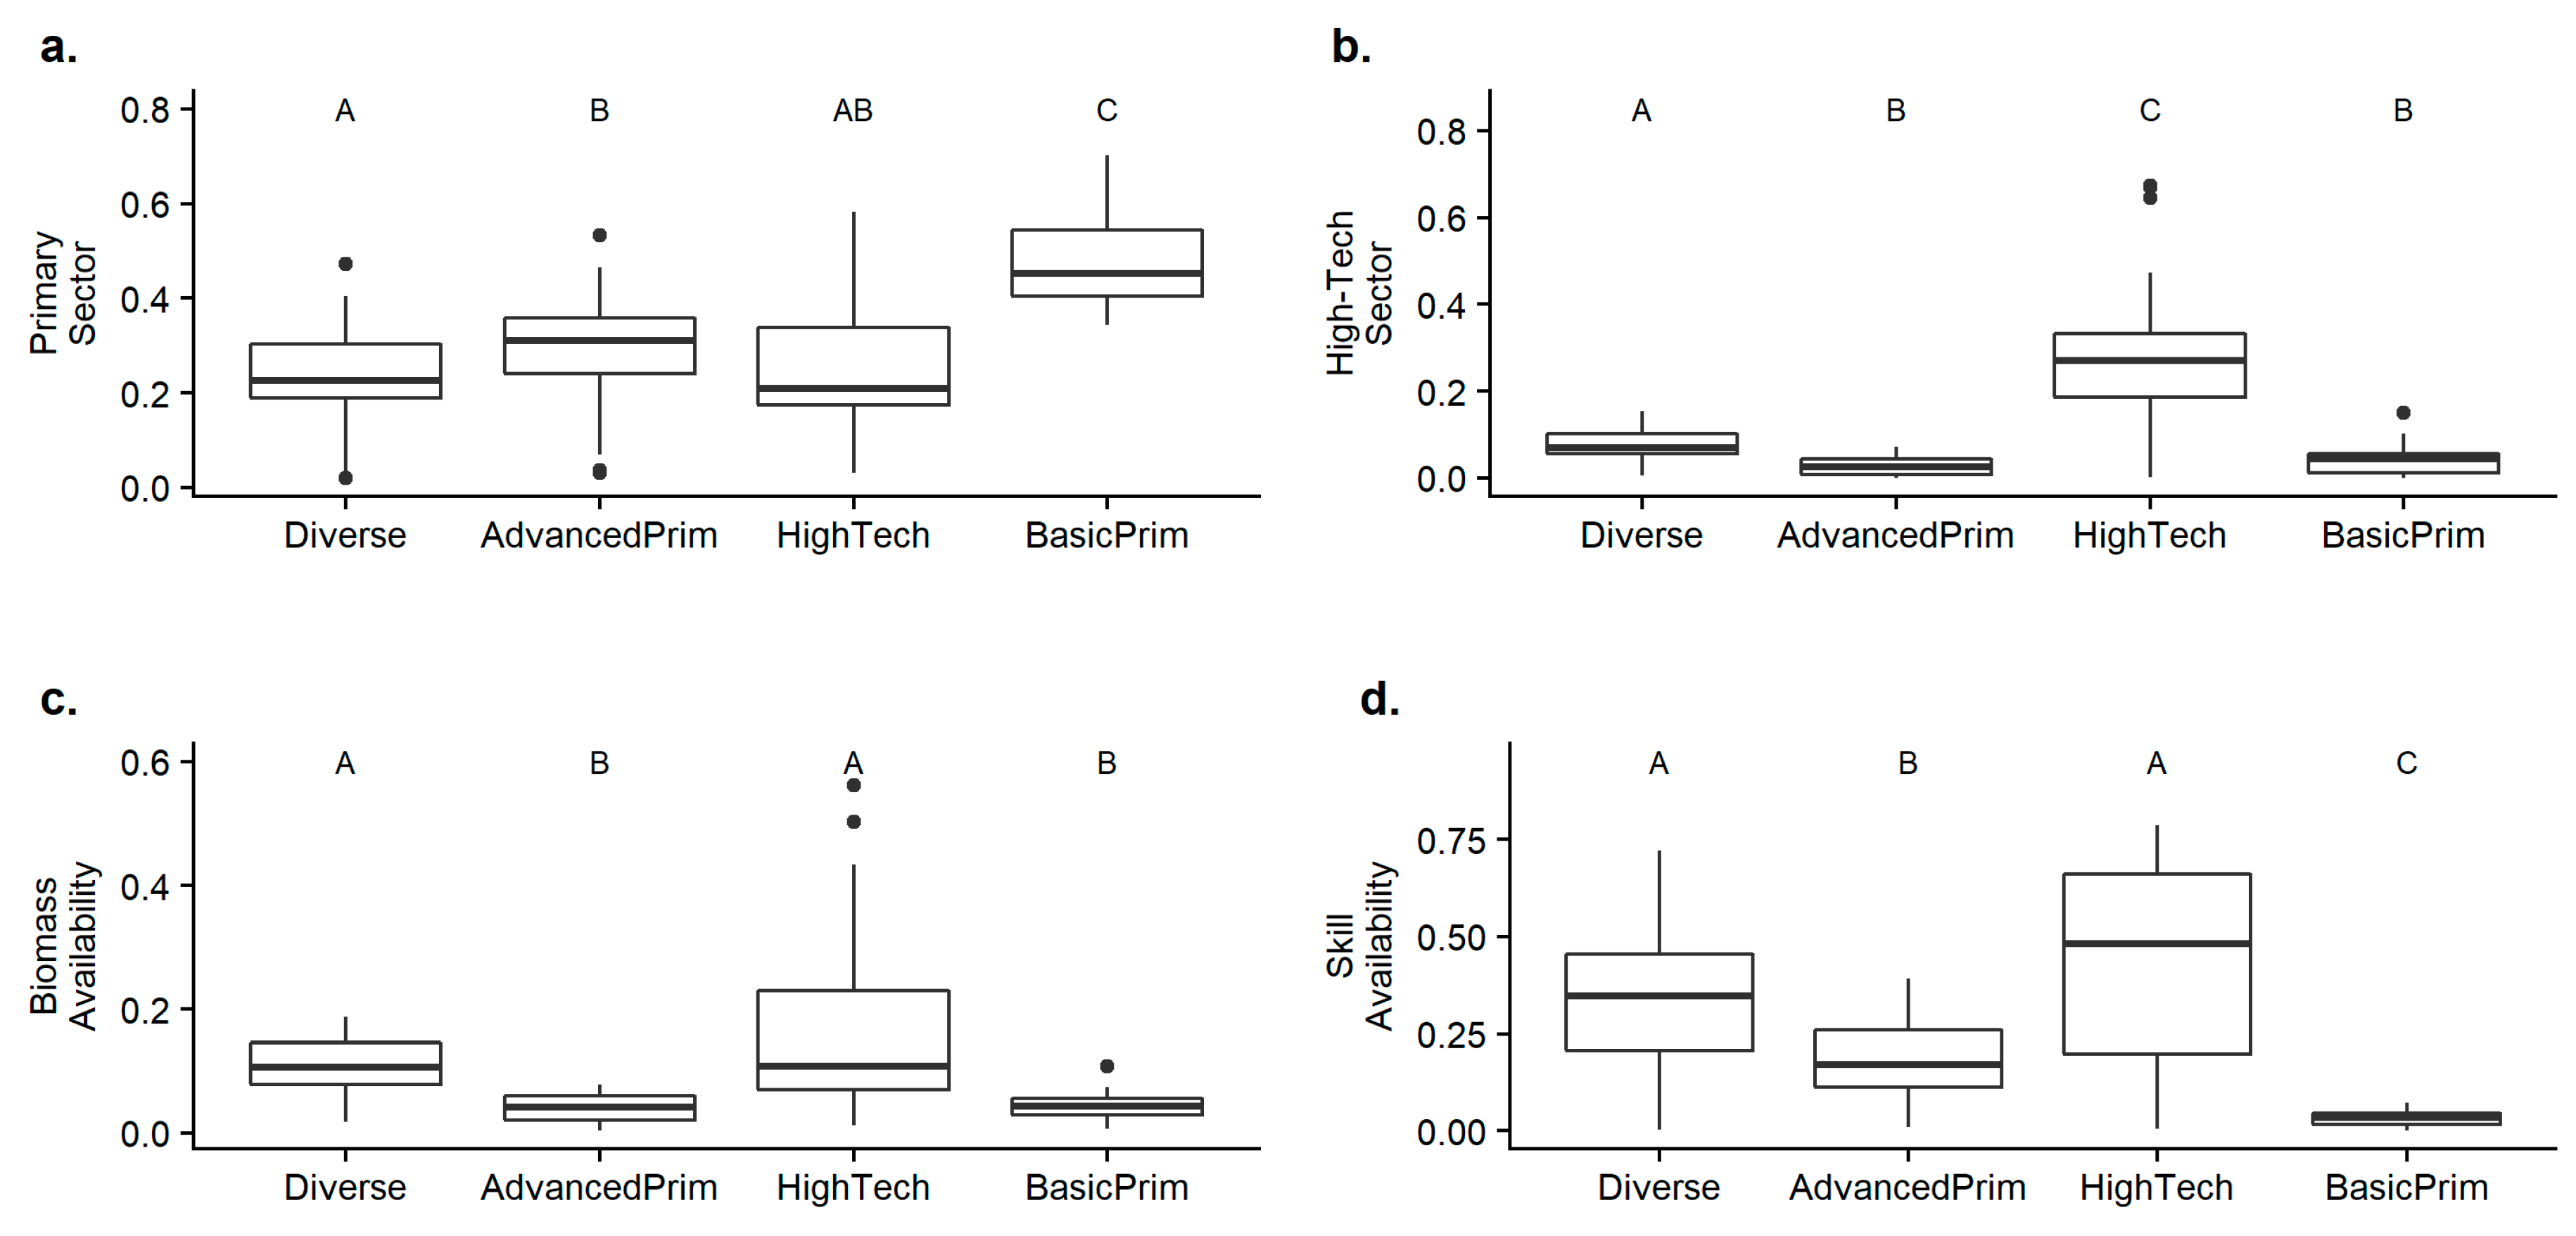
Overall, statistical evaluation of the clusters showed that the BasicPrim cluster had the most important primary sector, followed by the AdvancedPrim cluster. This was, however, not dependent on the availability of bioproductive land, which was significantly higher for type HighTech and Diverse countries. The overall correlation between biomass availability and the importance of the primary sector was even slightly negative (Table 4, r = −0.289, p < 0.001). The absence of high-level skills seemed to be a much better predictor of the importance of the primary sector (r = 0.574, p < 0.001) than the availability of biomass. In contrast, the importance of the high-tech sector was clearly reflected by the availability of skilled labor (r = 0.401, p < 0.001) highest for type HighTech, followed by type Diverse.
3.2. Bio-Economy Strategies across Clusters
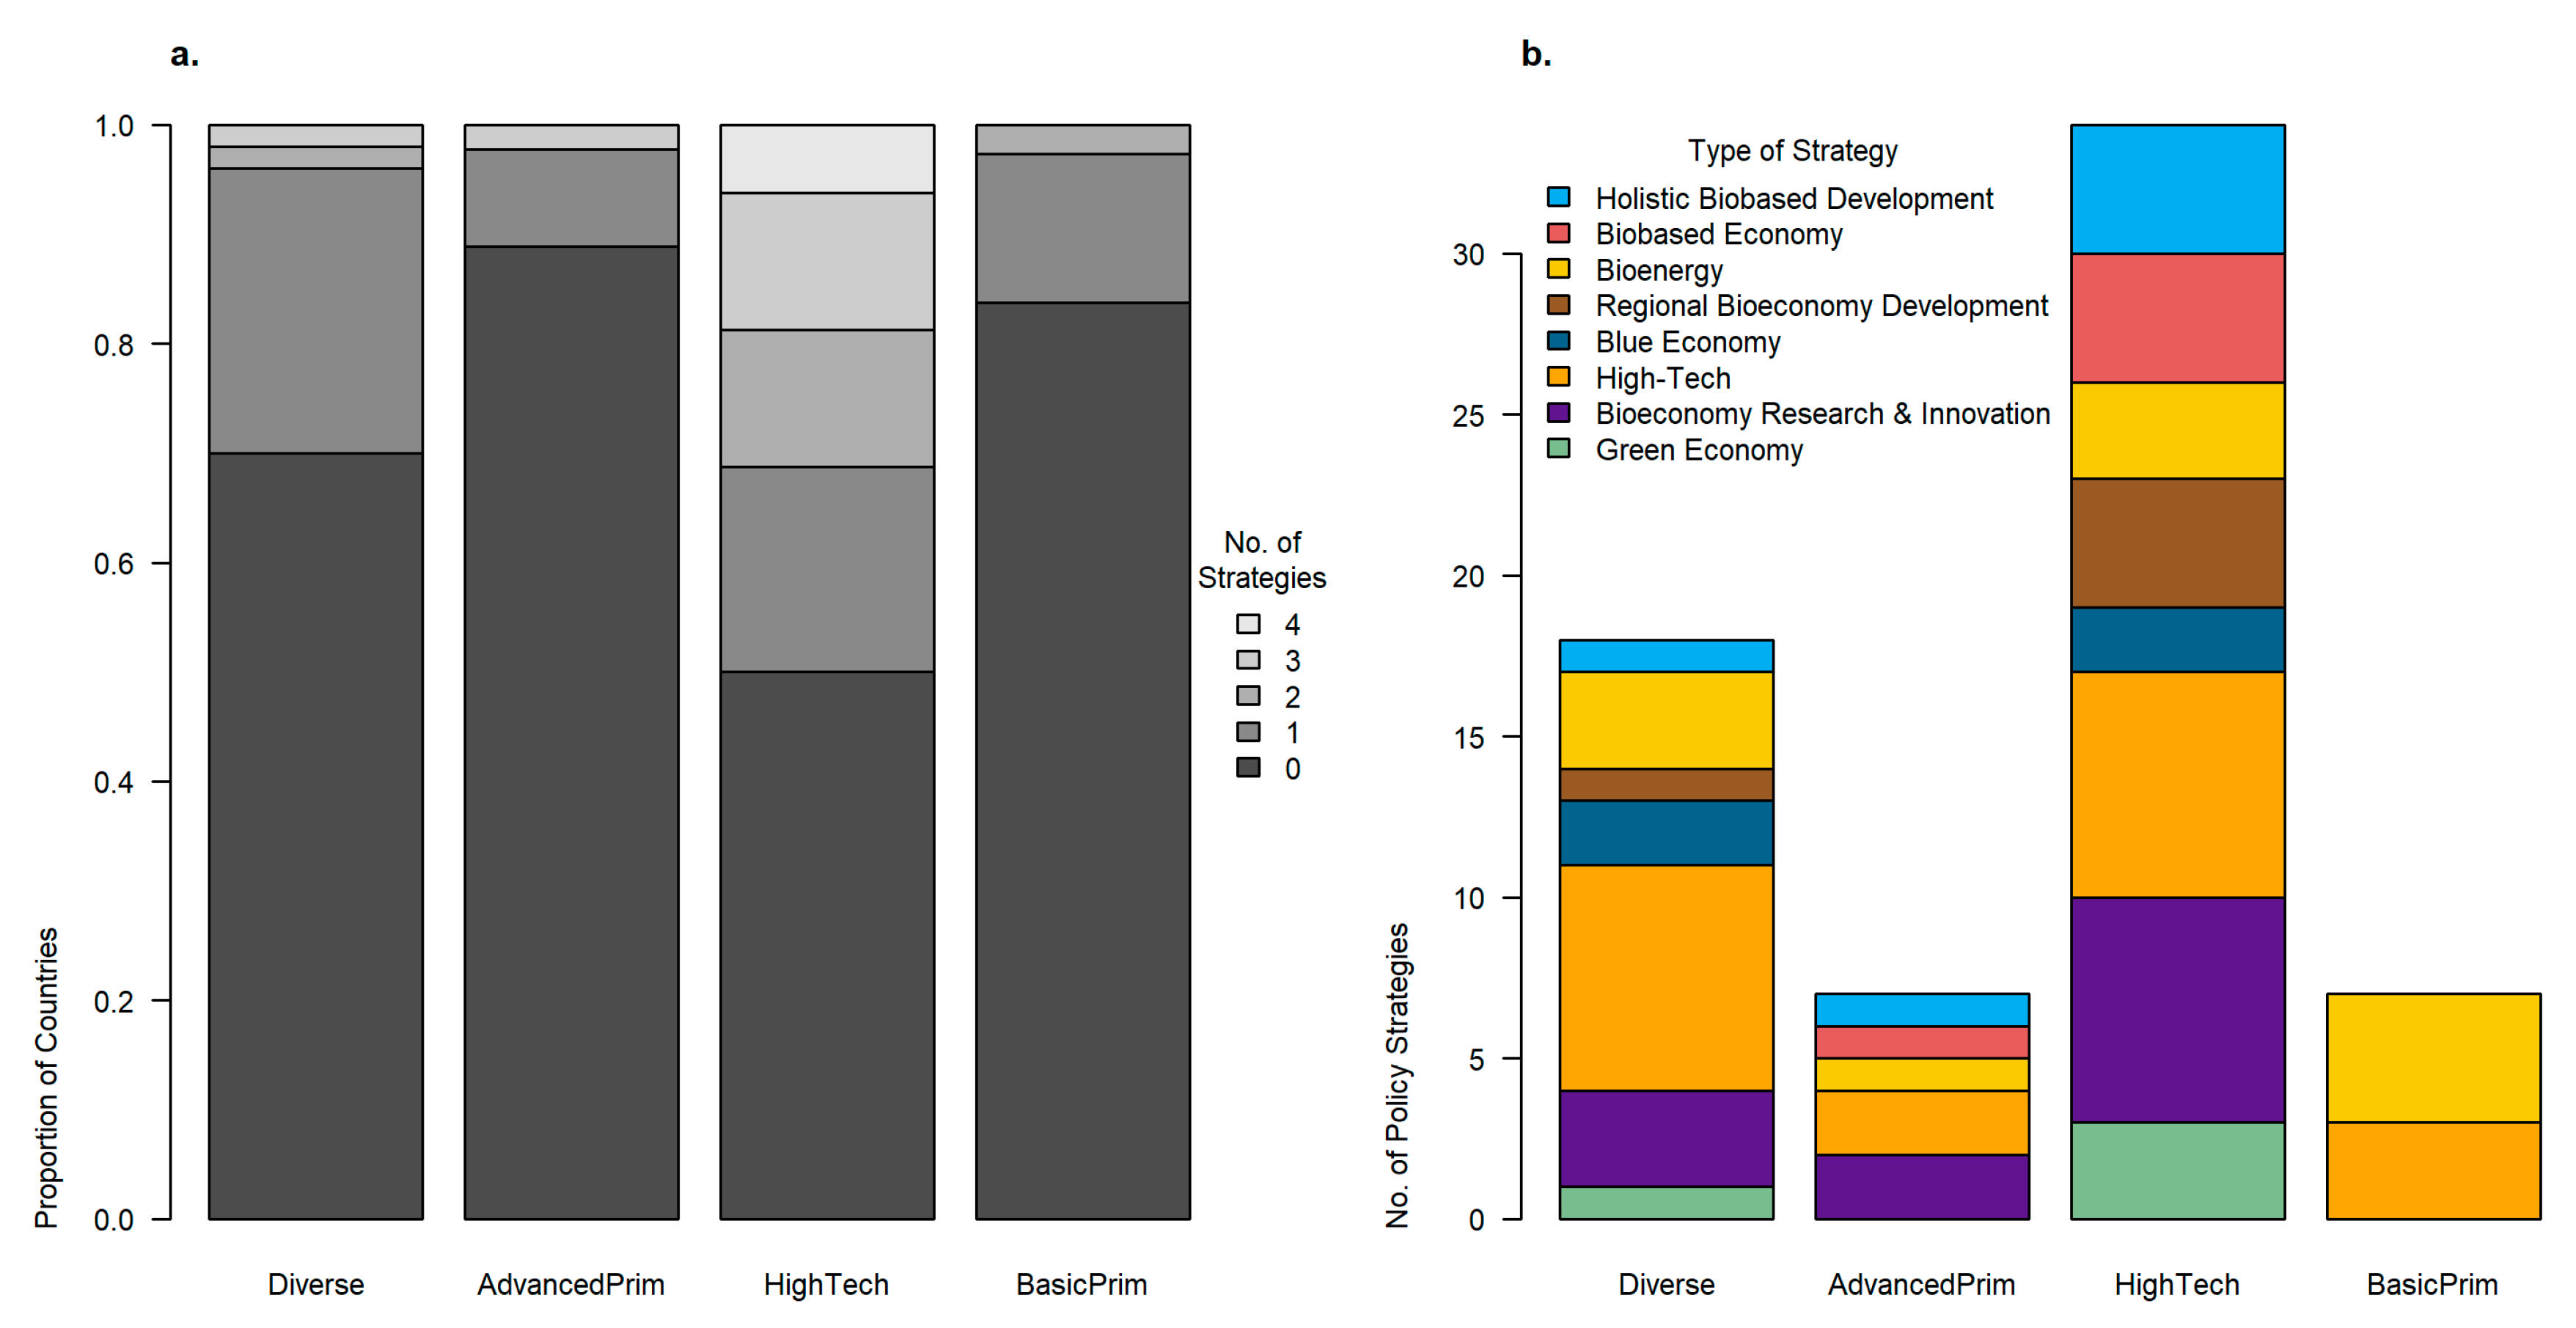
As expected, we found that existing national bio-economy strategies can be plausibly mapped to our typology of bio-economies, although we also found some apparent contradictions (Figure 3). Countries with strong high-tech sectors (type HighTech) are also the countries with the highest number of bio-economy strategies. 50% of the countries of this type had at least one political strategy that could be considered as a bio-economy strategy, and 31% had even more than one strategy. For type HighTech countries, bio-economy strategies were not only the most abundant, but also the most diversified with all types of strategies being represented, but most within the field “Bio-economy Research & Innovation” (seven countries) and “High-Tech” (seven countries). Countries that relied the most on the primary sector (especially type BasicPrim and type AdvancedPrim) showed a much lower abundance of countries with at least one bio-economy strategy (12.5% and 19%). But while for BasicPrim these strategies mainly focused on “High-Tech” (three countries, despite the low importance of the high-tech sector) and “Bioenergy” (four countries), they did not have such a specific emphasis for the AdvancedPrim countries. The focus of BasicPrim countries on “High-Tech” exemplifies how political strategies do not necessarily reflect current conditions but may rather emphasize desirable development pathways, whereas a strong focus of the same type on “Bioenergy” might be the result of an increasing or anticipated competition for land between food and energy sectors. With 30% of countries from the cluster Diverse having at least one bio-economy strategy, they were not as abundant as for type HighTech, but still more frequent than for the BasicPrim and AdvancedPrim types. Strategies of this cluster focused mainly on “High-Tech” (seven countries), which indicates the desire of these countries to perpetuate the shift from a primary sector based economy to a high-tech economy.
3.3. Sustainability Performance of Bio-Economy Types
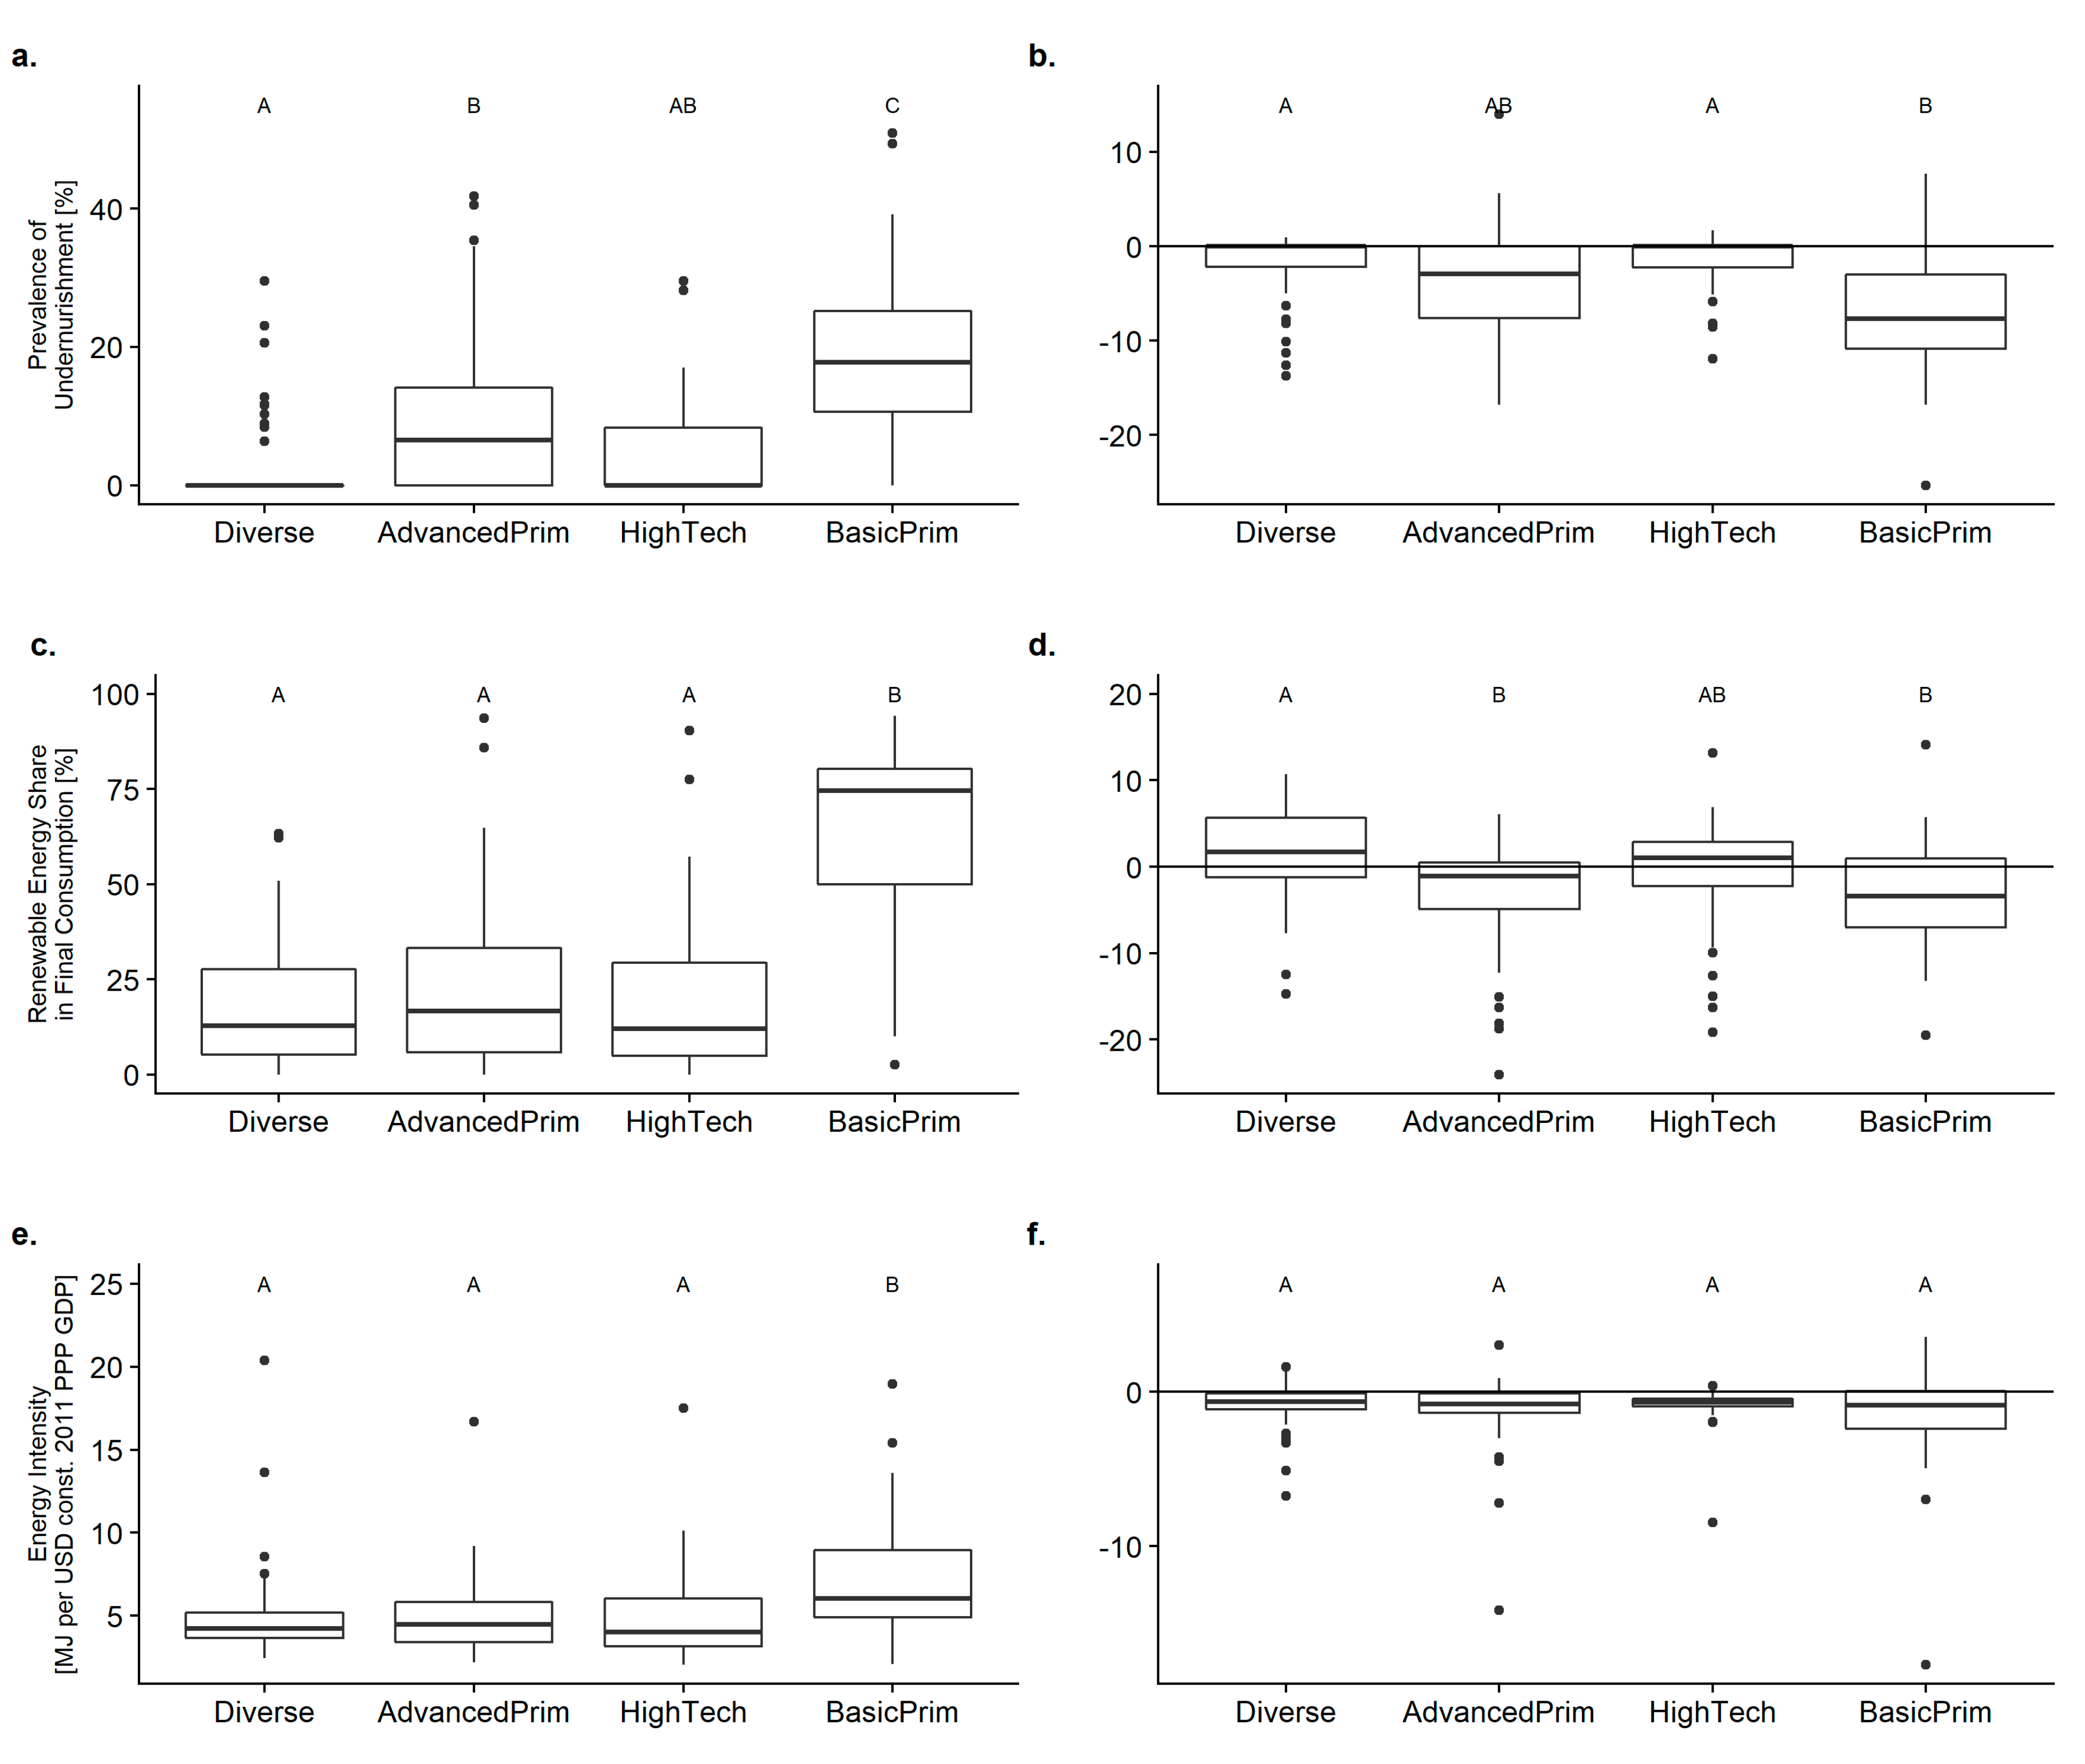
Results of sustainability evaluation showed partially significant differences between bio-economy types. However, all results should be interpreted with caution, as only part of the sustainability performance can be attributed to the bio-economy developments. This is not a cross-sectional study and therefore informational value about cause-effect relationships is only limited. In terms of prevalence of undernourishment, HighTech and Diverse countries had the lowest recorded rates of undernourishment (Figure 4a). BasicPrim countries showed the highest prevalence of undernourishment. For all bio-economy types, we found that undernourishment has been decreasing, indicating that hunger has been reduced globally, independently of the type of bio-economy in place (Figure 4b). However, the reduction was significantly larger in BasicPrim countries.
In terms of the renewable energy share, we found that countries of BasicPrim had the highest shares of renewable energy, significantly higher than all other types (Figure 4c). While for AdvancedPrim, and BasicPrim countries, where the share of renewable energy was decreasing, a substantial increase was found for most Diverse and HighTech countries (Figure 4d). This indicates countries especially in the global South that rely heavily on wood as an energy source are shifting away from renewable energy sources, while countries that currently rely mainly on nuclear and fossil energy sources are increasingly using renewables. Energy intensity was highest for countries of type BasicPrim (Figure 4e), and has been decreasing for all bio-economy types without any significant differences between them (Figure 4f).
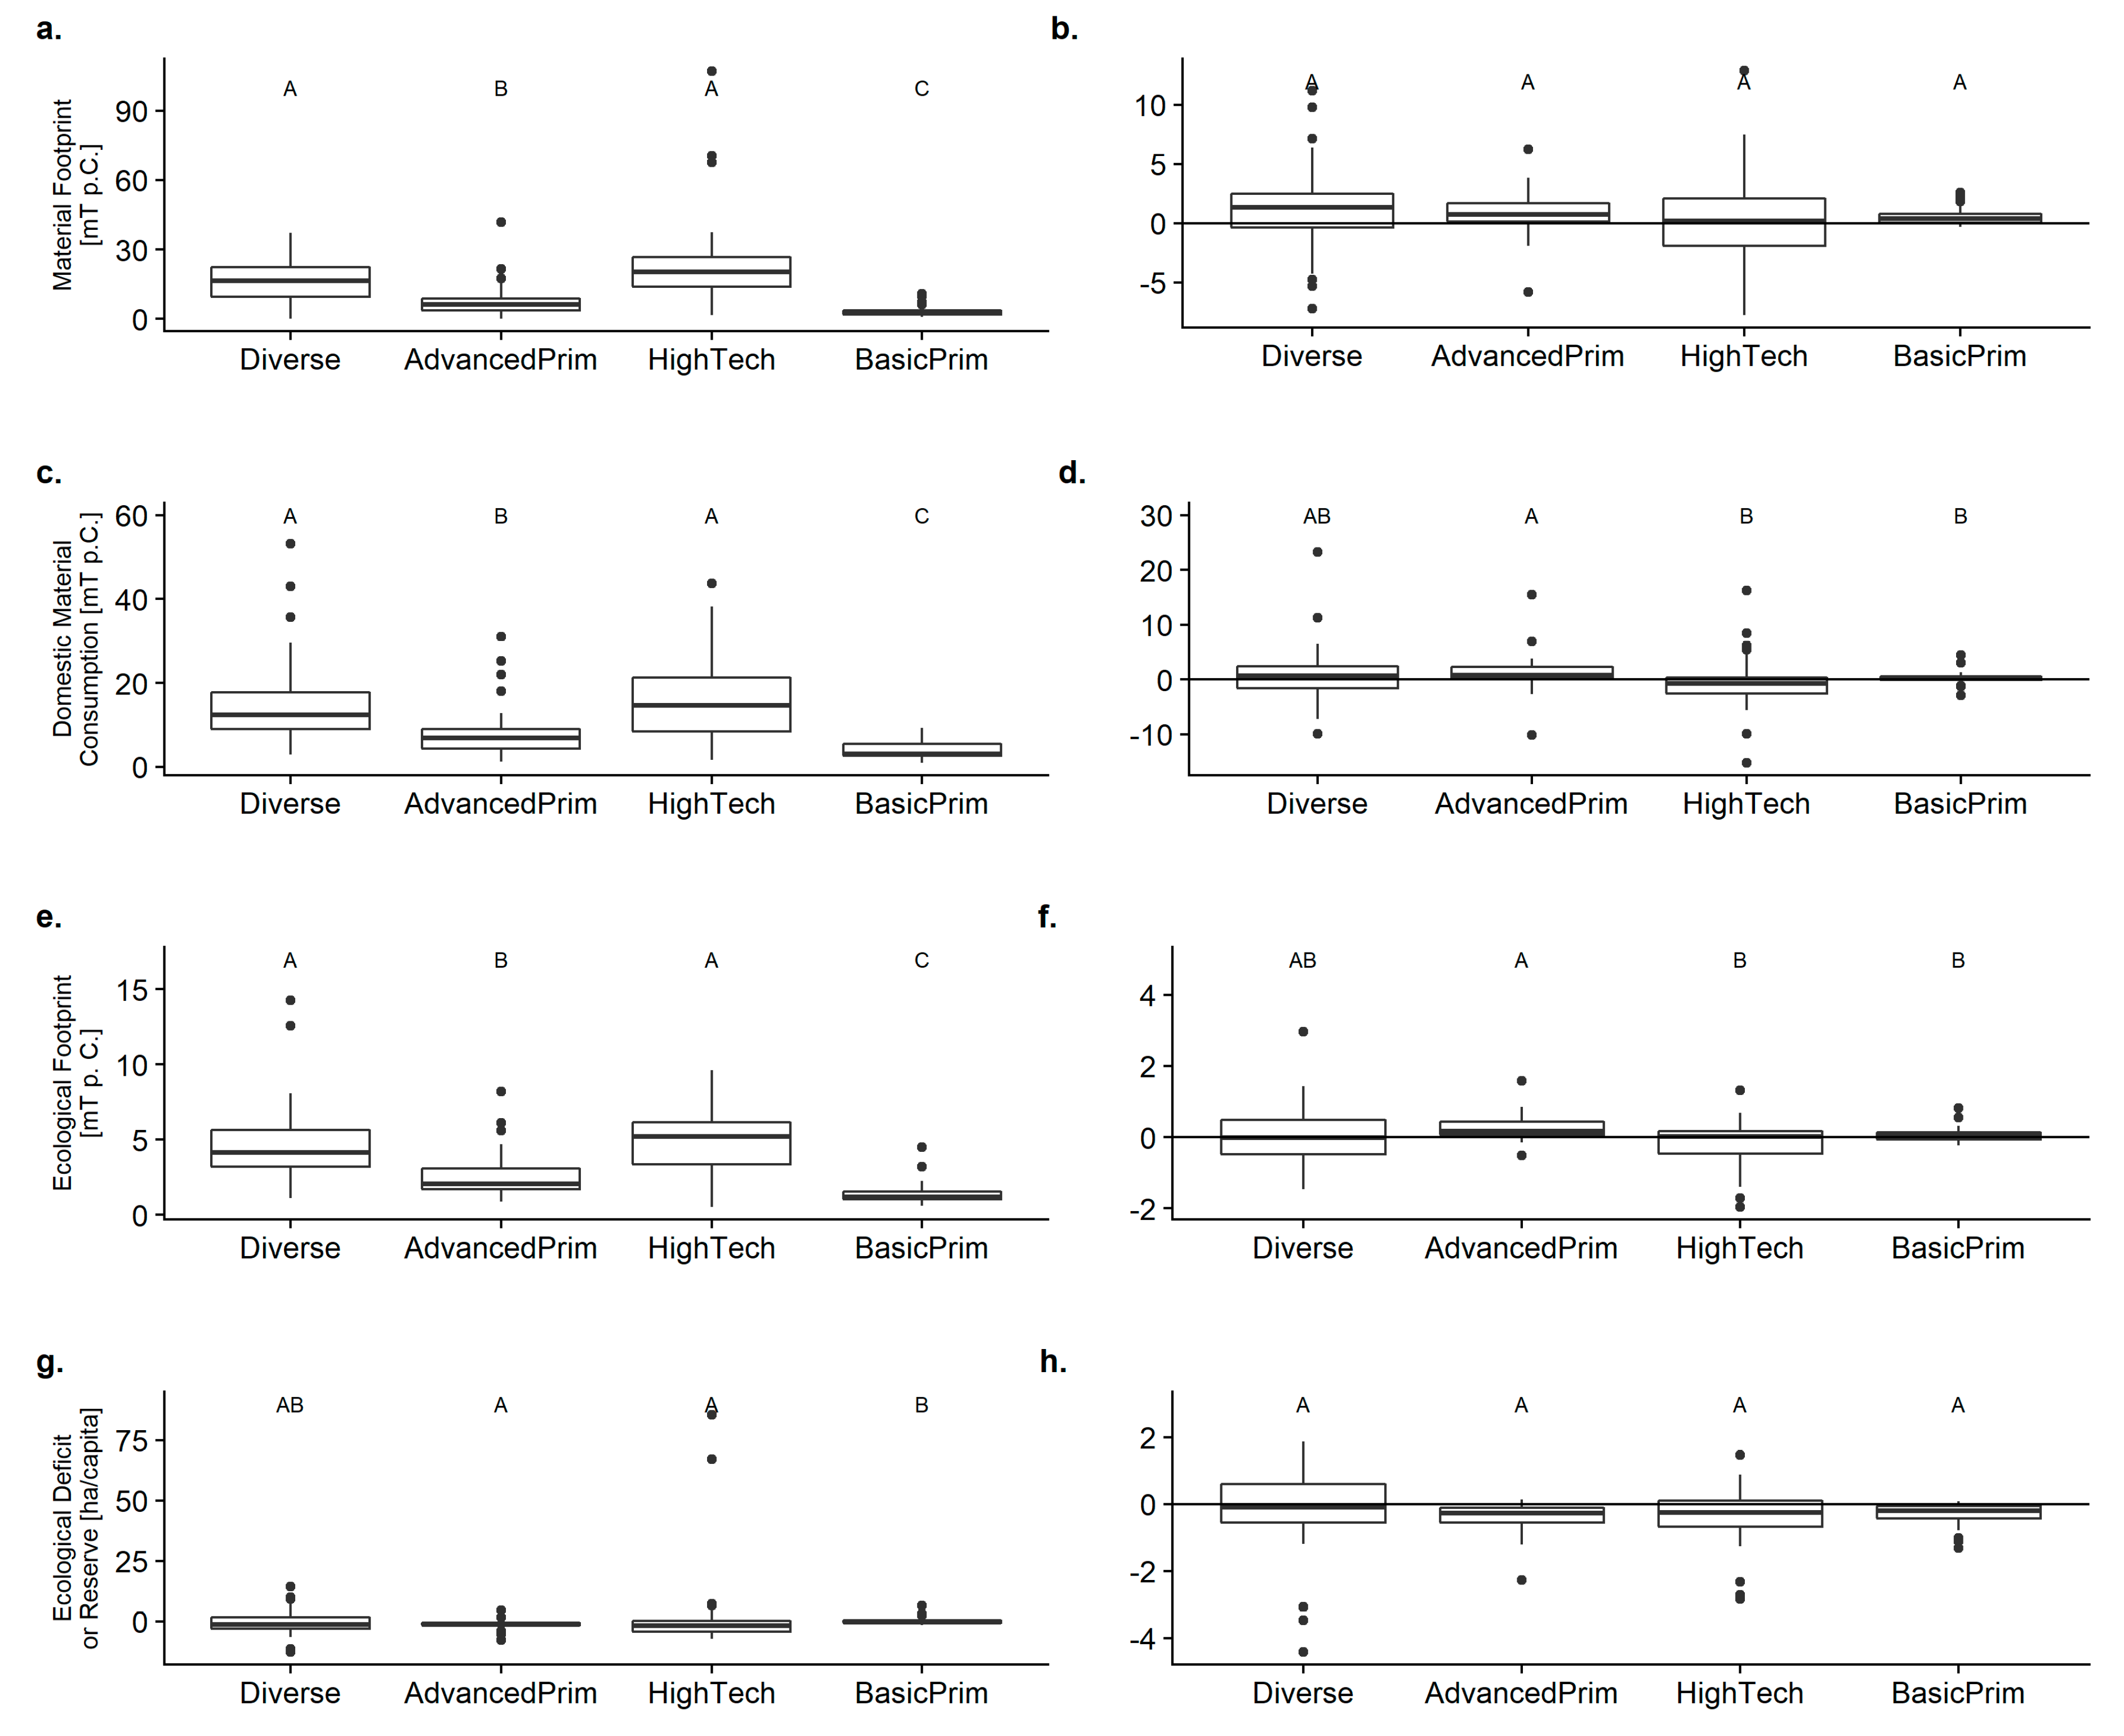
The material footprints were highest for countries of type HighTech and Diverse, and lowest for type BasicPrim countries (Figure 5a). Although all bio-economy types increased their material footprint (especially types Diverse and AdvancedPrim), some countries of type HighTech showed decreasing trends, which were however, not significantly different from the other types (Figure 5b). A similar pattern was found when evaluating the current domestic material consumption and the ecological footprint (Figure 5c,e). For domestic consumption, we found that besides HighTech countries, a number of countries from type Diverse also showed decreasing trends (Figure 5d,f). Overall, the analysis revealed that those countries with the highest national footprints (type HighTech and Diverse) were also the only ones showing some reductions of their footprint. Although all other bio-economy types increased their footprint, countries of type BasicPrim only increased their footprints a little during the last several years. This indicates that the overall global footprint increase did not benefit the poorest countries, but especially benefitted transitioning countries.
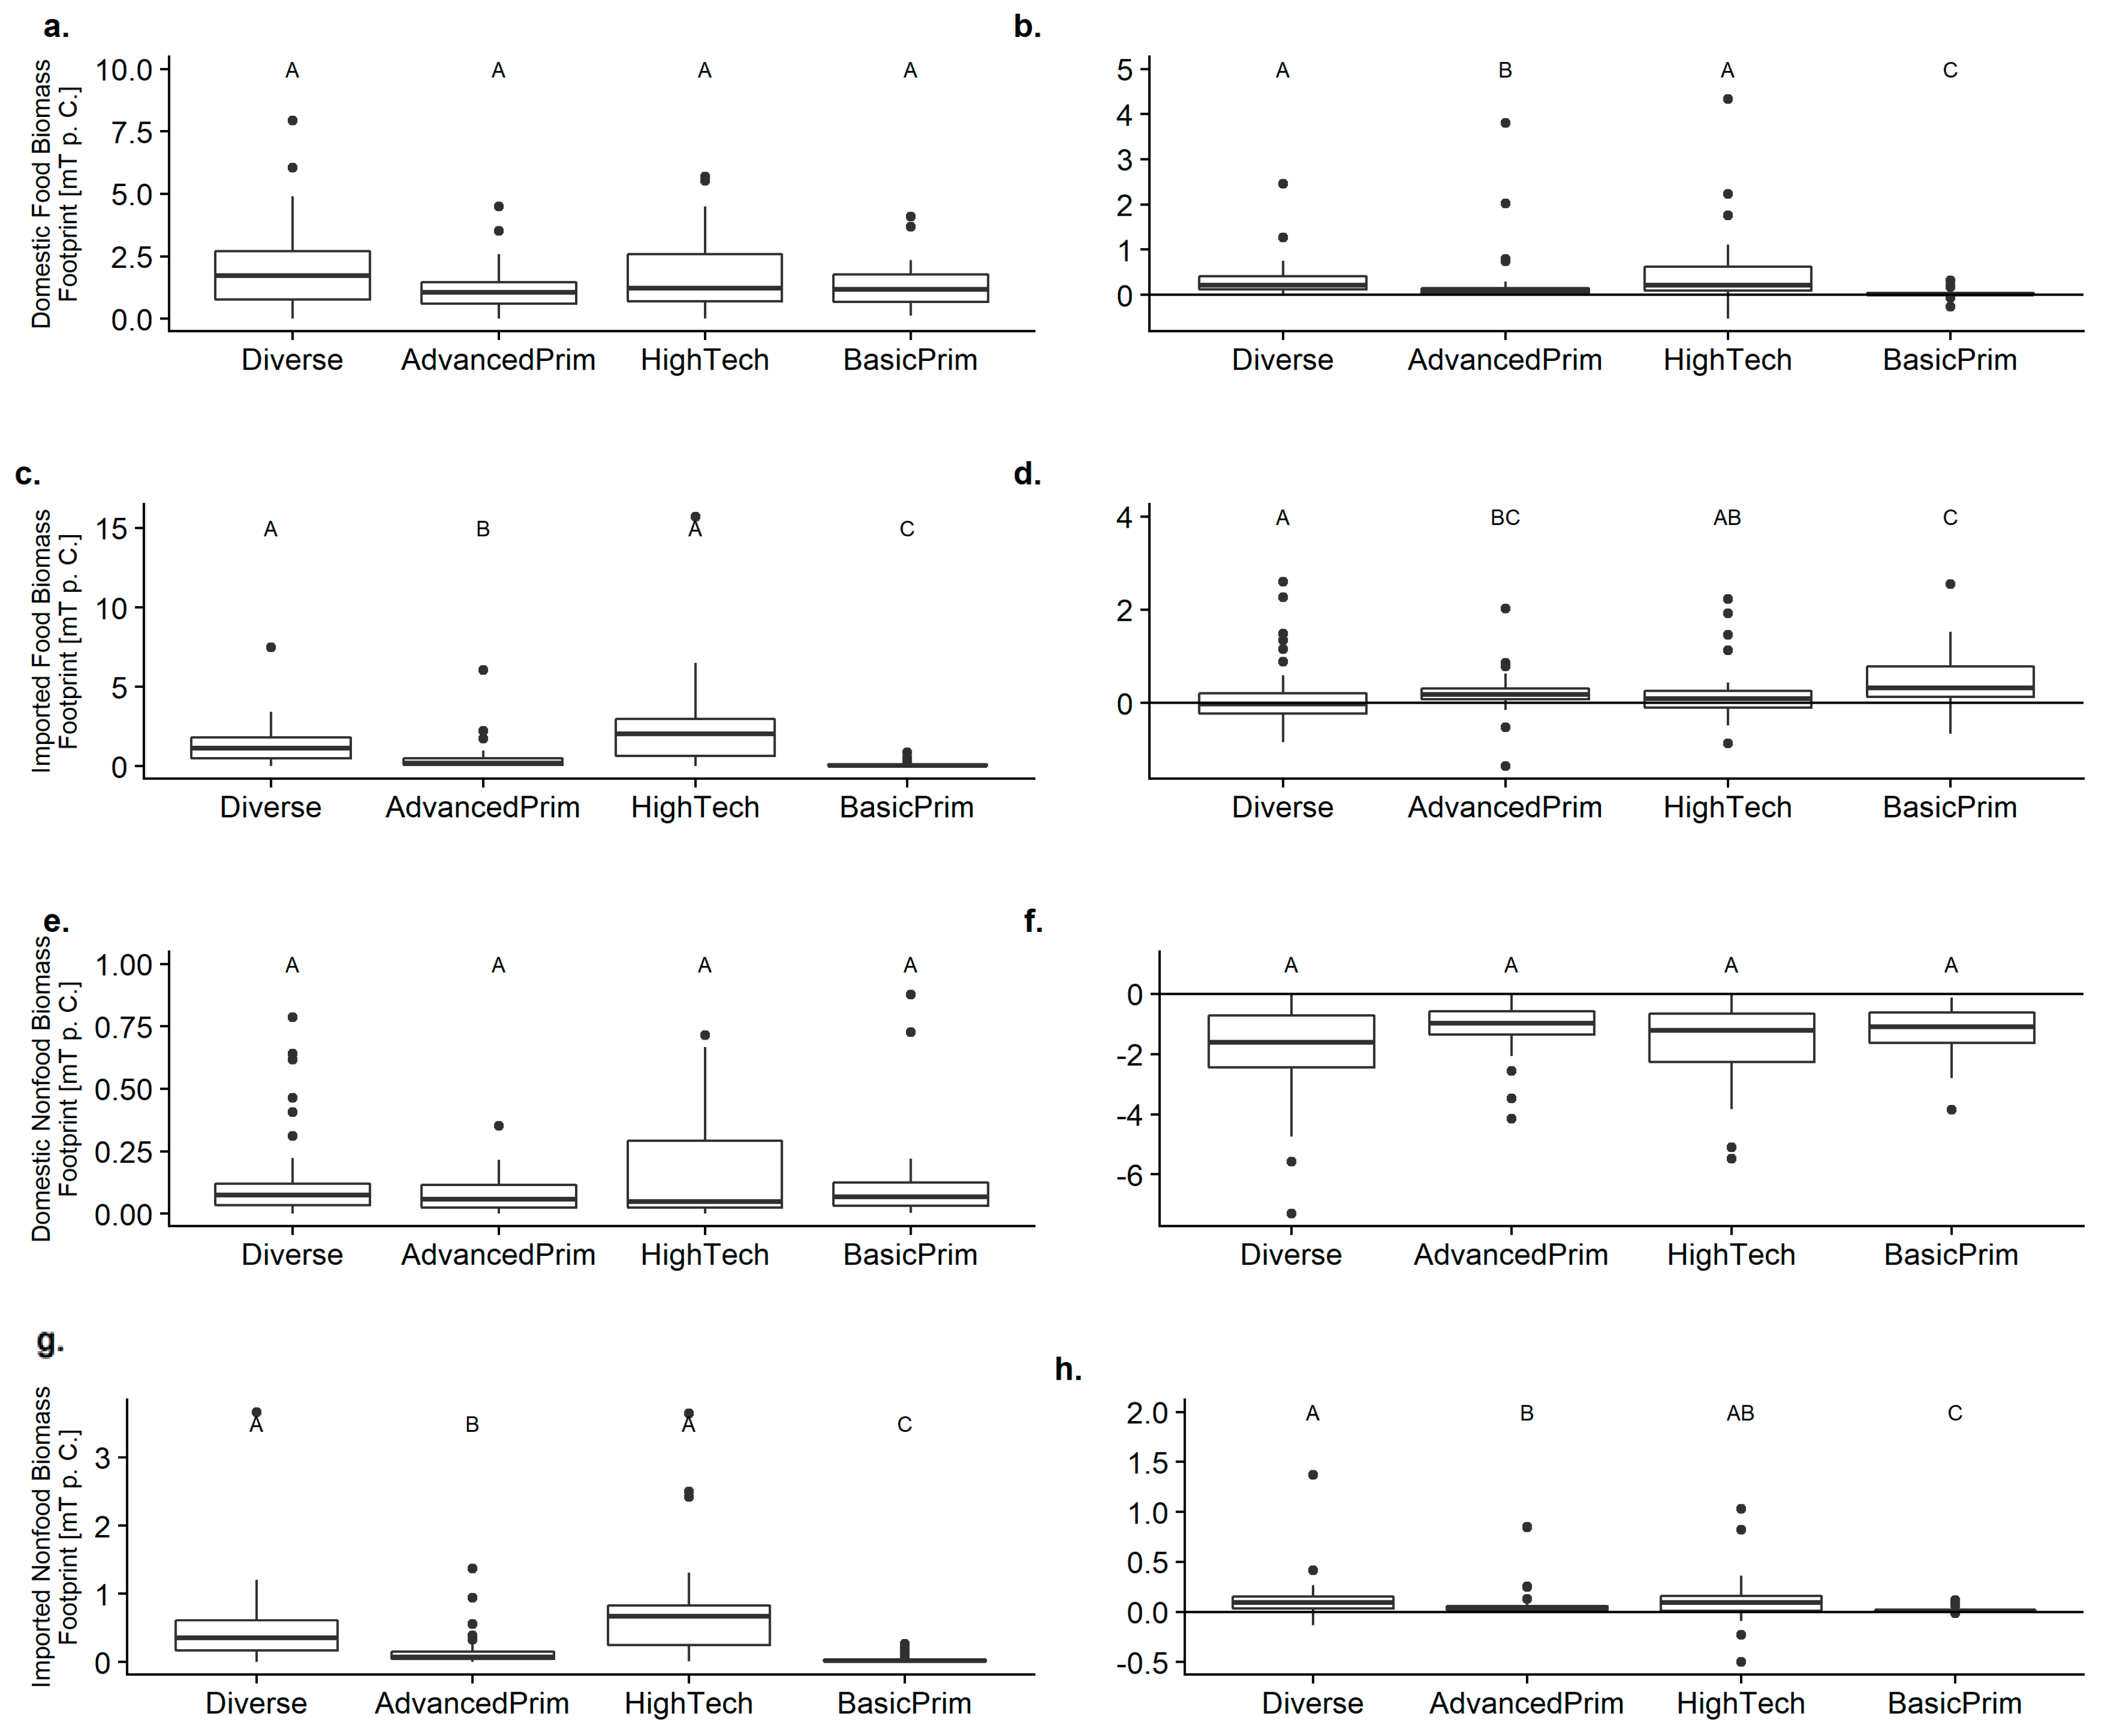
The domestic biomass footprint for food purposes was highest for HighTech and Diverse countries, but showed no significant differences for all types (Figure 6a). However, for HighTech and Diverse types, it increased significantly more than for the other types (Figure 6b). Imported food biomass was significantly higher for HighTech and Diverse countries, and significantly lower for BasicPrim countries than for all other bio-economy types (Figure 6c). While some Diverse countries managed to decrease their domestic biomass footprints, all other types, especially BasicPrim countries, increased it (Figure 6d). The domestic biomass footprints for non-food purposes was also similar for all types (Figure 6e), and all types also decreased their footprint within a similar range (Figure 6f). The footprint due to imported biomass for non-food purposes was significantly higher for HighTech and Diverse countries than for all other types (Figure 6g), which also showed the highest increase (Figure 6h). Countries of type BasicPrim had the significantly lowest imported biomass footprint for non-food purposes (Figure 6g) with hardly any increasing trend (Figure 6h).
Overall we found type HighTech and Diverse having similar domestic biomass footprints as all other types (Figure 6a,e, food and non-food) with increasing trends for food (Figure 6b), while domestic biomass extraction for non-food purposes remained more or less stable (Figure 6f). Imported biomass footprints were highest for HighTech and Diverse countries for food as well as non-food purposes (Figure 6c,g), but while their imported biomass footprint for food remained more or less the same (Figure 6d), they increased it for non-food purposes (Figure 6h). Countries more reliant on the primary sector (AdvancedPrim and BasicPrim) showed a very moderate or no change in their domestic as well as imported biomass footprints for non-food purposes. BasicPrim countries showed an increasing trend for imported food biomass only for food purposes. However, while their current domestic biomass footprints are on a similar level as for the other types (Figure 6a,e), their imported biomass footprints remain significantly smaller than for all other types (Figure 6c,g).
4. Discussion
In this study, we developed a global typology of bio-economies and tested if and how the resulting clusters differed from each other. We evaluated how these bio-economy types correspond to the foci of different bio-economy policy strategies and evaluated their sustainability performance using different sustainability indicators. Our results revealed four different bio-economy types which we named according to their characteristics, Diversified bio-economies (Diverse), Advanced primary sector bio-economies (AdvancedPrim), High-tech bio-economies (HighTech), and Basic primary sector bio-economies (BasicPrim).
Overall, the relative economic importance of the high-tech sector seems to be associated with the availability of skilled labor while the relative importance of the primary sector is not determined by the availability of bioproductive land. In fact, we tended to find high primary sector importance to be associated with a low availability of skilled workers. This indicates that for important high-tech bio-economies, the availability of skilled labor is a constraining factor, while the availability of bioproductive land is not of importance for a primary sector-based economy.
However, the economic importance of a sector for one country does not imply that the sector itself generates sufficient revenues or employment and education opportunities for the local population. The results simply suggest that agriculture plays an important economic role in most developing and many transitioning countries regardless of biomass availability, while the high-tech sector does not. However, based on these results it is not possible to compare the productivity or profitability of the agricultural sector between countries, nor is it possible to make any assumption about the ability of the sector to generate economic growth, or whether it can provide sufficient income or decent work to marginalized communities.
In the following, we outline potential implications of our results and discuss them in the context of other studies. Cereal production worldwide has doubled between 1960 and 2000, mainly fueled by innovations and larger inputs of water, pesticides and fertilizer [57]. But while food production in Asia and South America tripled (from one to three tons per ha) in a span of 40 years, the production across Africa remained almost constant at 1 ton per ha [58]. However, the majority of countries with the most important agricultural sector (type BasicPrim) are located in Africa, especially sub-Saharan Africa (SSA). Although these countries have managed to decrease their overall level of undernourishment during the past 17 years, they remain the countries with the highest levels of undernourishment.
Diverse countries, which are mainly located in South-America, Western Europe and South-East Asia, coincide with those countries having gone through a process of enormous agricultural intensification. In these regions, we find higher skill availability and better socio-political conditions than in type AdvancedPrim and BasicPrim countries. Substantial increases in food production, however, also had negative consequences for many countries, including land degradation, deforestation, and unsecure land use rights of local societies [57]. Based on these findings, we would argue that agricultural productivity needs to be increased and that bio-economic innovations might have the potential to do so. But at the same time, long-term sustainable bio-economic growth requires a formalized and intensive evaluation of the benefits and risks of any bio-economic innovation and policy implementation.
Increasing yields and scarcity of fossil fuels, combined with a rising awareness of the potential hazards from nuclear energy, have also resulted in the policy-supported growing use of renewable energy, especially bioenergy, in Diverse and HighTech countries. Due to the limited availability of bioproductive land, this policy had serious leakage effects all over the world, adding to the so-called food-energy-environment trilemma [59,60]. Accordingly, we found the highest and increasing imported biomass footprints for non-food purposes for these types. At the same time, we recorded an increasing trend of imported food biomass especially for countries of type BasicPrim. This trade-off and increasing pressure on food resources and the environment is also reflected by the distribution of bioenergy relevant policies, which can especially be found in countries with an important primary sector of type BasicPrim. Although these countries may not represent important global players for biofuels trade, the importance of the primary sector combined with biomass scarcity and food insecurity constitute a situation where the competition between food and energy for land becomes more pronounced than in other countries.
Increased competition between food, energy, and the environment can push innovations for more efficient use of land, biomass and other resources [61,62] but it can also increase imports of biomass, especially primary raw materials with the associated externalization effects of environmental costs [63]. This scenario is likely to take place in the more developed countries of type HighTech and Diverse, which tend to have better socio-economic conditions and higher skill availability to support these pathways. In less developed countries, especially those of type BasicPrim, increased competition is more likely to threaten food safety and natural ecosystems due to the lack of efficient policy instruments, the unequal distribution of resources including land, and the redistribution of land-use rights as a consequence of land-grabbing [61,64].
Economic sectors focusing on high-tech and high-value products are usually more knowledge-intensive but less resource-intensive, and require trained and specialized personnel. This phenomenon, is also true for the bio-economy high-tech sectors including biotechnology, biopharmaceuticals and others. It has often been argued that bio-economy offers the possibility of sustainable economic growth, especially for developing countries [14,15,16] and accordingly, as our results show, many countries including those of type BasicPrim, Diverse, and HighTech have issued high-tech bio-economy strategies. At the moment, however, important high-tech sectors can mainly be found in countries of type HighTech and Diverse, but not in those of type BasicPrim. Although it is not possible for us to draw conclusions about causal relationships, as this is a cross-sectoral study, in contrast to the primary sector, specific conditions seem to facilitate the growth of the high-tech sector, particularly a high availability of skilled labor. This emphasizes the need for investments in education and research to overcome the barriers for knowledge-based bio-economy growth in poorer parts of the world [65].
However, despite recent trends to improve sustainability performance in terms of domestic material consumption, the ecological footprint and the import of biomass for food purposes, countries of type HighTech and Diverse remain to have the largest footprints per capita. Reductions in material and energy consumption in developing and even in transitioning countries are very unlikely simply because resource consumption is still on a much lower level than for the more developed countries. We do not deny that some technological innovations have led to increased resource efficiency, and would argue that at least some share of the recent sustainability gain of HighTech and Diverse countries can be attributed to the development and application of high-tech and knowledge-intensive innovations. This, however, puts the countries of type HighTech in a position of high responsibility for the transfer and distribution of these innovations and new governance and regulation mechanisms might be necessary to support and facilitate this [66]. Furthermore, we highlight the parallel leakage effects that we recorded, in terms of increased biomass imports for nonfood purposes by HighTech and Diverse countries, accompanied by increased food imports by other types, especially BasicPrim.
The typology as well as the evaluation of the types’ sustainability can only serve as an indication of certain sustainability trends. The limited availability and accessibility of national economic, social, and environmental data, many of which did not specifically measure particular aspects of bio-economy, resulted in a relatively rough classification of all countries of the world. Of course, not all countries within one type are equal, and values for many of the considered variables may vary considerably within types. This is also reflected by the varying degree of uncertainty when countries were assigned to one specific type (supporting Figure S1 and Table S1). We do, however, argue that the types represent crude categories of bio-economy pathways and that these types are therefore helpful to identify major trends and tendencies of bio-economy development, and to assess interdependencies while taking contextual factors into account. In terms of the sustainability evaluation, we also acknowledge the limitation that only part of the sustainability performance can be attributed to the development of the bio-economy. In some countries, where the bio-economy does not play a major role, this influence might approach even zero. However, for countries with very pronounced bio-economy sectors, we would argue that at least part of the sustainability performance is entangled with the bio-economy pathway. Sustainability evaluation approaches, particularly those focused on national policies, suffer from high uncertainties due to complex socio-ecological and socio-economic system interactions. Assessment methods for the sustainability of policies include for example the use of indicators and composite indices [67] as well as more integrated system assessments such as multi-criteria analysis, risk and vulnerability analysis or cost benefit analyses [68] with varying characteristics in terms of integration of system complexities (natural, social and economic system), temporal dimensions (ex-post vs. ex-ante) as well as spatial coverage (national vs. global) (compare with [68]). We chose a selection of indicators from different sources, including the SDG database [69] as well as different footprint indicators [33]. An exclusive focus on sustainability indicators from the SDG database would have been insufficient to account for planetary boundaries [2], while overemphasizing gains in resource efficiency instead of total consumption [69]. Interestingly, bio-economy policy strategies do not completely mirror the importance of the different sectors. While strategies of countries of type HighTech (with a high importance of the high-tech sector and high skill availability) showed the highest degree of diversification, countries of type BasicPrim (high importance of primary sector, low skill and biomass availability) show mostly a combination of strategies centering on either bioenergy or high-tech. While the focus on bionenergy is likely to be linked to actually increasing bioenergy production and growing competition for biomass between food and land, high-tech strategies might reflect preferences and strategic considerations for a transformation towards a new diversified bio-economy, but do not necessarily reflect current conditions on the ground.
The abundance of bio-economy high-tech strategies also in countries of type Diverse and the results of this studies show the importance of the availability of skilled labor to develop a knowledge-based bio-economy. This indicates, on the one hand, the need for investments for research and development, and on the other hand, supports the claim by Bauer et al. [70] that strategies on how to facilitate the engagement of small and medium-sized enterprises are currently lacking. According to the authors, recent bio-economy developments have been promoted by legislations and regulations focusing on bioenergy and biofuels, while incentives for commercial investments in non-energy biorefineries would be necessary to establish markets of these products. Furthermore, efforts in science, society, and policy to develop successful innovations and evaluate their sustainability should include distribution and transfer mechanisms to enable also poor countries to benefit from them and embark on a path of sustainability [6]. More developed countries have to acknowledge that despite their efforts to reduce the negative impacts of their economies and high consumption levels mainly through technological fixes, they continue to have the highest per-capita footprints. This level of material consumption secured by imports of agricultural, forestry, and mining commodities is leading to the externalization of environmental costs to the producing or sourcing countries [71]. An unlikely shift of developing countries away from export-oriented agricultural and forestry production and towards knowledge-intensive high-tech industries might compromise the sustainability performance of more developed countries and confront the Western Hemisphere with an increased demand on domestically available resources. Suggested sustainability indicators in the context of the SDGs are currently not sufficient to reflect the complex picture, including externalization of environmental costs and spill-over effects from national policies, and associated resource consumption trends (compare with [69]). Sustainability evaluations have to consider global environmental costs and complex interactions between bio-economy development paths, as well as international and trade dependencies.
5. Concluding Remarks
Our results highlight the potential as well as the challenges of new biotechnological developments and innovations, which are likely to trigger new material flows and processing technologies. However, a simple shift from fossil resources to renewable material and energy resources will not improve sustainability, and will increase pressures on ecosystems. New innovations from high-tech bio-economies have increased their resource efficiency, but overall, these countries continue to have the highest levels of resource consumption. The development of innovations puts them in a position of high responsibility for knowledge transfer and sustainability evaluation. True sustainable development requires a critical assessment of the risks of these innovations and developments, as well as innovation transfer and public investments, especially in developing countries.
Supplementary Materials
The following are available online at https://0-www-mdpi-com.brum.beds.ac.uk/2071-1050/10/8/2705/s1, Figure S1: Uncertainty of cluster-based bio-economy typology with countries belonging to the same cluster being displayed in the same color. Table S1: Probabilities for countries to belong to a specific type and uncertainty for belonging to the assigned type.
Author Contributions
Conceptualization L.B.-F. and J.B.; Methodology, L.B.-F. and M.B.; Formal Analysis, L.B.-F., A.K.B. and M.B.; Data Curation, A.K.B.; Writing—Original Draft Preparation, L.B.-F and J.B.; Writing—Review & Editing, L.B.-F., J.B., M.B. and A.K.B.
Funding
This research has been funded by the German Federal Ministry of Education and Research within the project STRIVE (Sustainable Trade and Innovation Transfer in the Bioeconomy, see www.strive bioecon.de).
Acknowledgments
We would like to thank the valuable input of our STRIVE team members and the Bioeconomy Council for the provisioning of the bio-economy policy strategy classification. We extend our gratitude to James Bruce Henderson for language editing and proof reading the final manuscript.
Conflicts of Interest
The authors declare no conflict of interest.
References
- Shafiee, S.; Topal, E. When will fossil fuel reserves be diminished? Energy Policy 2009, 37, 181–189. [Google Scholar] [CrossRef]
- Rockström, J.; Steffen, W.; Noone, K.; Persson, A.; Chapin, F.S.; Lambin, E.F.; Lenton, T.M.; Scheffer, M.; Folke, C.; Schellnhuber, H.J.; et al. A safe operating space for humanity. Nature 2009, 461, 472–475. [Google Scholar] [CrossRef] [PubMed] [Green Version]
- Staffas, L.; McCormick, K.; Gustavsson, M. A Global Overview of Bio-Economy Strategies and Visions; Swedish Knowledge Centre for Renewable Transportation Fuels (f3 Centre): Göteborg, Sweden, 2013. [Google Scholar]
- Fund, C.; El-Chichakli, B.; Patermann, C.; Dieckhoff, P. Bioeconomy Policy (Part II): Synopsis of National Strategies around the World; German Bioeconomy Council: Berlin, Germany, 2015. [Google Scholar]
- Staffas, L.; Gustavsson, M.; McCormick, K. Strategies and Policies for the Bioeconomy and Bio-Based Economy: An Analysis of Official National Approaches. Sustainability 2013, 5, 2751–2769. [Google Scholar] [CrossRef] [Green Version]
- Golembiewski, B.; Sick, N.; Bröring, S. The emerging research landscape on bioeconomy: What has been done so far and what is essential from a technology and innovation management perspective? Innov. Food Sci. Emerg. Technol. 2015, 29, 308–317. [Google Scholar] [CrossRef]
- Birner, R. Bioeconomy Concepts. In Bioeconomy: Shaping the Transition to a Sustainable, Biobased Economy; Lewandowski, I., Ed.; Springer International Publishing: Cham, Switzerland, 2018; pp. 17–38. [Google Scholar]
- Birch, K. The knowledge-space dynamic in the UK bioeconomy. Area 2009, 41, 273–284. [Google Scholar] [CrossRef]
- Coleman, M.; Stanturf, J. Biomass feedstock production systems: Economic and environmental benefits. Biomass Bioenergy 2006, 30, 693–695. [Google Scholar] [CrossRef]
- McCormick, K.; Kautto, N. The Bioeconomy in Europe: An Overview. Sustainability 2013, 5, 2589–2608. [Google Scholar] [CrossRef] [Green Version]
- Bugge, M.; Hansen, T.; Klitkou, A. What Is the Bioeconomy? A Review of the Literature. Sustainability 2016, 8, 691. [Google Scholar] [CrossRef]
- Hausknost, D.; Schriefl, E.; Lauk, C.; Kalt, G. A Transition to Which Bioeconomy?: An Exploration of Diverging Techno-Political Choices. Sustainability 2017, 9, 669. [Google Scholar] [CrossRef]
- Goven, J.; Pavone, V. The Bioeconomy as Political Project. Sci. Technol. Hum. Values 2015, 40, 302–337. [Google Scholar] [CrossRef]
- Komen, J. Africa Rising to a sustainable future: Economic prospects of bio-economy development in eastern Africa. In Fostering a Bio-Economy in Eastern Africa: Insights from Bio-Innovate; Liavoga, A., Virgin, I., Ecuru, J., Morris, J., Komen, J., Eds.; ILRI: Nairobi, Kenya, 2016; pp. 12–22. [Google Scholar]
- Virchow, D.; Beuchelt, T.D.; Kuhn, A.; Denich, M. Biomass-Based Value Webs: A Novel Perspective for Emerging Bioeconomies in Sub-Saharan Africa. In Technological and Institutional Innovations for Marginalized Smallholders in Agricultural Development, 1st ed.; Gatzweiler, F.W., Ed.; Springer International Publishing: Charm, Switzerland, 2016; pp. 225–238. [Google Scholar] [Green Version]
- D´Hondt, K.; Jiménez-Sánchez, G.; Philip, J. Reconciling Food and Industrial Needs for an Asian Bioeconomy: The Enabling Power of Genomics and Biotechnology. Asian Biotechnol. Dev. Rev. 2015, 17, 85–130. [Google Scholar]
- Kröber, B.; Potthast, T. Bioeconomy and the future of food—Ethical questions. In Know Your Food; Dumitras, D.E., Jitea, I.M., Aerts, S., Eds.; Wageningen Academic Publishers: Wageningen, The Netherlands, 2015; pp. 366–371. [Google Scholar]
- Meyer, R. Bioeconomy Strategies: Contexts, Visions, Guiding Implementation Principles and Resulting Debates. Sustainability 2017, 9, 1031. [Google Scholar] [CrossRef]
- Bracco, S.; Calicioglu, O.; Gomez San Juan, M.; Flammini, A. Assessing the Contribution of Bioeconomy to the Total Economy: A Review of National Frameworks. Sustainability 2018, 10, 1698. [Google Scholar] [CrossRef]
- Dubois, O.; Gomez San Juan, M. How Sustainability Is Addressed in Official Bioeconomy Strategies at International, National, and Regional Levels: An Overview; Food and Agriculture Organization of United Nations (FAO): Rome, Italy, 2016. [Google Scholar]
- Philippidis, G.; Sanjuán, A.I.; Ferrari, E.; M’barek, R. Employing social accounting matrix multipliers to profile the bioeconomy in the EU member states: is there a structural pattern? Span. J. Agric. Res. 2014, 12, 913–926. [Google Scholar] [CrossRef]
- Ronzon, T.; Piotrowski, S.; M’Barek, R.; Carus, M. A systematic approach to understanding and quantifying the EU’s bioeconomy. Bio-Based Appl. Econ. 2017, 6, 1–17. [Google Scholar] [CrossRef]
- Kircher, M. The transition to a bio-economy: National perspectives. Biofuels Bioprod. Bioref. 2012, 6, 240–245. [Google Scholar] [CrossRef]
- Mungaray-Moctezuma, A.B.; Perez-Nunez, S.M.; Lopez-Leyva, S. Knowledge-Based Economy in Argentina, Costa Rica and Mexico: A Comparative Analysis from the Bio-Economy Perspective. Manag. Dyn. Knowl. Econ. 2015, 3, 213–236. [Google Scholar]
- World Bank. World Bank National Accounts Data, and OECD National Accounts Data Files. Available online: http://data.worldbank.org/indicator (accessed on 21 September 2017).
- ILO. Employment in Agriculture Male (% of Male Employment). Available online: http://data.worldbank.org/indicator/SL.AGR.EMPL.MA.ZS (accessed on 21 September 2017).
- ILO. Employment in Agriculture Female (% of Female Employment). Available online: http://data.worldbank.org/indicator/SL.AGR.EMPL.FE.ZS (accessed on 21 September 2017).
- FAO. Agricultural Land (% of Land Area). Available online: http://data.worldbank.org/indicator/AG.LND.AGRI.ZS (accessed on 21 September 2017).
- FAO. Forest Area (% of Land Area). Available online: http://data.worldbank.org/indicator/AG.LND.FRST.ZS (accessed on 21 September 2017).
- United Nations. High-Technology Exports (% of Manufactured Exports). Available online: http://data.worldbank.org/indicator/TX.VAL.TECH.MF.ZS (accessed on 25 September 2017).
- WIPO. Patent Applications, Residents. Available online: http://data.worldbank.org/indicator/IP.PAT.RESD (accessed on 24 March 2017).
- WIPO. Patent Applications, Nonresidents. Available online: http://data.worldbank.org/indicator/IP.PAT.NRES (accessed on 24 March 2017).
- Global Footprint Network. National Footprint Accounts. Available online: http://www.footprintnetwork.org/licenses/public-data-package-free-edition-copy/ (accessed on 27 September 2017).
- UNESCO. Gross Enrolment Ratio, Tertiary, Both Sexes (%). Available online: http://data.worldbank.org/indicator/SE.TER.ENRR (accessed on 27 September 2017).
- ILO. Employment by Education (Thousands). Available online: http://www.ilo.org/ilostat/faces/oracle/webcenter/portalapp/pagehierarchy/Page3.jspx?MBI_ID=11&_adf.ctrl-state=93dm34n70_4&_afrLoop=352234861741481#! (accessed on 27 September 2017).
- National Science Foundation, Science and Engineering Indicators. Scientific and Technical Journal Articles. Available online: http://data.worldbank.org/indicator/IP.JRN.ARTC.SC (accessed on 24 March 2017).
- Global Footprint Network. Glossary. Available online: https://www.footprintnetwork.org/resources/glossary/ (accessed on 22 September 2017).
- Scrucca, L.; Fop, M.; Murphy, T.B.; Raftery, A.E. mclust 5: Clustering, Classification and Density Estimation Using Gaussian Finite Mixture Models. R J. 2016, 8, 289–317. [Google Scholar] [PubMed]
- El-Chichakli, B.; von Braun, J.; Lang, C.; Barben, D.; Philp, J. Policy: Five cornerstones of a globalbioeconomy. Nat. News 2016, 535, 221. [Google Scholar] [CrossRef] [PubMed]
- European Bioeconomy Alliance (EUBA). The Crucial Role of the Bioeconomy in Achieving the UN Sustainable Development Goals. Available online: https://bioeconomyalliance.eu/crucial-role-bioeconomy-achieving-un-sustainable-development-goals (accessed on 30 July 2018).
- Miller, R.E.; Blair, P.D. Input-Output Analysis: Foundations and Extensions, 6th ed.; Cambridge University Press: New York, NY, USA, 2014. [Google Scholar]
- Lenzen, M.; Moran, D.; Kanemoto, K.; Geschke, A. Building Eora: A Global Multi-Region Input–Output Database at High Country and Sector Resolution. Econ. Syst. Res. 2013, 25, 20–49. [Google Scholar] [CrossRef]
- UNEP. Material Extraction Dataset. Available online: https://uneplive.unep.org/ (accessed on 14 June 2017).
- Wickham, H. ggplot2: Elegant Graphics for Data Analysis; Springer: New York, NY, USA, 2009. [Google Scholar]
- Kassambara, I.; Mundt, F. factoextra: Extract and Visualize the Results of Multivariate Data Analyses. Version 1.0.5. Available online: https://CRAN.R-project.org/package=factoextra (accessed on 5 July 2018).
- South, A. rworldmap: A New R package for Mapping Global Data. R J. 2011, 3, 35–43. [Google Scholar]
- Auguie, B. gridExtra: Miscellaneous Functions for “Grid” Graphics. Available online: https://cran.r-project.org/web/packages/gridExtra/index.html (accessed on 5 July 2018).
- Wilke, C.O. cowplot: Streamlined Plot Theme and Plot Annotations for ‘ggplot2’. Available online: http://www.imsbio.co.jp/RGM/R_package?p=cowplot&d=R_CC (accessed on 5 July 2018).
- Harrel, F.E., Jr.; Dupont, C. Hmisc: Harrel Miscellanous. Available online: https://CRAN.R-project.org/package=Hmisc (accessed on 5 July 2018).
- Bengtsson, H. matrixStats: Functions that Apply to Rows and Columns of Matrices (and to Vectors). Version 0.53.1. Available online: https://CRAN.R-project.org/package=matrixStats (accessed on 5 July 2018).
- Graves, S.; Piepho, H.-P.; Selzer, L.; Dorai-Raj, S. multcompView: Visualizations of Paired Comparisons. Version 0.1-7. Available online: https://cran.r-project.org/web/packages/multcompView/index.html (accessed on 5 July 2018).
- FAO. Prevalence of Undernourishment. Available online: https://unstats.un.org/sdgs/indicators/database/?indicator=2.1.1 (accessed on 26 September 2017).
- IEA; UNSD; UN Energy; SE4ALL Global Tracking Framework Consortium. Renewable Energy Share in the Total Final Energy Consumption. Available online: https://unstats.un.org/sdgs/indicators/database/?indicator=7.2.1 (accessed on 25 September 2017).
- IEA; UNSD; UN Energy; S4All Global Tracking Framework Consortium. Energy Intensity Measured in Terms of Primary Energy and GDP. Available online: https://unstats.un.org/sdgs/indicators/database/?indicator=7.3.1 (accessed on 25 September 2017).
- UNEP. Material Footprint, Material Footprint per Capita, and Material Footprint per GDP. Available online: https://unstats.un.org/sdgs/indicators/database/?indicator=12.2.1 (accessed on 26 September 2017).
- UNEP. Domestic Material Consumption, Domestic Material Consumption per Capita, and Domestic Material Consumption per GDP. Available online: https://unstats.un.org/sdgs/indicators/database/?indicator=12.2.2 (accessed on 26 September 2017).
- Tilman, D.; Cassman, K.G.; Matson, P.A.; Naylor, R.; Polasky, S. Agricultural sustainability and intensive production practices. Nature 2002, 418, 671–677. [Google Scholar] [CrossRef] [PubMed] [Green Version]
- Sánchez, P.A. Tripling crop yields in tropical Africa. Nature Geosci. 2010, 3, 299–300. [Google Scholar] [CrossRef]
- Tilman, D.; Socolow, R.; Foley, J.A.; Hill, J.; Larson, E.; Lynd, L.; Pacala, S.; Reilly, J.; Searchinger, T.; Somerville, C.; et al. Beneficial biofuels—The food, energy, and environment trilemma. Science 2009, 325, 270–271. [Google Scholar] [CrossRef] [PubMed]
- Harvey, M.; Pilgrim, S. The new competition for land: Food, energy, and climate change. Food Policy 2011, 36, S40–S51. [Google Scholar] [CrossRef]
- Haberl, H. Competition for land: A sociometabolic perspective. Ecol. Econ. 2015, 119, 424–431. [Google Scholar] [CrossRef]
- Lewandowski, I. Securing a sustainable biomass supply in a growing bioeconomy. Glob. Food Sec. 2015, 6, 34–42. [Google Scholar] [CrossRef]
- Muradian, R.; Martinez-Alier, J. Trade and the environment: From a ‘Southern’ perspective. Ecol. Econ. 2001, 36, 281–297. [Google Scholar] [CrossRef]
- Havnevik, K. Grabbing of African lands for energy and food: implications for land rights, food security and smallholders. In Biofuels, Land Grabbing and Food Security in Africa; Matondi, P.B., Havnevik, K., Beyene, A., Eds.; Zed Books: London, UK, 2011; pp. 20–43. [Google Scholar]
- Zilberman, D.; Kim, E.; Kirschner, S.; Kaplan, S.; Reeves, J. Technology and the future bioeconomy. Agric. Econ. 2013, 44, 95–102. [Google Scholar] [CrossRef]
- Wield, D. Bioeconomy and the global economy: Industrial policies and bio-innovation. Technol. Anal. Strateg. Manag. 2013, 25, 1209–1221. [Google Scholar] [CrossRef]
- Singh, R.K.; Murty, H.R.; Gupta, S.K.; Dikshit, A.K. An overview of sustainability assessment methodologies. Ecol. Indic. 2009, 9, 189–212. [Google Scholar] [CrossRef]
- Ness, B.; Urbel-Piirsalu, E.; Anderberg, S.; Olsson, L. Categorising tools for sustainability assessment. Ecol. Econ. 2007, 60, 498–508. [Google Scholar] [CrossRef]
- Wackernagel, M.; Hanscom, L.; Lin, D. Making the Sustainable Development Goals Consistent with Sustainability. Front. Energy Res. 2017, 5, 18. [Google Scholar] [CrossRef]
- Bauer, F.; Coenen, L.; Hansen, T.; McCormick, K.; Palgan, Y.V. Technological innovation systems for biorefineries: A review of the literature. Biofuels Bioprod. Bioref. 2017, 11, 534–548. [Google Scholar] [CrossRef]
- Freudenberger, L.; Schluck, M.; Hobson, P.; Sommer, H.; Cramer, W.; Barthlott, W.; Ibisch10, P.L. A View on Global Patterns and Interlinkages of Biodiversity and Human Development. In Interdependence of Biodiversity and Human Development under Climate Change; Ibisch, P.L., Vega, A.E., Herrmann, T.M., Eds.; Secretariat of the Convention on Biological Diversity: Montreal, QC, Canada, 2010; pp. 37–58. [Google Scholar]
Figure 1.
Map of a global bio-economy typology with countries belonging to the same cluster being displayed in the same color. Clusters: Diversified Bio-economies (Diverse), Advanced Primary Sector Bio-economies (AdvancedPrim), High-Tech Bio-economies (HighTech), and Basic Primary Sector Bio-economies (BasicPrim).

Figure 2.
Boxplots comparing clustering variables for different bio-economy types (a–d). Letters indicate significant differences according to a pairwise Wilcox rank sum test with a significance level of 0.05. Clusters with the same letter are not significantly different.
Figure 2.
Boxplots comparing clustering variables for different bio-economy types (a–d). Letters indicate significant differences according to a pairwise Wilcox rank sum test with a significance level of 0.05. Clusters with the same letter are not significantly different.

Figure 3.
Matching of the bio-economy typology against (a) the number of different bio-economy strategies per country and (b) the different foci of bio-economy strategies.
Figure 3.
Matching of the bio-economy typology against (a) the number of different bio-economy strategies per country and (b) the different foci of bio-economy strategies.

Figure 4.
Comparison of the status (a,c,e) and trend (b,d,f) of different sustainability indicators related to nutrition availability and energy input for the five bio-economy types. The status was calculated as average values between 2010 and 2015 and the trend was calculated as the change between the current status and the average values for the years 2000 to 2005 as far as available. Letters indicate significant differences between types according to a pairwise Wilcoxon rank sum test (p < 0.05).

Figure 5.
Comparison of the status (a,c,e) and trend (b,d,f) of different sustainability indicators related to material and ecological footprints for five bio-economy types. The status was calculated as average values between 2010 and 2015, and the trend was calculated as the change between the current status and the average values for the years 2000 to 2005 as far as available. Letters indicate significant differences according to a pairwise Wilcoxon rank sum test (p < 0.05).

Figure 6.
Comparison of the status (a,c,e) and trend (b,d,f) of different sustainability indicators related to the production and trade of biomass for the five bio-economy types. The status was calculated as average values between 2010 and 2015 and the trend was calculated as the change between the current status and the average values for the years 2000 to 2005 as far as available. Letters indicate significant differences according to the pairwise Wilcoxon rank sum test (p < 0.05).


Table 1.
Set of indices and indicators used for the cluster analysis to identify bio-economy types.
| Indices and Indicators | Unit | Years | Source |
|---|---|---|---|
| 1. Economic importance of the primary sector | |||
| Agriculture, value added, includes agricultural as well as forest products | % of Gross domestic product (GDP) | 2010 to 2016 | [25] |
| Employment in agriculture male | % of male population | 2010 to 2016 | [26] |
| Employment in agriculture female | % of female population | 2010 to 2016 | [27] |
| Agricultural land | % of land area | 2010 to 2015 | [28] |
| Forest area | % of land area | 2010 to 2015 | [29] |
| 2. Economic importance of the high-tech sector | |||
| High-technology exports | % of manufactured exports | 2010 to 2016 | [30] |
| Patent applications, residents | Per million people | 2010 to 2015 | [31] |
| Patent applications, nonresidents | Per million people | 2010 to 2015 | [32] |
| 3. Availability of bioproductive land | |||
| Bioproductive area/Biocapacity | % of total area | 2013 (2017 Edition) | [33] |
| Bioproductive area/Biocapacity (per capita) | ha per capita | 2013 (2017 Edition) | [33] |
| 4. Availability of skilled labor | |||
| Gross enrolment ratio, tertiary, both sexes | % of population | 2010 to 2016 | [34] |
| Employees with an advanced education | % of population | 2009 to 2016 | [35] |
| Scientific and technical journal articles | per million people | 2010 to 2013 | [36] |
Table 2.
Indicators used for sustainability evaluation of different bio-economy types.
| SDG No. | Sustainability Indicator | Unit | Years Status | Years Early Stage | Source |
|---|---|---|---|---|---|
| 2.1.1 | Prevalence of undernourishment | % of population | 2010–2015 | 2000–2005 | [52] |
| 7.2.1 | Renewable energy share in final consumption | % of energy | 2010–2014 | 2000–2005 | [53] |
| 7.3.1 | Energy intensity in terms of primary energy and GDP | MJ per USD const. 2011 PPP GDP | 2010–2014 | 2000–2005 | [54] |
| 12.2.1 | Material footprint | Metric tons per capita | 2010 | 2000–2005 | [55] |
| 12.2.2 | Domestic material consumption | Metric tons per capita | 2010 | 2000–2005 | [56] |
| na | Ecological footprint | Global ha per capita | 2010–2013 | 2000–2005 | [33] |
| na | Ecological deficit or reserve | Global ha per capita | 2010–2013 | 2000–2005 | [33] |
| na | Domestic food biomass footprint | tons per capita | 2010 | 2000 | [42,43] |
| na | Domestic non-food biomass footprint | tons per capita | 2010 | 2000 | [42,43] |
| na | Imported food biomass footprint | tons per capita | 2010 | 2000 | [42,43] |
| na | Imported non-food biomass footprint | tons per capita | 2010 | 2000 | [42,43] |
Table 3.
t-values to be used for the interpretation of the clusters; cells in brackets have F-values higher than 1.2 (F-values higher than 1 indicate that the variance of a cluster is bigger than the variance of the whole dataset).
Table 3.
t-values to be used for the interpretation of the clusters; cells in brackets have F-values higher than 1.2 (F-values higher than 1 indicate that the variance of a cluster is bigger than the variance of the whole dataset).
| Index | Diverse | AdvancedPrim | HighTech | BasicPrim |
|---|---|---|---|---|
| Economic importance of the primary sector | −0.480 | −0.092 | −0.487 | 1.182 |
| Economic importance of the high-tech sector | −0.137 | −0.566 | (1.513) | −0.434 |
| Availability of bioproductive land | 0.290 | −0.548 | (0.924) | −0.524 |
| Availability of skilled labor | 0.426 | −0.246 | (0.816) | −0.983 |
Table 4.
Spearman correlation coefficients between the different indices, ** p < 0.001, * p > 0.005.
Table 4.
Spearman correlation coefficients between the different indices, ** p < 0.001, * p > 0.005.
| Primary Sector | High-Tech | Productive Land Availability | |
|---|---|---|---|
| Primary Sector | |||
| High-Tech | −0.254 * | ||
| Productive Land Availability | −0.289 ** | 0.233 * | |
| Skill Availability | −0.574 ** | 0.401 ** | 0.294 ** |
© 2018 by the authors. Licensee MDPI, Basel, Switzerland. This article is an open access article distributed under the terms and conditions of the Creative Commons Attribution (CC BY) license (http://creativecommons.org/licenses/by/4.0/).
Share and Cite
MDPI and ACS Style
Biber-Freudenberger, L.; Basukala, A.K.; Bruckner, M.; Börner, J. Sustainability Performance of National Bio-Economies. Sustainability 2018, 10, 2705. https://0-doi-org.brum.beds.ac.uk/10.3390/su10082705
AMA Style
Biber-Freudenberger L, Basukala AK, Bruckner M, Börner J. Sustainability Performance of National Bio-Economies. Sustainability. 2018; 10(8):2705. https://0-doi-org.brum.beds.ac.uk/10.3390/su10082705
Chicago/Turabian StyleBiber-Freudenberger, Lisa, Amit Kumar Basukala, Martin Bruckner, and Jan Börner. 2018. "Sustainability Performance of National Bio-Economies" Sustainability 10, no. 8: 2705. https://0-doi-org.brum.beds.ac.uk/10.3390/su10082705
Note that from the first issue of 2016, this journal uses article numbers instead of page numbers. See further details here.