Spatial Zoning Strategy of Urbanization Based on Urban Climate Co-Movement: A Case Study in Shanghai Mainland Area

1
Center for Modern Chinese City Studies, School of Urban and Regional Science, East China Normal University, Shanghai 200062, China
2
Institute for Innovation and Strategic Studies, East China Normal University, Shanghai 200062, China
3
Institute of Ecological Urbanization and Green Building, Shenyang Jianzhu University, Shenyang 110168, China
*
Authors to whom correspondence should be addressed.
Sustainability 2018, 10(8), 2706; https://0-doi-org.brum.beds.ac.uk/10.3390/su10082706
Submission received: 21 June 2018
/
Revised: 20 July 2018
/
Accepted: 30 July 2018
/
Published: 1 August 2018
(This article belongs to the Collection Adaptive Cities: Urban Planning and Design Contribution for Achieving Climate Resilient Cities)
Abstract
:Urbanization has brought with it large populations in cities, which has then led to changes in urban land use intensity and spatial patterns, resulting in changes in underlying surfaces and urban climate. The impacts of the early urbanization process and the rapid development of the international metropolis on the interactive development of spatial zoning, urban climate, and urbanization in the main region of Shanghai are studied. This study has important practical and methodological implications with respect to two major themes in the current urban planning area of China, specifically, the construction of new urbanization and the changes in urban climate adaptation. Through the experiences of the human activities model from ecology, factors are selected based on the effects of climate on four dimensions, namely, economy, urban construction, ecological, and environment, where the weight of each index is determined by the coefficient of the variation method and the important spatial factors influencing the climate effect are screened out. The four important influential factors are population density, road density, built-up areas, and the green coverage ratio of spatial distribution. A quantitative analysis determined that there exists a consistent relationship between urban climate factors and the four urbanization spatial factors. Based on urbanization classification that considered each factor evaluation along with integrated analyses and statistical correlation analyses of the spatial grid index using ArcGIS software, the urban space partition level is identified, and urban spatial zoning strategies based on the co-movement of urban climate system are put forward. Combined with the zoning study of land use and the urban heat island distribution pattern, the spatial zoning strategy of controlling urbanization intensity based on the urban climate system is proposed. This research will guide the integration of the urbanization spatial structure and urban climate system toward rational development in Shanghai city.
1. Introduction
As a local climate is relatively independent of global and regional climates, urban climate is closely related to urban development and human activities. The change in urban climate has an inescapable responsibility for changes in global climate, however. At present, governments as well as the Intergovernmental Panel on Climate Change (IPCC) and the United Nations Framework Convention on Climate Change (UNFCCC) have regarded climate change and coping strategies of urban areas as priorities to be emphasized in global climate change research and actively promoted in the action planning for urban climate change. In the China National Assessment Report on Risk Management and Adaptation of Climate Extremes and Disasters [1], which was promulgated by China in 2015, it is mentioned that, in China, the high frequency of extreme climate phenomena has resulted in the expansion of the impact range and heavy economic loss. In 2016, the action plan for urban adaptation to climate change in China was issued, and the first 30 pilot cities in the country were announced, thus indicating that the urban adaptability measures from the pilot cities were then promoted on a national scale [2]. As a special case with high population density and high economic density, the city area is most affected by climate change. Furthermore, the urbanization process is accompanied by a change in land use mode and underlying surface changes, which inversely affect the urban discharge sources, urban wind speeds, and temperatures. Accordingly, the integrated study of urbanization and climate change is a major issue in environmental concerns.
“Co-movement” is generally understood as the correlated or similar movement of two or more entities. It is often used in the field of economics. The current researches on co-movement of international economic cycle focus on the fluctuation and transmission mechanisms and experiments on co-movement experiences [3]. “Category-based” co-movement occurs when investors classify different securities into the same asset class and shift resources in and out of this class in correlated ways [4]. In the aspect of urban space environment, firstly, co-movement refers to the variability of environmental space. Secondly, when the location of a single object in the environment changes or the shape changes, it can simultaneously optimize the function of the other space. This coordination of the change of different spatial relations could be called co-movement. Thirdly, the co-movement can also be reflected in a larger range of spatial relationships among the elements of the environment, making the complex space to maintain a harmonious state through changes. Co-movement is not a purpose, it is a special way to optimize spatial relations [5]. In the paper, we use the third concept to describe the spatial relationship among urban spatial and environmental factors, so that urban space system can maintain the harmonious development by changing the relationship between the impact factors.
Urban climate changes are affected by increases in population, expansions in land use, increased anthropogenic heat, and changes in the characteristics of the city’s underlying surface [6,7]. As early as 1973, the effect of the interaction between urban scale and urban heat island was explored by Oke, and based on that exploration, the dynamic mechanism of the urban heat island [8] was proposed. Most regions experience the temperature increases that are caused by urbanization and that land use as part of the urbanization process affects the temperature using the United States as a case study [9]. There is also greater precipitation in urban downwind areas by using Tropical Rainfall Measuring Mission satellite (TRMM) observations [10]. Using the MM5 model in European cities, urban precipitation during the process of urbanization decreased in the summer months and increased in the winter months was concluded [11]. Rapid urbanization caused the greenhouse effect and reduced local species were also found [12].
High urbanization has significantly changed the urban land use pattern, which has led to more prominent urban climate problems. The academic thought along the significance of time and distance in this field is attributed to Oke (1988) [13], while Fernando (2010) [14] proposed the concept of the urban canopy, which is based on the finding that the atmospheric space between the urban building surface area and the ground is covered by a layer that is created by special atmospheric processes, which were caused by the heterogeneity of the urban surface. Innumerable internal boundary layers are generated by the combination of different heights of buildings and various distribution densities, which leads to the continuous adjustment of the canopy structure and the underlying land use due to the horizontal and gradient changes. By applying the subgrid parameterization of the approximate characteristics of the urban morphological and structural features to the study of urban canopy parameterization, research innovations of the urban canopy layer, such as the DNA composition of the urban life body, can be explored [15]. ENVI software and the network central simulation classification program software were used by the University of Stuttgart to analyse the climate phenomena that are caused by urban land use expansion from 1990 to 2010 in Tehran [16]. The spatial difference of urban air temperature and wind speed on urban land use change in three different research areas located in the metropolitan area of Seoul, Korea while using the WRF (Weather Research and Forecasting) model and the SLEUTH urban growth model were simulated [17]. The dynamic changes of urban landscape in the agglomerated area of the Beijing-Tianjin-Tangshan metropolis (BTT-MCA) under different climate change scenarios from 2009 to 2030 were also simulated using landscape dynamic succession analysis model (SD) combined with the cellular automata model (CA) [18]. Alexander (2016) The climate impact of four development scenarios in the urban region based on the principle of reasonable planning strategy and then optimized urban spatial distributions to mitigate the urban thermal environment were analysed by using the surface urban energy and water balance model (SUEWS) and the monitoring of land use/cover dynamic (MOLAND) model [19]. In general, the multi-analysis tools between the urban climate effects and the urban spatial pattern on a macro scale embodied the trend of the current research in this field to focus on the effects of the different urban spatial features, and thus guide urbanism rational development.
The city of Shanghai is one part of the alluvial plain belong to the Yangtze River Delta, with an average altitude of about 4 m. There are slightly topographic slopes from the east to the west. Except for a few foothills in the southwest, the topography is a flatness plain. Shanghai belongs to the humid monsoon climate zone in the north subtropical zone, with four distinct seasons, full sunshine, and abundant rainfall. Hot extremes and urbanization in such a city therefore have substantial impacts on both human health and the regional economy. Shanghai, which is the tenth largest urban agglomeration area in the world, also claims an urbanization process that was both relatively early and extremely fast. When the United Nations announced the future forecast of urbanization prospects, it revealed that Shanghai’s urbanization population was ranked second in the global arena and first in China (Figure 1) [20]. Especially with respect to land area, urbanization continues to advance, and urban resources and the environment continue to face challenges. As a typical metropolis, the interaction effect of urban climate and urban development spatial intensity factors is studied, the relationship between the regional urbanization space types and the comprehensive distribution characteristics of urban climate is analysed, and the urban regional spatial zoning strategy is promoted to form a coordinated development that takes into account urban climate factors when planning and guiding future urbanism.
2. Research Areas and Data Sources
2.1. Research Area and Situation
The study area consists of the mainland part of Shanghai city, with the exception of the Chongming District, which is the largest island of the administrative areas in Shanghai and it is completely isolated by its superior ecological environment and special urban climate conditions. The administrative areas in mainland area of Shanghai include the districts of Huangpu, Jingan, Xuhui, Changning, Hongkou, Yangpu, and Putuo, as well as the districts of Qingpu, Songjiang, Fengxian, Jinshan, Jiading, and Pudong in the city of Shanghai (Figure 2 Left map). This region comprises the main area of urbanization, with a total area of approximately 5349.8 km2, and its urbanization ratio has been developing rapidly, reaching 89% by 2014 in Shanghai city and advancing Shanghai city to the number one position in China. The urbanization area commonly referred to downtown area, highly concentrated built-up area, built-up area with new town development, and the integrated and promoted town clusters in urban planning of Shanghai in recent years (Figure 2 Right map). The central urban area usually referred to the downtown area and the highly concentrated built-up area. According to the government of Shanghai, the urban infrastructure investment ratio between the city centre and the suburban areas has increased to 3:7, which is representative of a major infrastructure system that is designed to promote urban spatial development [21].
Due to the process of urbanization beginning earlier in Shanghai, a series of urban climate effects, such as urban heat islands and urban rain islands, appeared predominantly on the mainland. In recent years, the range of annual average temperature in Shanghai is between 17 °C and 18.5 °C, and the utmost highest air temperature is between 38 and 40 °C. The continuous high temperature and heat wave days in summer had become the unique regional climate of Shanghai. Before 1977, the highest summer temperature in Shanghai was no more than 37 °C. After 1978, hot weather was continual appeared with the higher temperature more than 37 and 38 °C. The rising rate of air temperature in Shanghai within the last 27 years was 0.285 °C for each 10 years (Yang et al., 2011).
The growth rate of the utmost highest air temperature in Shanghai was 0.433 °C for each 10 years, which far exceeded the temperature of the surrounding area [22,23]. There are three distribution centers of urban heat island in Shanghai, that is, the main center of UHI (Urban Heat Island) in the downtown area, and the two sub-centers of UHI in the north section of Minhang district and the south section of the Songjiang district. The annual average temperature and urban heat island intensity (IUHI) of Xujiahui station in the central urban area showed a slow growing tendency, the increasing rate of the air temperature reached 0.517 °C for each 10 years, and the increasing rate of IUHI reached 0.15–0.17 °C for each 10 years [24]. The UHI had caused more amount of high temperature days and heat waves weather in the central urban areas of Shanghai than in rural areas, and the mortality rate in summer is higher than that in the surrounding regions [25]. More extreme climate events have been encountered in cities, and the spatial patterns of the meteorological effects, such as air temperature and precipitation, have changed significantly. The main area of the urban heat island in Shanghai also increased from 67.16% in 1981 to 83.69% in 2014, and there was an increasing year-by-year trend [26]. The further increase in urban air temperatures has resulted in the decline in urban air quality, an increase in energy consumption, and damage to human health [27,28,29,30,31], all of which are important issues for the sustainability of urban development.
2.2. Data Source
The meteorological data were obtained from ten meteorological stations in the mainland area of Shanghai (Xujiahui station, Minhang station, Baoshan station, Jiading station, Pudong station, Qingpu station, SongJiang Station, JinShan Station, Nanhui station, Fengxian station) in 2014. The data related to urbanization factors, which include GDP, industrial gross output value, per capita gross product, population density, built-up areas, road network density, building areas, cultivated land area, forest land area, and environmental protection investment, were obtained from Shanghai’s statistical yearbooks [32], China’s statistical yearbooks [33], and China’s forestry statistical yearbooks [34]. The urbanization development factors indicate that the spatial patterns were selected based on population density, road network density, urban built-up areas, and urban green space coverage. The road spatial pattern is derived from 2014 data using an electronic survey map of Shanghai surveying and information gathered from the mapping institute. The data were then calculated to obtain road network density within sub-district units via GIS spatial analysis. The conditions of the urban built-up areas and the urban green space coverage were obtained using a 2014 image from the Landsat Operational Land Imager (OLI). To assess population density, the 2010 census figures for China are used, as these are the latest population data available that distributes the data into sub-district units [35].
3. Methodology
3.1. Screening Evaluation Factors of Urbanization Based on Urban Climate Effects Impact
The influence of the spatial zoning pattern of urbanization on urban climate is the result of human activities and changes in urban land use. The impact of urbanization on urban climate based on spatial distribution is obtained primarily through qualitative analysis as no authoritative model has yet been formed to evaluate the effects of urbanization on climate. This study considers a quantitative model to assess human activity intensity and an ecosystem model [36,37,38,39,40,41] in order to explore the interaction relationship between the urban climate system and urbanization and to provide recommendations to improve urban climate.
The concept of urbanization can be commonly extended in three aspects. The first is the agglomeration of population migration, which is the basic connotation of urbanization. The second is the agglomeration of economic activities, which is the important content of the connotation of urbanization; and, the third is the expansion of urban space, which is the main entity form of urbanization. These three aspects of urbanization are closely related to UHI, which all directly impact on the intensification of UHI [42]. Population growth has a great influence on the intensity of UHI. The density effect and scale effect of population growth on UHI intensity are similar. The density effect of economic development and energy consumption on UHI intensity is usually larger than its scale effect. The land urbanization is the main aspect affecting the intensity of UHI. The cumulative effect of built-up area expansion on the intensity of UHI is greater than that of its incremental effect. The effect of the housing construction area on the intensity of the UHI is less than the cumulative effect [43]. The mechanism of different urbanization factors to affect urban climate is shown in Table 1.
According to the dimensions of the human activity intensity index, urbanization factors that are based on the impact of urban climate, for the purposes of this research, are divided into three categories, namely, the increasing economic index, the urban construction index, and the ecological and environment index, which emphasize the regional features of Shanghai and considers a quantitative analysis of the spatial development factors. Finally, the index system of urbanization development as it relates to the urban climate system was selected (Table 1).
(1) The economic index
The detailed evaluation indices include the GDP index, per capita GDP index, and industrial gross output value, which characterizes the level of urban development and reflects the impact of the natural environment on urban climate during economic activities. While urban industrial development accelerated the pace of urbanization and led to economic growth, it also resulted in substantial emissions of greenhouse gases, such as carbon dioxide, carbon, and oxygen, and so on, which cause the urban climate effects.
(2) The urban construction index
The urban construction index includes the evaluation of population density, built-up areas, housing construction areas, and road network density. As the continuous increase in population changes urban land use and influences the density of buildings, high-density urban built-up areas affect the surface roughness, which then influences wind speed and ultimately influences the urban climate.
(3) The ecological and environmental index
The ecological and environmental index comprises three ecological control factors, namely, forest land area, cultivated land area, and green space area, as well as factors that are related to natural reserve coverage, such as the proportion of environmental protection investment, the total amount of discharged industrial gases, and the total amount of flue gas and dust. Changes in the ecological and environmental system affect the impact of climate to a large extent. For example, a decrease in ecological space as an urban land use mode due to urbanization increases the urban heat island effect and other local climate conditions. The emission of pollutants from industrial development and the effect of environmental governance are also directly related to the overall urban climate.
3.2. Evaluation Method of Urbanization Based on Climate Impact
The coefficient of the variation method is an objective endowing weight method that directly utilizes the information that is contained in various indicators and obtains the weight of the index through calculation. According to the evaluation index system, a greater difference in the index value indicates that the index can reflect its degree of importance. In this way, the importance of each index’s weight and factor function is determined. This study uses this weighting method to measure the importance of each index to the level of urbanization.
It is not convenient to conduct a direct comparison to consider the unit of choice and dimension inconsistency. Therefore, to unify the index, a dimensionless treatment is first conducted. After the normalization transformation process, the values are between 0 and 1. The formula is as follows:
where Xij refers to the j original data of the I index; i = 1, 2, …, m represents the number of indices; j = 1, 2, …, n refers to the number of data in the I index; and Xmax and Xmin refer to the maximum and minimum values of the I index, respectively.
The formula for determining the coefficient of variation is as follows:
where represents all data standard deviations and is the average of all data.
The weight of each index is determined according to the coefficient of variation. The formula is as follows:
3.3. The Multi-Source Spatial Data Integration and Analysis
The spatial data of the urbanization in the Shanghai mainland area were obtained from the Landsat Operational Land Imager (OLI) remote sensing imagery of 2014, which then underwent further processing. The support methods for this study included ENVI 5.1 for high-resolution remote sensing image processing and the ArcGIS10.1 software, which was used to analyse the urbanization spatial factors and the degree of change in the urban surface temperatures. The specific operations included radiation calibration, atmospheric correction and cutting, calculations to obtain the ground albedo of the hardened pavement in the city’s construction areas, and the spatial data of the normalized vegetation index (NDVI), which presents the condition of the vegetation coverage. The shortwave white-sky albedo (WSA) product-MOD43B3 of the 2014 MODerate resolution Imaging Spectroradiometer (MODIS), which has 1000 m spatial resolution, was used for accuracy verification. The results confirmed that the remote sensing analysis method is in accordance with the present situation of the ground objects.
The spatial analysis of urban meteorological factors adopted the spatial difference method of the geographic information system (GIS). Since the annual data for 2014 from Shanghai’s ten district meteorological stations have limitations with respect to data numbers, the spatial interpolation method is used to analyse the spatial distribution pattern and regularity of the urban climate factors. Spatial interpolation is a common method that is used to transform the surrounding discrete points into a continuous fitting surface using a mathematical model, which then enables the display of the distribution pattern of the research objects on the spatial scale. The commonly used model types of the method include the inverse distance weighted mean interpolation (IDW), spline function computation, and trend surface computation. The IDW computation is widely used because of its simplicity and accuracy.
Z (S) is the estimation value of the interpolation point S, n is the number of known points, Zi is the attribute value of known point i and di is the distance from the interpolation point S to known point i.
The separation of the intensity of urbanization development requires a more detailed spatial distribution of meteorological characteristics. In this paper, the GIS and RS fusion techniques are used to extract the 28 May 2014 urban land surface temperature information and temperature inversion data and analyse the spatial and thermal environment zoning characteristics. Using the thermal infrared radiation information obtained from remote sensing sensors, the inversion of the urban surface temperature based on remote sensing data generally includes radiation calibration, atmospheric correction, NDVI calculation, surface emissivity estimation, radiation brightness temperature (black body radiance at the same temperature), and surface temperature inversion. At present, the single-channel algorithm for Landsat TM data consists primarily of two types, the single-window algorithm and the universal single-channel algorithm. The single-window algorithm is used in the study of surface temperature inversion in the downtown area of Shanghai.
The spatial analysis of urbanization factors and the delineation of urbanization development zones adopt the spatial analysis method of the ArcGIS. The influence of urbanization factors on urban meteorological factors, i.e., annual average temperature, annual precipitation, annual maximum wind speed, and annual relative humidity, was analysed by means of regional average using the zonal statistic tool in the ArcGIS. The spatial interaction between the two systems was also analysed.
4. Results
4.1. The Influence of Urbanization Factors
The annual index data for the years 2000 to 2014 were obtained from Shanghai’s statistical yearbook, China’s statistical yearbook, and China’s forestry statistical yearbook were analysed. Furthermore, the indexing system of urbanization development was analysed using the variation coefficient method. Finally, the weight of the various indices of the level of urbanization development is determined based on the urban climate effect in Shanghai, as presented in Table 2.
According to the index factor weight ranking, the first few factors are urban green area, built-up area change, population density, and road network density; their indices are 0.184, 0.138, 0.116, and 0.110, respectively. To verify the relationship among various indicators and typical urban climate factors, statistic analyse method was used. In order to facilitate variables comparison, multiple adjustments of variables were made. From the quantitative analysis the changes of four factors and the urban utmost highest air temperature within fifteen years (Figure 3), it can be seen that the rapid increase of the four urbanization factors is proceeding in Shanghai. With the agglomeration of population, the rapidly expansion of urban built-up area is appeared after 2004, and now the growth tend is now stable. This process has also brought out road intensive construction. The utmost highest air temperature in the city has increased from 36.7 °C to 40 °C. After 2009, the area of urban green space has increased rapidly. In the condition of the slow growth ratio of other three urbanization factors, the value of the utmost highest air temperature began to decrease, but it is still higher than the temperature at the beginning of the twenty-first century. This analysis can further explain the weight value of urban green space factors is the highest in the index system, and the expansion of urban built-up area is also a very important urbanization factor. The four factors have a coordinated and interactive influence on air temperature.
The weight average methodology is used to calculate Urbanization Intensity Comprehensive Index (UICI), which showed the overall growth level of urbanization factors. The relationship between the UICI and the utmost highest air temperature was analyzed on the basis of the development trend from 2000 to 2014 years, and the stacked line diagram of the two index is formed (Figure 4). It is also found that the UICI growth is closely related to the increase of the air temperature in Shanghai, with the same gradient increasingly progressively. Accordingly, based on the interactions between urban climate and human activities, a spatial zoning analysis of the important influencing factors of urbanization development in Shanghai is conducted. The four indices of influencing factors are urban green area, urban built-up area, population density, and road network density. To some extent, the evaluation indices delineated a comprehensive inheritance and identified the characteristics of the influencing factors of urbanization in Shanghai.
4.2. The Spatial Pattern of the Important Influencing Factors
4.2.1. The Spatial Distribution of Population Density
The distribution of population density reflects the spatial characteristics of urban agglomeration and affects urban microclimate factors as spatial differences in the degree of concentration, thus changing the urban climate and impacting various environmental features. The spatial distribution of the population density, according to the data of Shanghai’s sixth national census (Figure 5a), indicated that the highest level of population density was distributed in the downtown area. A higher level of population density was also noted in the surrounding areas of the downtown area. These two zones make up the central urban area of the city of Shanghai. The density of the sub-districts in the outskirts of the city are relatively low, whereas the population density in the sub-districts of the outer suburbs was the lowest. When compared with the data from the fifth census, the population density in the downtown area has been declining, while the population densities in the outskirts and outer suburbs area are rising, especially in several of the newly developed towns. Additionally, the corresponding supporting urban infrastructures that served the transient population settlements during the urbanization of Shanghai have been improved. However, the characteristics of the spatial distribution indicate that the central urban area exhibits its own unique advantages and produces a single centre pattern of the population. The spatial difference in the population densities between the suburbs and the central urban area was especially obvious given that the distribution pattern of multi-centre decentralization had not yet been formed.
4.2.2. The Spatial Distribution of Road Network Concentration
The spatial distribution of the road network concentration was related to population density and the spatial pattern of urban land use intensity. To a certain extent, the road network model reflects the spatial distribution characteristics of Shanghai’s traffic pollution from gas, which, as the main source of pollution in Shanghai, affects the urban climate system. From the 2014 spatial distribution pattern of road network concentration in the research area (Figure 5b), the concentration of the road network in Shanghai city centre was the highest, followed by that in the outskirts. The lowest concentration was in the outer suburbs. The high value areas of road network concentration were distributed in three zones, namely, the old downtown area of Shanghai City where road networking was driven by commercial development; the urban infrastructure development area, which was led by the promotion of education in the sub-districts of Kongjiang and Siping and the district of Yangpu; and, the new industrial driven development areas, such as Xujiahui Street and the Caohejing industrial zone in the district of Xuhui. Although the concentration of road networking in these areas was saturated in 2005, the development and changes were relatively small. The areas with higher levels of road networking concentration were distributed in the outer circle of the high value area. For example, the central region of the new area of Pudong were selected for mature infrastructure construction of the central business district (CBD) zones. The third level of concentration of the road network was distributed throughout the outskirts near the central urban area, the new town area in the districts of Jiading and Songjiang, and the central area of the town of Zhu Qiao, which is located in a newly developed area around the Pudong airport in Shanghai. The areas with the lowest levels of road network concentration were located in the outer suburbs, especially in the southern suburb that is far from the central urban area. The pattern also reflected the characteristics of circle diffusion and axial development, with the differences between the central urban area and the outer suburbs being substantial. To some extent, this pattern reflects the spatial path of urbanization development that had extended along the Huangpu River and the relative increase in a radiation growth pattern from the central urban area. Nonetheless, the road network linkage of urbanized coastal regions to other cities remained weak.
4.2.3. The Spatial Distribution of Urban Built-Up Areas
The built-up urban area refers to those areas that are already constructed or are in the process of being constructed, and these are, for the most part, located in the administrative area of the city. China’s statistical departments use these built-up areas to reflect the extent of the city’s urbanization. Using remote sensing and GIS technology, the high albedo area of land surface can be used, to a certain extent, to characterize the distribution of built-up urban areas. As the albedo value represents the ratio of the reflected solar radiation fluxes on the earth’s surface to the incident solar radiation fluxes, it symbolizes the degree of radiation from different surface buildings that are facing the sun. In general, the albedo value of the built-up area > the woodland (or grassland) areas > cultivated land > bodies of water [44].
The accurate acquisition of albedo parameters and the analysis of their spatial distribution characteristics are of great significance to the study of the development model of regional space processes and the interactive effects on climate factors. There are two primary methods of retrieving the albedo by remote sensing, namely, the empirical regression model and the radiative transfer model [38]. As the radiation transfer model takes into account the influence of the atmosphere on the spectrum and it avoids the obvious calibration errors in the inversion, the physical meaning of the model is more obvious [39]. The 6S model (second simulation of satellite signal in the solar spectrum) is based on the theory of radiation transmission, which eliminates the influences of wave band and atmosphere on the inversion process. Hence, the effect of the scattering of the atmosphere is better than that of other atmospheric correction models. Based on the Landsat TM/ETM/OLI image and the 6S atmospheric correction method, the albedo spatial inversion data for Shanghai on 28 May 2014 was studied, the spatial distribution characteristics were analysed.
From the albedo analysis of the image data of Shanghai on 1 August 2014 (Figure 5c), it is concluded that the total area of urbanization in Shanghai is significantly large, as the image presents concentric circles expanding with the core zone of the urban central area. Furthermore, the data indicate that the main built-up urban area, which is highly dense, has developed continuously throughout the large region. At the periphery of the highly dense built-up urban area, some high albedo values of surface albedo are again formed, which reflects the large number of urban development projects that have been conducted in the suburbs. In the outer suburbs, where the core area of the new town is developed, the development is continuously extended, creating relatively low-density areas where construction is occurring on a large scale. However, there also exist low-construction areas in most parts of the district of Qingpu district, which is located in the western part of Shanghai and the district of the Fengxian along the southeast coast. Although the urbanization process has taken over a portion of the agricultural and forestry lands, these lands are a relatively well-protected area. From the perspective of construction intensity, the development of the built area of Shanghai has extended beyond the single centre structure and formed a core development zone where the sub-centre is the main body, and the multi-centre development pattern of the urban land is supplemented by the development of new towns in the suburbs.
4.2.4. Urban Green Space Pattern
Urban green space has a significant impact on mitigating the effects of the urban heat island and on managing the effects of rainstorms. The spatial characteristics of the urban climate differs because of the changes in urban ecology and green space. Furthermore, it was possible to identify the spatial data of urban green spaces while using the same remote sensing images from 2014 as those that are used for other analyses in this study. The Normalized Difference Vegetation Index (NDVI) was selected to express the coverage of urban green space. The value range of the NDVI is always between −1 and 1, where anything less than 0 indicates that the ground surface is impacted by snow, water, and clouds as the reflectance values for visible light are high. A value of 0 indicates that the ground surface is covered by rock, bare soil, etc. A value greater than 0 indicates that the ground surface is covered by vegetation. The NDVI numerical value of the urban built-up area is below 0.15. The spatial area corresponding to the value range basically represents the surface coverage of the concentrated construction area. The NDVI value of vegetation covered area is basically above 0.20. More specifically, the closer the value is to 1, the greater the vegetation cover. Through direct interpretation and the processing of remote sensing images, an NDVI spatial map of Shanghai in 2014 was created (Figure 5d).
The high value area of the NDVI (above 0.20) for the whole research area is obviously very small, whereas the pressure from the urban ecological environment was found to be relatively large. Specifically, the NDVI value of the central urban area is the lowest, as the green spaces are mainly concentrated in the littoral areas of the urban rivers in the central urban area, especially on the Suzhou creeks, which run from west to east through many districts of the central urban area. Some green patches were distributed in the outskirts. Accordingly, while the distribution of green areas in this region has improved, its continuity is not strong. Along the outer ring expressway, where the NDVI values are high, girdle-shaped green areas are forming. Corresponding to the development intensity of the built-up areas, the ecological green areas of the southwestern and southern sections of the research area are largely concentrated.
4.3. Spatial Distribution of Urban Climate Factors
The 2014 statistical data of the meteorological factors, which include annual temperature, annual precipitation, relative humidity, and annual maximum wind speed, and which are obtained from ten meteorological stations, are subjected to spatial interpolation analysis to obtain the distinct spatial distribution characteristics of Shanghai’s urban climate factors (Figure 6).
The spatial distribution of the annual average temperature presents a downward trend layer by layer from the centre of the city to the suburbs. The high intensity area of the urban heat island in Shanghai is concentrated in those areas experiencing highly intensive urban development. The high temperature zone, which is widely distributed throughout the built-up area, exhibits a centre periphery distribution feature. The scope and direction of the UHI effect is consistent with the direction of urban construction and development in Shanghai. The annual average temperature is highest in the central urban area where there is an obvious UHI effect. The next UHI affection zone is in the outskirts around the central urban area, while the low-temperature zones are located in the suburbs. The UHI in the new building areas of the outskirts is prominently displayed in Figure 6a.
The spatial distribution of the annual average precipitation indicates high value areas in the central urban area and the southeast coastal area, whereas the low value areas are located in the western and northwestern areas of the city (Figure 6b). There are two main cores with a high value of precipitation. Specifically, one is located in the downtown area, and the other is located in the southeastern coastal area of Shanghai, an area that is known for its southeastern monsoon inlet. The high value areas of precipitation brought by high urbanization in the central urban area is significantly higher than that caused by summer typhoons in the coastal areas. The districts of Minhang, Songjiang and Pudong (a new district) in the urban outskirts exhibit higher levels of precipitation, a finding that suggests that the effect by urbanization on the local climate has been quite significant. Supporting this premise is the fact that the total amounts of precipitation in the western parts of the city are relatively low, especially when compared to the total amounts recorded in the downtown area.
The spatial distribution of the annual average relative humidity is the same pattern of the distribution as that of the distribution of air temperature (Figure 6c). The difference in the relative humidity was extremely small throughout the research area. Relatively speaking, the higher values of relative humidity are recorded in the coastal areas or in areas near bodies of water, such as rivers, streams, and lakes. The lowest humidity values are found in the areas that are undergoing rapid urbanization, such as the Baoshan-downtown-Songjiang rapid urban development zone. The lowest degrees of relative humidity were recorded in areas of the industrial park and areas where the road network system is extremely dense.
The spatial distribution of annual maximum wind speed is the lowest in the central urban area (Figure 6d). In other words, the higher the degree of urbanization intensity, the lower the wind speed is. The two areas with the lowest wind speed values are in the downtown area and the new district of Pudong. Not only is the urbanization intensity in the suburbs generally lower, but the differences between the thermal forces from sea and land cause an increase in wind speed by producing both land and sea winds.
The urban surface temperature inversion data (Figure 7), which are based on a single-window algorithm, indicate that the spatial distribution pattern of the urban surface temperature is significantly correlated with the type of urban underlying surface and that the urban built-up areas correspond to high-temperature areas of the city, while non built-up areas correspond to low-temperature areas of the city. This spatial distribution characteristic is also highly consistent with the annual average temperature. At the same time, the greater the development intensity and density of the urban built-up area, the higher the urban surface temperature is. Not surprisingly, the non-built-up urban areas, the green spaces, and those areas near water record lower temperatures than those of highly dense built-up areas. Moreover, the UHI plays a definite role in the distribution pattern of temperatures in the suburbs where new industrial zones and newly built-up areas are located.
5. Discussion
5.1. Classification Characteristics Analysis of Urbanization Factors
The impact of urbanization on climate effects is a complex process involving multiple factors that are related to human activities. Based on the results of the evaluation and analysis of each spatial factor of urbanization in the city, a comprehensive analysis of these factors of urbanization development in Shanghai was conducted. The steps are, as follows:
(1) Re-empowering the importance of four urbanization factors. Combined with the existing numerical results of the population density, road density, the albedo value of the urban built-up area, and the NDVI values of urban green space, the unit space grid method for analyzing the comprehensive urbanization impact was adapted. The weight value was given to represent the different importance of the four urbanization factors. Analytic hierarchy process was used to determine the weight value of each index in the re-empowering process. According to empirical data and the expert scoring method, the judgement matrix and factors weights for urbanization impact intensity were shown in Table 3. The factor weight value of the population density is 0.1297, the weight value of the road density is 0.0917, the weight value of albedo index is 0.2957, and of the NDVI index is 0.4829.
(2) Normalization of different data. In the four spatial analysis indicators of urbanization, the data value range of NDVI and albedo was obtained by standardized processing, and the numerical ranges are [0, 1]. The calculation results of the population density and road density were not consistent with the two indicators, and the variables range embodied large numbers. Therefore, when the four indicators are comprehensively evaluated and analyzed, the two data sources should to be dimensionless by means of a comprehensive calculation. The normalization formula for the indexes of the population density and the road density is as follows.
where Norm is the normalized influence factor value, the range is [0, 1], the X is the original value of a unit grid in the image, and the is the maximum value of the whole image value; is the minimum value of the whole image value.
(3) The calculation of the urbanization intensity and images’ reclassification. The value of the index of urbanization intensity were calculated according to the weight re-empowering of different factors. The imagine pattern of four urban spatial factors is transformed into simple grid layers, and the layers were superimposed and analyzed, and the comprehensive effects of urbanization factors were obtained by calculation. The superimposed values were carried out, according to the following formula.
The method of “Nature Breaks” is used to reclassify with the ArcGIS software. Specifically, the evaluation values were further analysed and then divided into five classifications of urbanization development. The categorized raster map of urbanization was superimposed and transformed into a vector graph, thus forming five boundaries of different urbanization intensity (Figure 8). After the reclassification and the superpositioning of the weights, the classification zones for comprehensive urbanization were obtained. As indicated in Figure 8, the spatial classification of urbanization intensity presents a circular distribution trend.
The urbanization intensity of zone 1 consists of the early, mature urbanization areas in the region. In this area, there is a large concentration of buildings where the floor area ratio is significantly high, the road network system is dense, and green spaces are rare. These areas are primarily distributed in the core areas of Shanghai’s central urban area, which is divided by the Huangpu River into two parts. Except for a small amount of green space, areas that are in this zone consist of large business districts, high-tech scientific research institutions, traditional residential areas, education and medical institutions, etc. These areas are also the most prosperous in Shanghai.
The urbanization intensity of zone 2 closely resembles that of zone 1, and thus, it is in accordance with the spatial scope of the central urban area of Shanghai. In essence, zone 2 is an urbanized expansion that stretches from the downtown area to the outskirts of the city. This part of the region receives the highest radiation impact from the urbanization intensity of zone 1 and represents the highest degree of urbanization development in the whole research area. The building density in this zone is moderate and the height of the buildings is lower than that of the buildings in zone 1. However, the population density has increased rapidly in recent years. While the road network system is relatively moderate, there are few green spaces in zone 2 areas and only a small number of large municipal parks.
The urbanization intensity of zone 3 is mainly characterized by new development areas. After urban congestion issues appeared due to the excessively highly dense development centralized in built-up areas of zone 1, the aims of multi-centre development are modified. Accordingly, urban outskirts and new town construction are built to alleviate the pressures of urbanization in the newly built-up areas and are designed to improve the spatial structure of the urban areas. As a consequence, the intensity of building development in this zone is much lower than that in the central urban area, and more green spaces are intentionally incorporated in the development. Moreover, a degree of agricultural land is retained as part of the urbanization process.
Zone 4 is an interactive zone on the outskirts of the city and suburban areas. Accordingly, the built-up area in this zone is substantially reduced, and the road network system is far more accessible and less dense. Thus, the main road is linked to the centre urban area, although there is an increased distance between the road network and the central urban area. This zone is also characterized by large-scale open green spaces.
The urbanization intensity of zone 5 reflects the lowest degree of urbanization. As such, buildings are few, the road network system of sparse, and there are large areas of farmland and woodland. Due to its good ecological environment, this zone must protect its ecological space, restrict the growth of further urbanization, and create a safe land use pattern that protects the area, while also recognizing the importance of development.
5.2. The Interaction between Urbanization Zoning and Urban Meteorological Factors
The interaction effects between the classification of urbanization development intensity and the 2014 meteorological factors adapted from the spatial analysis conducted while using the ArcGIS were examined. These effects were compared to the spatial differences of the various climatic factors that are covered by the five zoning classifications and the average values for each zone and each factor were further analysed. The results of these analyses concluded that the classifications of urbanization zoning are closely related to the distribution of the urban climate factors (see Figure 9 and Table 4).
The degree of urbanization development is proportional to the annual average temperatures and it is inversely proportional to the annual relative humidity. However, the coupling of the spatial patterns of the two factors is similar. The average annual temperatures are also highly correlated with the degree of urbanization. The average temperature difference between the suburbs and the central urban areas reached 0.3 °C. This difference is due to the urban heat island that is generated by the high concentration of populations and the densely developed road network. The hard urban facilities correspond to the high reflectivity ratio that leads to higher air temperatures, whereas the surface cover in green spaces is less reflective and thus does maximize the urban cooling effect. At the same time, urban buildings in the downtown area are densely distributed, which blocks wind circulation and negatively impacts wind speed. The relative humidity of highly urbanized areas is relatively low and it reveals a gradual increasing trend from the downtown area to the suburbs. During the process of urbanization, the underlying surface changes strengthen the mechanical and thermal turbulence in the near surface layer, and the water vapours are transported to the upper levels of the atmosphere, resulting in humidity levels in urban areas that are lower than those of the suburbs.
In the zone with the highest degree of urbanization, the annual maximum average wind speed is the lowest and the annual precipitation is the highest. Conversely, the zone with the lowest degree of urbanization has the highest average wind speed and the least amount of precipitation. Furthermore, the areas in zone 1 are characterized by high buildings that are densely concentrated, and these factors continue to increase year-by-year. The intensity of the overdevelopment of buildings in zone 1 blocks the urban ventilation corridor and impedes the circulation of the urban summer monsoon and the winter winds. Thus, the maximum wind speeds in the central built-up areas are substantially reduced. At the same time, because of the dense population and the highly concentrated road networking system, a considerable amount of human heat that is the result of being in a central built-up area is emitted. This hot air that is in the central area then promotes thermal circulation with the air from the suburbs. This effect is caused by the difference in air pressure between the central area and the suburbs. Hence, as a result of the thermal circulation phenomenon, precipitation in the central part of the built-up area increases. In the suburbs, because buildings are sparse and the surface roughness is low, the average maximum wind speed is generally higher under the effects of sea land breezes. This factor significantly contributes to the higher precipitation values that are found in the outer suburbs of the coastal area.
Based on a single window algorithm, the urban land surface temperature data are visualized to create the distribution map of the ground surface thermal environment of Shanghai in 2014 (Figure 7). In the near ground atmosphere, the urban meteorological effects are more complex, and they are influenced by the changes in the surface space environment that are the result of human activities. Using the 2014 urban surface temperature data can provide a more accurate analysis of the actual situation of the thermal environment that is affected by the spatial patterns of urbanization. The surface temperature distribution map, which is used to overlap the information of the five spatial zonings of urbanization intensity, is used to analyse the relationship between the spatial patterns of urbanization and the urban climate factors near the ground layer (Figure 10). According to the spatial distribution characteristics of surface temperature and urbanization intensity, the surface temperature gradient in Shanghai reveals obvious trends of variation according to zone. The range of the urban heat island is largely distributed throughout the urbanization intensity zones 1, 2, and 3, but the distribution of the thermal environment intensity inside the urban heat island also exhibits differences in those same urbanization zones. The differences in the inner zoning indicates that the three-dimensional characteristics of near surface objects produce various changes in the intensity of the near surface heat island in the various districts. Thus, the dynamic development of urbanization intensity zoning must be further guided and it must control the development of the regional spatial corridor as it pertains to the intensive development of urban construction. Furthermore, ventilation corridors must be incorporated during the development in certain segments located in UHI areas. The urban cool island is primarily distributed in zones 4 and 5 of the urbanization intensity scale, which are located in the western and southern parts of the study area. The mean temperatures of the areas covered by green space as well as other ecological spaces are lower, and the overall thermal environment is relatively excellent. In waterfront areas within the region, there is a common phenomenon whereby the surface temperatures of the surrounding blocks are reduced by one grade when compared with that of non-waterfront blocks, especially in large waterbody areas and areas along the coastline, which, to maintain and preserve this ecological space and source of cooling, are protected areas.
5.3. Determination of Space Development Zoning of Urbanization Intensity
The spatial pattern of urbanization in Shanghai presents the characteristics of a circle layer developing mode, which is caused by the single centre structure of the population relative to its concentration, as it expands and sprawls around and throughout the central urban area and thereby forms a highly dense, highly concentrated built-up area that necessitates the development of urban infrastructure. At the same time, due to the lack of scientific and rational spatial guidance for the development of urbanization, the distribution of ecological space within cities is fragmented. If the development pattern of urbanization is not optimized in collaboration with the urban climate effect, the UHI intensity and the areas it affects will increase, while the urban cold island area will present a scattered impact point pattern, and eventually, it will impact global climate change. Thus, the development of urbanization should take into consideration urban climate change and combine spatial structure guidance with the management and control of the dynamic development of overall urbanization intensity and ecological protection.
It is necessary to optimize the spatial structure of the urbanization area based on the existing urbanization intensity zoning while considering the interactive effect of urban climate and urbanization zoning intensity. The regions of high urbanization intensity in the built-up area include zones 1, 2, and 3 of the current zoning structure, which are also the UHI agglomeration area. To alleviate the effects of the urban heat island, the built-up area should take into account the rational partitions for the different grades of urbanization intensity. By controlling the spatial intensity development mode in the concentrated built-up area, ventilation corridors will be produced, and the urban fresh air from the urban cold island in the peripheral area will result in a high-density urbanization area, temperature reduction, and an improvement in the local climate effect that is caused by the urbanization. On the periphery of the built-up area, a lower urbanization intensity area will become the primary spatial intensity development mode, and a circular belt that consists of agriculture and forest land will be formed and protected. This area will be combined with the new town construction, thus enhancing the coverage and integrity of the urban cold island. In the source area of the urban cold island, the fragmented natural water and ecological space are restructured and linked to an ecological corridor that surrounds the area, thus enhancing the continuity of the large ecological matrix. The goal is to build a long-term urban fresh air supply zone. Based on these basic zoning principles that are intended to mitigate the urban heat island and optimize ventilation combined with practical zoning with the operability of an urban sub-district unit development, the zoning of urban climate-land use is reasonably delineated. Finally, five different zones of urbanization intensity that correspond to the urbanization development space structure in the Shanghai mainland area were identified. The guidance strategy for the different zonings are presented in (Figure 11).
The urbanization intensity of control zone 1 includes the areas with the highest degrees of urbanization and the regions with the highest risk of urban climate. During the process of urbanization, the zone should control the population density and should rationally arrange the renewable functions to create a healthy urbanization pattern that contributes to the development of a multi-central spatial structure to solve climate issues. When the existing distance between buildings is small and structures are densely distributed, the roughness of the near ground increases. Accordingly, the wind speed is at its lowest and the coverage area of minimum wind is significantly large. In recent years, the UHI effect has obviously increased its coverage area year-by-year, and the frequency of extreme high temperatures and precipitation has also increased. To mitigate these adverse urban climate effects, the combining of urban renewal and renovation, the rational use of urban large river corridors and open spaces, the scientific distribution of green space or the creation of green trails, the improvement of building orientation, the configuration of road directions in residential quarters in order to optimize the urban canyon effect, and the rational organization of urban ventilation in the central urban area are recommended, as they will alleviate the agglomeration of UHI and pollution gases (PM2.5, etc.). Furthermore, the distribution of priorities with respect to the public transport system and the reduction of automobile use as a primary mode of transportation are regarded as important methods for improving the anthropogenic heat emissions from the holistic healthy urbanization perspective.
The urbanization intensity of control zone 2 intensity includes those areas with higher urbanization and higher risks of urban climate. This section covers most parts of the central urban area in Shanghai and the development zone axis of the concentrated built-up area, i.e., the zone of the Baoshan-downtown partition-Hongqiao new district-the core area of Minhang district, and expands to the core development areas of the new town into the outskirts of the city. The intensity of the construction in this area is increasing with the dense distribution of high-rise buildings, which increases the roughness of the near ground area and thus reduces the wind speed. As a consequence, the urban thermal environment is growing rapidly in this part of Shanghai, which brings with it extremely high temperatures and increased precipitation. Similarly, the PM2.5 value in the nearby atmosphere has been increasing in recent years, as have winter haze days [45]. In this zone, the degree of development should be strictly limited, and the criterion of smart growth should be enforced. Accordingly, the expansion and growth around the central urban area should be completely altered within the axis zone to focus on priority development in the direction of rational growth and the unordered growth and sprawl regions should be limited. To guide the growth and development areas, urban green space and open space ventilation corridors should be reasonably organized during the construction process, and the existing densely populated areas of the region should be further evacuated into other multi-centre areas. Finally, the public transport system should be promoted.
The urbanization intensity of control zone 3 consists of the key areas for the development of urbanization in Shanghai. For the effective dispersion of the population into the newly urbanized area, rational planning and direction are necessary, as is the strict control of land use expansion and the designation of urban growth boundaries. Furthermore, to create a network of ecological spaces, it is reasonable to incorporate a spatial system and a green infrastructure system as the ventilation corridor. The traffic network in the core area of the new area should adapt the TOD (Transit-Oriented Development) development model of compact growth development and consider the rational distribution of a slow traffic system in order to reduce carbon emissions in the densely populated area. Based on urban road infrastructure and green infrastructure network policies, a moderately low carbon industry can be developed, and the newly developed area should promote the integration of a path to ensure the sustainability of the industry and the concrete urbanization of the areas. Following such reasonable and practical guidelines will promote the move of the urban population from the central urban area to the newly developed area in the suburb and form a multi-centre pattern of population distribution, resulting in the development of a the multi-centre spatial pattern during the urbanization process.
The urbanization intensity of control zone 4 comprises relatively less urbanized areas, and as such, this zone has a relatively low impact on the urban climate effect. This section is an interlaced zone between farmland and a landscape with a high concentration of buildings. Because the height and density of the buildings are relatively low, the residential areas are well ventilated. Large-scale farmland patches and large urban green spaces are the main land use types. These zones should protect and maximize their ecosystem services, as they serve two functions with respect to urban climate improvement. On the one hand, these zones can absorb greenhouse gas, relieve the heat load, and improve the air quality. On the other hand, because the ecological space extends into the residential areas, the urban development zone operates in a spatial axial pattern, and thereby improves the quality of the environment and the climate of the city. Hence, the strict control of the development of the building areas and the rational incorporation of urban forests and green spaces in this zone will contribute to the maximization of the positive effects of urban climate.
The urbanization intensity of control zone 5 consists of the least urbanized areas, with the landscape incorporating large numbers of ecological spaces that include farmland, natural lakes, and rivers. The climate conditions in zone 5 areas are optimal, with fresh, cool air. As an important protection area of ecological environment, the zone should strictly control development and construction and thus maintain the source function of the city’s natural fresh air reservoir, which acts as a fresh air supply base for the more densely populated and urbanized areas; they should also expand the existing ecological spaces, maintain the continuity of the ecological corridor on the southern seaside, and retain a good ecological barrier around zone 4.
6. Conclusions
To form the spatial pattern of urbanization in terms of adaptive climate development, the research on scientific and reasonable control of zoning strategies with respect to urbanization intensity is urgent. It is concluded that the present characteristics of the urbanization development in Shanghai still exhibits a circle layer developing mode of urban spatial structure. From the holistic development perspective, the most important measures to mitigate the UHI and improve the other urban climate effect in Shanghai are the thermal and air pressure differences between the central urban area and the suburb to import the flow of fresh air flow by controlling urbanization intensity zones 4 and 5 in the suburb, and by controlling the increase in the green space corridor system by transporting fresh air into the urban intensive construction area. Thus, through the visualization analysis of urban climate factors, the distribution of urban spatial factors, and the spatial zoning method of urbanization development, the spatial interaction analysis method that is based on spatial factors of urbanization development and urban climate factors was produced, and the spatial optimization pattern of urbanization development of the Shanghai mainland area to relieve the urban climate effects was studied. Finally, the study provides reasonable development guidance regarding urbanization intensity based on sub-district area boundaries to control the zone grades and spatial layout of the research area, and thereby improve the urbanization development pattern from a centralized pattern of an urban built-up area to a spatial axial development pattern with a multi-centre mode. The study of the zoning control of an urbanization intensity development strategy mitigates the UHI effect and improves the residential ventilation environment.
The interaction between urban climate and urbanization development is related to a complexity of both human and natural factors, many of which are difficult to control. Urban climate involves the interactions of several climatic factors, such as the comprehensive effects of air temperature, precipitation, evaporation, relative humidity, wind environment, and air pollutants, and their influence not only comes from the changes in surface cover and land use, but it is also affected by different scales of the climate systems, such as global climate change and regional climate change. With that said, the change in urban local climate requires rational optimization and effective guidance. While the metropolis is the carrier of a large population agglomeration, China is also facing the impacts and challenges of various urban issues that are brought about by rapid urbanization development. Therefore, the development process of urbanization and the coordinated development of urban climate must focus on the scientific quantitative analysis of the comprehensive effects of urbanization factors, and more research must be conducted regarding the adaptability and resilience of the urban spatial elements within a strategic development framework. The current research is based on long-term data support and the analysis and application of multiple technologies. Through the spatial and statistical analyses that were conducted using ArcGIS, this research creates an outline of the correlation of urbanization factors and urban climate factors. Through an analysis of the practical method of zoning urbanization and the technical analysis of spatial zoning, guidance regarding of the development of urbanization while taking into account the effects of climate change is formulated for the Shanghai mainland area.
This study attempted to analyze the interactive development of various urbanization development factors on urban climate effect, rather than just focusing on the only one factor, such as urban land expansion, which all had direct and indirect impacts on local climate in this research field. The interaction of multiple urbanization elements has promoted the process of urbanization. Based on the broad connotation of urbanization development, the paper constructs the evaluating index system of urbanization development relating to urban climate effect from the impact mechanism analysis of the economic, social and spatial factors. Using quantitative analysis of the importance of each urbanization indexes, four factors were the main factors in evaluating the variation change of urbanization development, e.g., the urban population density, the urban road network density, the variables of urban green space environment, and urban built-up environment, bringing to the condition change of urban climate. Therefore, the study further analyzed the spatial quantitative results of these four factors, used the method of zoning urbanization to test the relationship between each zoning and the distribution of urban climate factors, and evaluated the impact weight of the four factors in the urbanization zoning process. The goal of the study is to promote making the optimization policy of various development pattern of the urbanization factors with good impacts on urban climate in the future urbanization process of Shanghai city. It is necessary to analyze the co-movement of various factors in order to cope with the change of urban climate, so that how to integrate the different spatial elements of urbanization, and promote the cooperative development between urbanization factors and urban climate factors, are becoming a serious challenge issue. The paper explores the co-movement path and zoning development strategy for forming an optimized urban system with urban climate adaptation.
However, because relevant climatic data cannot be fully obtained, the spatial analysis is still relatively rough, and the depth of a spatial quantitative correlation analysis must be further improved. The urban population density is adapted for spatial analysis from the data obtained from the six most recent general population censuses. Accordingly, this accounts for only a rough spatial distribution of the population density based on Shanghai’s recent more stable population capacity trend. The purpose of this research is to break through the previous simple quantitative control and qualitative countermeasures for the development of urbanization and to construct a strategy for the development of rational urbanization space development that takes into account the influence of climate change. Research regarding the coordinated development of urban climate and urbanization is extremely important, and thus, open access to multiple sources of data will greatly promote the progress and the depth of future research.
Author Contributions
Y.J. designed research and wrote the paper; Y.J. and L.H. performed research and analyzed the data; and T.S. contributed to analytical design and provided advice on the whole process of study. Y.N. commented on the manuscript. All authors read and approved the~manuscript.
Funding
This research was funded by the National Natural Science Foundation of China project (Grant Nos. 51108182 and 51578344), the Key base Project of Humanities and Social Sciences from Ministry of Education in China (16JJD790012). Support was also given by the project “Research on urban green development in Shanghai” (40500-10203-542500/034/003) from Institute for Innovation and Strategic Studies of ECNU.
Acknowledgments
The open data was supported by Shanghai Meteorological Bureau. The authors would like to thank the editor and the anonymous reviewers for their helpful comments.
Conflicts of Interest
The authors declare no conflict of interest.
References
- Qing, D.; Zhang, J.; Shan, C.; Song, L. China National Assessment Report on Risk Management and Adaptation of Climate Extremes and Disasters; Science Press: Beijing, China, 2015. [Google Scholar]
- People’s Republic of China National Development and Reform Commission and the Ministry of Housing and Urban Rural Development. Action Plan for Urban Adaptation to Climate Change in China [EB/OL]. Available online: http://qhs.ndrc.gov.cn/syqhbh/201602/t20160216_792843.html (accessed on 4 February 2016).
- He, C.A. Review of Studies on Economic Cycle Co-movement. Bus. Econ. 2012, 2, 33–34. [Google Scholar]
- Yang, Q. Discussion on the issues of cooperating design. Career Horiz. 2008, 3, 65–66. [Google Scholar]
- Barberis, N.; Shleifer, A.; Wurgler, J. Comovement. J. Financ. Econ. 2005, 75, 283–317. [Google Scholar] [CrossRef] [Green Version]
- Cui, L.; Shi, J. Urbanization and its environmental effects in Shanghai, China. Urban Clim. 2012, 2, 1–15. [Google Scholar] [CrossRef]
- Jamei, E.; Jamei, Y.; Rajagopalan, P.; Ossen, D.R.; Roushenas, S. Effect of built-up ratio on the variation of air temperature in a heritage city. Sustain. Cities Soc. 2015, 14, 280–292. [Google Scholar] [CrossRef]
- Oke, T.R. City size and the urban heat island. Atmos. Environ. 1973, 7, 769–779. [Google Scholar] [CrossRef]
- Fall, S.; Niyogi, D.; Gluhovsky, A.; Pielke, S.R.A.; Kalnay, E.; Rochon, G. Impacts of land use land cover on temperature trends over the continental United States: Assessment using the North American Regional Reanalysis. Int. J. Climatol. 2010, 30, 1980–1993. [Google Scholar] [CrossRef]
- Shepherd, J.M.; Pierce, H.; Negri, A.J. Rainfall modification by major urban areas: Observations from spaceborne rain radar on the TRMM satellite. J. Appl. Meteorol. 2002, 41, 689–701. [Google Scholar] [CrossRef]
- Trusilova, K.; Jung, M.; Churkina, G.; Karstens, U.; Heimann, M.; Claussen, M. Urbanization impacts on the climate in Europe: Numerical experiments by the PSU-NCAR Mesoscale Model (MM5). J. Appl. Meteorol. Clim. 2008, 47, 1442–1455. [Google Scholar] [CrossRef]
- Zhao, S.; Da, L.; Tang, Z.; Fang, H.; Song, K.; Fang, J. Ecological consequences of rapid urban expansion: Shanghai, China. Front. Ecol. Environ. 2006, 4, 341–346. [Google Scholar] [CrossRef] [Green Version]
- Oke, T.K. Boundary Layer Climates, 2nd ed.; Rutledge: New York, NY, USA, 1988; p. 464. [Google Scholar]
- Fernando, H.J.S. Fluid dynamics of urban atmospheres in complex terrain. Ann. Rev. Fluid Mech. 2010, 42, 365–389. [Google Scholar] [CrossRef]
- Mouzourides, P.; Kyprianou, A.; Neophytou, M. Searching for a distinctive signature of a city: Could the MRA be the DNA of a city? In Proceedings of the 8th International Conference on Urban Climate, Dublin, Ireland, 6–10 August 2012. [Google Scholar]
- Emadodin, I.; Taravat, A.; Rajaei, M. Effects of urban sprawl on local climate: A. case study, north central Iran. Urban Clim. 2016, 17, 230–247. [Google Scholar] [CrossRef]
- Kim, H.; Kim, Y.K.; Song, S.K.; Lee, H.W. Impact of future urban growth on regional climate changes in the Seoul Metropolitan Area, Korea. Sci. Total Environ. 2016, 571, 355–363. [Google Scholar] [CrossRef] [PubMed]
- He, C.; Zhao, Y.; Huang, Q.; Zhang, Q.; Zhang, D. Alternative future analysis for assessing the potential impact of climate change on urban landscape dynamics. Sci. Total Environ. 2015, 532, 48–60. [Google Scholar] [CrossRef] [PubMed]
- Alexander, P.J.; Fealy, R.; Mills, G.M. Simulating the impact of urban development pathways on the local climate: A scenario-based analysis in the greater Dublin region, Ireland. Landsc. Urban Plan. 2016, 152, 72–89. [Google Scholar] [CrossRef] [Green Version]
- Department of Economic and Social Affairs. World Urbanization Prospects the 2014 Revision; United Nations: New York, NY, USA, 2014; Available online: https://www.un.org/development/desa/publications/2014-revision-world-urbanization-prospects.html (accessed on 5 June 2018).
- Ministry of Commerce of the People’s Republic of China. The Rate of Urbanization in Shanghai Ranks First in the China [EB/OL]. Available online: http://www.mofcom.gov.cn/article/resume/n/201408/20140800682921.shtml (accessed on 1 August 2014).
- Huang, Q.F.; Lu, Y.Q. The effect of urban heat island on climate warming in the Yangtze River Delta urban agglomeration in China. Int. J. Environ. Res. Public Health 2015, 12, 8773–8789. [Google Scholar] [CrossRef] [PubMed]
- Qian, C. On trend estimation and significance testing for non-Gaussian and serially dependent data: Quantifying the urbanization effect on trends in hot extremes in the megacity of Shanghai. Clim. Dyn. 2015, 47, 329–344. [Google Scholar] [CrossRef]
- Shen, Z.P.; Liang, P.; He, J.H. Analysis on the climatic characteristics of the fine structure of the urban heat island in Shanghai. Trans. Atmos. Sci. 2017, 40, 369–378. [Google Scholar]
- Tan, J.G.; Zheng, G.Y.; Tang, X.; Guo, C.; Li, L.; Song, G.; Zhen, X.; Yuan, D.; Kalkstein, A.J.; Li, F.; et al. The urban heat island and its impact on heat waves and human health in Shanghai. Int. J. Biometeorol. 2010, 54, 75–84. [Google Scholar] [CrossRef] [PubMed]
- Li, C.; Shen, D.; Dong, J.; Yin, J.; Zhao, J.; Xue, D. Monitoring of urban heat island in Shanghai, China, from 1981 to 2010 with satellite data. Arab. J. Geosci. 2014, 7, 3961–3971. [Google Scholar] [CrossRef]
- Vitousek, P.M.; Mooney, H.A.; Lubchenco, J.; Melillo, J.M. Human domination of Earth’s ecosystems. Science 1997, 277, 494–499. [Google Scholar] [CrossRef]
- Owen, T.W.; Carlson, T.N.; Gillies, R.R. An assessment of satellite remotely-sensed land cover parameters in quantitatively describing the climatic effect of urbanization. Int. J. Remote Sens. 1998, 19, 1663–1681. [Google Scholar] [CrossRef] [Green Version]
- Luck, M.; Wu, J.G. A gradient analysis of urban landscape pattern: A case study from the Phoenix metropolitan region, Arizona, USA. Landsc. Ecol. 2002, 17, 327–339. [Google Scholar] [CrossRef]
- Patz, J.; Campbell-Lendrum, D.; Holloway, T.; Foley, J.A. Impact of regional climate change on human health. Nature 2005, 438, 310–317. [Google Scholar] [CrossRef] [PubMed]
- Vanos, J.K.; Warland, J.S.; Gillespie, T.J.; Kenny, N.A. Review of the physiology of human thermal comfort while exercising in urban landscapes and implications for bioclimatic design. Int. J. Biometeorol. 2010, 54, 319–334. [Google Scholar] [CrossRef] [PubMed]
- Shanghai Statistics Bureau, Shanghai Investigation Team of National Statistics Bureau. Shanghai Statistical Yearbook 2000–2014; China Statistics Press: Beijing, China. Available online: http://www.stats-sh.gov.cn/tjnj/zgsh/nj2011.html (accessed on 29 July 2016).
- National Statistical Bureau of the People’s Republic of China. China Statistical Yearbook 2000–2014; China Statistics Press: Beijing, China. Available online: https://www.chinayearbooks.com/ (accessed on 30 July 2016).
- State Forestry Administration. China Forestry Statistics Yearbook 2000–2014; China Forestry Press: Beijing, China. Available online: http://www.shujuku.org/ china-forestry-statistical-yearbook.html (accessed on 30 July 2016).
- National Statistical Bureau of the People’s Republic of China. Resident Population Data of SIX VILLAGES and Towns Streets in Shanghai in 2010 (Bulletin Version); China Statistics Press: Beijing, China. Available online: http://www.stats-sh.gov.cn/html/sjfb/201202/239823.html (accessed on 10 February 2016).
- Xu, Z.; Zhuang, D.; Yang, L. Construction and Application of Regional Quantitative Model of Human Activity Intensity. J. Geo-Inf. Sci. 2012, 11, 452–460. [Google Scholar] [CrossRef]
- Zhang, C.; Wang, Z. Quantitative Assessment of Human Activity Intensity in The Heihe Catchment. Adv. Earth Sci. 2004, 19, 394–398. [Google Scholar]
- Wang, J.; Zhang, G.; Nie, Z.; Yan, M. Quantitative assessment of Human Activity Intensity in Hutuohe Catchment. J. Arid Land Resour. Environ. 2009, 23, 41–44. [Google Scholar]
- Wen, Y. Preliminary Study on Quantitative Evaluation Method of Human Activity Intensity. Impact Sci. Soc. 1998, 4, 56–61. [Google Scholar]
- Li, X.; Wang, L.; Zhang, Y.; Zhang, H. Analysis of Roles of Human Activities in Land Desertification in Arid Area of Northwest China. Sci. Geogr. Sin. 2004, 24, 68–75. [Google Scholar]
- Chen, H.; Yang, B.; Wang, Z. Quantitative research of human activity intensity in Wuwei City. Ningxia Eng. Technol. 2011, 10, 94–96. [Google Scholar]
- Peng, B.; Shi, Y.; Wang, H.; Wang, Y. The impacting mechanism and laws of function of urban heat islands effect: A case study of Shanghai. Acta Geogr. Sin. 2013, 68, 1461–1471. [Google Scholar]
- Wang, G.; Shen, X. Relationship between urbanization and heat island effect in Shanghai. J. Subtrop. Resour. Environ. 2010, 5, 1–11. [Google Scholar]
- Cheng, Y.; Wang, B. Temporal and spatial distribution and contamination assessment of PM2.5 in Shanghai. Comput. Appl. Chem. 2014, 10, 1189–1192. [Google Scholar]
- Chen, L.; Ma, J.; Zhen, X.; Cao, Y. Variation characteristics and teorological influencing factors of air pollution in Shanghai. J. Meteorol. Environ. 2017, 33, 59–67. [Google Scholar]
Figure 1.
The ten largest urban agglomerations in 2014 show varied growth patterns both in the recent past and in future projections [20].
Figure 1.
The ten largest urban agglomerations in 2014 show varied growth patterns both in the recent past and in future projections [20].

Figure 2.
The 15 administrative districts and the distributions of different developing intensity of built-up area in mainland area of Shanghai. Left map: the comprised districts in mainland area of Shanghai; Right map: the covered area of built-up areas in different developing level.
Figure 2.
The 15 administrative districts and the distributions of different developing intensity of built-up area in mainland area of Shanghai. Left map: the comprised districts in mainland area of Shanghai; Right map: the covered area of built-up areas in different developing level.

Figure 3.
The variables comparison of the development changes between four urbanization factors and the urban utmost highest air temperature within fifteen years (2000–2014).
Figure 3.
The variables comparison of the development changes between four urbanization factors and the urban utmost highest air temperature within fifteen years (2000–2014).

Figure 4.
The stacked line diagram showed the closely related tendancy by analysing the overall growth level index of Urbanization Intensity Comprehensive Index (UICI) and the utmost highest air temperature.
Figure 4.
The stacked line diagram showed the closely related tendancy by analysing the overall growth level index of Urbanization Intensity Comprehensive Index (UICI) and the utmost highest air temperature.

Figure 5.
The spatial distribution map of urbanization factors based on the interactive effects of urban climate in the mainland area of Shanghai. (a) spatial distribution of population density; (b) spatial distribution of the albedo data in the mainland area of Shanghai; and, (c) spatial distribution of Normalized Difference Vegetation Index (NDVI) data; (d) spatial distribution of urban road network density.

Figure 6.
Spatial distribution map of urban climatic factors in the mainland area of Shanghai. (a) annual average temperature; (b) annual average precipitation; (c) annual average relative humidity; and, (d) annual average maximum wind speed.
Figure 6.
Spatial distribution map of urban climatic factors in the mainland area of Shanghai. (a) annual average temperature; (b) annual average precipitation; (c) annual average relative humidity; and, (d) annual average maximum wind speed.

Figure 7.
The urban surface temperature of the mainland area of Shanghai on 28 May 2014.

Figure 8.
The comprehensive urbanization classification in the mainland area of Shanghai.

Figure 9.
The spatial overlay analysis of comprehensive urbanization zoning and urban climatic factors in the mainland area of Shanghai (a) classification zones and annual air temperatures; (b) classification zones and annual precipitation; (c) classification zones and annual RH (Relative Humidity); and, (d) classification zones and annual maximum wind speeds.

Figure 10.
Spatial overlay analysis between zoning classification and surface temperature of the mainland area of Shanghai on 28 May 2014.
Figure 10.
Spatial overlay analysis between zoning classification and surface temperature of the mainland area of Shanghai on 28 May 2014.

Figure 11.
The distribution guidance of the urbanization development intensity in Shanghai mainland area. Left map: the spatial structure of urbanization development for climate adaptive planning. Right map: controlling suggestion for the grade distribution of the urbanization development at the community subdistrict level.


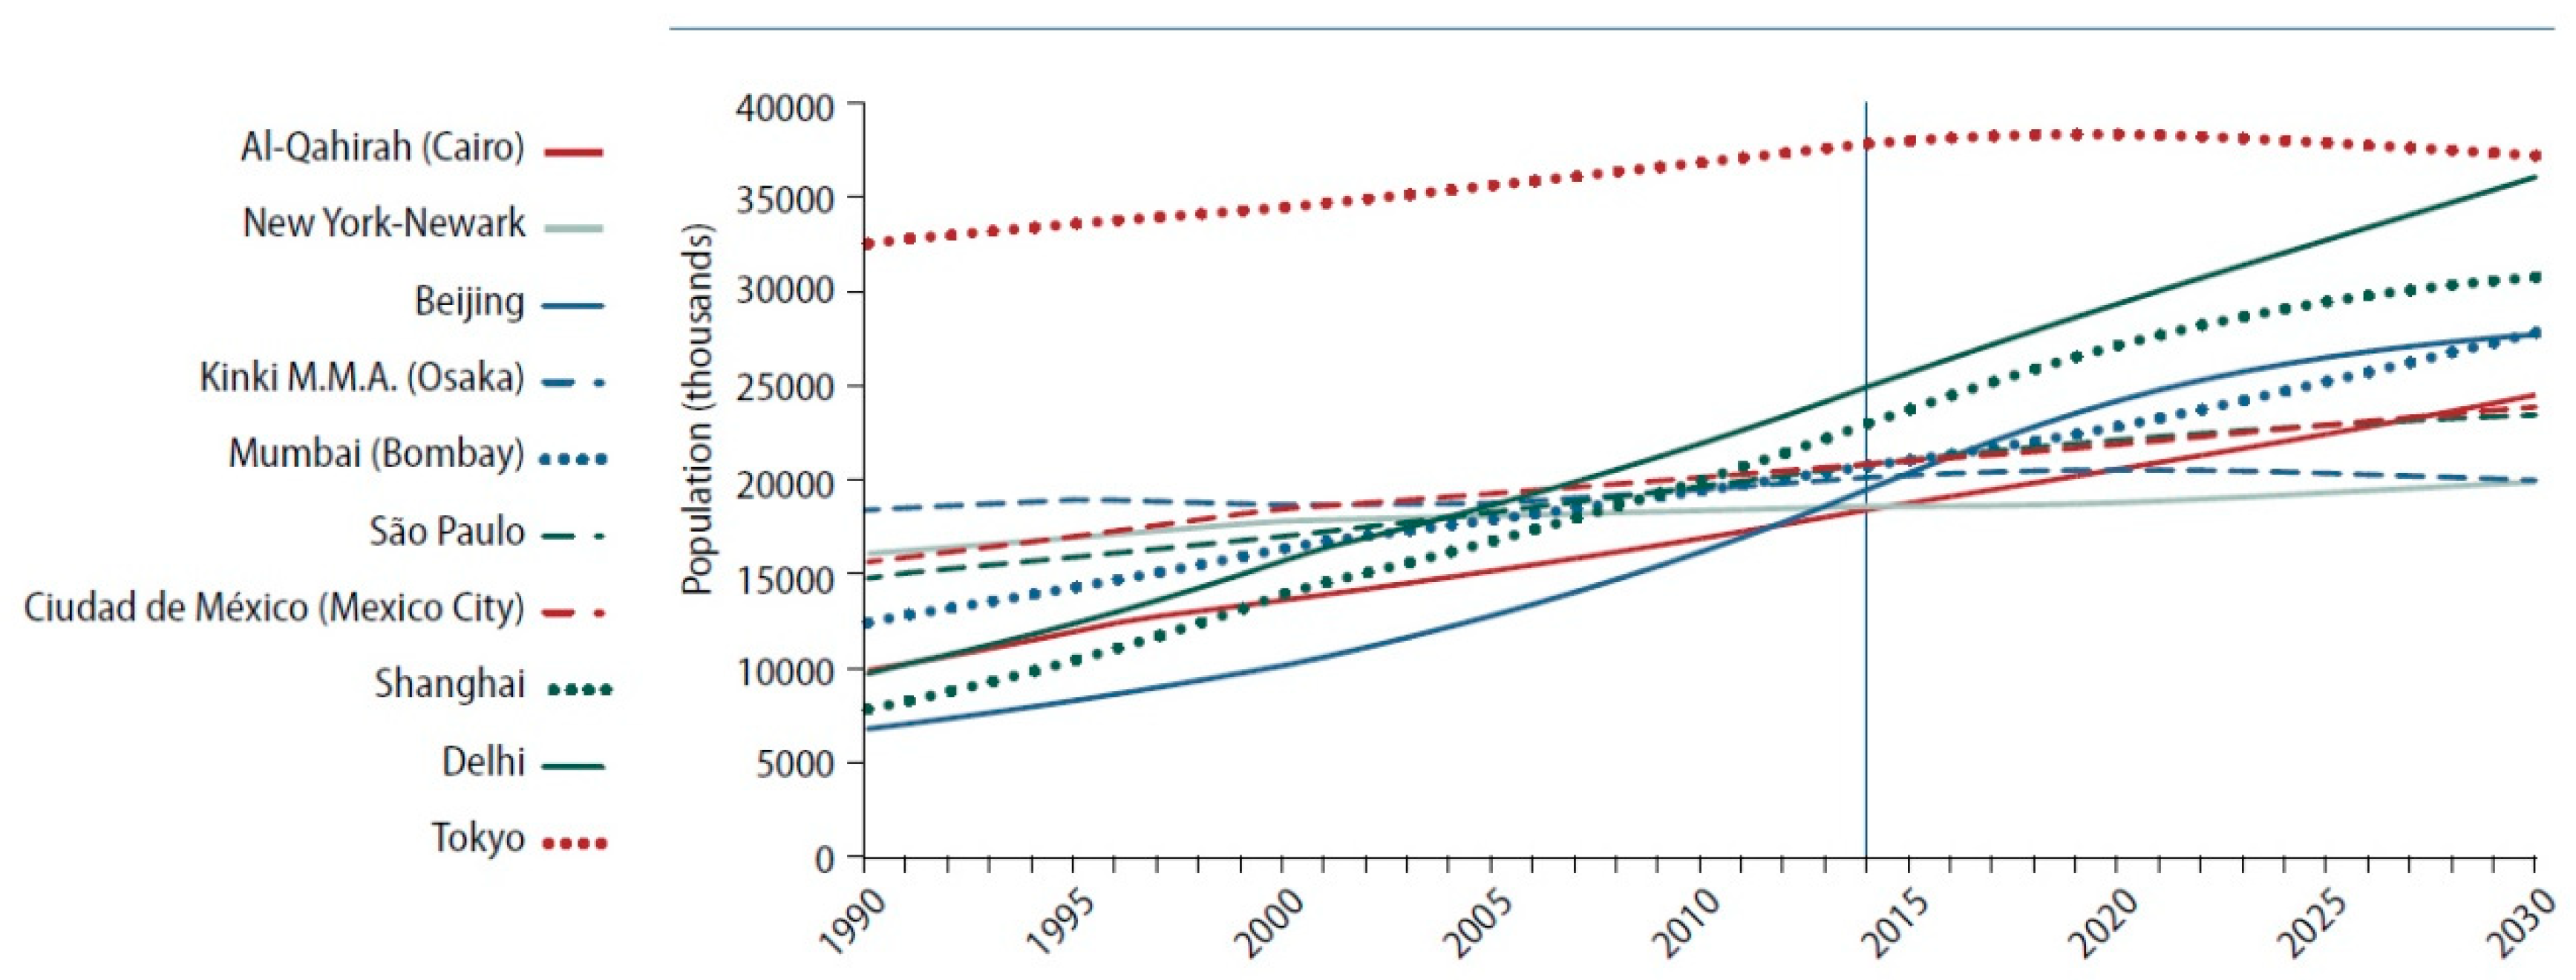
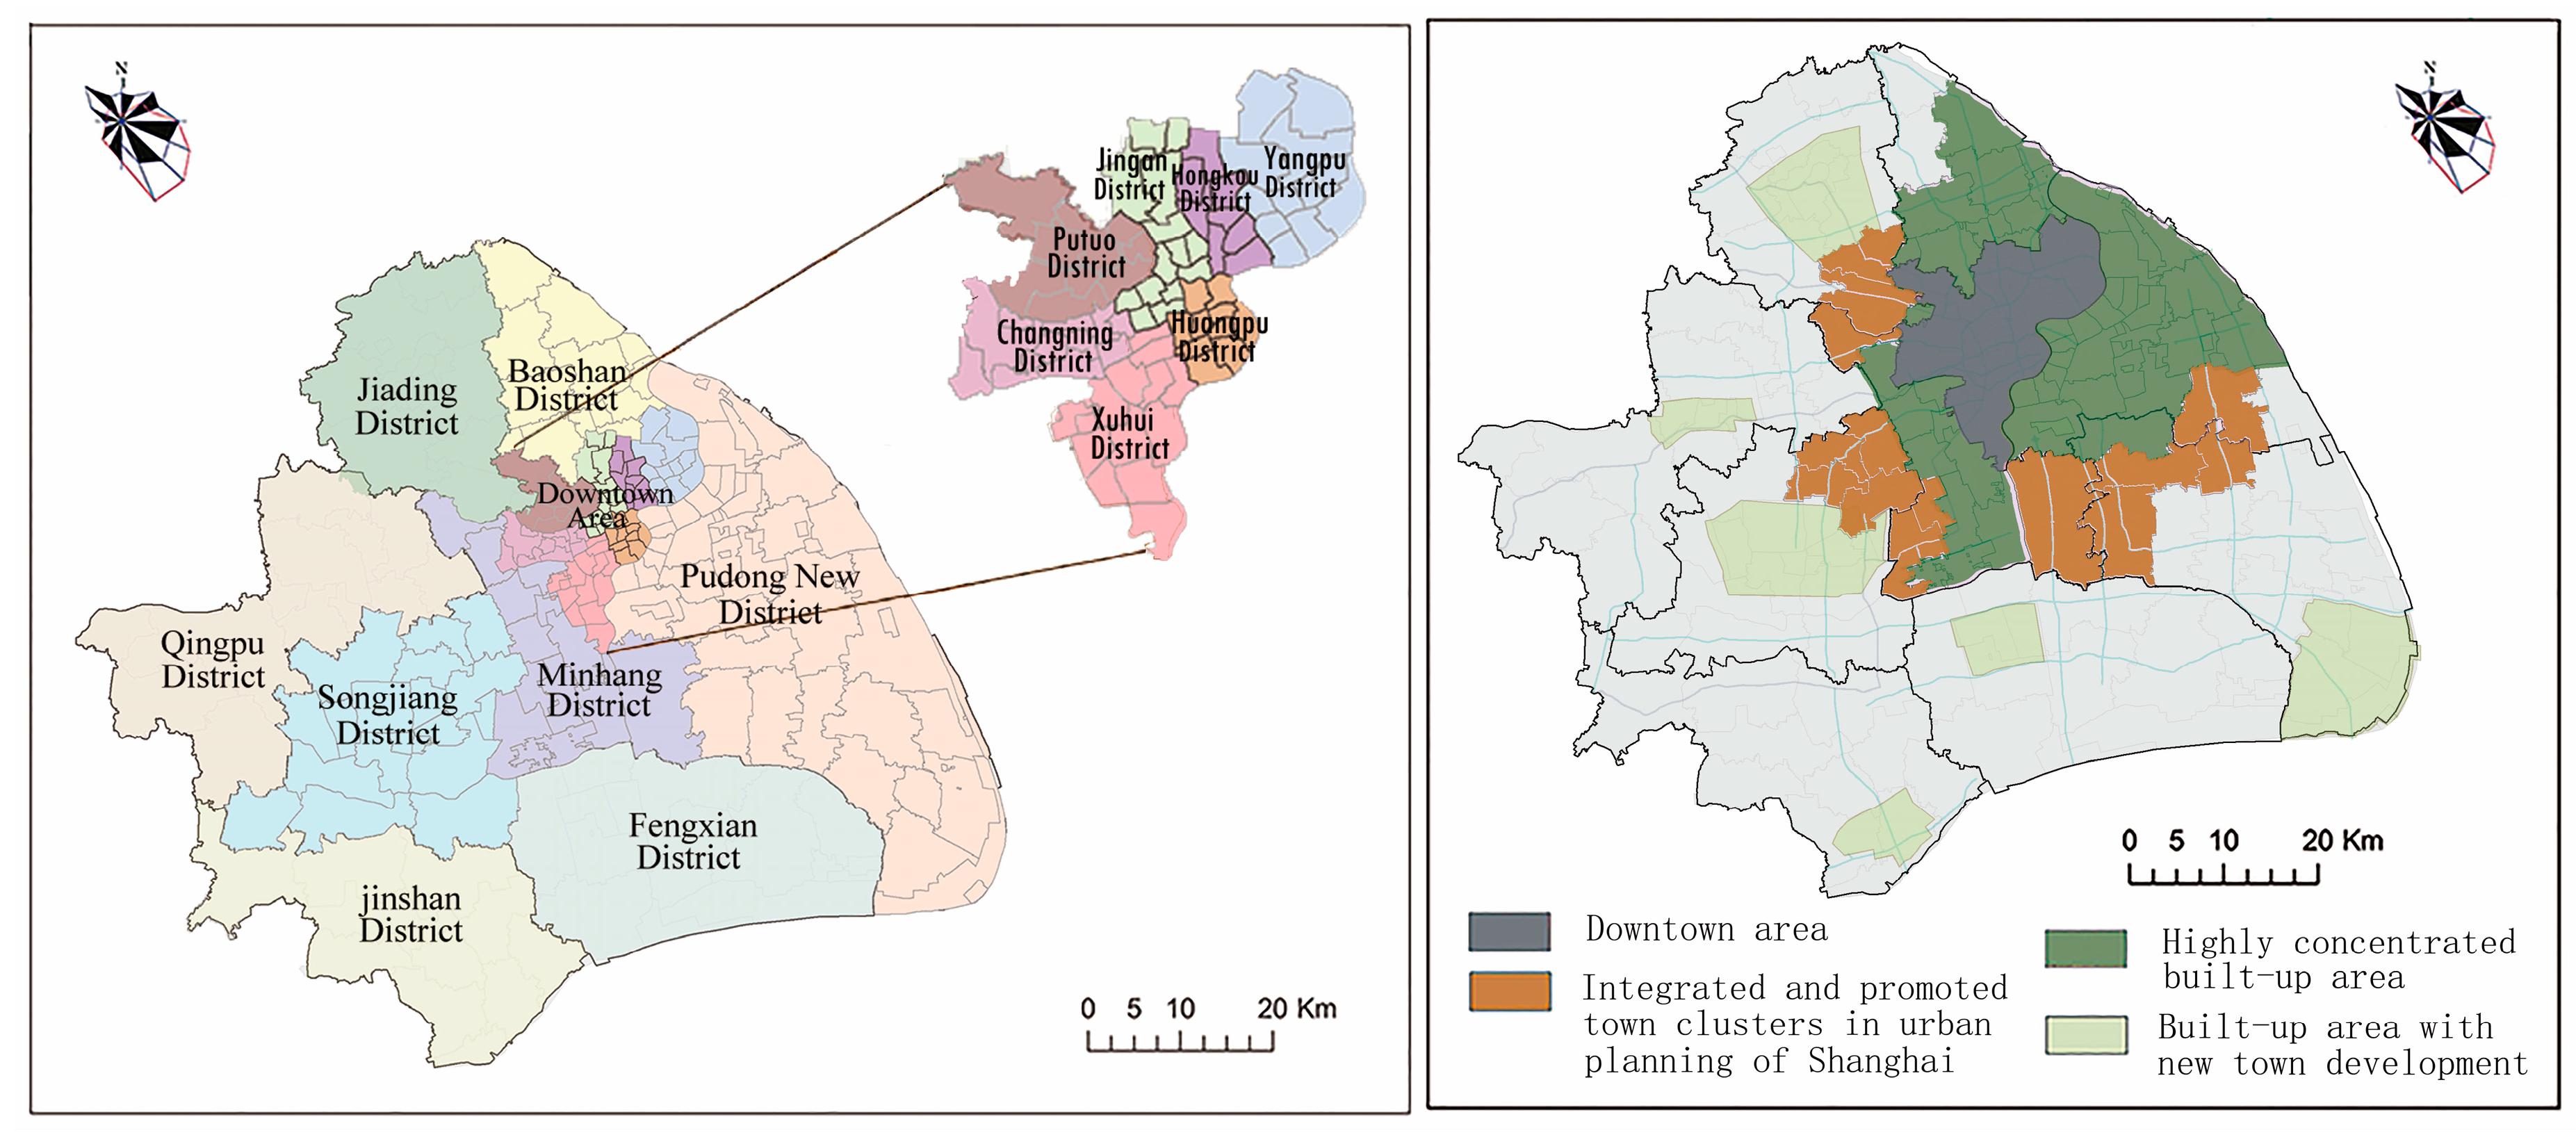
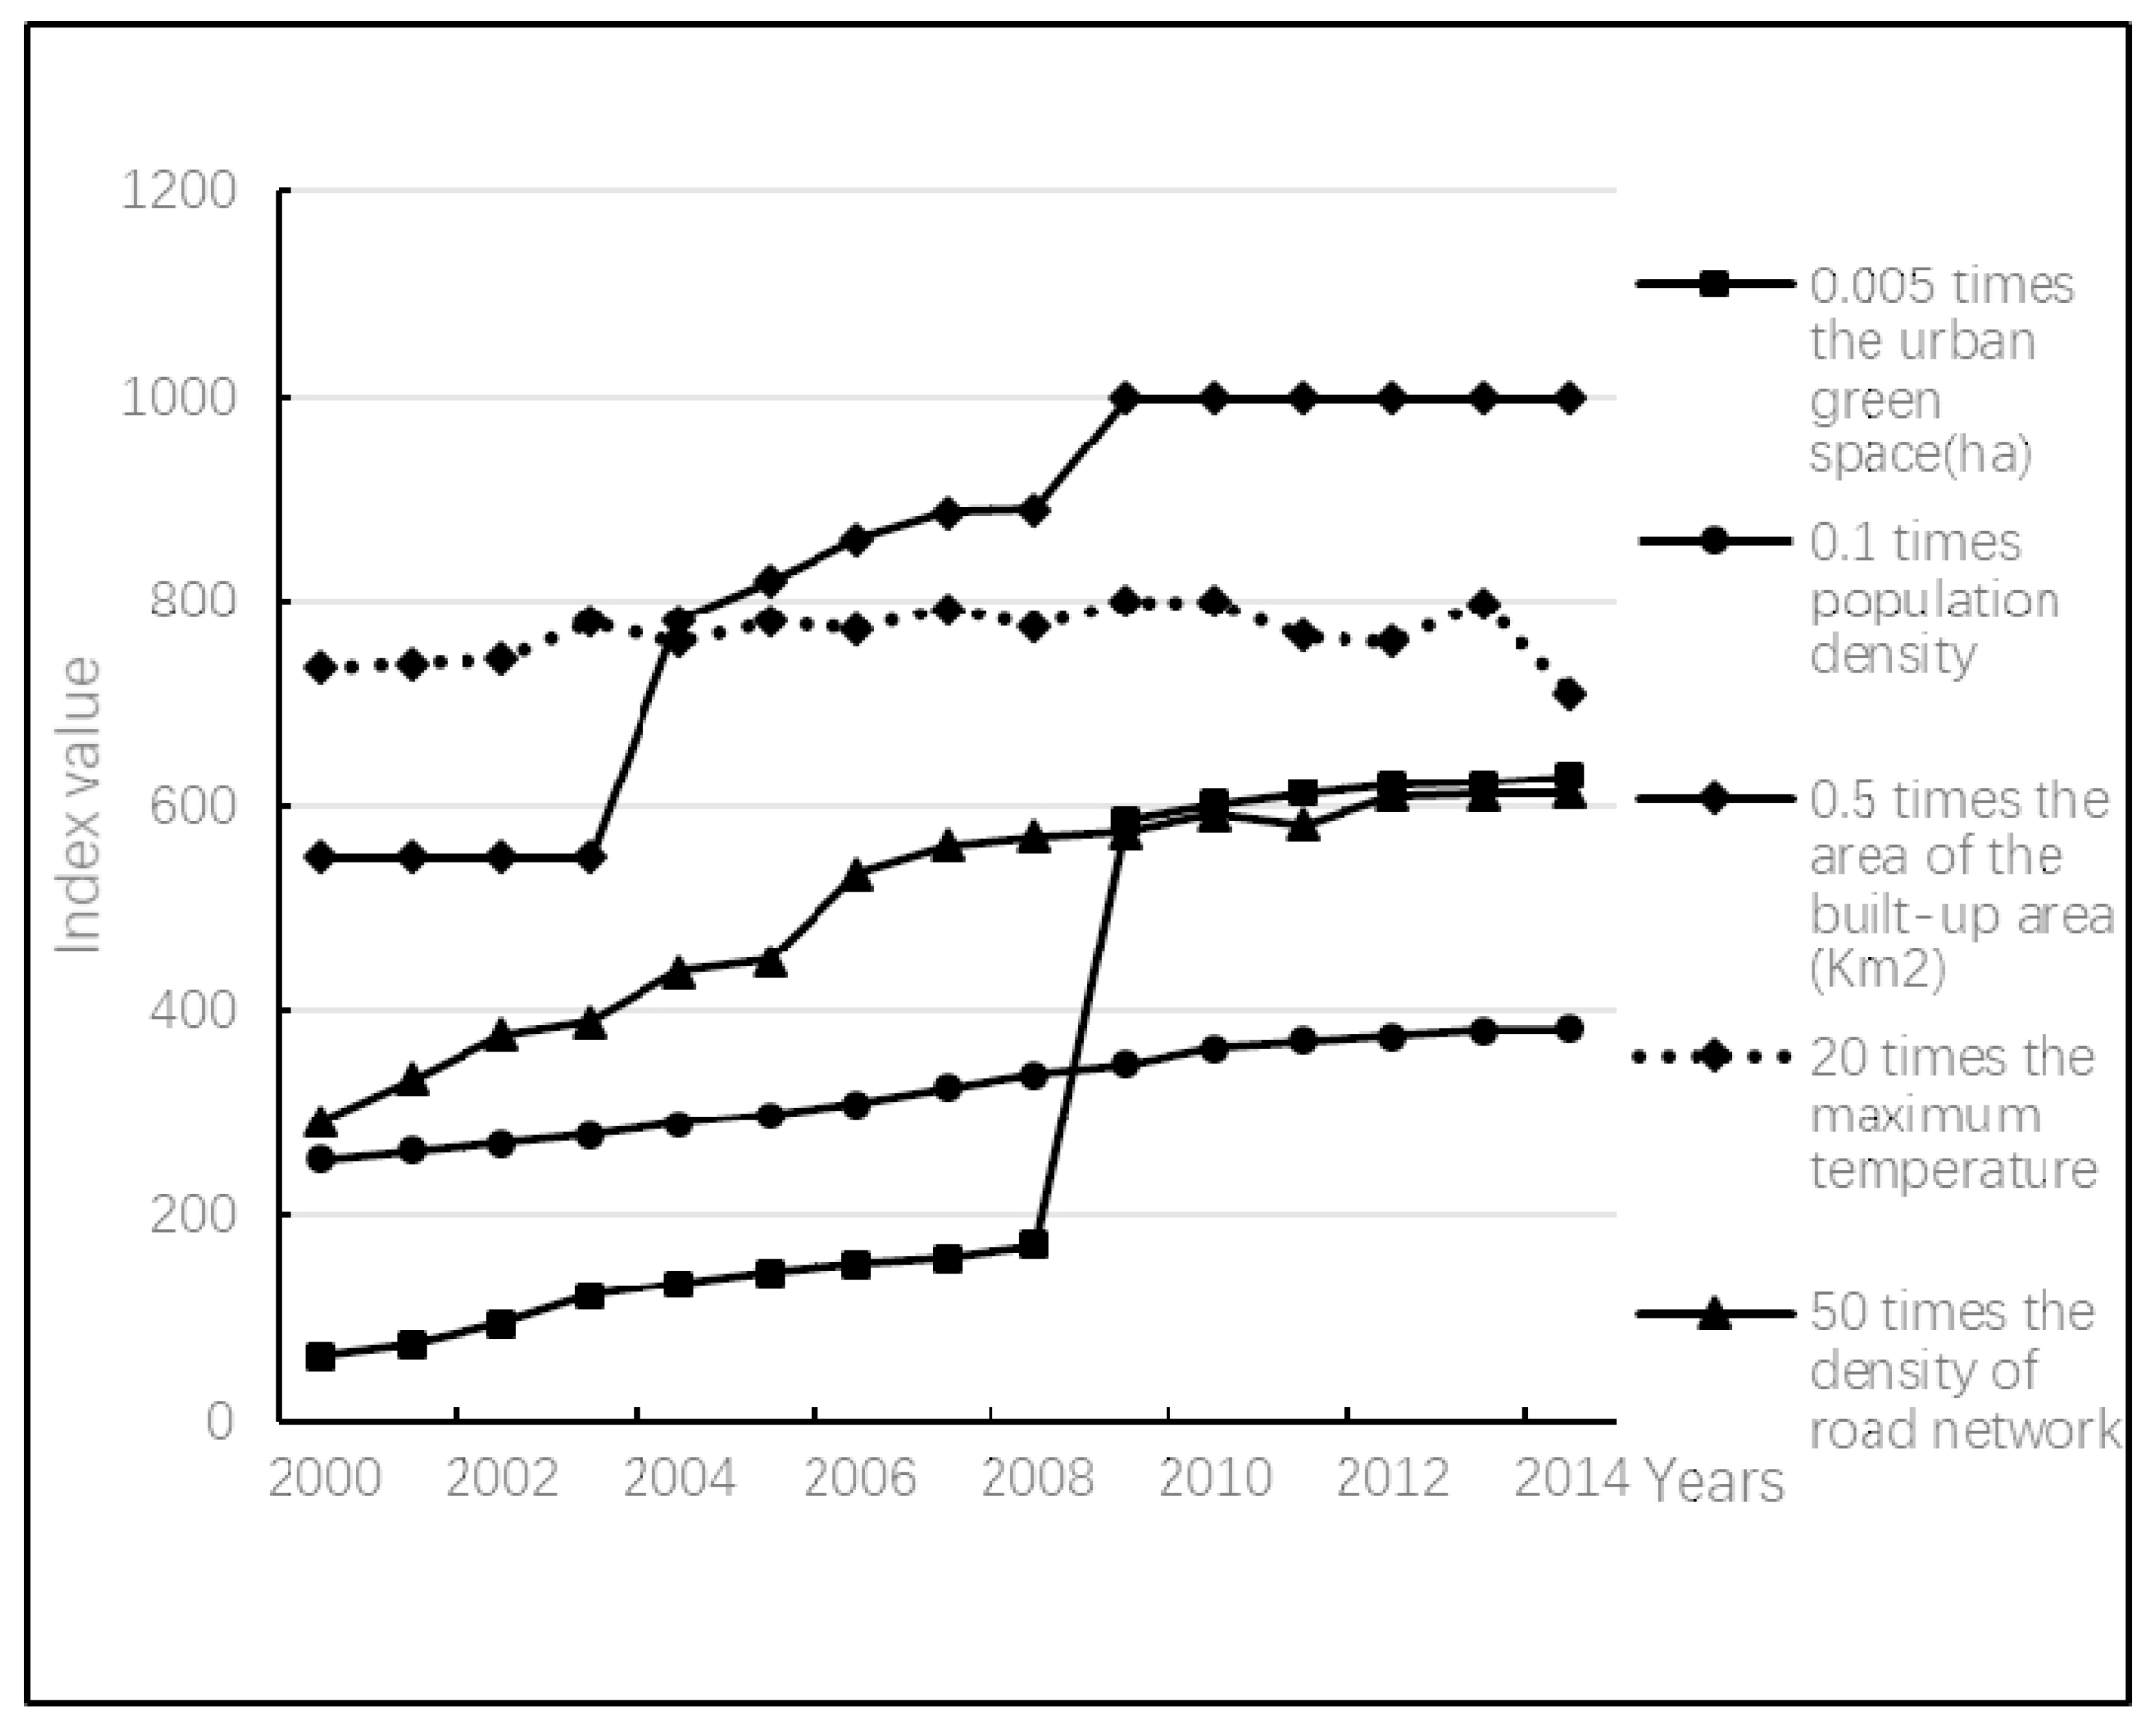
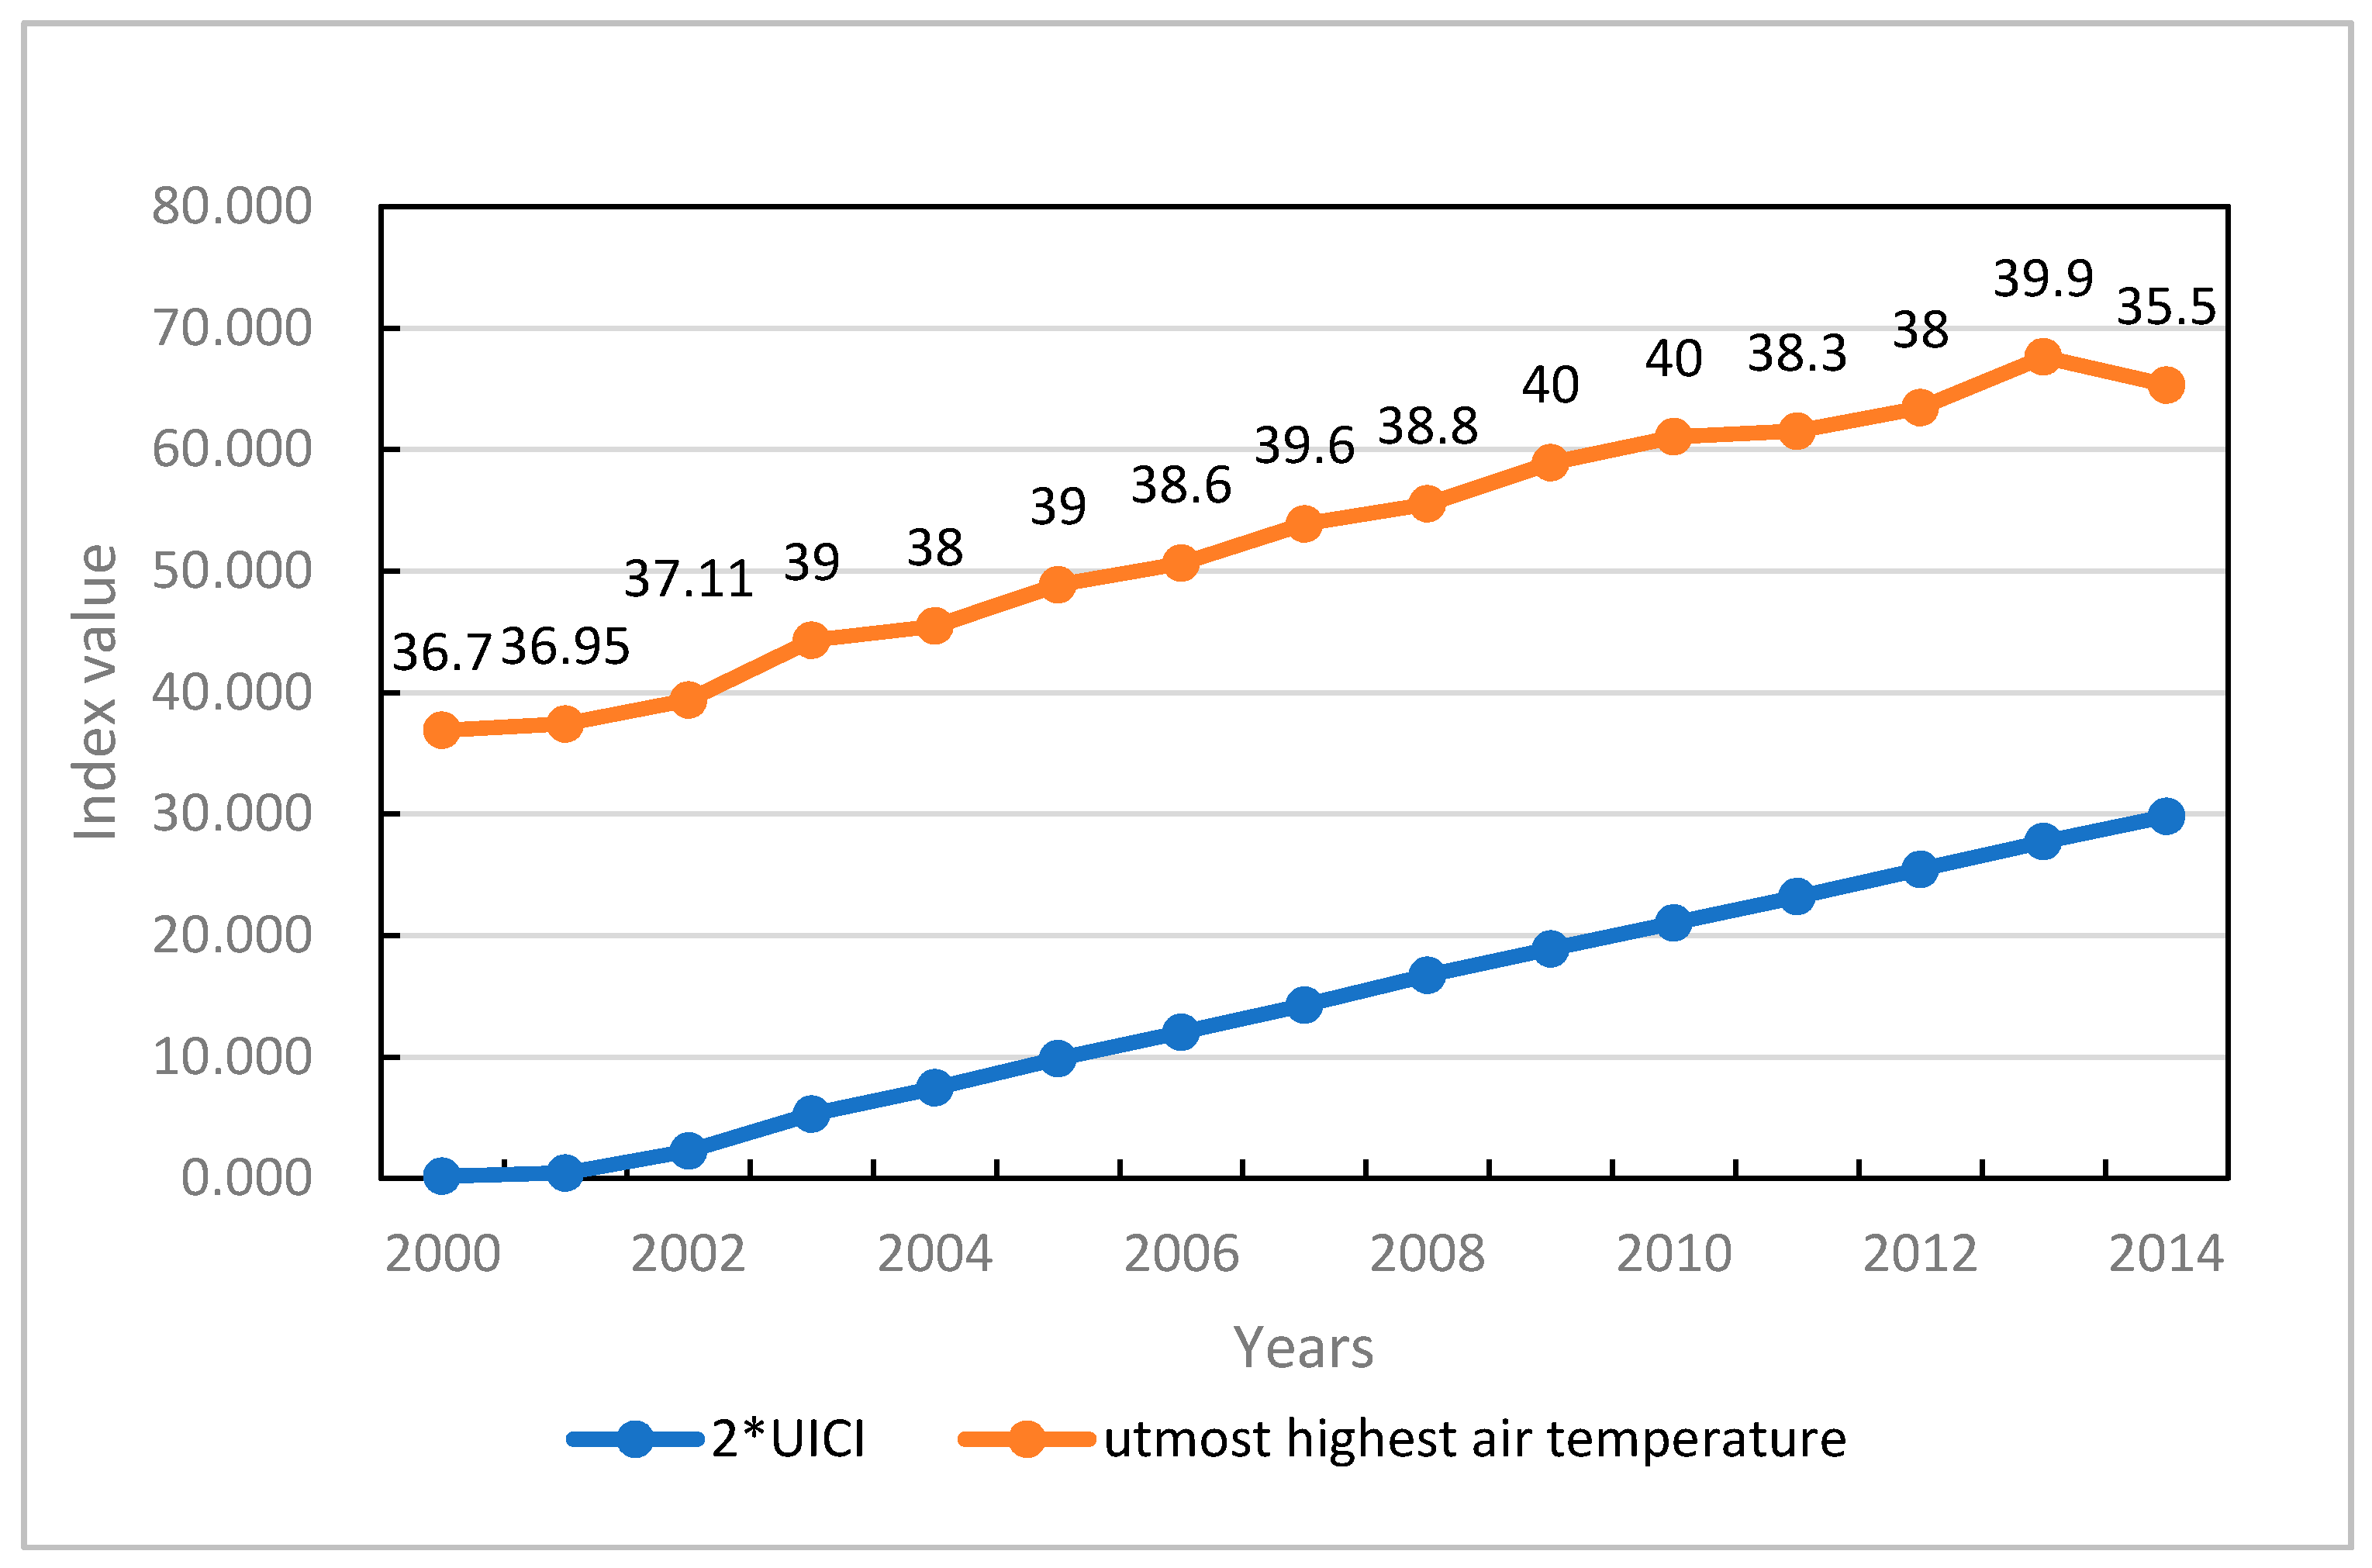
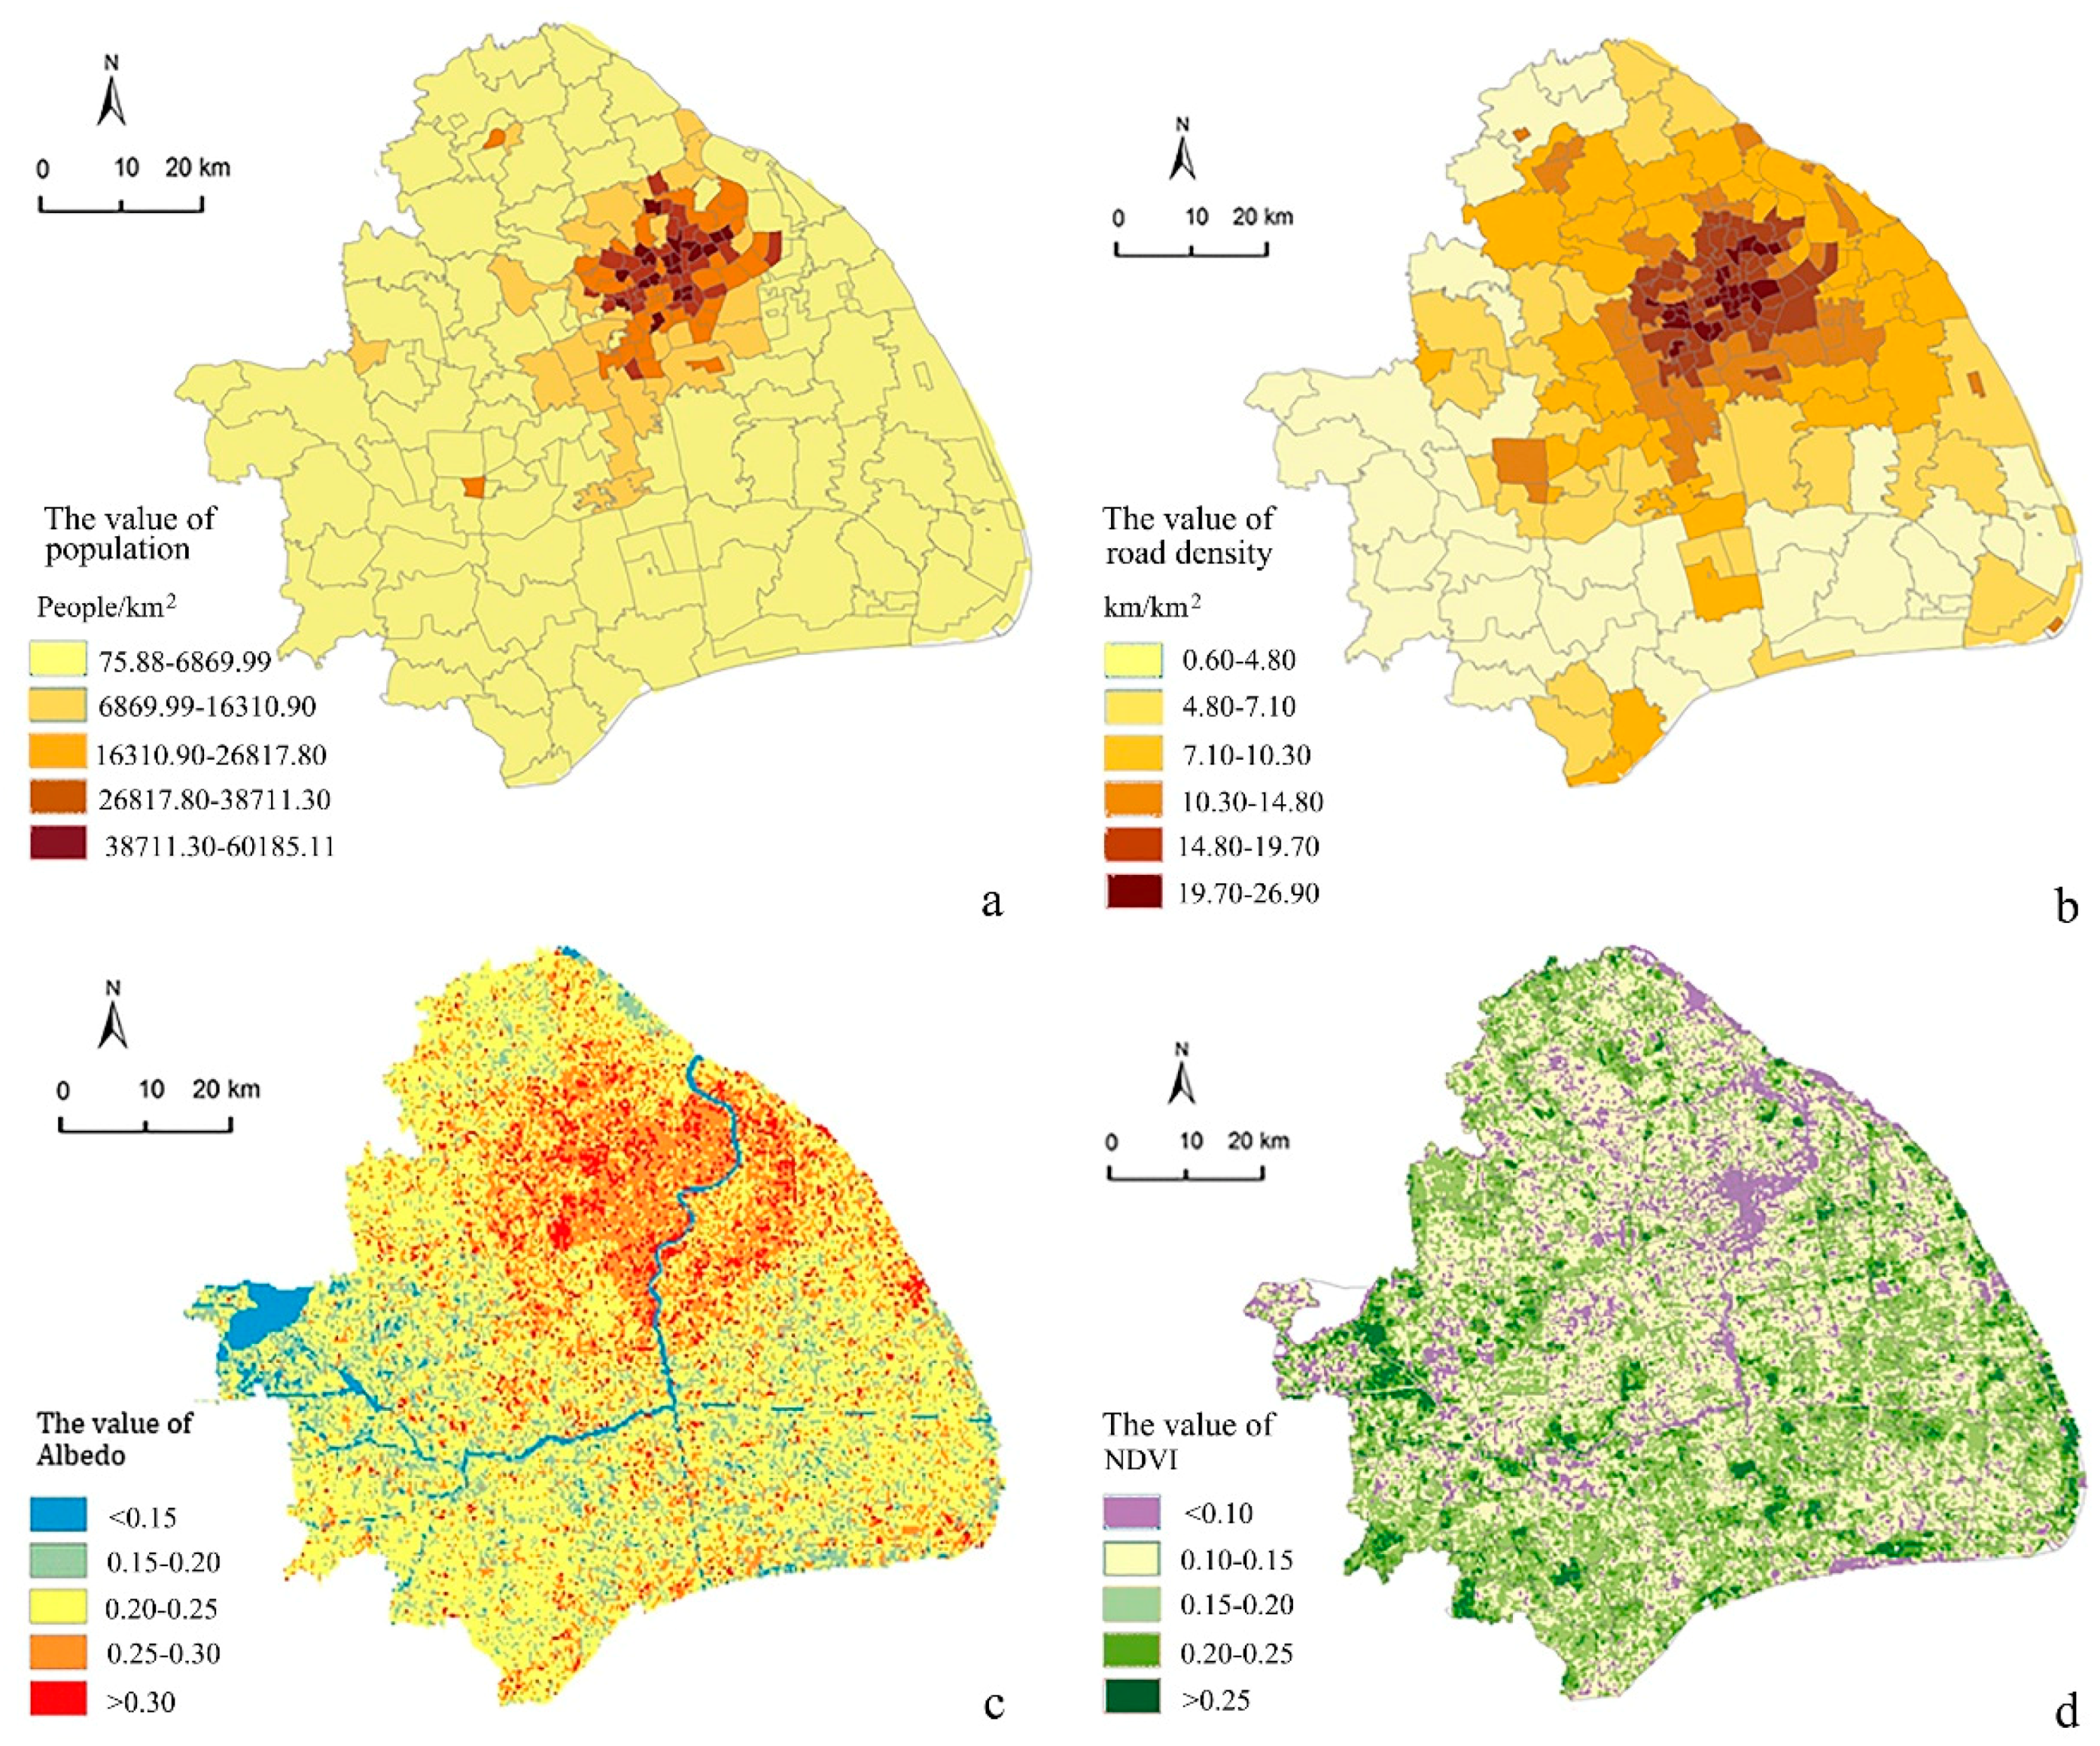
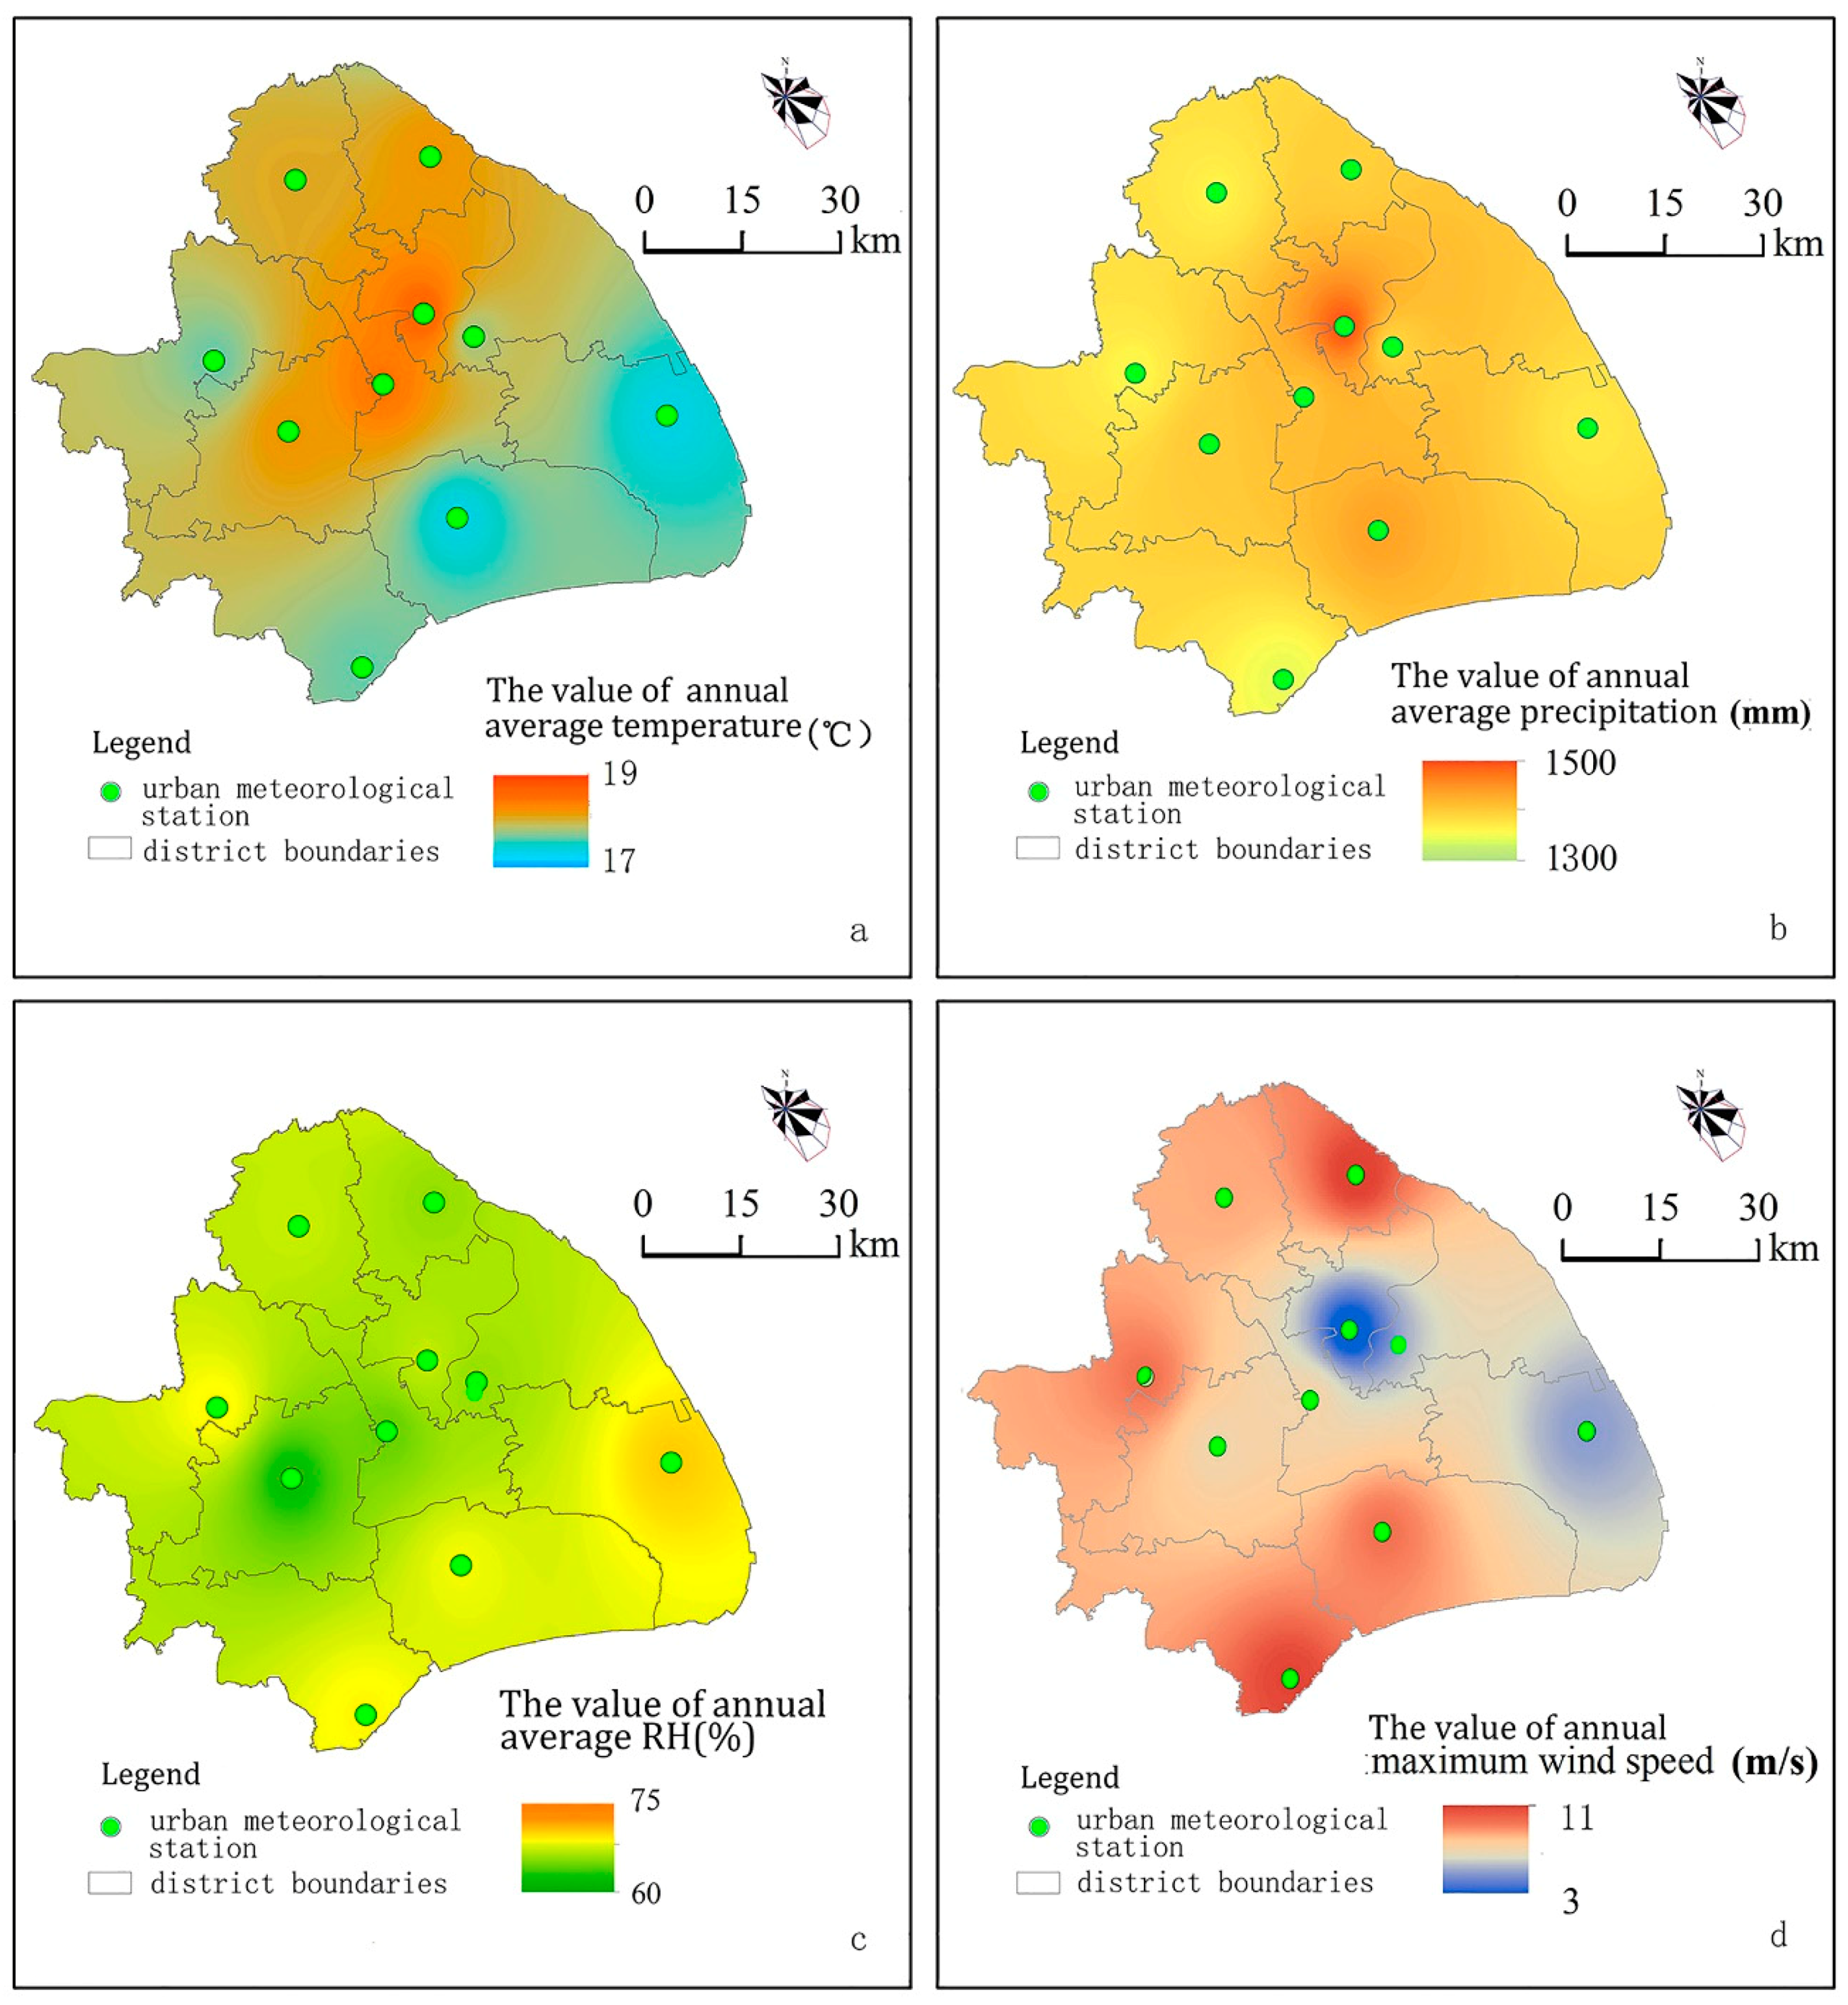
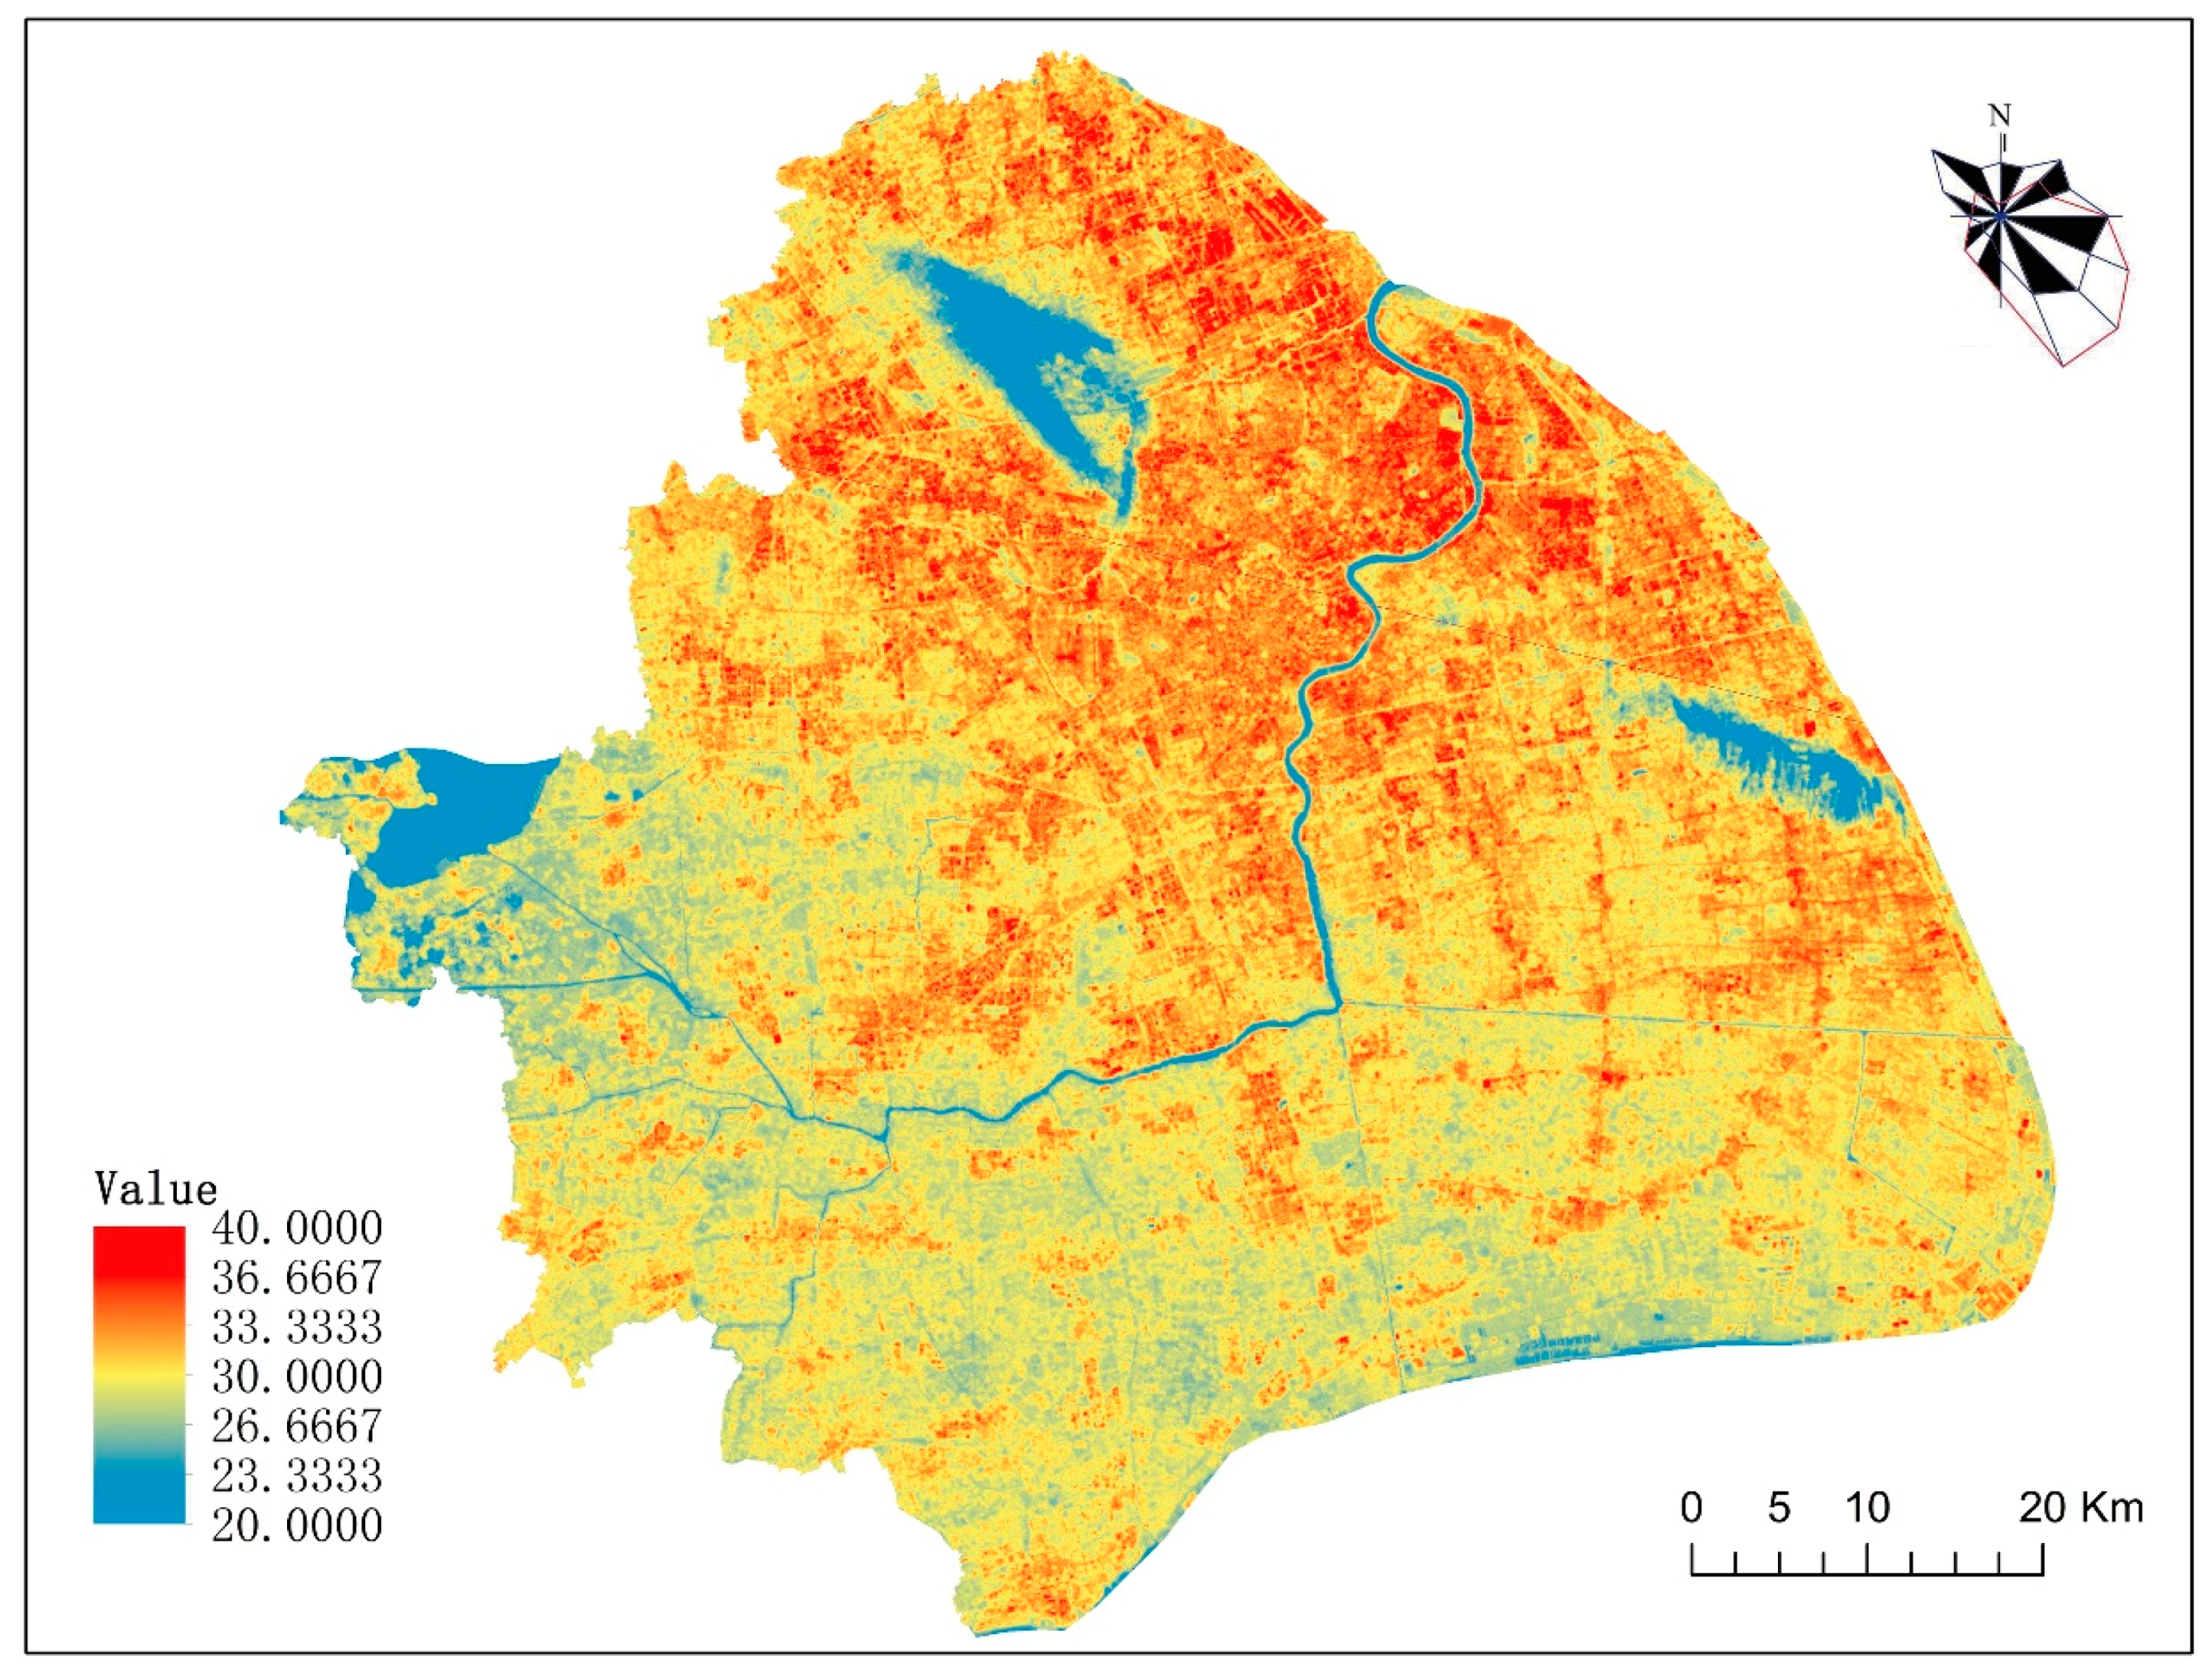
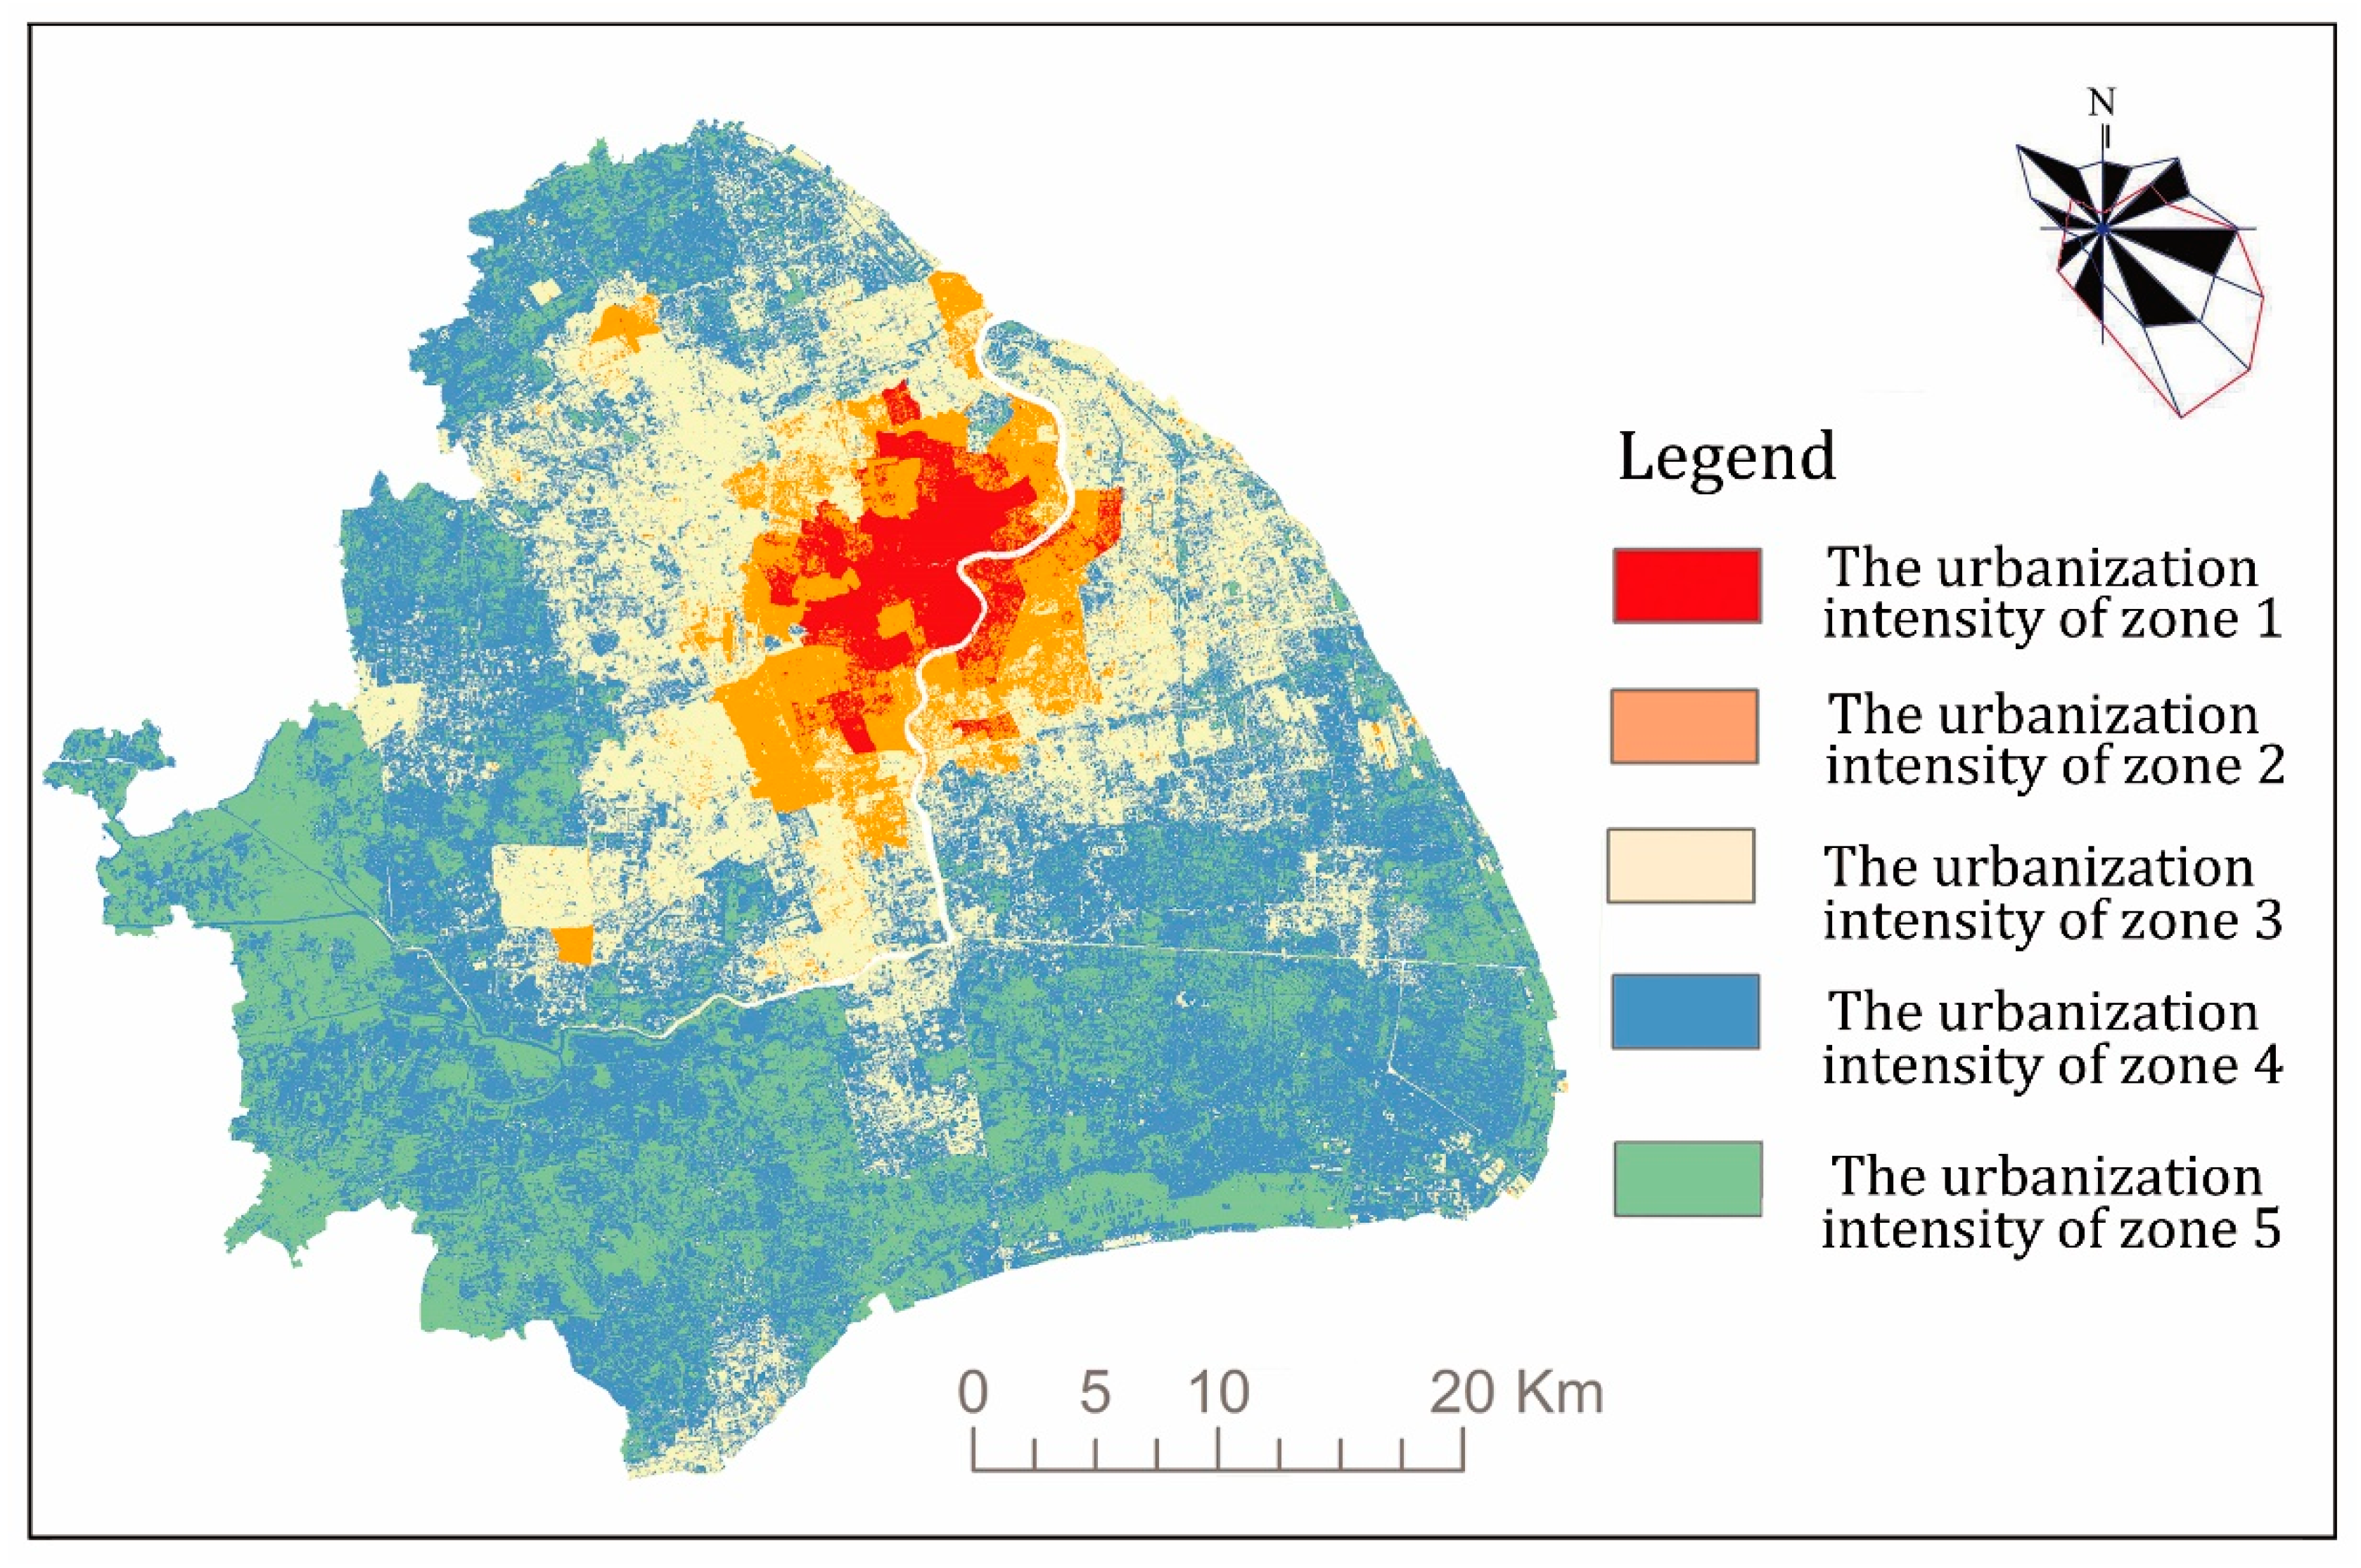
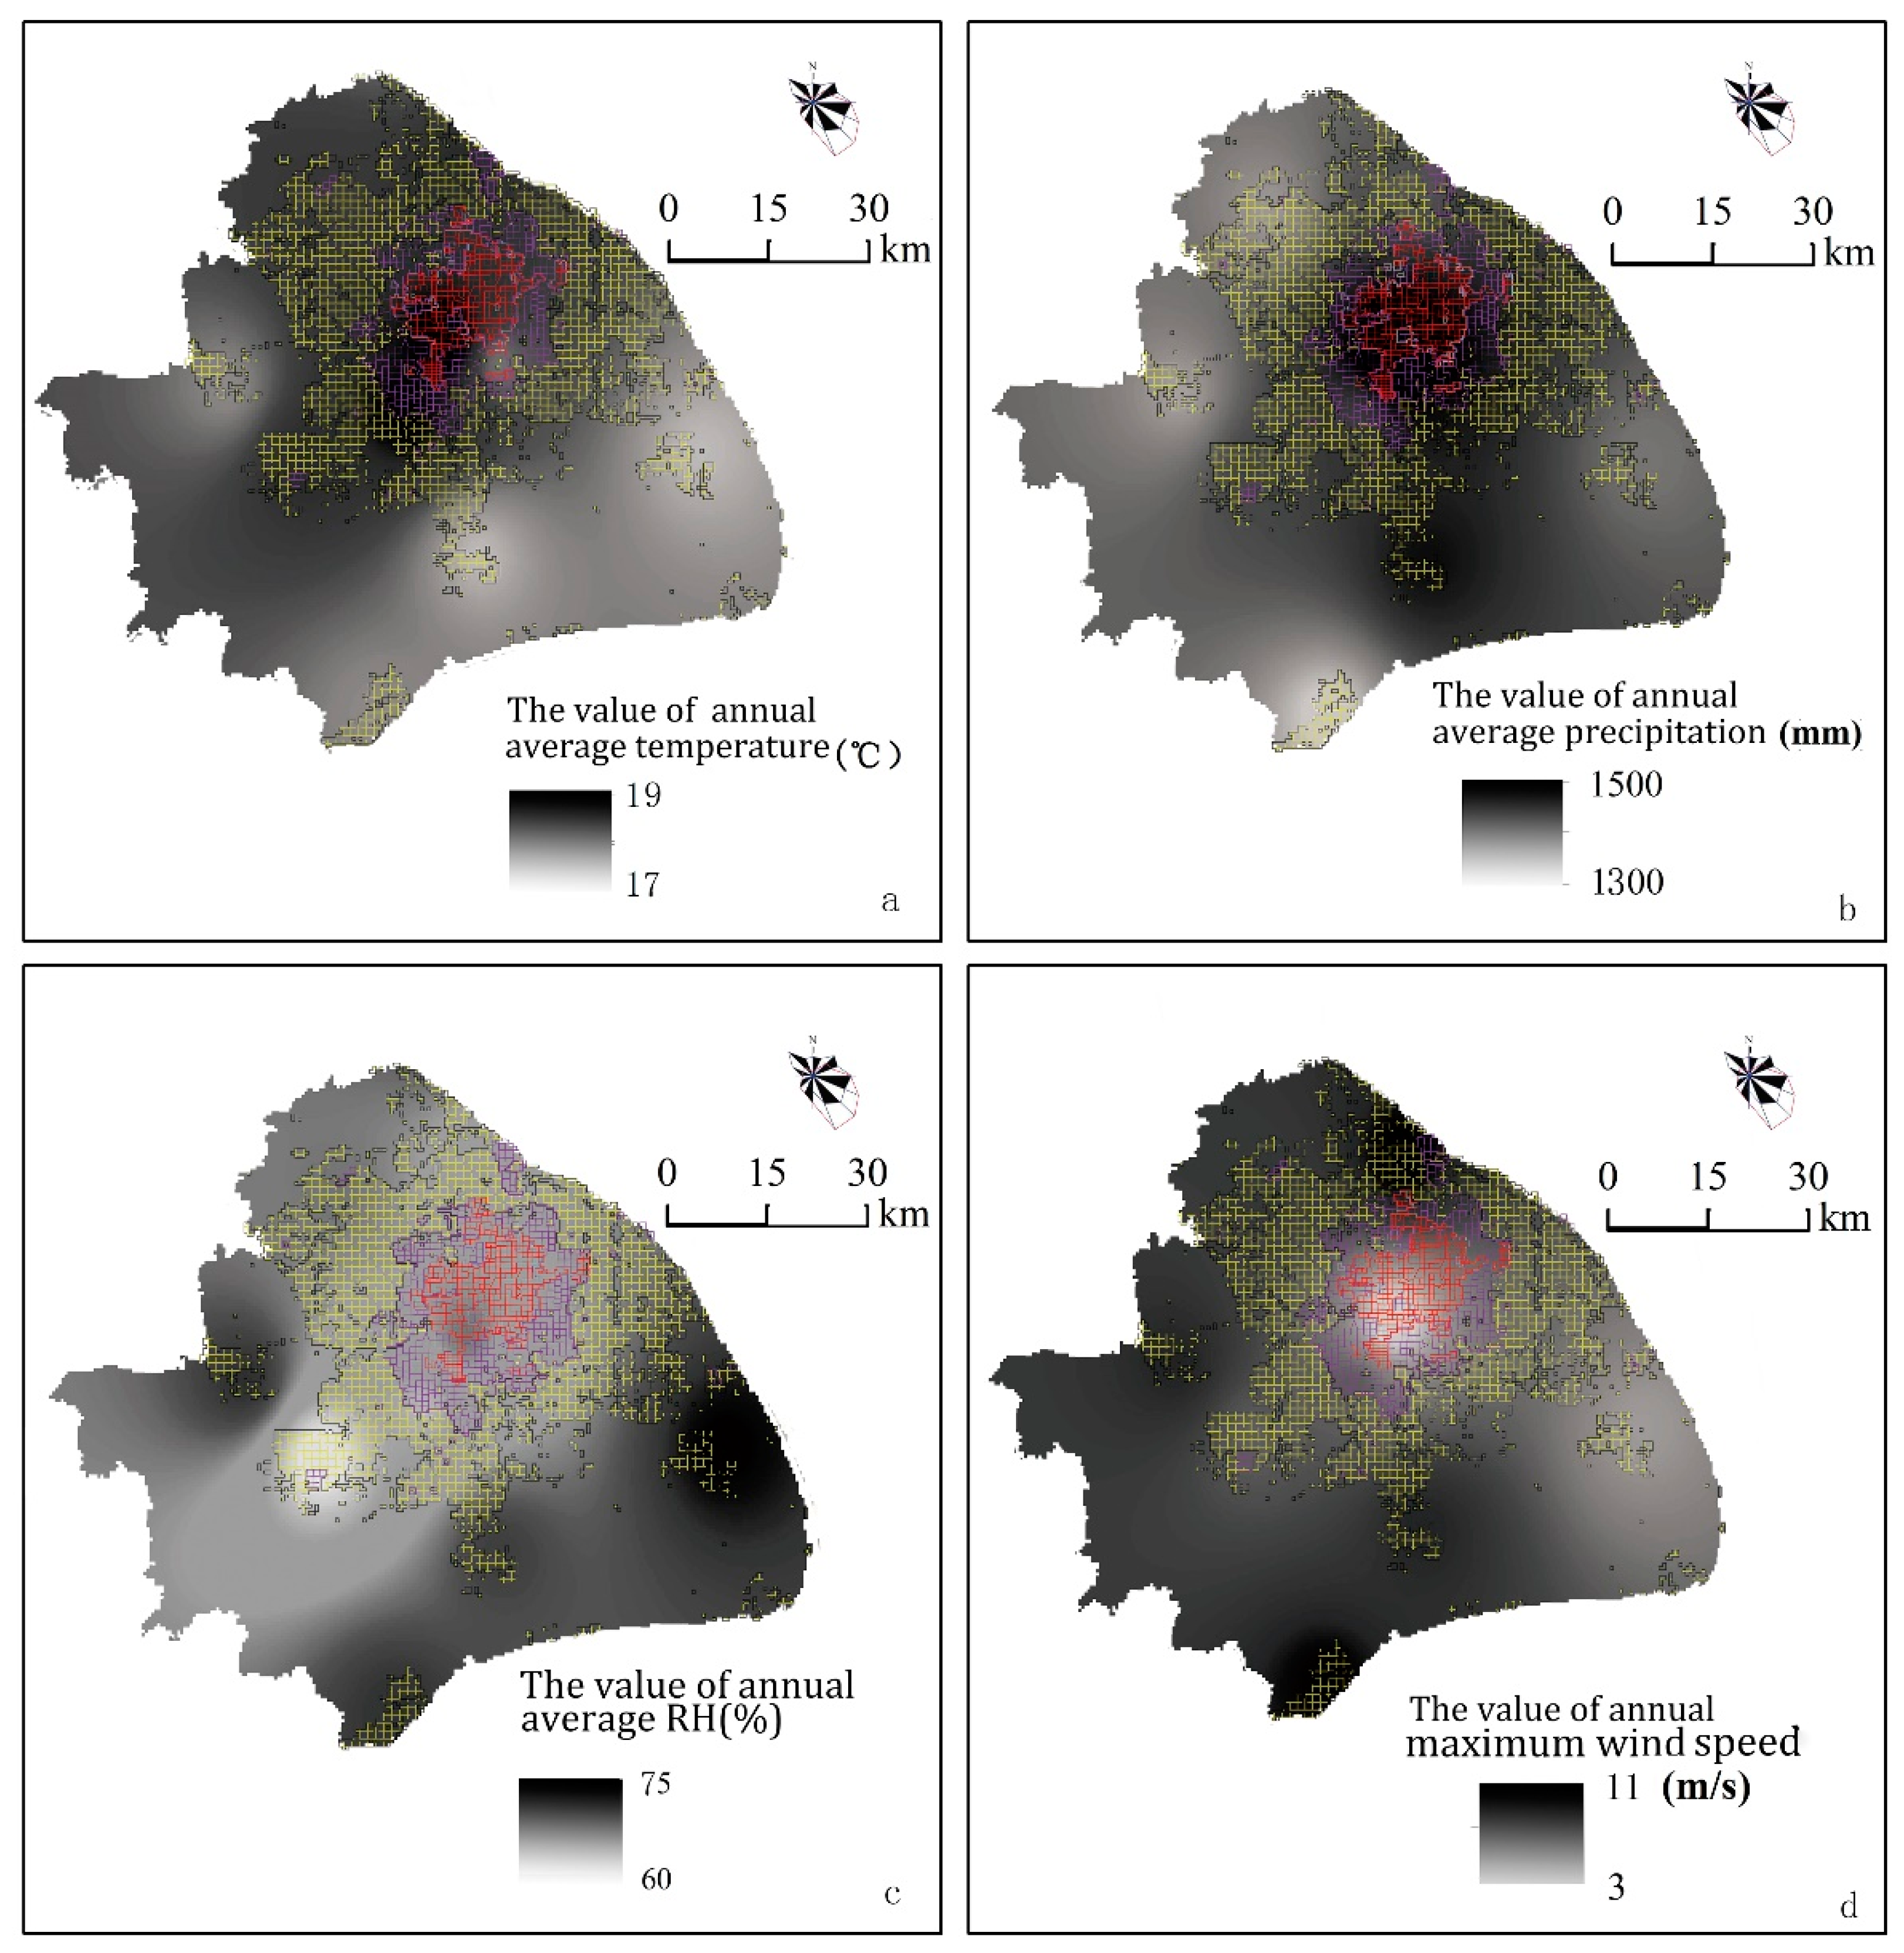
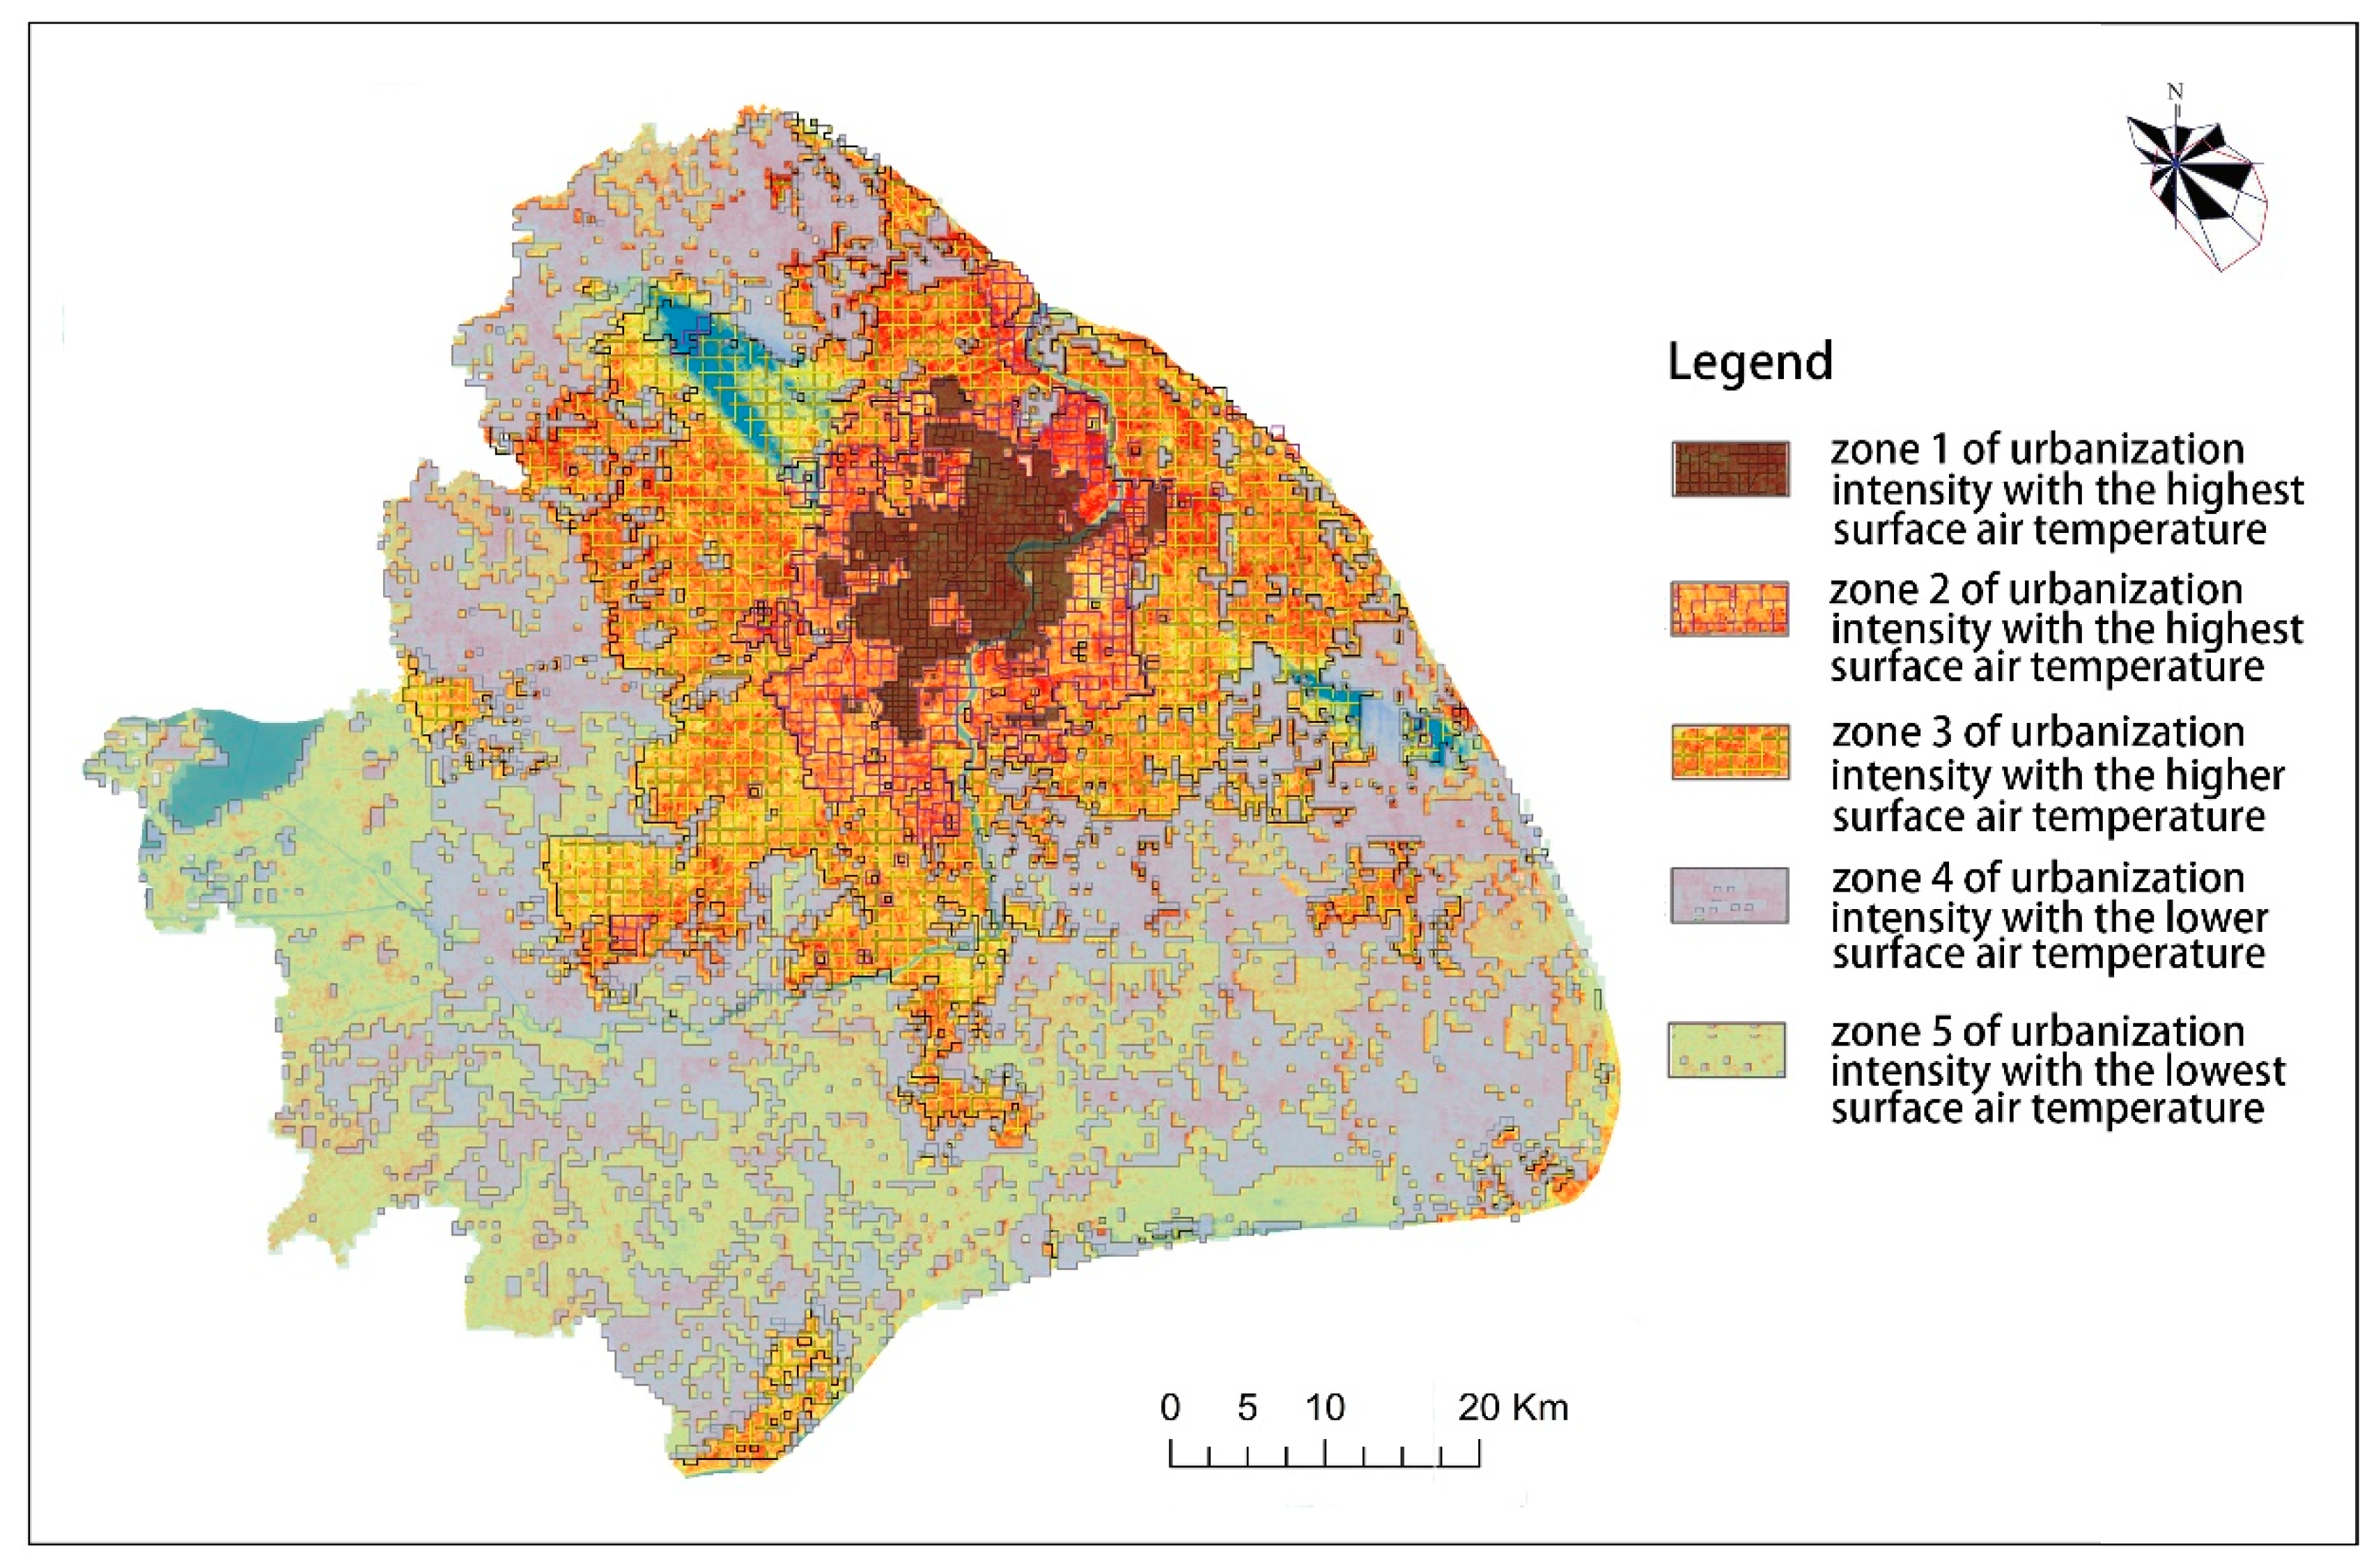
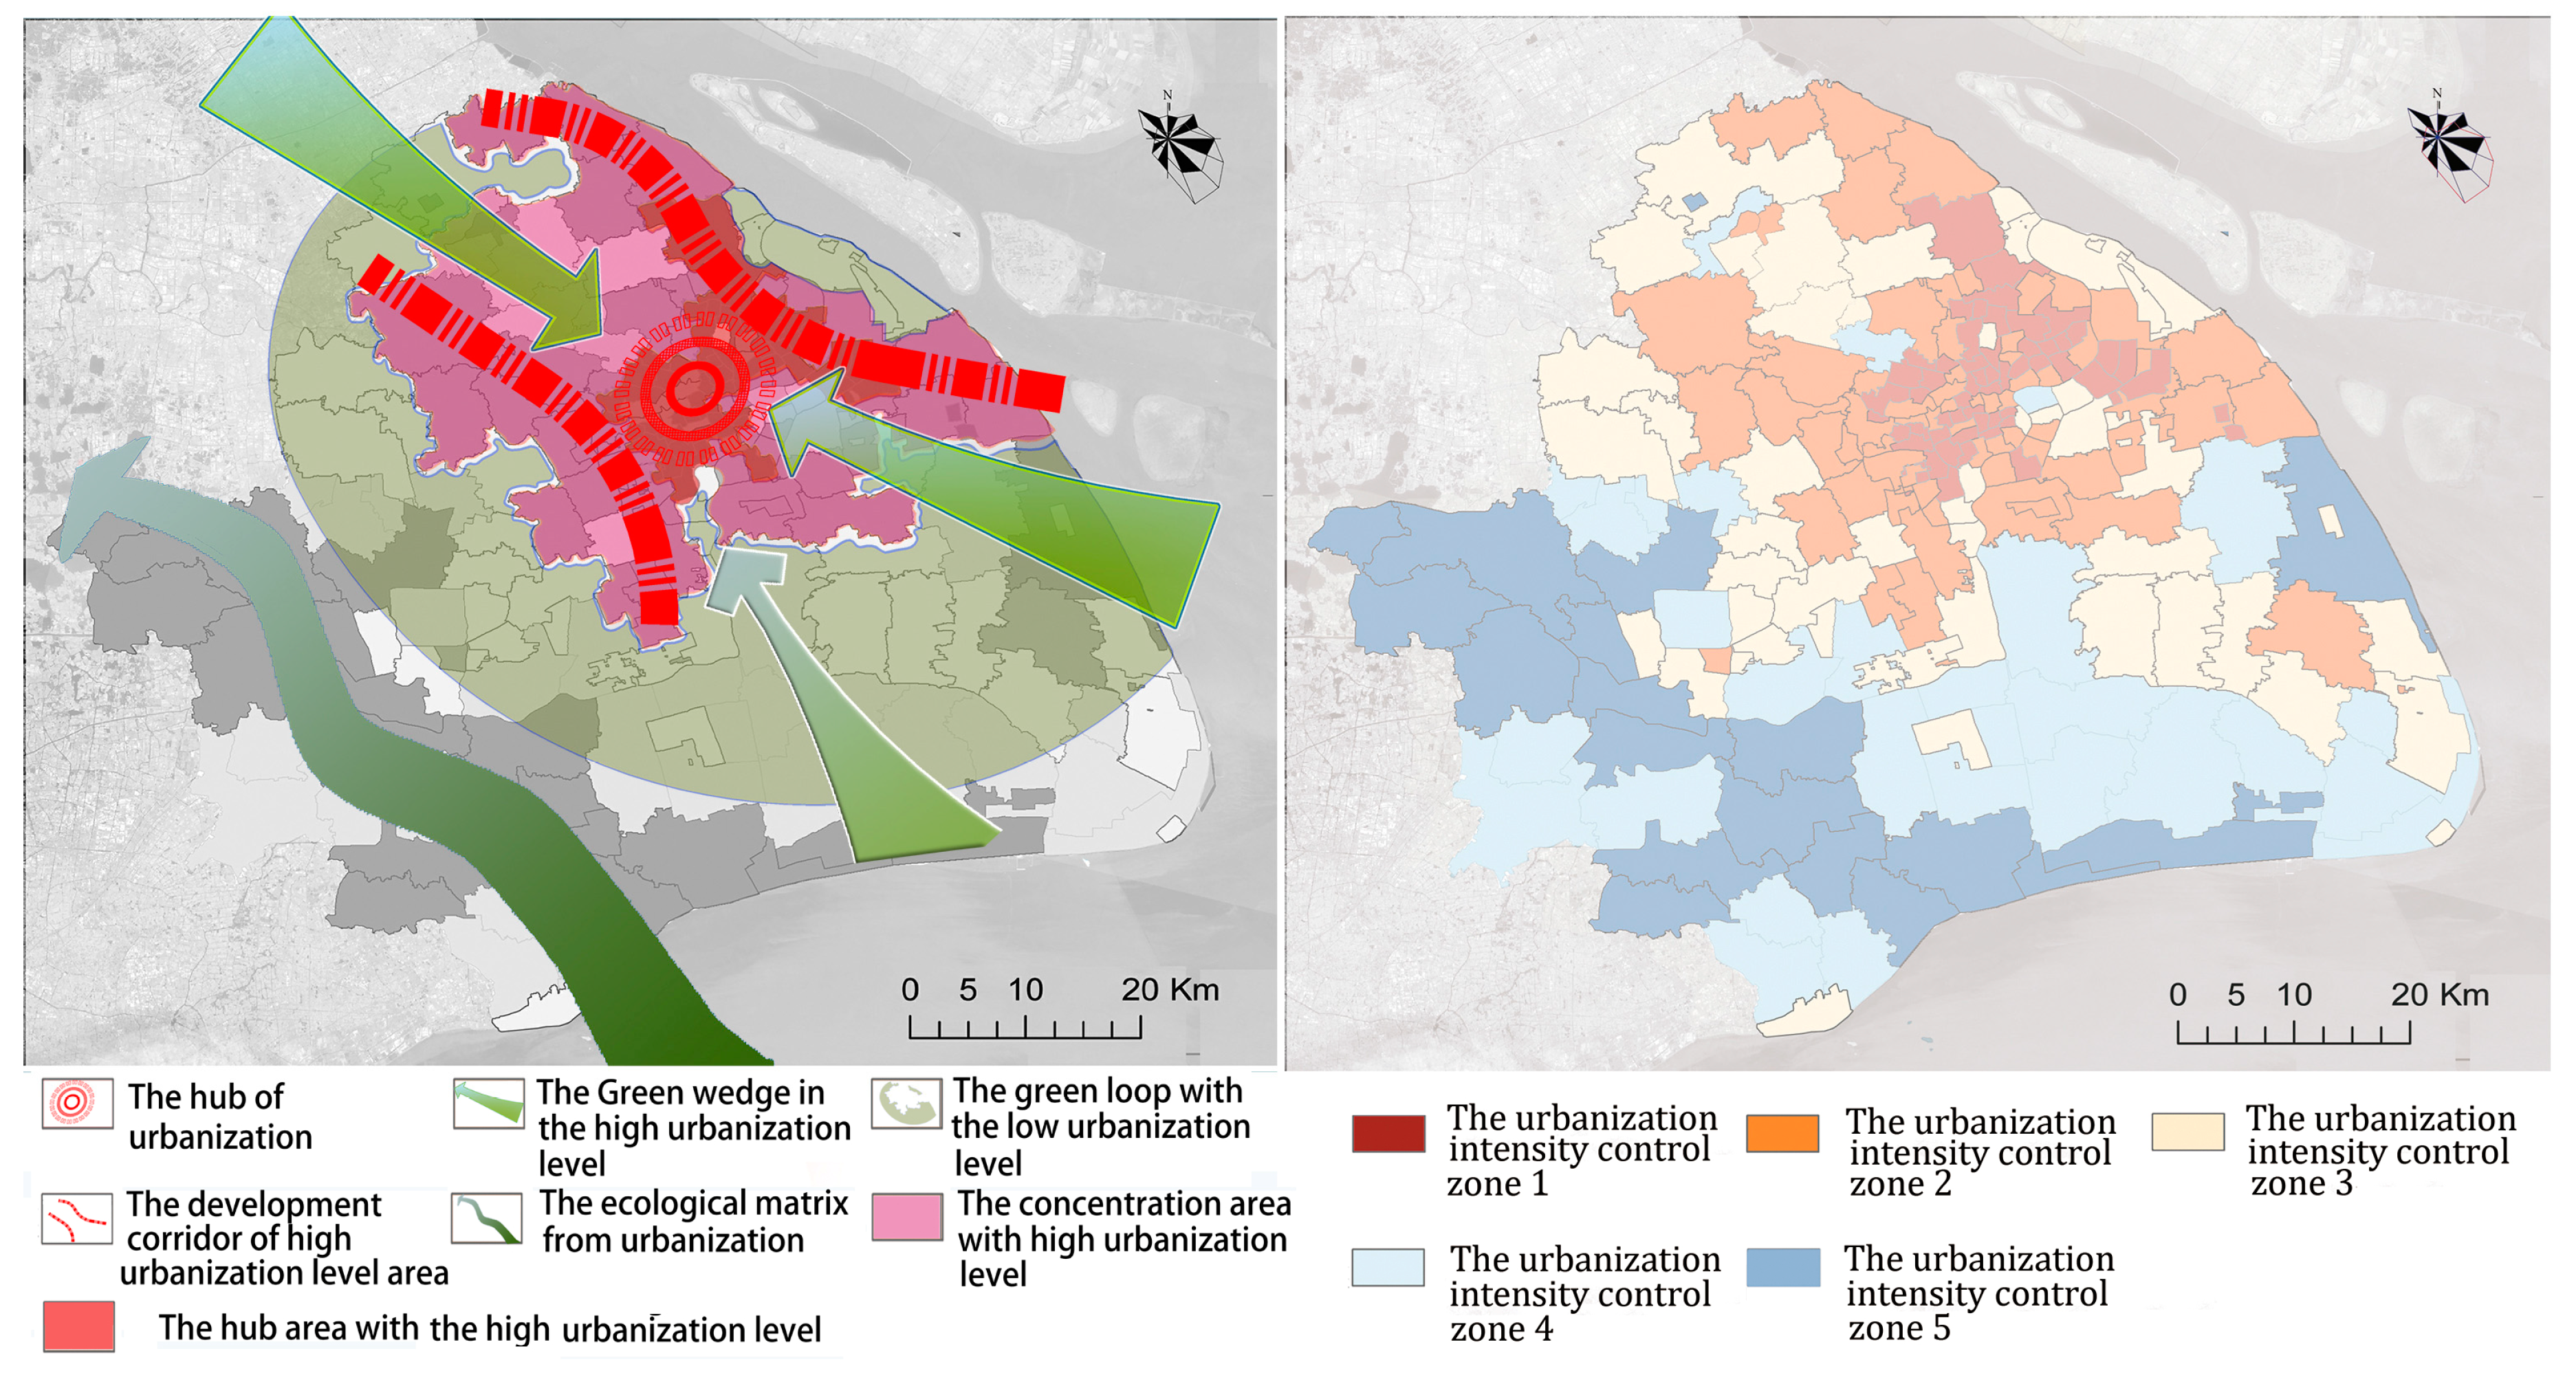
Table 1.
The mechanism relationship between urbanization and urban climate effect.
| Extended Concept | Impact Factors | Effect Mechanism | Urban Climate Effect | |
|---|---|---|---|---|
| urbanization | the agglomeration of population migration | increase in population scale or population density | artificial discharge heat increases | leading to the effects of UHI, urban Rain Island, urban dry island, and so on |
| the agglomeration of economic activities | economic growth | the energy consumption increases | leading to the effects of UHI, urban Rain Island, urban dry island, and so on | |
| the agglomeration of economic activities the expansion of urban space | the energy consumption mode | the components of discharge gas, soot and dust increase | ||
| the increase of pollution emission | the components of discharge gas, soot and dust increase the traffic volume and greenhouse gas emissions increase | |||
| the change of traffic mode | ||||
| the reduction of ecological space area | the evaporation of surface water decreases and the storage heat is increased | |||
| the expansion of urban space | increase of the area or density of road network | the specific heat of underlying surface material decreases and the heat absorption rate rises | ||
| improvement of land use intensity | the density and intensity of the built-up area increase, the specific heat of under-lying surface decreases, and the surface wind speed decreases. |
Table 2.
The index system of the level of urbanization development and the weight based on the urban climate effect in Shanghai.
Table 2.
The index system of the level of urbanization development and the weight based on the urban climate effect in Shanghai.
| Index Hierarchy Layer | Indices System | Variation Coefficient | Weight Coefficient |
|---|---|---|---|
| economic index | GDP index | 0.142 | 0.033 |
| industrial gross output value | 0.085 | 0.020 | |
| per capita GDP index | 0.369 | 0.087 | |
| urban construction index | population density | 0.493 | 0.116 |
| built-up area | 0.586 | 0.138 | |
| road network density | 0.468 | 0.110 | |
| housing construction area | 0.225 | 0.053 | |
| ecological and environmental index | cultivated land area | 0.167 | 0.039 |
| forest land area | 0.227 | 0.053 | |
| proportion of environmental protection investment | 0.028 | 0.007 | |
| natural reserve coverage | 0.096 | 0.023 | |
| green coverage ratio | 0.153 | 0.036 | |
| total amount of industrial discharge gas | 0.261 | 0.061 | |
| total amount of flue gas and dust | 0.166 | 0.039 | |
| area of urban green space | 0.782 | 0.184 |
Table 3.
Structure judgement matrix and factors weights for urbanization impact intensity.
| Urbanization Impact Factors | Population Density | Road Network Density | The Albedo Value | The Ndvi Value | Weights |
|---|---|---|---|---|---|
| Population density | 1 | 2 | 1/3 | 1/4 | 0.1297 |
| Road network density | 1/2 | 1 | 1/3 | 1/4 | 0.0917 |
| The albedo value | 3 | 3 | 1 | 1/2 | 0.2957 |
| The NDVI value | 4 | 4 | 2 | 1 | 0.4829 |
Table 4.
The average value of climatic factor parameters by regional urbanization zone.
| Classification | Annual Average Maximum Wind Speed | Annual Precipitation | Annual Average Temperature | Average Land Surface Temperature | Annual Relative Humidity |
|---|---|---|---|---|---|
| urbanization zone 1 | 5.5256 | 1156.3169 | 17.3320 | 33.0536 | 68.7209 |
| urbanization zone 2 | 6.2023 | 1121.5825 | 17.2824 | 32.1877 | 69.3221 |
| urbanization zone 3 | 7.0424 | 1075.9096 | 17.1514 | 31.2393 | 69.1446 |
| urbanization zone 4 | 7.1592 | 1060.431 | 17.0302 | 30.1777 | 79.9647 |
| urbanization zone 5 | 7.3423 | 1057.8454 | 17.0122 | 28.9578 | 70.1131 |
Note: Values of the average land surface temperature were obtained to extract urban surface temperature information and temperature inversion data using the Landsat TM on 28 May 2014.
© 2018 by the authors. Licensee MDPI, Basel, Switzerland. This article is an open access article distributed under the terms and conditions of the Creative Commons Attribution (CC BY) license (http://creativecommons.org/licenses/by/4.0/).
Share and Cite
MDPI and ACS Style
Jiang, Y.; Hou, L.; Shi, T.; Ning, Y. Spatial Zoning Strategy of Urbanization Based on Urban Climate Co-Movement: A Case Study in Shanghai Mainland Area. Sustainability 2018, 10, 2706. https://0-doi-org.brum.beds.ac.uk/10.3390/su10082706
AMA Style
Jiang Y, Hou L, Shi T, Ning Y. Spatial Zoning Strategy of Urbanization Based on Urban Climate Co-Movement: A Case Study in Shanghai Mainland Area. Sustainability. 2018; 10(8):2706. https://0-doi-org.brum.beds.ac.uk/10.3390/su10082706
Chicago/Turabian StyleJiang, Yunfang, Luyao Hou, Tiemao Shi, and Yuemin Ning. 2018. "Spatial Zoning Strategy of Urbanization Based on Urban Climate Co-Movement: A Case Study in Shanghai Mainland Area" Sustainability 10, no. 8: 2706. https://0-doi-org.brum.beds.ac.uk/10.3390/su10082706
Note that from the first issue of 2016, this journal uses article numbers instead of page numbers. See further details here.