Article

A Psychological Approach to ‘Public Perception’ of Land-Use Planning: A Case Study of Jiangsu Province, China

1
College of Public Administration, Nanjing Agricultural University, Nanjing 210095, China
2
School of Architecture, University of Virginia, Charlottesville, VA 22904, USA
3
School of Geographic and Oceanographic Sciences, Nanjing University, Nanjing 210093, China
*
Author to whom correspondence should be addressed.
Sustainability 2018, 10(9), 3056; https://0-doi-org.brum.beds.ac.uk/10.3390/su10093056
Submission received: 24 July 2018 / Revised: 21 August 2018 / Accepted: 24 August 2018 / Published: 28 August 2018

Abstract

:
Public perception and attitudes towards public affairs in the USA since the 1960s become a societal issue of growing importance in the field of planning. Good land-use planning should deliver a bright future vision in a way that unites and inspires groups to implement it. The introduction of public perception into planning helps to understand the process of how the public develop their awareness, value judgments, behavior and attitudes. In this research, we built the framework of public perception in land-use planning based on the affect, behavior, cognition (ABC) theory of consumer behavior. We gathered empirical data for Jiangsu province in China. We used structural equation modeling, a commonly used statistical analysis method for examining the structural relationship between multiple variables. We found that the public perception towards public affairs contributed to forming a multiple iterative interaction effect, which evolves a process from primary cognition to knowledge extraction, internalized absorption, emotional judgement and finally externalization into a certain attitudes and behaviors. On the cognitive level, our research result showed that public expectation and perceived quality have opposite effects on perceived difference and the public expectation is more influential. If the planning vision provides a clear and convincing picture of the future, and the information of planning is easy to understand, the public’s cognition and emotion can be well integrated. The core element of the emotional level is perceived value. The public is more concerned about a new planning project if it can add the value to the land, protect community environment, and improve the condition of low-income and minority populations. On the behavior level, public continuous behavior intentions could enhance perceived value, subjective norms and perceived availability. The research could further account for the root of public attitudes and behavior. This is crucial to China's land-use policy, and may well provide important lessons for other developing countries.

1. Introduction

As the public’s self-awareness and public participation in public affair increases, the research topic on public perception has generated a lot of attention from government and scholars since the 1960s. Public perception and attitude towards public affairs have gradually become a societal issue of growing importance in research on public affairs [1,2,3,4]. As a basic concept of psychological research, perception is a mental process of recognizing and interpreting sensory information, enabling us to recognize meaningful objects and events [5]. Hoffman believed our perceptions of space-time and objects have been shaped by natural selection to hide the truth and guide adaptive behaviors [6]. Land-use planning is a public affair which aims to coordinate land use and resolve conflicts of interest of different stakeholders and groups [7]. What the public knows and thinks in the process of planning can have important implications for a successful implementation of a project and can help to reduce conflict and build a society with sustainable development [8].
“Public perception” has been widely studied in terms of service quality, risk perception and tourism perception etc. The early research on public perception focused on the study of customer perceived quality in market management. Christian Grönroos (1982 and 1984) developed a service quality model which describes how the quality of services is perceived by customer [9]. Lewis and Booms and managers of service firms concur that service quality involves a comparison of expectation with performance, and delivering quality service means conforming to customer expectation on a consistent basis [10]. From these perspectives, Parasuraman et al. built the model of measuring customer-perceived service quality, namely SERVQUAL [11]. In 1986, Albert Bandura, who is a famous psychologist, took an advanced step that re-conceptualized individuals as self-organizing, proactive, self-reflecting, and self-regulating. He put forward the connection of triadic reciprocality among human behavior, environmental factors, and personal factors such as cognitive, affective, and biological events, and of reciprocal determinism [12]. Severson and Slovic constructed a research framework based on the essential characteristics of risk perception process and method [13]. As a specific social phenomenon, there is a growing importance of public perception, sometimes with public satisfaction to estimate public attitude. From then on, the field of public perception is further extended. More research has been applied into risk perception towards biological disasters [14], environmental pollution [15], food safety [16], climate change [17], water quality [18], or perceptions of the risks from nuclear power [19,20] as well as exploration of the relationship between risk perception, individual culture, and social background [21]. More detailed research includes establishing and testing the hypothetical relationship between the influencing factors and the perceived quality in government service [22], or describing public perception for a particular service quality and measuring influence factors [23]. Scholars also pay attention to tourism perception, such as using multiple variables to test the effects of these variables on resident attitudes toward tourism development [24,25], perceived tourism impact factors analysis [26], or theoretical explanation [27]. Scholars have taken “the public” into planning research and practice, with a focus on public participation and perception. For example, citizen participation and consensus building in land-use planning [28], and public or citizen’s participation in sustainability development planning [29,30]. The Theory of Communicative Action proposed by Jürgen Habermas emphasizes truth, comprehensibility, truthfulness, rightness [31]. So, scholars take public opinion as one of the indicators to evaluate the quality of planning [32], or integrating stakeholder choices and multi-criteria analysis to support land-use planning [33]. In the field of planning, public perception is an individual’s or group’s beliefs and understanding that guide thoughts about future actions [34]. Perception is considered as an opinion or attitude, which is a tool to improve urban beach planning and management [3], or using public participatory mapping to inform general land-use planning and zoning [35]. Additionally, planners should pay more attention to environmental and social issues, such as facilitating public acceptance towards naturalistic habitats and its associated biodiversity in urban areas [36]. Liepa-Zemeša and Hess analyzed the effects of public perception on urban planning in detail and suggested that external factors strongly impact community planning perceptions and that the public is willing to participate after first achieving individual goals [34]. According to the literature, scholars attach great importance to the public in the dominant position of public affairs as well the dominant role in behavioral patterns and corresponding measurements. However, there is relatively little knowledge about how the public perceives planning quality or how public perception affects future behavioral intentions.
As an important participant, the public has the most direct opinions of land-use planning from the original plan to the final implementation. The public might evaluate the quality of the project based on their experience from the process of land-use planning. What they perceive directly influences their value judgment and degree of participation in other public affairs. Good land-use planning should deliver a bright future vision in a way that unites and inspires the groups to implement it [7]. Although the planning vision is inspirational, conflict and opposition still happen most of the time. When discussing this social contradiction, there is an unavoidable fact that public perception may be overlooked in the process of land-use planning. If planners can offer a compelling process that inspires the public to act for the common interests, then they will have greater potential to change attitude and beliefs. Currently, public participation is emphasized in land-use planning, however, mechanical participation is only a unilateral information input which does not form an interactive mechanism with feedback links.
In this research, we introduce the affect, behavior and cognition (ABC) theory to interpret the process of public perception. Public as “users” in the planning process interacting with the public administration can be seen as “customers,” through the investment of time and energy to enhance their interactive behavior (i.e., public participation in planning) for interests (which can be understood as consumption purposes). Public administration hopes to strengthen this interaction in order to improve the performance, suitability and functionality of planning policies. Cognition is formed through the information delivered to the public by land-use planning policies. Affect is formed based on cognition with additive individual background and experience. Affect will generate some forms of attitude or emotional tendency, such as satisfaction or dissatisfaction, towards a planning project. When the public emotion accumulates to a higher level, the public will express that emotion through action, such as support or against. Therefore, it is critical to explore the public’s psychological process for creating a harmonious community.
The implementation of land-use planning in China is relatively new. In 1986, the nation began to require the establishment of a master plan for land use [37]. In 2013, the Chinese People’s Political Consultative Conference proposed to make efforts on political consultation, democratic oversight, and participation in the deliberation and administration of state affairs. China land governance regulations for land-use planning specify a clearly stated land resources management department should consult with the public for solutions of major problems in the process of land-use planning. The type of Chinese land-use planning is top-down and government-led. In recent decades, there have been tremendous changes in land-use planning in China. However, China is extremely short of available land given its dense population. This has resulted in intensified land-use conflicts. To meet this challenge, participatory land-use planning has gradually been advocated. However, the effectiveness of participation has also been questioned. It is essential for governments and planners to explore the public’s opinions and attitudes. Knowing public attitudes and assessing the participation in land-use planning serve important roles in allocating land resources and would improve planning effectiveness. This is crucial to China’s land-use policy, and it may well provide important lessons for other developing countries.

2. Research Design and Methods

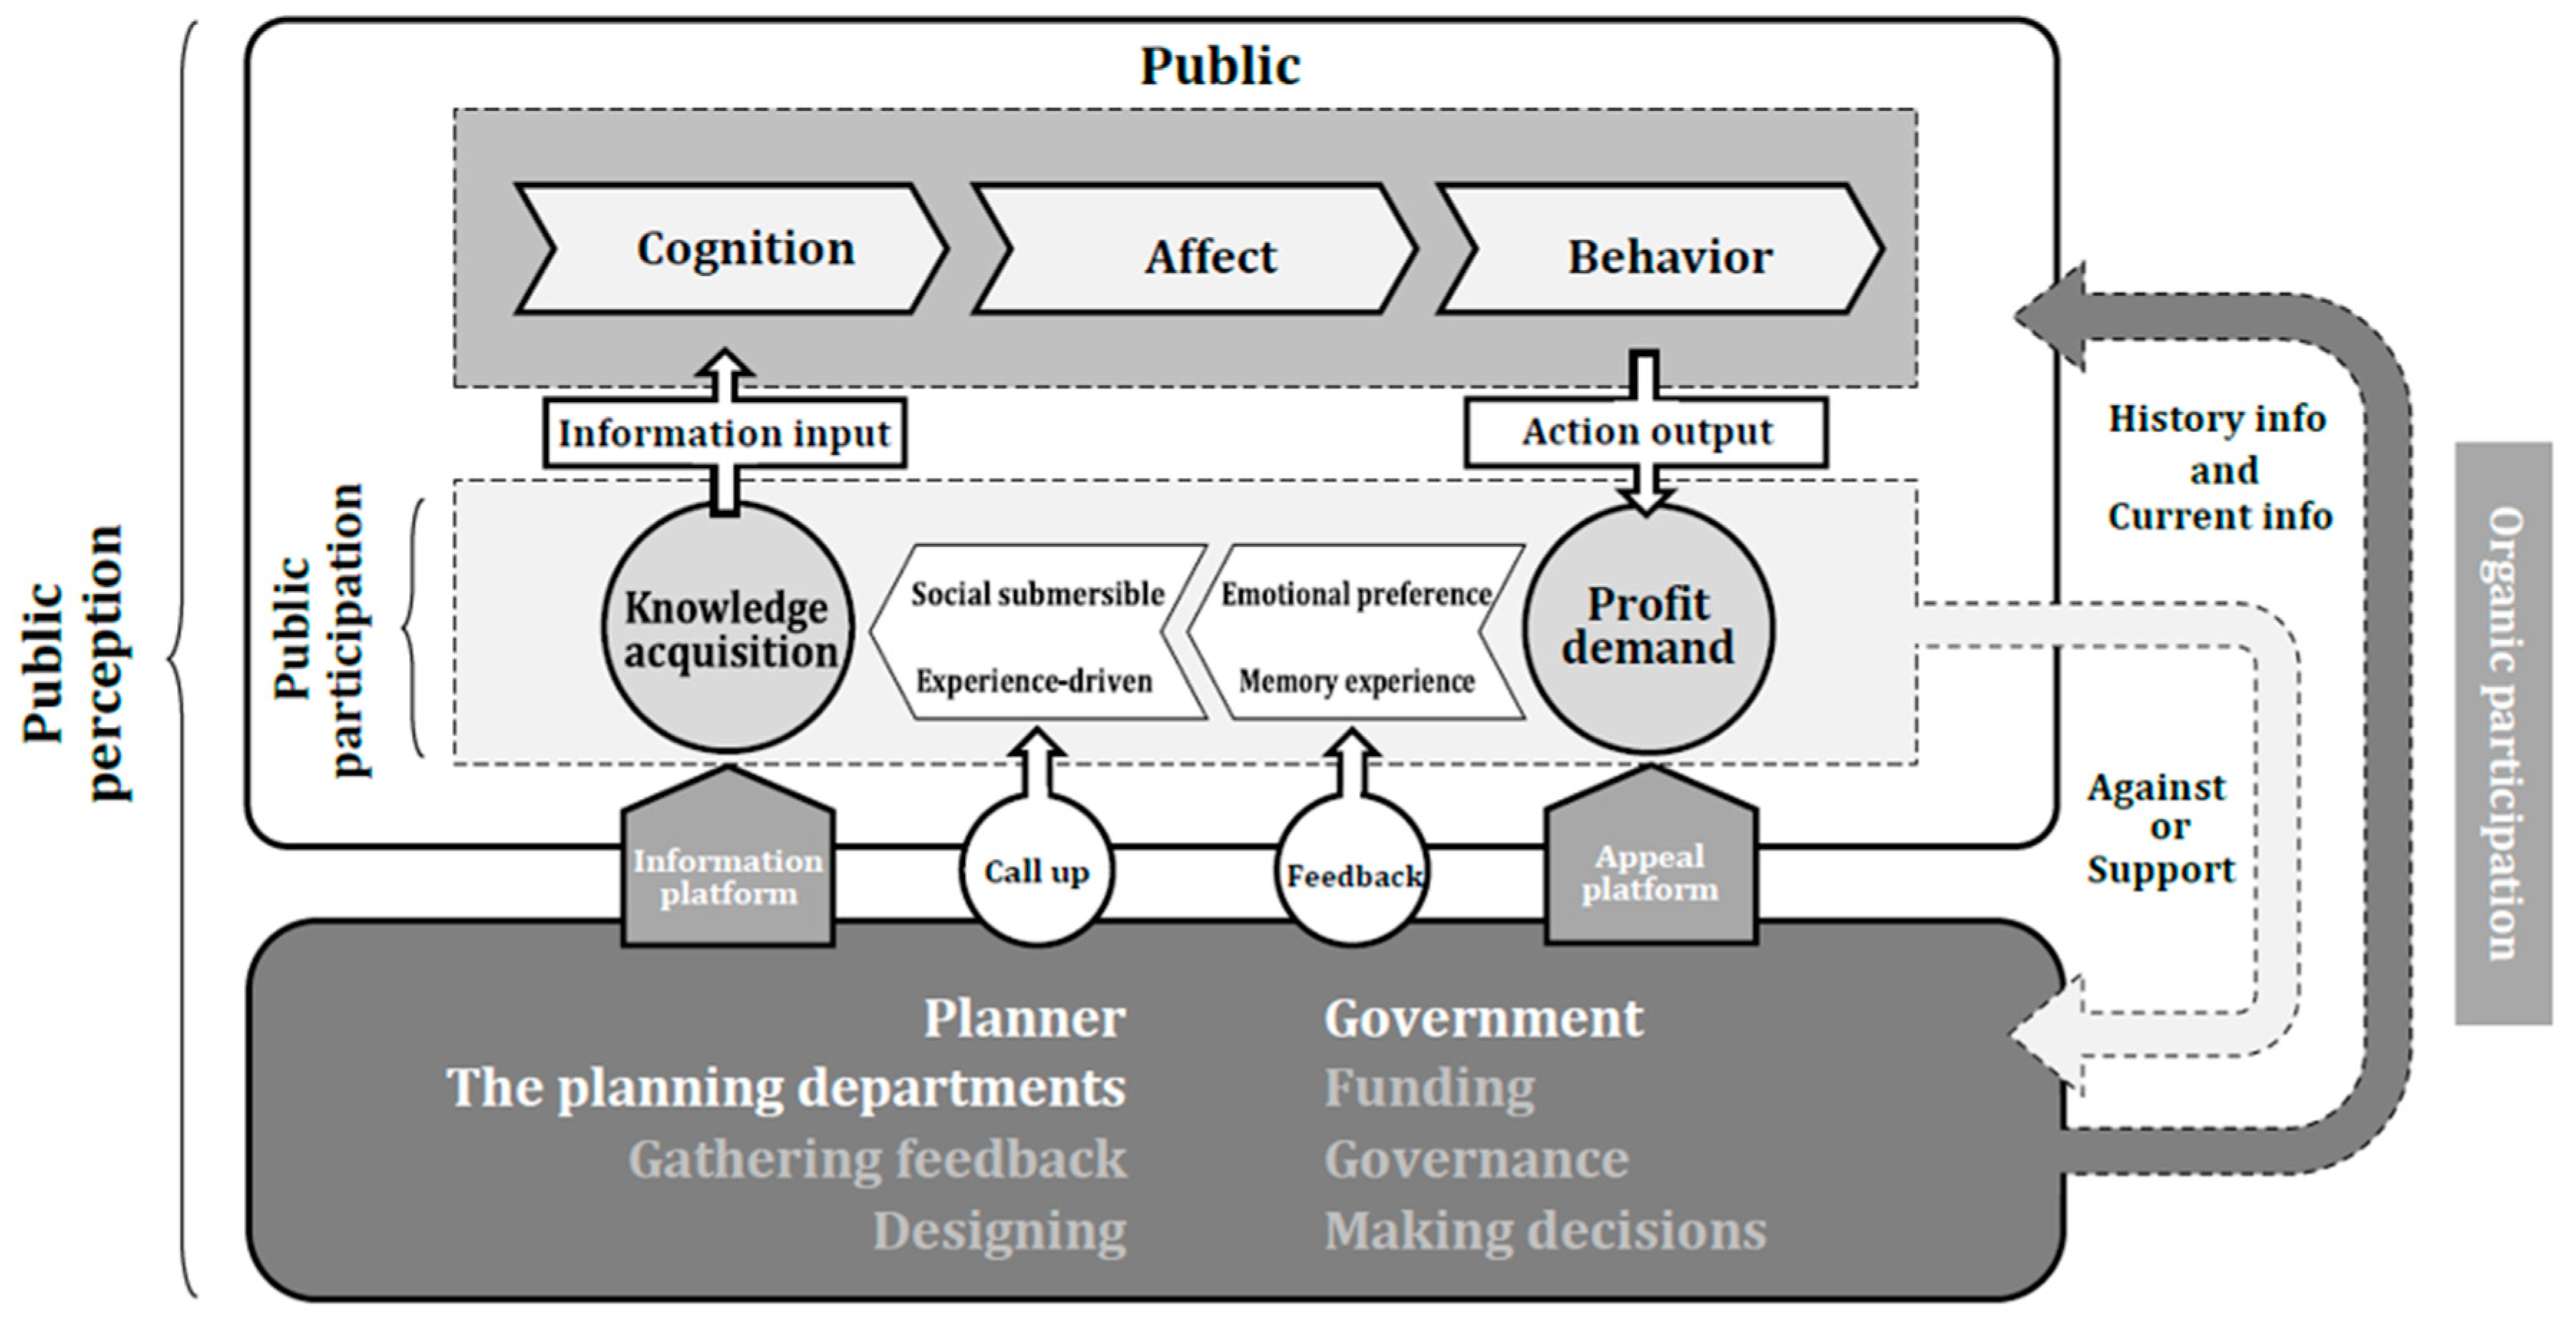
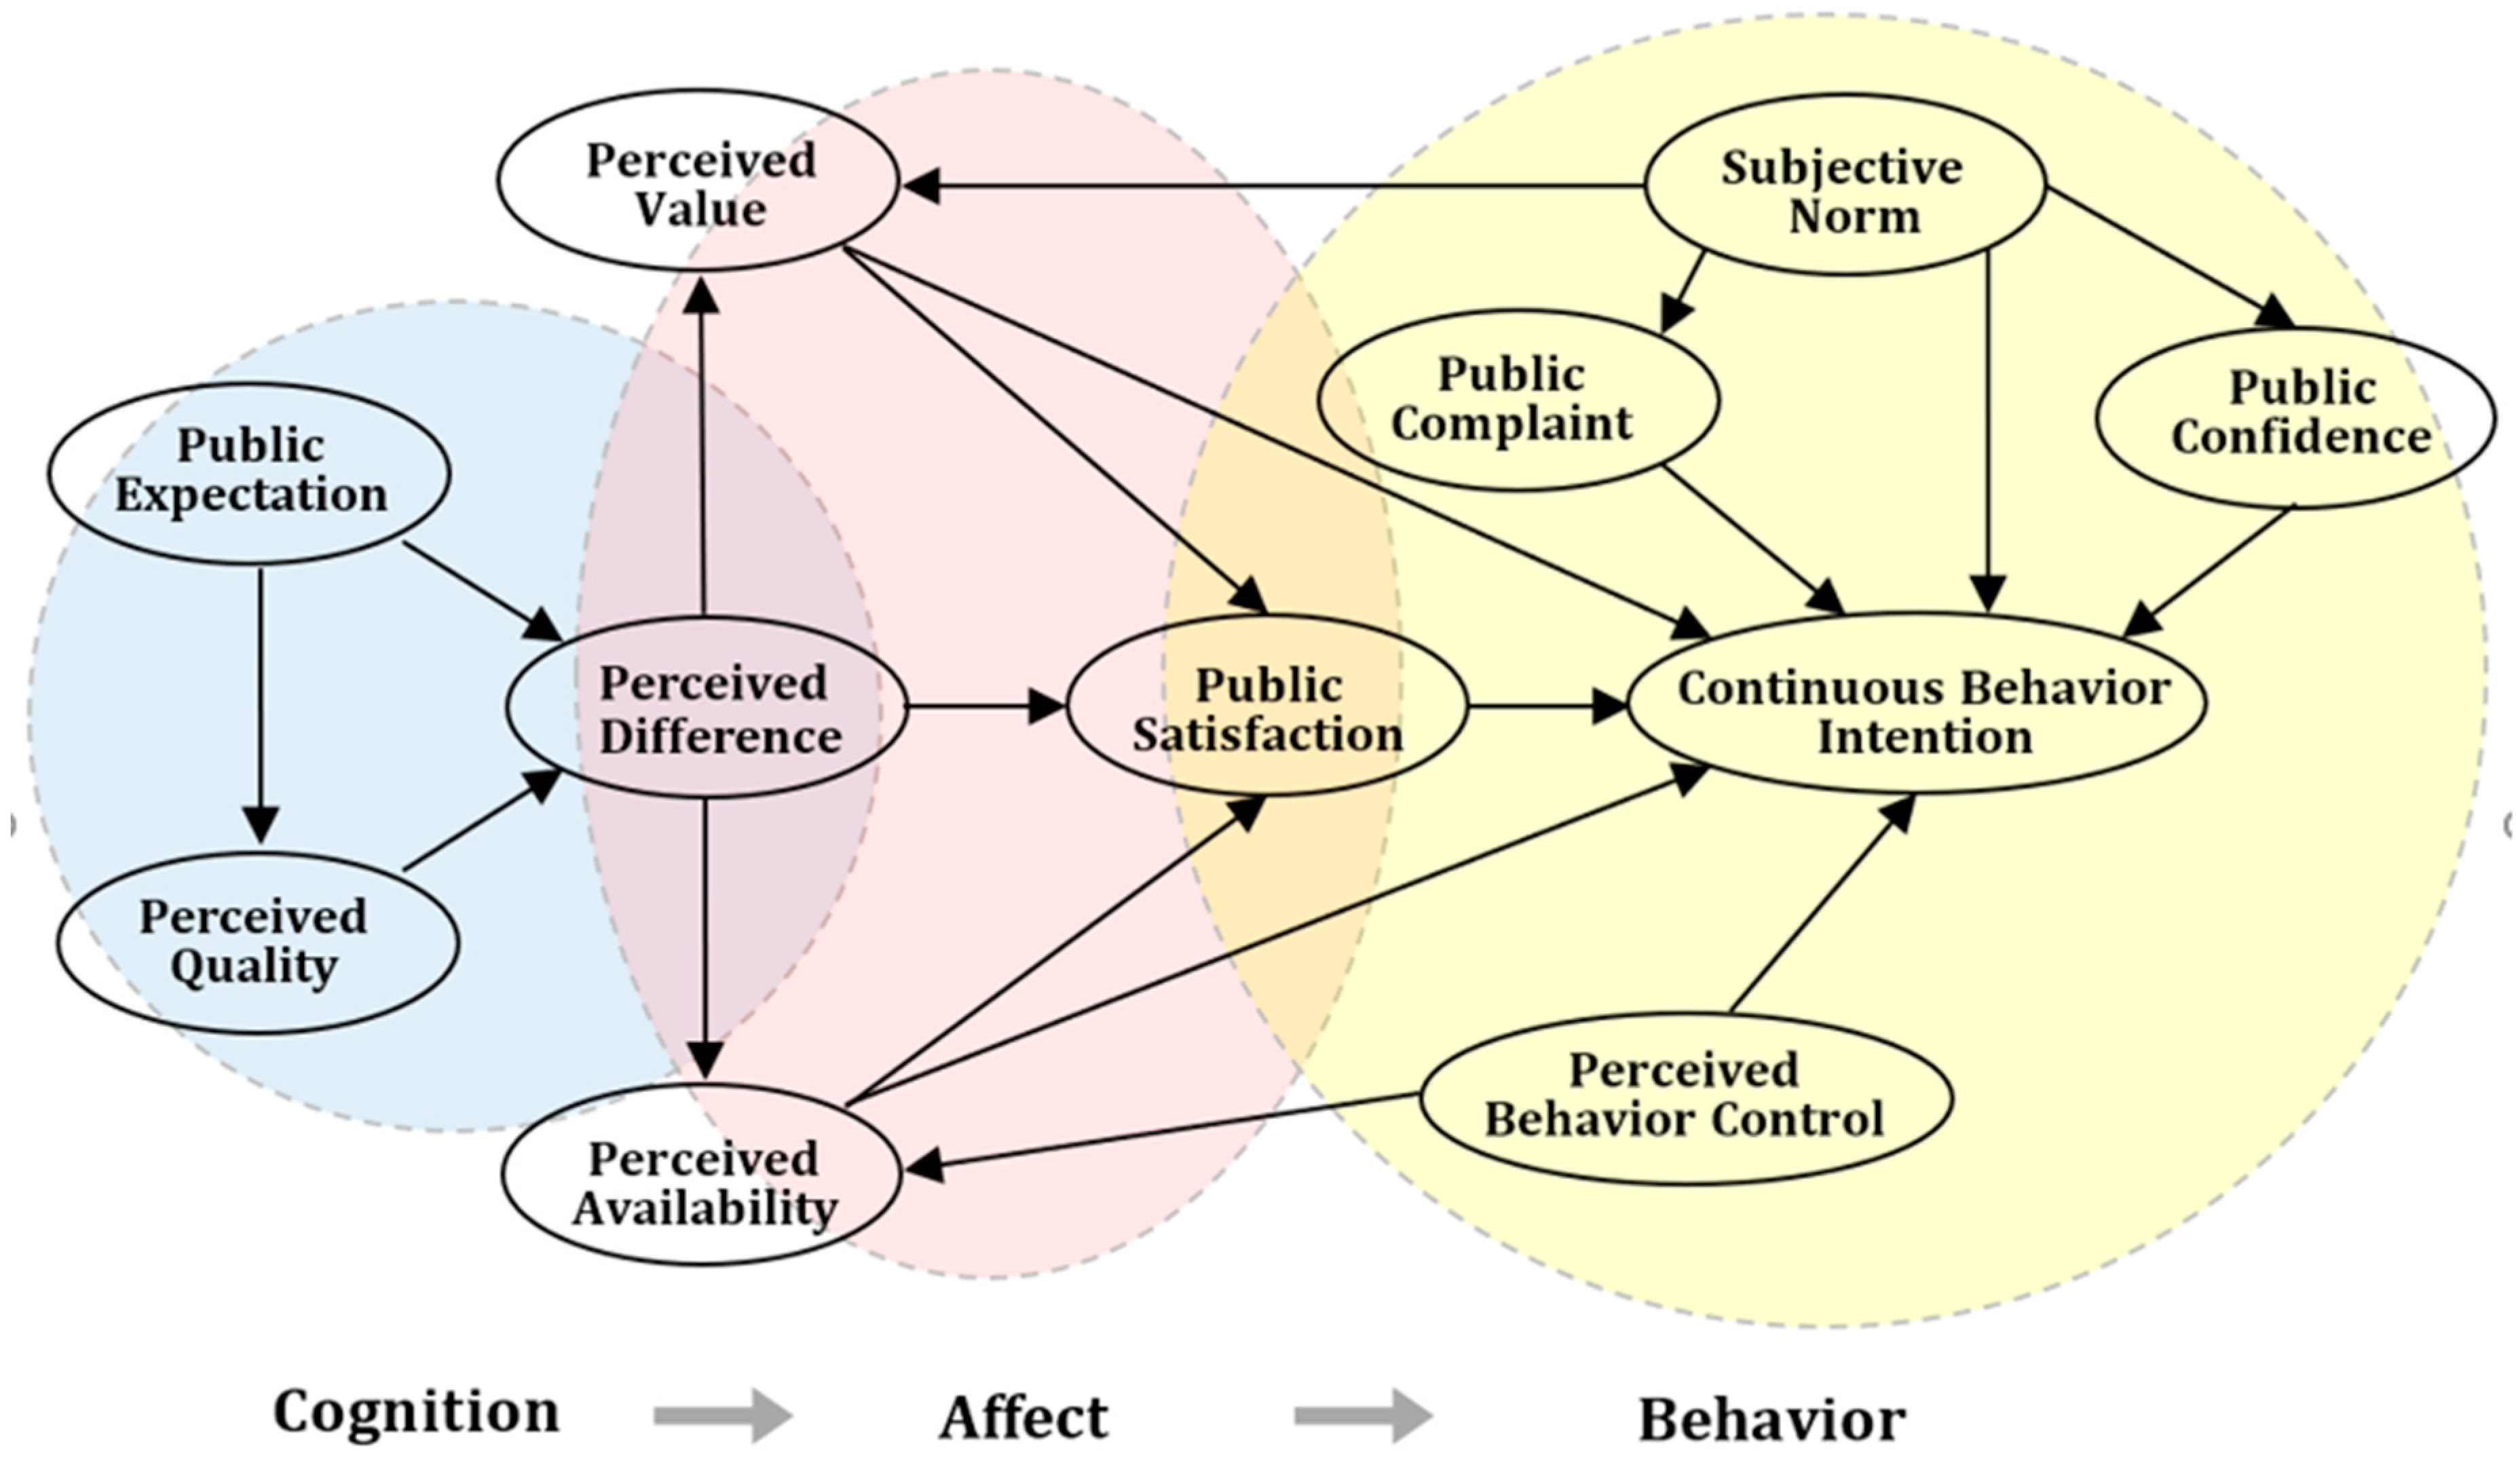
2.1. Analysis Framework

The public plays an important role in land-use planning. Public participation is a political principle or practice, and may also be recognized as a right [38]. The principle of public participation holds that those who are affected by a decision have a right to be involved in the decision-making process. Public participation may be regarded as a way of empowerment and as vital part of democratic governance. Public perception may have a broader meaning. In our paper, we argue that public perception is an organic participation. Public perception involves people’s attitudes, opinions, behaviors, emotion, not just mechanical participation.
Public participation focuses on the practice of stakeholder engagement, like a fruit, but we believe public perception is like a tree. To understand why such a fruit is produced, we need to explore how the tree grew. We emphasize exploring the psychological process and then understanding how the public forms their attitudes and behaviors. Land-use planning should not only emphasize mechanical participation, but also good perceptual experiences. Planning should be understood by the public clearly, and integrating with their knowledge and experience to promote participation, that is, organic participation.
The public at large often receives enough factual information to form a general opinion about public affairs. Perception is a person’s direct reaction towards an objective image. Perception could affect people’s attitude toward objective things. Attitude refers to the habitual response towards particular object in a certain way. It is a more persistent and consistent internal intrinsic psychological expression and it would determine what kind of behavior people will take. We applied the ABC attitude theory of consumer behavior to explain the psychological process. It has three elements: A is affect, B is behavior and C is cognition [39]. As described in Figure 1, the interactive psychological process begins with the acquisition and learning of planning information and relevant background information. That is the public information input stage. By combing and screening the effective information, the public forms cognition with divergent thinking to understand the planning content. After this internalized knowledge is absorbed, the public moves to emotional judgment. In this stage, the public has usually formed a kind of comprehensive emotional preference towards public affairs, reflecting their experience and individual values. Sometimes, media publicity will further strengthen this affect, or good or bad. Under the internal drive of emotional judgment, such as support for or opposition to the planning project, the public tends to express their behaviors. The public’s behavior may participate in hearing, give advice, or protest the project, appeal against decision. In land-use planning in China, the role of government includes funding, land governance and final decision-maker. Good perceptual experience would inspire positive participation. This will help to reduce conflict and create harmonious community.
The definition of public perception in our study includes the public cognition of planning, which then affects emotional attitude and subsequent behavioral intention (i.e., include the public perception model of the three core elements: cognition, affect, and behavioral intention). Following this progression, we dissected the core elements of public perception so that it can be measured as a details variable. Furthermore, the cognition levels are subdivided into public expectations, perceived quality and perceived differences. The affect levels are subdivided into perceived value, perceived availability and public satisfaction. The behavior levels are subdivided into public complaints, public trust, perceived behavior control, subjective norms, and continuous behavior intention. Public expectations are the benefits that the public perceives from the coming planning project. Perceived quality means the public perceived quality of the information presented by planners, such as documents, pictures or views of planning. Perceived differences are the differences between expectation and reality. Perceived value includes the public’s perception of environmental value, economic value, and equitable value. Perceived availability is the responsiveness of public to the plan, such as whether plan illustration is explicit or easy to understand by the public. Public satisfaction generally refers to whether the public is satisfied with the planning process or not. Public complaint is the public’s negative feeling towards the government or planners, while public trust is the public’s positive feeling. Perceived behavior control is an individual behavior that supports or opposes the planning program. Subjective norms can be understood as the behaviors formed by the public themselves or influenced by the society or others, rather than caused by the planning projects. Continuous behavior intention is whether the public would like to participate in planning again or recommend others to participate. Accordingly, a conceptual framework for planning public perception (Figure 2) is established. On this basis, further analysis can be made of specific variables that can measure these concepts.

2.2. Methods

2.2.1. Structural Equation Modeling (SEM)

Structural equation modeling (SEM) is a general and major technique of linear statistics modeling based on variables of a covariance matrix to explore the variables relationship [40]. Its idea originated in the 1920s when Sewall Wright [41] put forward the concept of path analysis. It has the advantage of allowing researchers to investigate the relationship among the multivariate variables in a dynamic system. In fact, SEM combines econometric, quantitative sociology and psychometric and it is widely used in psychology, economics, sociology, statistics, management science and other disciplines and social investigation [42]. Multiple regression, factor analysis and path analysis are the only special cases in SEM. Structural equation modeling is a new developing field of statistical analysis methods which has established the high reputation in the field of statistical applications. SEM path analysis methods are popular in the social sciences because of their accessibility, especially in psychology and social interaction [43]. Therefore, Claes Fornell takes SEM as “the second generation of multivariate statistical methods” [44]. The terms of SEM include parameters, observed variables, latent variables, endogenous variables, and exogenous variables. Measured variables may be exogenous variables (independent; having no causal inputs) or endogenous variables (dependent; having one or more causal inputs) within a model [45]. The relationship among the latent variables and between the latent variables and the observed variables are usually indicated by the path graph. The signs and meanings commonly used in path diagrams are as follows (Table 1).
The latent variable can be measured by one or more observed variables. It allows independent variables and dependent variables to contain measurement errors. The factor structure between the latent variable and its corresponding observed variable, and the factor relation among the latent variables, can be estimated simultaneously. Their path graph and the mathematical model can be described dually. SEM, by establishing a comprehensive measure of causal relationship or related model, will allow researchers to deal with measurement error in the analysis, and also can analyze complex relationships between latent variables or between latent variables and the corresponding observations. In our study, the latent variables are those elements of public perception as shown in Figure 2. Observational variables are derived from our questionnaire, as shown in Table 2.

2.2.2. Variable Selection Based on SEM

Figure 2 shows a conceptual framework for public perception, but it is insufficient to measure this. According to the SEM principle, relations between the observed variables and latent variables are reflected by the model of block structure and their measurement equation is divided into a reflection type and constitution type. A reflection type assumes that latent variables could reflect the objects observed, while a constitution type indicates observed variables are the compound factors of latent variables. The reflection type has a stable external effect, but the constitution type is influenced by many factors, such as sample size, research situation, investigation time, etc. Due to the constitution type in the research scope and the generality of the research, the conclusion is insufficient [46], and we chose the reflection type measurement model in order to improve the external validity of the measurement model in the process of the measurement model development. Based on the literature review and theoretical model design, the relationship between the observed variables and corresponding index sources in the model is shown in Table 2. Some indexes are adjusted and modified according to the research characteristics of this subject.

3. Data Collection and Analysis

3.1. Selection of Investigated Respondents and Study Areas

Citizens are recognized as members of overlapping communities with networks of loyalties and communication, in which beliefs, attitudes and practices revolve and mesh in complex ways [53]. In order determine our respondents, given the enthusiasm and the execution of public roles in the planning process based on the stakeholder theory of Mitchell [54] and Starik [55], we categorized the roles involved in land-use planning into four groups (seen as the Figure 3). Group I is high motivation and high execution, including local land management department, planning department, etc. They work out and carry out the planning and have great impact and high execution on planning. Group II is high motivation and low execution. They are permanent residents, land developers and experts who all maybe experience some changes result from planning, the good or the bad. They are very concerned about planning implementation, but relative to the government, they have little role in execution. Group III is low motivation and low execution. They are other administrative departments of the municipal, media reporters, or some non-permanent residents. They usually work far from planning or rent temporarily. On account of being transient, they do not care about planning. Group IV is low motivation and high execution. They may be high-level administrators, such as state or provincial administrators. They are usually in a high position and need to handle multifarious affairs everyday not just focus on planning, so they show a lack of enthusiasm for land-use planning.
The high enthusiasm of the stakeholders in group II indicates that the group has a high participation intention as well as a need for expression, appeal, and to make a contribution to planning. Group II is the most important of the four categories, as the coming planning might change their life and they should be considered the core stakeholders. Therefore, the main respondents should be composed of urban residents, rural residents, village collective, experts in planning, and land developers. In addition, we also chose the staff of the local land management department in the group I and the media reporter in group III, but they account for a small percentage.

3.2. Selection of Study Areas

The survey area is identified as Jiangsu province, China. Land-use planning is the most important legal basis for land administration in China. Jiangsu province is located in the eastern developed area of China of which GDP growth speed remains in the top three in China in the recent 10 years. There are numerous renovation projects in cities and the countryside each year that involve in a lot of land-use planning [56]. The planning in Jiangsu is relatively advanced and progressive. To promote democratic policy-making in land-use planning, the Section 4 of chapter 9 in Jiangsu province land-use planning (2006–2020) guidelines underline public participation, such as consultation, hearing and adoption of public opinions shall be reported as the review documents for the planning. Also, the residents in Jiangsu have relatively high enthusiasm and participation in land-use planning. Considering these above factors, we selected Jiangsu province as our survey area.
According to the different geographical location and economic development level, Jiangsu province is classified into three regions: southern Jiangsu, central Jiangsu and northern Jiangsu. Southern Jiangsu is a relatively developed area, northern Jiangsu is not too developed, central Jiangsu is a medium-developed area. We adopted the method of stratified sampling. We selected 2~3 investigated cities from these three regions separately and then randomly selected some communities from these cities. The investigated community need to meet these requirements: at least one project of land-use planning has been conducted within the recent 2 or 3 years, and the local public has strong willingness to participate, and respondents are willing to actively involved in our survey.
Before the formal investigation, we conducted a pre-survey. The main purpose of pre-survey is three aspects: one is to understand which areas meet our survey requirements, the second is whether our preliminary questionnaire can be understood by people, and the third is clarifying which issues of public perception people are concerned with. Based on our pre-survey, we confirmed the Liangyungang, Huaian (northern Jiangsu), Taizhou, Nantong (central Jiangsu), Nanjing, Changzhou, Suzhou (southern Jiangsu) as our investigated cities. The geographic distribution map of the valid survey participants can be seen Figure 4. In Figure 4, the number represents the quantity of valid samples for each of the investigated cities.

3.3. Questionnaire Design and Descrizption of the Field Work Methodology

Table 2 shows the design framework for our questionnaire survey combined with the feedback of our pre-survey. We improved our questionnaire, see Table A1 for details. To answer these questions effectively, 62 questions of our questionnaires are closed-ended. We used a Likert scale of five levels to measure the score of respondents. The field survey locations were distributed in 24 communities. Generally speaking, for surveys of urban and rural residents, we usually contact the community leader before our investigation and explain the purpose of our survey. They will arrange the appropriate time to assist our survey. In each community survey, we choose respondents based on the relative average distribution of different ages, occupations, genders, etc. For a better understanding of our questions, investigators would take some examples and explain the background of local land-use policy aiming to help respondents understand the questionnaire. Most of our questionnaires are done by means of face-to-face interviews. A very little respondents also said they would like to take the questionnaire back to fill it out by themselves, after which we can get it next time. The respondent representatives of the village collective are the leaders of rural residents. They and the respondent representatives of local land management department are also interviewed face-to-face. As regards the experts, media reporter and representatives of land developers or land enterprises, we emailed them with the questionnaire. After they filled in the questionnaires, they would return them to us. Data collection and analysis commenced in August 2015 and was completed in May 2017.

4. Results

4.1. Individual Characteristics of the Respondents

According to our pre-survey, we improved some questions and distributed 546 questionnaires in the study area. Of these, 416 questionnaires were complete and valid for analysis, 130 questionnaires were incomplete and were deleted. The effective return rate of the questionnaire was 76.2%. The descriptive statistical analysis of the sample based on the questionnaire data is seen as Table 3.
According to the statistical results of the survey, 57.2% of respondents in the survey were male, men are generally more motivated than women when it comes to public affairs in Jiangsu province. The ratio of urban residents (45%) is lower than rural residents (55%), which is due to the implementation of new rural areas construction in China in recently years. Married people were the majority of respondents, accounting for 84.1% of the sample population. Respondents’ age ranged from 30~50 years old almost half (49%), and the age of the respondent’s tile histogram appears in two obvious peaks, which are more concentrated in the age of 35 and 50. Education attainment was generally lower, with more than half (52.9%) of the subjects completing junior middle school and below. The income is basically in normal distribution, and the annual income of 43.5% respondents is 36,001–60,000 yuan. The survey respondents have a wide range of occupations, including farmers, technicians, restaurant staff, cleaners, janitors, office staff, drivers, accountants, white-collar workers, public officials, students.

4.2. Reliability, Validity, Model Fit

Based on the prior theory and the relationship among cognition, emotion, and behaviors, the hypothesis of the relationship among the various elements of the public perception was derived. In the preprocess, it was found that most of the sample data conforms to the multiple-variable normal assumption. Considering the model structural rationality and the accuracy of factor load and path coefficient of public perception, we applied the LISREL (maximum likelihood) method, using Moment Structure (version 22.0) to analyze the model test and parameter estimation [57,58]. The reliability analysis of the sample was carried out as seen in Table 4. This shows that Cronbach’s Alpha coefficient of the model variables is greater than or close to 0.8 and the overall reliability is 0.884, which all were in the acceptable range. This result indicated that internal consistency of model variables is good and the investigation result has a good reliability so that further data analysis is acceptable.
The Kaiser–Meyer–Olkin (KMO) measure of sampling adequacy is a statistical measurement that indicates the proportion of variance in variables that might be caused by underlying factors. The score closer to 1 means the variables are more reliable and the suggested minimum score is 0.6 [59,60]. The Bartlett’s test of sphericity is the test for the null hypothesis that the correlation matrix has an identity matrix. Taking this into consideration, these tests provide the minimum standard to proceed for factor analysis. After factor analysis of 30 variables, Table 5 showed the KMO value of sampling adequacy was 0.762, which indicates that the sample is adequate and we may proceed with the factor analysis. The approximate chi-square is 6330.698 with 435 degrees of freedom, which is significant at 0.05 level of significance. The KMO statistic of the dataset greater than 0.5 is acceptable [60], our KMO value is 0.762. Hence factor analysis is considered as an appropriate technique for further analysis of the data.
While a loading value of 0.5 is regarded as acceptable, the manifest variables with loading value of less than 0.5 should be dropped [61]. According to the factor loading matrix after rotation, factor loading index which is less than 0.5 (a31, a43, a64) were deleted. The factor loading of remnant variables is greater than 0.5 which means the latent construct accounts for at least 50% of the variance in the items. Therefore, this also indicated that 11 factors of public perception, namely the public expectation, perceived quality, perceived differences, perceived value and perceived availability, public satisfaction, public trust and public complaints, perceived behavior control, subjective norms, continuous behavior intention all have good structural validity.
After the factor analysis was revised, the endogenous latent variables are perceived quality, perceived difference, perceived value, perceived availability, public satisfaction, and continuous behavioral intention. Exogenous latent variables include all kinds of error and public expectation, perceived behavior control, subjective norms, public trust, and public complaints. The data of public perception was loaded into the model, and absolute fit indices, incremental fit indices and parsimonious fit indices were worked and are contained in Table 6. The AGFI (Adjusted Goodness of Fit Index), RMSEA (Root Mean Square Error of Approximation), CFI (Comparative Fit Index) and other indicators have reached the fitting requirements, which indicated that the modified perception model can better fit the sample data.

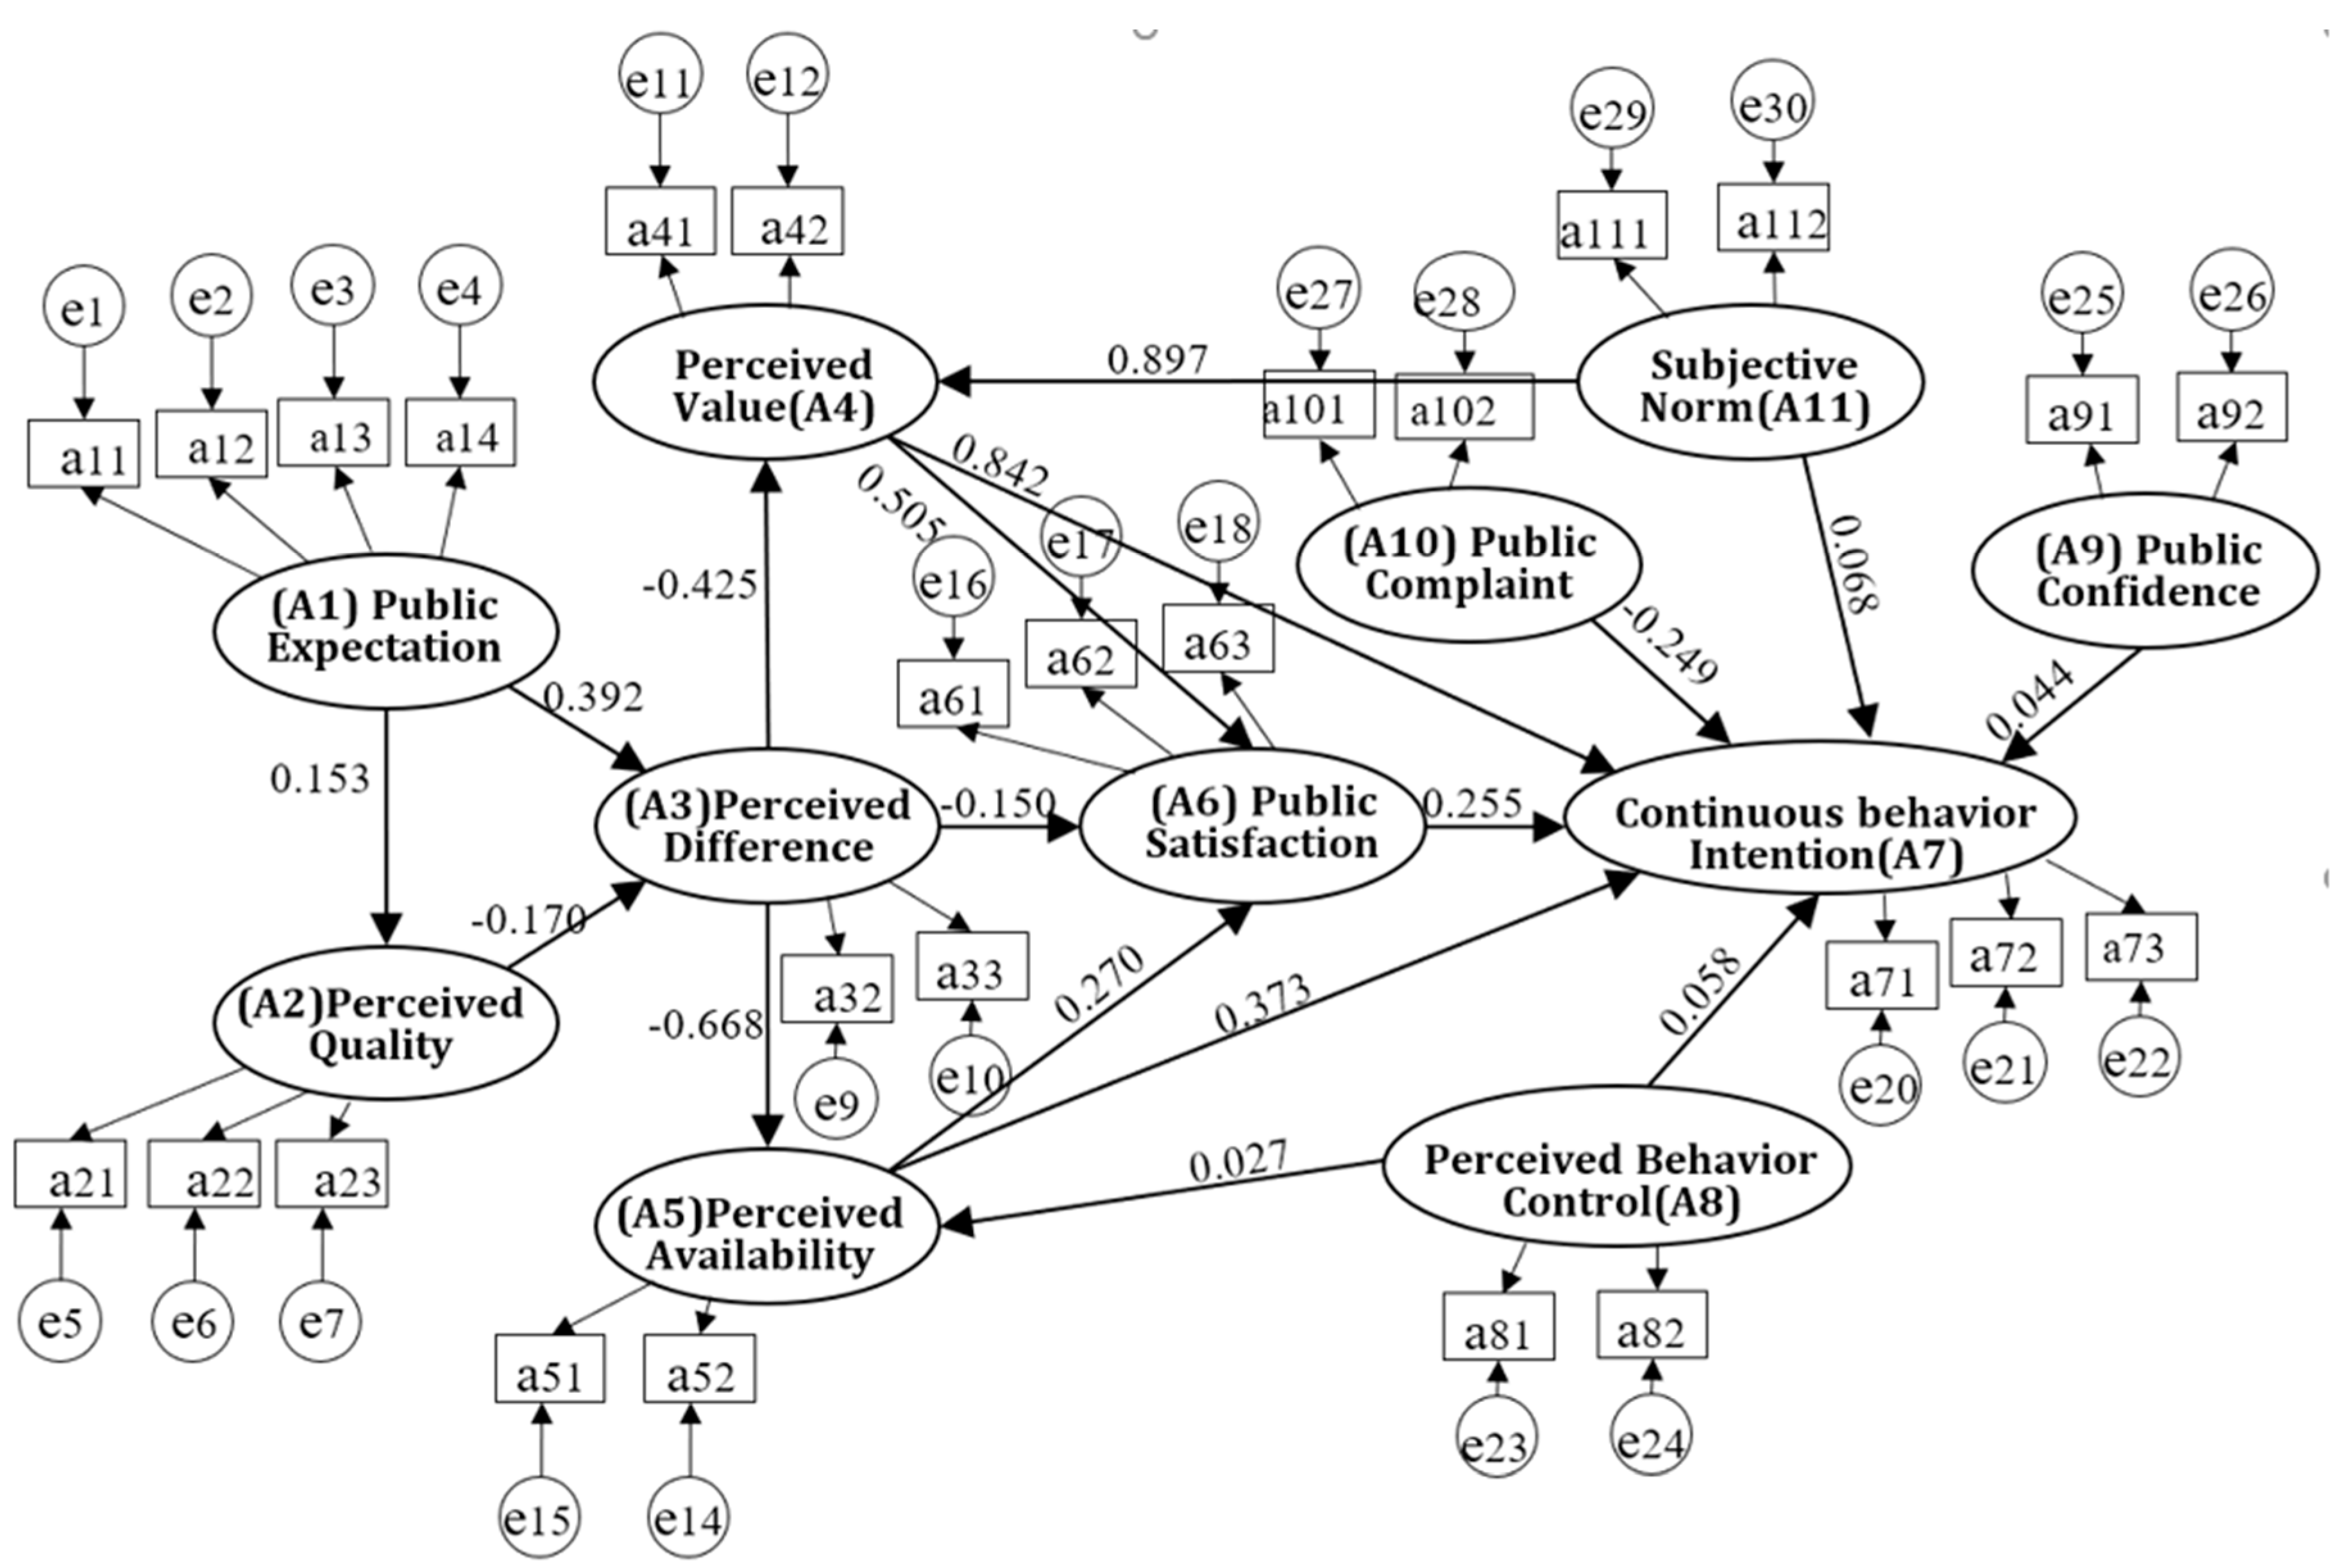
4.3. Model Path Coefficient Results

Standardized residual covariance from the results output means the immanent quality of the model. The result showed that the absolute value of the standardized residuals is less than 2 and most of the absolute value below 1. The immanent quality of the model is acceptable. Figure 5 shows the path coefficient of the planning public perception structure equation model. In Figure 5, the positive value indicates the positive correlation of the variable and the negative value indicates the negative correlation of the variable. The larger the value, the stronger the correlation. eX symbols represent each residuals from the model, each residual has a name, beginning with e1. Through the sample data fitting theory model of path coefficient analysis, we found that the direction is consistent with the theoretical expectations between latent variables; combined with the model fitting test result, the public perception theory model can better describe and explain the public and planning in the actual interaction.

5. Conclusions and Discussion

5.1. Result Analysis

Perceived difference is not easy to discern but is a special variable that can impact other variables. Perceived difference means the difference between the public expectation and perceived quality. The higher the deviation of the perceived expectation and quality, the greater the perceived difference. The result confirmed this. Public expectations have a positive influence on perceived differences (0.392) but perceived quality has an opposite influence on perceived differences (−0.170). Meanwhile, perceived difference also affected public satisfaction (−0.150), perceived value (−0.425) and perceived availability (−0.668) negatively. The greater the difference between the expected planning implementation and the expected public service quality, the lower the public satisfaction degree. The greater the perceived difference, the lower the planning perceived value. It would strongly reduce the public’s willingness to participate in planning and learning planning. The perceived difference negatively affects the perceived availability. When the gap between the public expectation and perceived quality expands, people are less likely to participate in planning information access. On the other hand, we also found that public expectations have a weak positive influence on perceived quality (0.153). The result changed our usual perspective. In general, we believe high expectations should come with high requirements of planning information resource quality, acquisition quality, or a better platform for appeal. The public is still relatively rational, and they rarely impose the subjective expectations to the perceived planning quality.
From Figure 5, it showed that perceived value and perceived availability could both promote public satisfaction (0.505, 0.270). The effect of perceived value is more apparent. Combined with the interview records of respondents, the public pays more attention to the economy, efficiency and equity of planning implementation. Subjective norm has a strong positive influence on perceived value (0.897). It indicated that the code of conduct generated by personal experience and the publicity from social media will prompt the public to make positive value judgments. But perceived behavior control has both a weak positive influence on perceived availability (0.027) and continuous behavior intention (0.058). It indicated that individual difference, such as the public’s self-evaluation, age, education, has little to do with whether the public willing to participate in planning or learning planning.
In addition to the public complaints having a negative impact on continued behavior intention (0.249), public satisfaction, perceived behavior control, public trust, subjective norm, perceived availability, and perceived value all have a positive influence on continued participation behavior. In particular, perceived value is the highest (0.842). The public’s continued participation tendency will become more evident as public satisfaction, personal beliefs and abilities, public trust, and perceived value and perception has improved.

5.2. Discussion

Public perception essentially indicates the performance of the public participation system. Before land-use planners can effectively find more sustainable community development patterns to adapt urban change, they must understand the source of public discontent and impact of their behavior and attitude towards neighborhoods and overall community well-being. The public forms a primary impression of public affairs and executes subsequent information extraction, internalized absorption, and emotional judgment. Eventually, the public show their attitudes and behaviors. For example, they express their feedback and appeal or put these emotions into planning participation or other public affairs. The process is a multivariate iteration interaction effect.
On the cognitive level, perceived difference is considered to be an important factor. The public forms their own opinions through the accumulation of relevant knowledge, which is mainly the information related to the passive acquisition of public affairs and the evaluation information of other public services. Our research result showed that public expectation and perceived quality have opposite effects on perceived difference and the public expectation is more influential. Public expectations and perceived quality are the responses to a planning department’s description of the vision. If the planning vision provides a clear and convincing picture of the future, and the information of planning is easy to understand, then there is easy learning for the public. Cognition and emotion can be well integrated. When the planner or planning department describes the planning vision to the public, they need to pay more attention to the realization of the promise and add more participation channels to enhance service quality.
The core element of the emotional level is perceived value. The three variables at the emotional level and perceived value, has far more influence on the continuous behavior intention than the other two variables, public satisfaction and perceived availability. Perceived value also has a greater impact on public satisfaction than perceived availability. Obviously, the value improvement is what the public really cares about. Perceived value cover three pillars of sustainability in our questionnaire. That is to say, the public is more concerned about whether the new planning project could add the value to the land, protect community environment, improve the condition of low-income and minority population. This indicates that the public puts more emphasis on the sustainability of planning projects. On the other hand, subjective norms, namely, the code of conduct generated by personal experience and the publicity and rendering of media public opinion in society, have a strong positive influence on perceived value. In other words, the public may be more susceptible to their own experience and media influence to form their own value judgments. Perceived value and perceived availability will reduce when the difference between perceived quality and perceived expectation is obvious. When the public perceives that the service channel is inconvenient or unresponsive, public satisfaction will weaken quickly.
The information provided by the cognitive stage affect the public’s emotional judgment which has a certain personal preference. Then behavioral intention generated by these emotions will affect the public’s final behavioral choice. As the key factor in behavior level, continuous behavioral intention is the public’s intention to re-participate or recommend to others to participate in planning. The four factors of the behavior level, public trust, public complaints, perceived behavior control, and subjective norms, have less influence on continuous behavior intention than the emotional level. This suggests that the public pays more attention to the last experience to decide whether to participate in planning again rather than complaining about the planning department or planner. In particular, the environmental value, economic value and equitable value perceived by the public has a strong influence on the continuous participation intention. What the public really cares about is still the improvement that planning implementation brings to their living environment. In the process of cognition, emotion, behavior, the input of information is an important first step. The influence of personal emotional judgment on the participation behavior intention is at the intermediate level. The experience of participating in public affairs plays an important role in the whole process. The knowledge acquired in the early stage and the influence of individual emotional judgment have more influence on the behavior of participation.
As the main interest group in planning, the public has the most direct perception towards the planning of the process and final implementation. The public perception towards planning directly influences their value judgment and participation degree. When information channels are unblocked and accessible, this could enhance the public’s cognition and inspire their participation behavior. Sharing information and build understanding by education and learning planning knowledge is reinforcement for the planning process itself. Local land use is subject to continuous changes in response to trends. However, an everlasting concern is that people are always concerned about the sustainability of community development. When the public perceive these land-use values, economic development, environmental protection, social equity, are sustainable, they will convert a pleasant participation into continuous participation motivation and stimulate positive participation behavior repeatedly. They also will share their experience with others to encourage more group “consensus building”. This paper focuses on attitude theory and extends the application fields to public perception. The research could further account for the resource of public satisfaction and public behavior and provide a reference for public affairs, thus further enhancing sustainable development in public affairs and the effect of public decision-making.

Author Contributions

Conceptualization, Z.Q. and Y.L.; Methodology, Z.Q. and Y.L.; Software, Y.L.; Validation, T.T. and Y.L.; Formal Analysis, Z.J.; Investigation, Z.Q. and Y.L.; Resources, Z.Q.; Data Curation, Y.L.; Writing-Original Draft Preparation, Z.Q.; Writing-Review & Editing, E.B and Z.J.; Visualization, Y.L.; Supervision, E.B. and T.T.; Project Administration, Z.Q.; Funding Acquisition, Z.Q.

Funding

This article was supported by the Key Project of Jiangsu University Philosophy and Social Science (Project No. 2017ZDIXM099), Nanjing Agricultural University Humanities and Social Sciences Priority Projects (Project No. SKYZ2018037) and the 111 Project (Fund No. B17024).

Acknowledgments

The work of this paper has been supported by National Joint Local Engineering Research Center for Rural Land Resources Use and Consolidation, Nanjing Agricultural University and School of Architecture, University of Virginia. The authors would also like to thank Xuhua, Bao, Mobai, Chen, Yexuan, Huang, Xiao Yu, Ming Zhang for assisting the field investigation.

Conflicts of Interest

The authors declare no conflict of interest.

Appendix A

Table A1. Questionnaire of public perceptions.
Variable CodeQuestionAssessment
A1a111_1.1Do you think the local government can take the advice from the public into account?1-strongly disagree, 2-disagree, 3-neutral, 4-agree, 5 strongly agree
1_1.2Do you think local land-use planning can improve your life and meet your needs?1-strongly disagree, 2-disagree, 3-neutral, 4-agree, 5 strongly agree
a121_2.1Do you think the government can obey the law and regulation to implement land-use planning?1-strongly disagree, 2-disagree, 3-neutral, 4-agree, 5 strongly agree
1_2.2Do you think the goals of land-use planning can succeed during the planning period?1-strongly disagree, 2-disagree, 3-neutral, 4-agree, 5 strongly agree
a131_3.1Are you willing to participate in land-use planning and give some advice about improve the planning?1-strongly disagree, 2-disagree, 3-neutral, 4-agree, 5 strongly agree
1_3.2Have you learned or learned about land-use planning?0-yes, 1-no
1_3.3Are you willing to learn about land-use planning in order to participate more effectively?1-strongly unwilling, 2-unwilling, 3-neutral, 4-willing, 5 strongly willing
1_3.4Do you think it difficult to learn or understand knowledge of land-use planning?1-strongly disagree, 2-disagree, 3-neutral, 4-agree, 5 strongly agree
a141_4.1Do you think the government has established a multiple platform for the public to give their opinions?1-strongly disagree, 2-disagree, 3-neutral, 4-agree, 5 strongly agree
A2a212_1.1Do you think the information given by the government (village committee) is what you need to know to meet your needs?1-strongly disagree, 2-disagree, 3-neutral, 4-agree, 5 strongly agree
2_1.2Do you think the relevant information you have obtained can answer your question?1-strongly disagree, 2-disagree, 3-neutral, 4-agree, 5 strongly agree
a222_2.1Do you think you can easily find a planning information consulting service?1-strongly disagree, 2-disagree, 3-neutral, 4-agree, 5 strongly agree
2_2.2Do you think the staff can patiently listen to your presentation and understand your requirements?1-strongly disagree, 2-disagree, 3-neutral, 4-agree, 5 strongly agree
2_2.3Do you think the staff can explain the relevant regulations and policies accurately?1-strongly disagree, 2-disagree, 3-neutral, 4-agree, 5 strongly agree
2_2.4Do you think the staff of the information desk can answer your questions and give you satisfactory answers?1-strongly disagree, 2-disagree, 3-neutral, 4-agree, 5 strongly agree
a232_3.1Do you think you can easily find the service staff or to accept the public appeal service?1-strongly disagree, 2-disagree, 3-neutral, 4-agree, 5 strongly agree
2_3.2Do you think the staff can listen to my request patiently?1-strongly disagree, 2-disagree, 3-neutral, 4-agree, 5 strongly agree
2_3.3Do you think the staff can feedback your request in time?1-strongly disagree, 2-disagree, 3-neutral, 4-agree, 5 strongly agree
2_3.4Do you think the staff of the information desk can give you a satisfactory reply?1-strongly disagree, 2-disagree, 3-neutral, 4-agree, 5 strongly agree
A3a313_1.1Do you think the improvement in result from planning can meet your expectations?1-strongly disagree, 2-disagree, 3-neutral, 4-agree, 5 strongly agree
a323_2.1Do you think the planning information can meet your expectation?1-strongly disagree, 2-disagree, 3-neutral, 4-agree, 5 strongly agree
a333_3.1Do you think the feedback of your request can meet your expectation?1-strongly disagree, 2-disagree, 3-neutral, 4-agree, 5 strongly agree
A4a414_1.1Do you think the implementation of land-use planning can relieve environmental pressure?1-strongly disagree, 2-disagree, 3-neutral, 4-agree, 5 strongly agree
4_1.2Do you think the implementation of land-use planning is conducive to improving the landscape?1-strongly disagree, 2-disagree, 3-neutral, 4-agree, 5 strongly agree
a424_2.1Do you think the implementation of land-use planning can promote local GDP?1-strongly disagree, 2-disagree, 3-neutral, 4-agree, 5 strongly agree
4_2.2Do you think the implementation of local land-use planning is conducive to employment?1-strongly disagree, 2-disagree, 3-neutral, 4-agree, 5 strongly agree
a434_3.1Do you think it’s unfair to divide the key areas in planning?1-strongly disagree, 2-disagree, 3-neutral, 4-agree, 5 strongly agree
4_3.2Do you think local land-use planning can meet the interests of the local majority?1-strongly disagree, 2-disagree, 3-neutral, 4-agree, 5 strongly agree
A5a515_1.1Do you think the information about land-use planning is readable?1-strongly disagree, 2-disagree, 3-neutral, 4-agree, 5 strongly agree
5_1.2Do you think the information about land-use planning is learnable?1-strongly disagree, 2-disagree, 3-neutral, 4-agree, 5 strongly agree
5_1.3Have you been to the urban planning exhibition?0-yes, 1-no
5_1.4Do you know urban planning administration bureau?0-yes, 1-no
5_1.5Have you studied or consulted knowledge of land-use planning?0-yes, 1-no
5_1.6Do you think the government provides enough chance for learning knowledge of land-use planning?1-strongly disagree, 2-disagree, 3-neutral, 4-agree, 5 strongly agree
5_1.7If the government provides training and learning about land-use planning knowledge, would you like to participate in the study?0-yes, 1-no
a525_2.1Do you know how to get information about local land-use planning?0-yes, 1-no
5_2.2Do you know how to us the public appeal service about local land-use planning?0-yes, 1-no
5_2.3Do you think the various channels provided by government departments can be used successfully?1-strongly disagree, 2-disagree, 3-neutral, 4-agree, 5 strongly agree
A6a616_1.1Do you think the vision and reality of land-use planning is satisfactory?1-strongly disagree, 2-disagree, 3-neutral, 4-agree, 5 strongly agree
a626_2.1Do you think the vision and reality of land-use planning is matching?1-strongly disagree, 2-disagree, 3-neutral, 4-agree, 5 strongly agree
a636_3.1Are you satisfied with the access to information in the process and results of planning?1-strongly dissatisfaction, 2-dissatisfaction, 3-neutral,4-satisfaction,5-strongly satisfaction
a646_4.1Are you satisfied with the process and result when you express your request to the government?1-strongly dissatisfaction, 2-dissatisfaction, 3-neutral,4-satisfaction,5-strongly satisfaction
A7a717_1.1Are you willing to participate in the next land-use planning?1-strongly unwilling, 2-unwilling, 3-neutral, 4-willing, 5-strongly willing
a727_2.1Are you willing to participate in land-use planning or persistence or regularly?1-strongly unwilling, 2-unwilling, 3-neutral, 4-willing, 5-strongly willing
a737_3.1Are you willing to share your participation experience to others?1-strongly unwilling, 2-unwilling, 3-neutral, 4-willing, 5-strongly willing
A8a818_1.1Do you have the ability to participate in land-use planning?1-strongly disagree, 2-disagree, 3-neutral, 4-agree, 5 strongly agree
8_1.2Do you think you should be professional to get involved in planning?1-strongly disagree, 2-disagree, 3-neutral, 4-agree, 5 strongly agree
8_1.3Do you totally understand the training knowledge about planning organized by the government?1-strongly disagree, 2-disagree, 3-neutral, 4-agree, 5 strongly agree
A9a919_1.1Do you think planning will change your life?1-strongly disagree, 2-disagree, 3-neutral, 4-agree, 5 strongly agree
9_1.2Do you think public participation in planning is a good move?1-strongly disagree, 2-disagree, 3-neutral, 4-agree, 5 strongly agree
a929_2.1Do you think you can get more information if you participate in planning?1-strongly disagree, 2-disagree, 3-neutral, 4-agree, 5 strongly agree
9_2.2Do you think you can receive a good or satisfactory reply when you give your idea through a public participation platform?1-strongly disagree, 2-disagree, 3-neutral, 4-agree, 5 strongly agree
A10a10110_1.1Do you think public supervision is a good way to supervise land-use planning implementation?1-strongly disagree, 2-disagree, 3-neutral, 4-agree, 5 strongly agree
10_1.2Do you think public supervision achieves its goals?1-strongly disagree, 2-disagree, 3-neutral, 4-agree, 5 strongly agree
10_1.3Do you think public supervision can create harmonious society?1-strongly disagree, 2-disagree, 3-neutral, 4-agree, 5 strongly agree
a10210_2.1How do you satisfied with the feedback after you express your request to the government?1-strongly disagree, 2-disagree, 3-neutral, 4-agree, 5 strongly agree
A11a11111_1.1Do you think it is necessary for you to participate in land-use planning?1-strongly disagree, 2-disagree, 3-neutral, 4-agree, 5 strongly agree
11_1.2Do you think you should give your opinions or suggestions when the local government asks for opinions?1-strongly disagree, 2-disagree, 3-neutral, 4-agree, 5 strongly agree
11_1.3Do you think participating in asking for opinions will take up your time?1-strongly disagree, 2-disagree, 3-neutral, 4-agree, 5 strongly agree
a11211_2.1How do you willing to participate the next planning if you know others have a good experience in this time?1-strongly unwilling, 2-unwilling, 3-neutral, 4-willing, 5-strongly willing
11_2.2How do you willing to participating in land-use planning if others have not got enough of a response?1-strongly unwilling, 2-unwilling, 3-neutral, 4-willing, 5-strongly willing
11_2.3Do you think the publicity from news or TVs will promote you participating in planning?1-strongly disagree, 2-disagree, 3-neutral, 4-agree, 5 strongly agree
Note: the scoring basis of a82, namely convenient conditions (the public age, education degree, etc.).
Individual abilities increase first and then decrease with age. So, we divided age into 5 levels according to the relationship between age and individual ability level. In general, the more educated the people, the more likely their learning ability. The scoring basis of a82 is shown Table A2.
Table A2. The scoring basis of convenient conditions.
Score54321
Age26–4647–6768–88<25>89
EducationPostgraduate or aboveCollege or universityJunior collegeHigh schoolMiddle school or below

References

  1. Burger, J.; Myers, O.; Boring, C.S.; Dixon, C.; Jeitner, J.C.; Leonard, J.; Lord, C.; McMahon, M.; Ramos, R.; Shukla, S.; et al. Perceptual indicators of environmental health, future land use, and stewardship. Environ. Monit. Assess. 2003, 89, 285–303. [Google Scholar] [CrossRef] [PubMed]
  2. Miller, I.; Campbell, M.; Huttenlocher, D.; Kline, F.-R.; Nathan, A.; Lupashin, S.; Catlin, J.; Schimpf, B.; Moran, P.; Zych, N.; et al. Team Cornell’s Skynet: Robust perception and planning in an urban environment. J. Field Robot. 2008, 25, 493–527. [Google Scholar] [CrossRef]
  3. Cervantes, O.; Espejel, I.; Arellano, E.; Delhumeau, S. Users’ perception as a tool to improve urban beach planning and management. Environ. Manag. 2008, 42, 249–264. [Google Scholar] [CrossRef] [PubMed]
  4. Shindler, B.; Gordon, R.; Brunson, M.W.; Olsen, C. Public Perceptions of Sagebrush Ecosystem Management in the Great Basin. Rangel. Ecol. Manag. 2011, 64, 335–343. [Google Scholar] [CrossRef] [Green Version]
  5. Hagedorn, C.; Blanch, A.R.; Harwood, V.J. Microbial Source Tracking: Methods, Applications, and Case Studies; Springer: New York, NY, USA, 2011; ISBN 978-1-4419-9385-4. [Google Scholar]
  6. Hoffman, D.D.; Singh, M.; Prakash, C. The Interface Theory of Perception. Psychon. Bull. Rev. 2015, 22, 1480–1506. [Google Scholar] [CrossRef] [PubMed]
  7. Berke, P.R.; Godschalk, D.R.; Kaiser, E.J.; Rodriguez, D.A. Urban Land Use Planning, 5th ed.; University of Illinois Press: Urbana, IL, USA, 2006; ISBN 978-0-252-03079-6. [Google Scholar]
  8. Fan, Y. A Research about Public Participation in the Process of Master-Urban-Planning in China—An Introduction of Practice of Gathering Public Opinion via Questionnaire Survey. Adv. Appl. Sociol. 2015, 5, 13–22. [Google Scholar] [CrossRef]
  9. Grönroos, C. A Service Quality Model and its Marketing Implications. Eur. J. Mark. 1984, 18, 36–44. [Google Scholar] [CrossRef]
  10. Lewis, R.C.; Booms, B.H. The Marketing Aspects of Service Quality. In Emerging Perspective on Service Marketing; Berry, L., Shostack, G., Upah, G., Eds.; American Marketing Association: Chicago, IL, USA, 1983; Volume 65, pp. 99–107. [Google Scholar]
  11. Parasuraman, A.; Zeithaml, V.A.; Berry, L.L. A Conceptual Model of Service Quality and Its Implications for Future Research. J. Mark. 1985, 49, 41–50. [Google Scholar] [CrossRef]
  12. Bandura, A. Social Foundations of Thought and Action: A Social Cognitive Theory; Prentice-Hall Series in Social Learning Theory; Prentice-Hall: Englewood Cliffs, NJ, USA, 1986; ISBN 978-0-13-815614-5. [Google Scholar]
  13. Severson, H.H.; Slovic, P. Adolescents perception of risk: Understanding and preventing high risk behavior. Adv. Consum. Res. 1993, 20, 177–182. [Google Scholar]
  14. Alshehri, S.A.; Rezgui, Y.; Li, H. Public perceptions and attitudes to biological risks: Saudi Arabia and regional perspectives. Disasters 2016, 40, 799–815. [Google Scholar] [CrossRef] [PubMed]
  15. Li, X.; Chen, W.; Cundy, A.B.; Chang, A.C.; Jiao, W. Analysis of influencing factors on public perception in contaminated site management: Simulation by structural equation modeling at four sites in China. J. Environ. Manag. 2018, 210, 299–306. [Google Scholar] [CrossRef] [PubMed]
  16. Bronfman, N.C.; Cifuentes, L.A. Risk perception in a developing country: The case of Chile. Risk Anal. 2003, 23, 1271–1285. [Google Scholar] [CrossRef] [PubMed]
  17. Becker, S.; Sparks, P. Talking about Climate Change Mitigation: People’s Views on Different Levels of Action. Sustainability 2018, 10, 1357. [Google Scholar] [CrossRef]
  18. Ochoo, B.; Valcour, J.; Sarkar, A. Association between perceptions of public drinking water quality and actual drinking water quality: A community-based exploratory study in Newfoundland (Canada). Environ. Res. 2017, 159, 435–443. [Google Scholar] [CrossRef] [PubMed]
  19. Kim, K.-S. Changes in Risk Perception of Seoul National University Students in Nuclear Power under Opposing Government Policy. Sustainability 2018, 10, 2350. [Google Scholar] [CrossRef]
  20. Yan, Y.; Lu, F. A Survey and Analysis on the Sense of Nuclear Safety & Security for the Public: A Chinese Perspective. Sustainability 2018, 10, 2495. [Google Scholar] [CrossRef]
  21. Gaillard, J.-C. Alternative paradigms of volcanic risk perception: The case of Mt. Pinatubo in the Philippines. J. Volcanol. Geotherm. Res. 2008, 172, 315–328. [Google Scholar] [CrossRef]
  22. Lü, W.; Chen, Y.; Huang, J. The Study on the Model and Evaluation of the Public Perceived Administrative Services Quality: A Comparative Study of Different Regions and Different Public. Nankai Bus. Rev. 2009, 12, 143–151. [Google Scholar]
  23. Yang, Z.; Yin, P.; He, X. The Public Perception of Government Departments’ Division and Overlapping on Responsibilities: Based on The Statistical Analysis of Environmental Management. Chin. Public Adm. 2015, 6, 82–87. [Google Scholar] [CrossRef]
  24. Lankford, S.V.; Howard, D.R. Developing a tourism impact attitude scale. Ann. Tour. Res. 1994, 21, 121–139. [Google Scholar] [CrossRef]
  25. Horn, C.; Simmons, D. Community adaptation to tourism: Comparisons between Rotorua and Kaikoura, New Zealand. Tour. Manag. 2002, 23, 133–143. [Google Scholar] [CrossRef]
  26. Perdue, R.R.; Long, P.T.; Allen, L. Resident support for tourism development. Ann. Tour. Res. 1990, 17, 586–599. [Google Scholar] [CrossRef]
  27. Youngs, Y.L.; White, D.D.; Wodrich, J.A. Transportation Systems as Cultural Landscapes in National Parks: The Case of Yosemite. Soc. Nat. Resour. 2008, 21, 797–811. [Google Scholar] [CrossRef]
  28. Susskind, L. Citizen Participation and Consensus Building in Land Use Planning. In The Land Use Policy Debate in the United States; de Neufville, J.I., Ed.; Springer: Boston, MA, USA, 1981; pp. 183–204. ISBN 978-1-4613-3254-1. [Google Scholar]
  29. Martin, N.J.; Rice, J.L.; Lodhia, S.K. Sustainable Development Planning: A Case of Public Participation using Online Forums: Sustainable Development Planning and Public Participation. Sustain. Dev. 2014, 22, 265–275. [Google Scholar] [CrossRef]
  30. Mahdavinejad, M.; Amini, M. Public Participation for Sustainable Urban Planning in Case of Iran. Procedia Eng. 2011, 21, 405–413. [Google Scholar] [CrossRef]
  31. Habermas, J.; MacCarthy, T.; Habermas, J. Reason and the Rationalization of Society; The Theory of Communicative Action; Beacon Press: Boston, MA, USA, 2007; ISBN 978-0-8070-1507-0. [Google Scholar]
  32. Gavrilidis, A.A.; Ciocănea, C.M.; Niţă, M.R.; Onose, D.A.; Năstase, I.I. Urban Landscape Quality Index—Planning Tool for Evaluating Urban Landscapes and Improving the Quality of Life. Procedia Environ. Sci. 2016, 32, 155–167. [Google Scholar] [CrossRef]
  33. Derak, M.; Cortina, J.; Taiqui, L. Integration of stakeholder choices and multi-criteria analysis to support land use planning in semiarid areas. Land Use Policy 2017, 64, 414–428. [Google Scholar] [CrossRef]
  34. Liepa-Zemeša, M.; Hess, D.B. Effects of public perception on urban planning: Evolution of an inclusive planning system during crises in Latvia. Town Plan. Rev. 2016, 87, 71–92. [Google Scholar] [CrossRef]
  35. Brown, G.; Sanders, S.; Reed, P. Using public participatory mapping to inform general land use planning and zoning. Landsc. Urban Plan. 2018, 177, 64–74. [Google Scholar] [CrossRef]
  36. Khew, J.Y.T.; Yokohari, M.; Tanaka, T. Public Perceptions of Nature and Landscape Preference in Singapore. Hum. Ecol. 2014, 42, 979–988. [Google Scholar] [CrossRef]
  37. Chen, B.; Zhang, F. Trend and Priority in Land use research of China. Geogr. Res. 2011, 30, 1–9. [Google Scholar]
  38. McNabb, D.E. The New Face of Government: How Public Managers Are Forging a New Approach to Governance; American Society for Public Administration Series on Public Administration and Public Policy; CRC Press: Boca Raton, FL, USA, 2009; ISBN 978-1-4200-9387-2. [Google Scholar]
  39. Fishbein, M.; Ajzen, I. Belief, Attitude, Intention, and Behavior: An Introduction to Theory and Research; Addison-Wesley Series in Social Psychology; Addison-Wesley Pub. Co: Reading, PA, USA, 1975; ISBN 978-0-201-02089-2. [Google Scholar]
  40. Kaplan, D. Structural Equation Modeling: Foundations and Extensions, 2nd ed.; Advanced Quantitative Techniques in the Social Sciences; SAGE: Los Angeles, CA, USA, 2009; ISBN 978-1-4129-1624-0. [Google Scholar]
  41. Wright, S. The Relative Importance of Heredity and Environment in Determining the Piebald Pattern of Guinea-Pigs. Proc. Natl. Acad. Sci. USA 1920, 6, 320–332. [Google Scholar] [CrossRef] [PubMed]
  42. Tarka, P. An overview of structural equation modeling: Its beginnings, historical development, usefulness and controversies in the social sciences. Qual. Quant. 2018, 52, 313–354. [Google Scholar] [CrossRef] [PubMed]
  43. MacCallum, R.C.; Austin, J.T. Applications of Structural Equation Modeling in Psychological Research. Ann. Rev. Psychol. 2000, 51, 201–226. [Google Scholar] [CrossRef] [PubMed]
  44. Fornell, C. A Second Generation of Multivariate Analysis; Praeger: New York, NY, USA, 1982; ISBN 978-0-03-062632-6. [Google Scholar]
  45. Hancock, G.R.; Mueller, R.O.; Stapleton, L.M. The Reviewer’s Guide to Quantitative Methods in the Social Sciences; Routledge: New York, NY, USA, 2010; ISBN 978-0-415-96507-1. [Google Scholar]
  46. Bagozzi, R.P.; Yi, Y. Specification, evaluation, and interpretation of structural equation models. J. Acad. Mark. Sci. 2012, 40, 8–34. [Google Scholar] [CrossRef]
  47. Zhang, X.; Prybutok, V.; Strutton, D. Modeling Influences on Impulse Purchasing Behaviors During Online Marketing Transactions. J. Mark. Theory Pract. 2007, 15, 79–89. [Google Scholar] [CrossRef]
  48. Liao, C.; Chen, J.-L.; Yen, D.C. Theory of planning behavior (TPB) and customer satisfaction in the continued use of e-service: An integrated model. Comput. Hum. Behav. 2007, 23, 2804–2822. [Google Scholar] [CrossRef]
  49. Crano, W.D.; Prislin, R. Components of Vested Interest and Attitude-Behavior Consistency. Basic Appl. Soc. Psychol. 1995, 17, 1–21. [Google Scholar] [CrossRef]
  50. Rossmann, C. Theory of Reasoned Action—Theory of Planned Behavior. In Konzepte. Ansätze der Medien- und Kommunikationswissenschaft; Nomos: Baden-Baden, Germany, 2011; ISBN 978-3-8329-4249-6. [Google Scholar]
  51. Yaghoubi, N.-M.; Kazemi, M.; Moloudi, J. Review of relationship between organizational intelligence and intellectual capital. Interdiscip. J. Contemp. Res. Bus. 2010, 2, 355–363. [Google Scholar]
  52. Liao, C.; Chuang, S.-H.; To, P.-L. How knowledge management mediates the relationship between environment and organizational structure. J. Bus. Res. 2011, 64, 728–736. [Google Scholar] [CrossRef]
  53. World Health Organization. Health Hazards and Public Debate: Lessons for Risk Communication from the BSE/CJD Saga; World Health Organization, Regional Office for Europe: Copenhagen, Denmark, 2006; ISBN 978-92-890-1070-2. [Google Scholar]
  54. Mitchell, R.K.; Agle, B.R.; Wood, D.J. Toward a Theory of Stakeholder Identification and Salience: Defining the Principle of Who and What Really Counts. Acad. Manag. Rev. 1997, 22, 853–886. [Google Scholar] [CrossRef]
  55. Driscoll, C.; Starik, M. The Primordial Stakeholder: Advancing the Conceptual Consideration of Stakeholder Status for the Natural Environment. J. Bus. Ethics 2004, 49, 55–73. [Google Scholar] [CrossRef]
  56. Wang, Q.; Wu, X. Jiangsu Economic Development Analysis and Outlook (Jiangsu Blue Book 2017); Social Sciences Academic Press: Beijing, China, 2017; ISBN 978-7-5201-0631-3. [Google Scholar]
  57. Jöreskog, K.G.; Sörbom, D. LISREL 8: Structural Equation Modeling with the SIMPLIS Command Language; 4 print (with foreword and computer exercises); Erlbaum [u.a.]: Hillsdale, NJ, USA, 1998; ISBN 978-0-89498-033-6. [Google Scholar]
  58. Byrne, B.M. Structural Equation Modeling with Amos: Basic Concepts, Applications, and Programming, 3rd ed.; Multivariate Applications Series; Routledge, Taylor & Francis Group: New York, NY, USA, 2016; ISBN 978-1-138-79702-4. [Google Scholar]
  59. Cerny, B.A.; Kaiser, H.F. A Study of a Measure of Sampling Adequacy for Factor-Analytic Correlation Matrices. Multivar. Behav. Res. 1977, 12, 43–47. [Google Scholar] [CrossRef] [PubMed]
  60. Kaiser, H.F. An index of factorial simplicity. Psychometrika 1974, 39, 31–36. [Google Scholar] [CrossRef]
  61. Hair, J.F. Multivariate Data Analysis, 7th ed.; Prentice Hall: Upper Saddle River, NJ, USA, 2010; ISBN 978-0-13-813263-7. [Google Scholar]
Figure 1. The process pf public perception based on ABC attitude theory.
Sustainability 10 03056 g001
Figure 2. Conceptual framework of public perception during the planning.
Sustainability 10 03056 g002
Figure 3. A theoretical basis for the selection of survey respondents.
Sustainability 10 03056 g003
Figure 4. The geographic distribution map of the valid survey participants.
Sustainability 10 03056 g004
Figure 5. The path coefficient of planning public perception structure equation model.
Sustainability 10 03056 g005
Table 1. Common sign and meanings of structural equation models.
SignMeanings
Sustainability 10 03056 i001Rectangle, represents the observed variable.
Sustainability 10 03056 i002Ellipse, represents the latent variable.
Sustainability 10 03056 i003Single arrow, represents a one-way effect or causality.
Sustainability 10 03056 i004Two-way arrow, represents correlation or covariance.
Table 2. Variables setting.
Latent VariableObservational VariableIndex Sources and Reference
codedefinitioncodedefinition
A1Public Expectationa11The public’s overall expectation for land-use planning to meet their immediate needsSCSB (Swedish Customer Satisfaction Barometer); ACSI (American Customer Satisfaction Index)
a12The public’s overall expectations for the effectiveness of land-use planning
a13The public’s expectations for access to diverse information
a14The public’s overall expectation for the building the multiple channels or platform receive from public opinion
A2Perceived qualitya21Information resource quality People agreement
a22Information acquisition quality
a23Quality of appeal platform
A3Perceived Differencea31Difference between performance benefits with expected planningClassical CSI (SCSB, ACSI)
a32Difference between expected information and actual information
a33Difference between expected interest claims channel and actual channel
A4Perceived Valuea41Environment value about the implementation of land-use planningAM (Acceptance Model)
a42Economics value about the implementation of land-use planning
a43Equitable value about the implementation of land-use planning
A5Perceived Availabilitya51The public’s continuous acquisition of planning related knowledge
a52The accessibility of public study platform or channel
A6Public Satisfactiona61The public’s satisfaction about the result of land-use planning compared with their expectationACSI (American Customer Satisfaction Index); ECSI (European Customer Satisfaction Index)
a62The public satisfaction about the result of land-use planning compared with their ideal
a63The public’s satisfaction with information acquisition process and results
a64The public’s satisfaction with the process and outcome of interest claims
A7Continuous Behavior Intentiona71Intention to participate in land-use planning againZhang, X. and Prybutok, V Zeithaml [47],
Liao, C., Chen, J. L., & Yen, D. C. [48].
a72Intention to frequent participation in land-use planning
a73Intention of recommending others to participate in land-use planning
A8Perceived Behavior Controla81Self-efficacy (Self-evaluation of the ability to participate in planning) Bandura William. Crano, RadmilaPrislin [49]; TPB (theory of planned behavior) [39,50]
a82Convenient conditions (the public age, education degree, etc.)
A9Public Confidencea91The public’s trust in land-use planning to improve life People agreement
a92The public’s trust in participation in land-use planning
A10Public Complainta101Access to public complaints and supervision People agreement
a102Feedback to public comments or suggestions
A11Subjective Norma111Influence of public individual normative beliefs Nour-Mlohammad Yaghoubi [51];
Chechen Liao et al. [52]
a112Social information influence of public individuals
Table 3. Description of respondents’ characteristics.
FrequencyPercentValid PercentCumulative Percent
GenderMale23857.257.257.2
Female17842.842.8100.0
Total416100.0100.0
AreaRural22955.055.055.0
Urban18745.045.0100.0
Total416100.0100.0
Marital StatusMarried35084.184.184.1
Unmarried6615.915.9100.0
Age20–308219.719.719.7
31–4010024.024.043.8
41–5010425.025.068.8
51–608219.719.788.5
More than 604811.511.5100.0
Total416100.0100.0
EducationMiddle school or below22052.952.952.9
High school11126.726.779.6
Junior college51.21.280.8
College or university4510.810.891.6
Postgraduate or above358.48.4100.0
Total416100.0100.0
Annual Income
(yuan)
More than 9600286.76.76.7
9601–18,000317.57.514.2
18,001–36,00011728.128.142.3
36,001–60,00018143.543.585.8
>60,0015914.214.2100.0
Total416100.0100.0
OccupationAgriculture4310.310.310.3
Manufacturing Industry 419.99.920.2
Hotel and catering7518.018.038.2
Wholesale and retail5413.013.051.2
Financial215.05.056.2
office225.35.361.5
Administration4611.111.172.6
Student 4711.311.383.9
others6716.116.1100.0
Total416100.0100.0
Table 4. Reliability analysis.
Basic StructuresVariableCronbach’s Alpha
CognitionPublic Expectation (A1)0.772
Perceived Quality (A2)0.918
Perceived Difference (A3)0.809
AffectPerceived Value (A4)0.790
Perceived Availability (A5)0.698
Public Satisfaction (A6)0.704
BehaviorContinuous Behavior Intention (A7)0.927
Perceived Behavior Control (A8)0.705
Public Confidence (A9)0.715
Public Complaint (A10)0.678
Subjective Norm (A11)0.713
Total Samples0.840
Table 5. Kaiser–Meyer–Olkin (KMO) measure and Bartlett’s Test.
Kaiser–Meyer–Olkin Measure of Sampling Adequacy0.762
Bartlett test of sphericityThe approximate chi-square6330.698
df435
Sig.0.000
Table 6. Fitness measurement result of perception model.
Absolute Fit IndicesIncremental Fit IndicesParsimonious Fit Indices
NCGFIAGFISRMRRMSEANFITLIRFIIFICFIPGFIPNFICN
Standard(1, 3)>0.9>0.8<0.05<0.08>0.9>0.9>0.9>0.9>0.9>0.5>0.5>200
Original model2.740.8750.8060.0340.0810.7250.8640.9020.8720.8870.5210.582416
Modification model1.530.9060.8850.0260.0420.9050.9370.9410.9290.9240.6540.723416

