Measuring Taxi Accessibility Using Grid-Based Method with Trajectory Data


1
MOE Key Laboratory Urban Transportation Complex System Theory and Technology, Beijing Jiaotong University, Beijing 100044, China
2
College of Metropolitan Transportation, Beijing University of Technology, Beijing 100044, China
*
Author to whom correspondence should be addressed.
Sustainability 2018, 10(9), 3187; https://0-doi-org.brum.beds.ac.uk/10.3390/su10093187
Submission received: 3 August 2018
/
Revised: 29 August 2018
/
Accepted: 3 September 2018
/
Published: 6 September 2018
(This article belongs to the Section Sustainable Transportation)
Abstract
:Accessibility has drawn extensive attention from city planners and transportation researchers for decades. With the benefits of large-scale and varying time, this study aims to combine the taxi global positioning system (GPS) data with a cumulative opportunity measure to calculate taxi accessibility in Beijing, China. As traffic conditions vary significantly over time and space, we select four typical time periods and introduce a grid-based method to divide the study area into grid cells. Both the GPS signals and opportunities that include the constant points of interest, total drop-offs, and dynamic drop-offs, are aggregated in these grid cells. The cumulative opportunity measure counts all reachable grid cells within the given travel time threshold, along with the corresponding opportunities. The results demonstrate that the accessibility varies in the four time periods, with better performance seen in the late-night hours. Although the spatial distributions of the three kinds of opportunities are different, these accessibilities show great similarity. In addition, the relative accessibilities of different measures are highly correlated. In general, grid cells with higher accessibilities in one time period are likely to also have higher accessibilities in other time periods. Moreover, the results suggest that taxi accessibility can be measured from its trajectory data only.
1. Introduction
With the continuing urbanization and rapid growth of cities around the world, traffic demands are increasing faster than traffic supplies. Therefore, it is critical to understand the changing land use structure and transport conditions to identify poorly accessible areas and improve their accessibility [1]. Accessibility is an appropriate indicator to evaluate the interaction between traffic and land use, which can simultaneously consider the travel road network and travel demand. It considers not only travel efficiencies but also the distribution of land-use and activity locations across the transport network [1]. Accessibility was first defined as a measure of the potential for interaction [2]. Conventionally, the accessibility measure is based on survey data, census geodemographics, and transport data, which cost large quantities of time and money. In addition, the available data are limited, making it difficult to capture daily fluctuations in accessibility.
Taxis are flexible and are spread around the urban area of a city. The increasing availability of taxi global positioning system (GPS) data makes it easier to measure the taxi accessibility, meaning the number of opportunities reachable from each grid cell within the given time threshold in this study, which can reflect the accessibility of the urban road network. Although metro trains and buses play the most important role in intra-city travel, they can only provide service in fixed stations of routes, and some service gaps exist. Taxis provide the flexible door-to-door service and 24 h operations, and have wider coverage than other modes of transportation from the temporal and spatial perspectives [3].
This study aims to combine the large-scale taxi GPS data with the cumulative opportunity measure to calculate taxi accessibility. The method can attain the real-time taxi accessibility in grid cell level. With more available travel data, the method provides a new approach to measure accessibility which is easy to implement.
The remainder of this paper is organized as follows. An overview of the state-of-the-art for accessibility is provided in Section 2. The study area and related data are presented in detail in Section 3. The methodology used to measure taxi accessibility is introduced in Section 4. Then, the results of the application are presented in Section 5. Finally, the conclusions and future work are presented in Section 6.
2. Literature Review
After the concept of accessibility was first defined [2], accessibility was seen as a measure of “the average number of opportunities which the residents of the area possesses to take part in a particular activity or set of activities” [4], within a given travel time, distance, or generalized cost [5]. A simple measure of accessibility is the cumulative opportunity measure, which is also known as the contour measure [6] or isochronic measure [7], counting the number of opportunities available within a given travel time, distance or cost (fixed costs). This measure is easy to calculate and understand, and all destinations are weighted equally [8]. The cumulative opportunity measures are relatively undemanding of data and easy for researchers and policy makers to interpret because no assumptions are made based on a personal perception of transport, land-use, and their interactions [6]. The cumulative opportunity measure is a method used to calculate the location-based accessibility, which is a useful tool for transportation planning and assessing transportation systems at an aggregated level. This measure is quite useful for understanding the relationship between transportation and land use [9].
At the early stage, the cumulative opportunity measures focused on the structure of urban road network and transit schedules, or relied upon travel times from a travel demand model. A tool called Urban.Access, based on a geographic information system, was proposed to model the road network to calculate the access area within the given travel time [10]. Besides, the travel speed depends on the road congestion. Similarly, the cumulative opportunity accessibility by car with different congestion levels was calculated and it was used for the interactive design of integrated transport and land use plans [11]. The individual public transportation accessibility areas were calculated within 30, 45, and 60 min [12]. It was suggested accessibility should be measured for each mode and for different traffic conditions [11].
In recent years, the temporal factors are taken into consideration for cumulative opportunity measures. The isochrones were formally defined for multimodal spatial networks that can be discrete or continuous in space and time, respectively [13]. Accessibility has been calculated continuously over time and used to evaluate transit systems [14]. Moreover, the spatial and temporal constraints and a set of transit features that affected access to transit systems to develop a conceptual framework for transit accessibility measurements in a potential transit-oriented development location were employed [15]. In addition, opportunities also have their own diurnal rhythms that may or may not coincide with the rhythms of the transportation networks, which might impact the accessibility [16]. An opportunity-based transit accessibility measure was proposed, in which indicators are sensitive to the availability of opportunities for travelers within a day [17]. Three kinds of opportunities are used to conduct a cumulative opportunity measure for five time periods, including constant service and constant number of jobs, variable transit service and constant number of job, variable service, and variable number of available jobs [8]. The historical speed profiles measuring the performance of the transport network and the Twitter data reflecting the attractiveness of the destinations are combined to analyze the urban dynamic accessibility [18]. The relationship between the cumulative accessibility within 30 min travel time by rail and transit-oriented development level was explored, which demonstrated that cumulative rail-based accessibility is higher in cities with a higher transit-oriented development degree, almost in direct proportion [11].
Furthermore, there have been studies that utilized taxi GPS data to explore accessibility. A stochastic methodology was proposed for GIS-based accessibility modeling using GPS-based floating car data and Monte Carlo simulation, which was illustrated using a case study on medical emergency service accessibility [19]. A novel integrated access measure was introduced to compute the accessibility to points of interest (POIs), which was able to capture the temporal dynamics by taking into account the speed variability using floating car data during peak and off-peak hours on weekdays and weekends [20]. Furthermore, a geographically weighted spatial regression model was applied to find that a higher relationship between taxi and metro ridership in the regions where lower accessibility to metro stations existed [21]. Furthermore, a strong link between demand for taxi, land use patterns, and accessibility to other modes is found [22]. A high-resolution grid was imposed over the study area to compute accessibility at a high disaggregation level. It was observed that the travel time threshold and POI weights had a profound influence on the final accessibility values. Moreover, a method was developed to systematically examine the current urban land use and road network conditions as well as to identify poorly connected regions, using GPS data collected from taxis [1]. Changes in automobile accessibility over the course of the day—as coursed by congestion of the road network in eight metropolitan areas of the European Union—were studied, which indicated that congestion most notably affects accessibility distribution inside each city [23].
In general, most previous studies focused on the structure of an urban road network and a fixed speed to evaluate the accessibility [7,10,12], which are easy to conduct but can only give a common accessibility. With the increasing availability of vehicle GPS data, such data have been incorporated to infer the average speed or speed distribution [1,19,23,24]. Then, the speed and road network were combined to measure the accessibility. However, the real-time transportation data are seldom applied to calculate accessibility. For example, the average travel speed is calculated from the taxi GPS data to measure network accessibility [1]. It is a gap to use high resolution data to generate time-varying accessibility. In this study, we measure the accessibility by analyzing the taxi trajectories. In addition, a grid-based method is used to assist the accessibility measure. However, there are also limitations because the measure is based only on taxi mode and the data of other modes are required for further overall exploration.
3. Data
3.1. Study Area
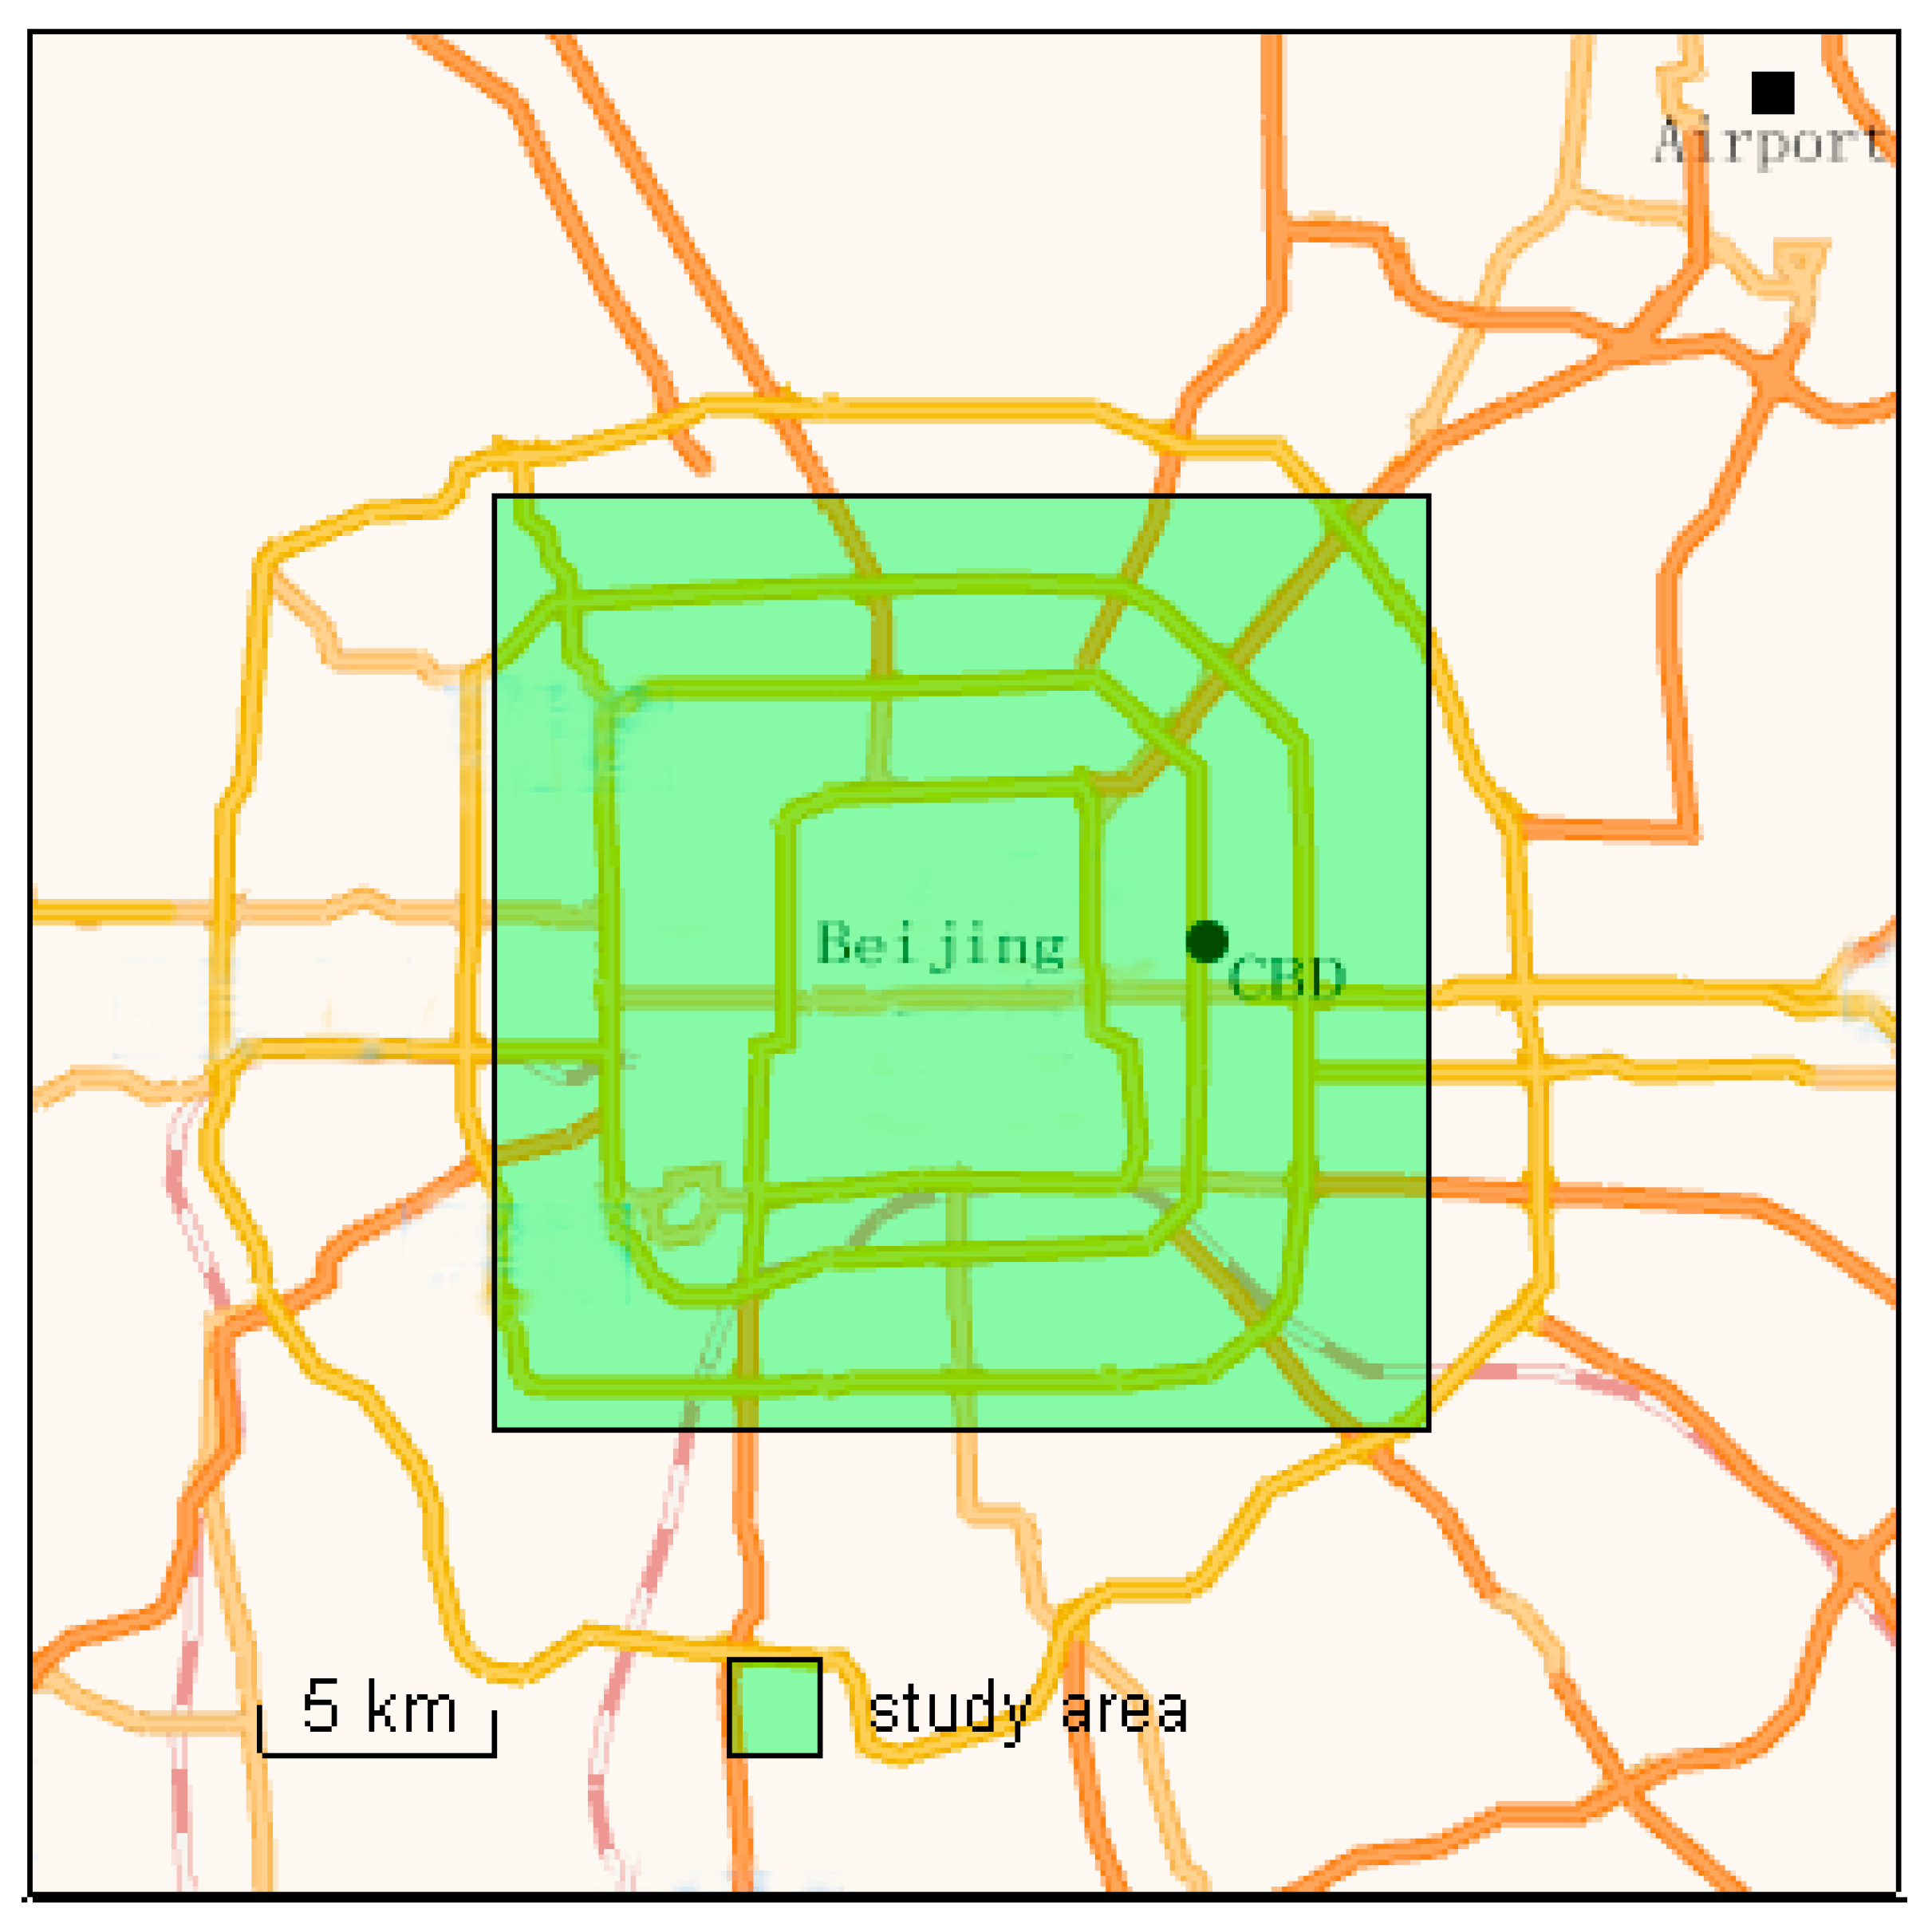
The study is conducted in urban area of Beijing, China. The entire city is divided into grid cells for conducting further analyses. To determine an appropriate size for these grid cells, we referred to some studies that measured accessibility or related explorations using taxi GPS data, in which the average size of the study units varied considerably, with values, such as 2.14 km2 in the Twin Cities [25]; 0.4 × 0.4 km in Wuhan [24]; 1 × 1 km in Montreal [26], Harbin [1], and Shanghai [27]. Here, considering the road network density, each grid cell is set at 1 × 1 km. The spatial distribution of opportunities is only presented in the 40 × 40 km urban region (see Figure 1).
3.2. Taxi GPS Data
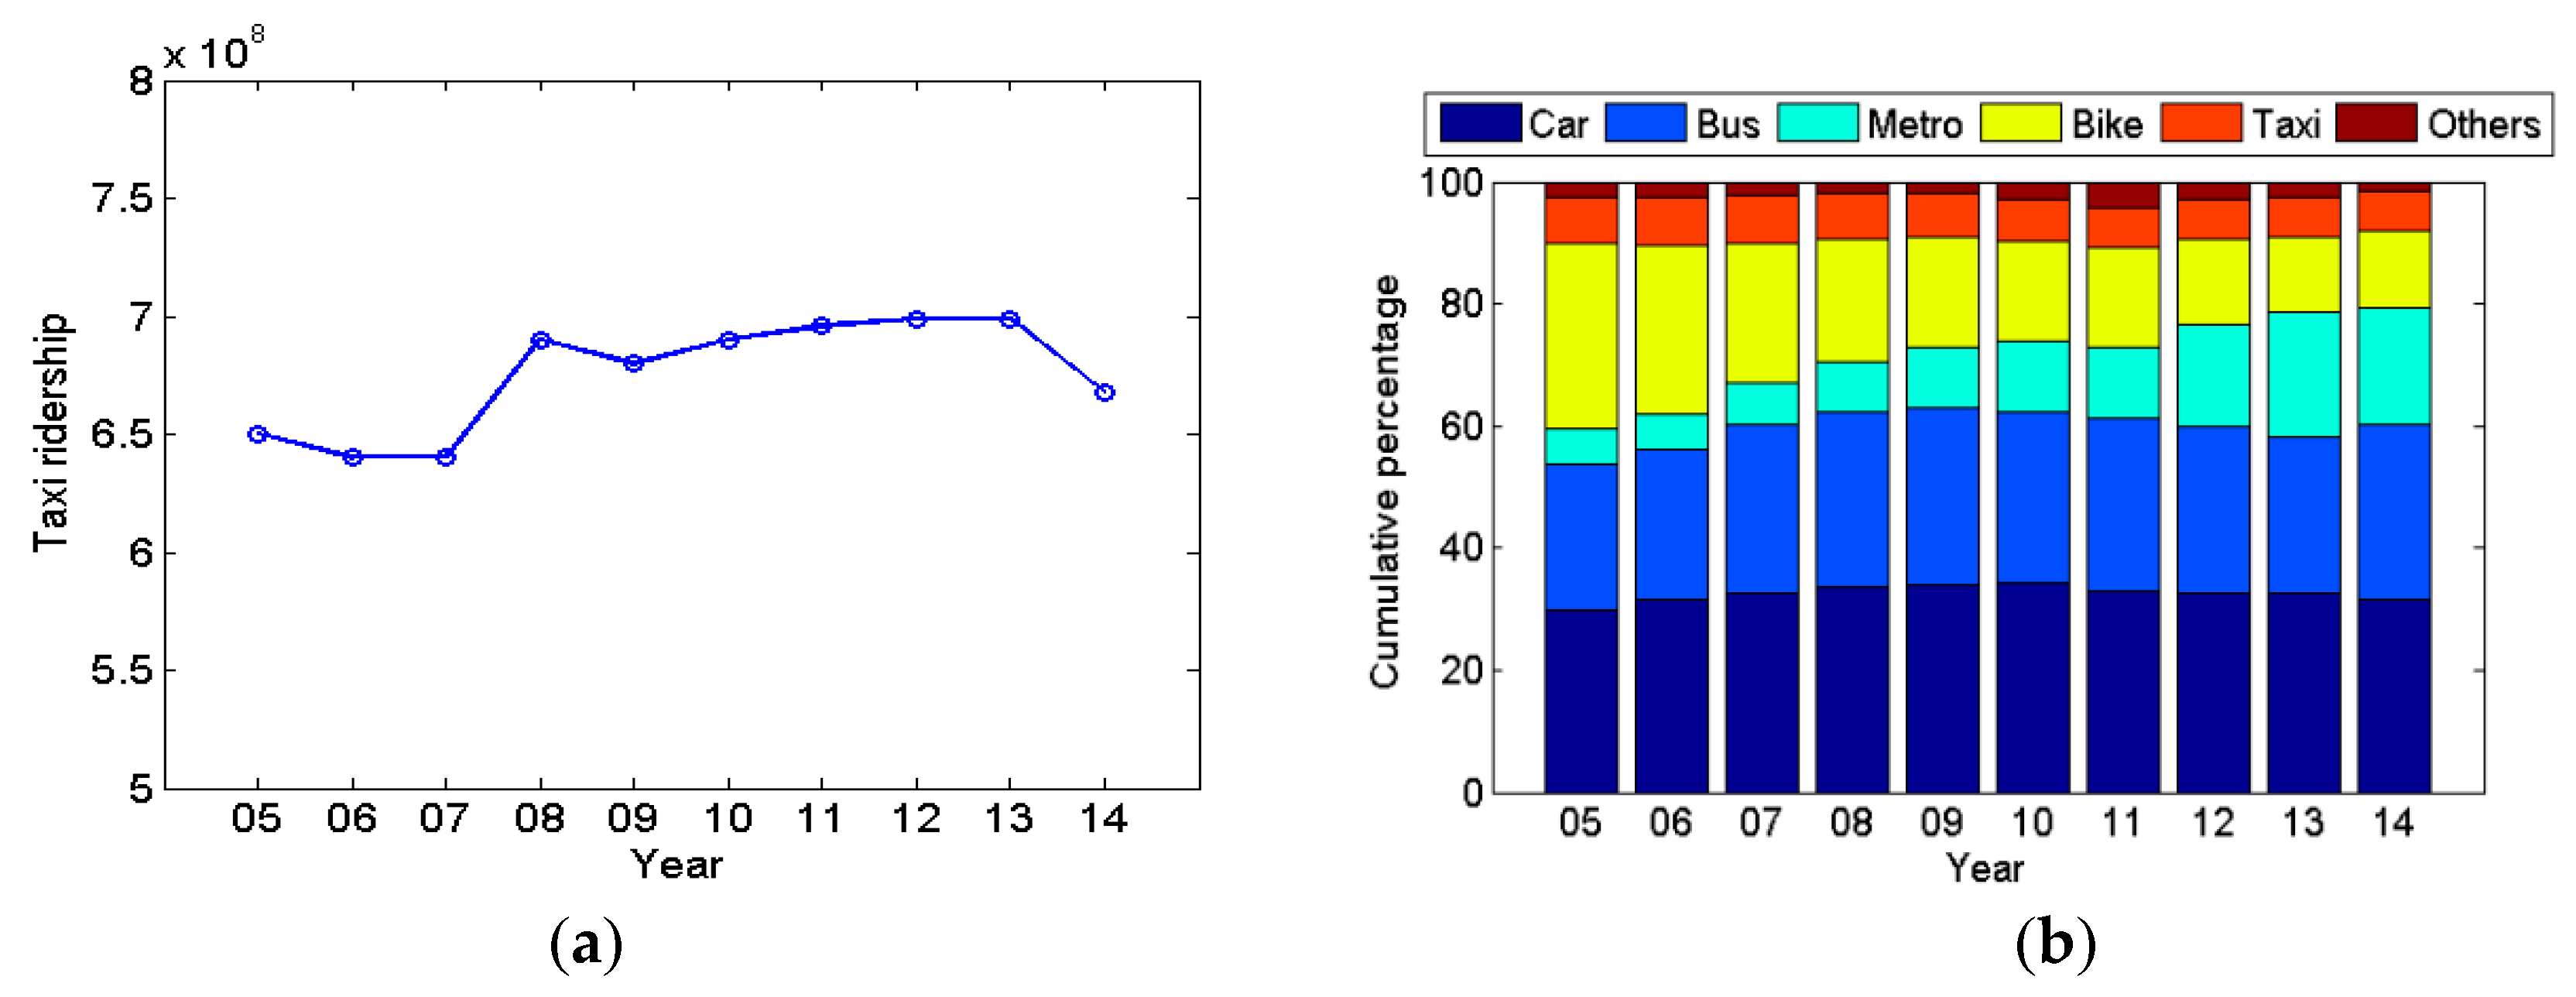
By the end of 2014, there were more than 67,000 licensed taxis in Beijing, which completed 0.668 billion trips in 2014, taking 6.2% of the total trips in the city. There were 4.499 million private cars in the city, which generated 31.5% of the total trips. This indicates that one taxi makes 13.3 times as many trips as a private car. Figure 2a presents the annual taxi ridership over the last decade. The modal split is presented in Figure 2b, in which the taxi holds a stable proportion. In recent years, almost every taxi vehicle has been equipped with a GPS device to assist in dispatching vehicles and preventing taxi drivers from receiving assaults. Thus, it does not cost any extra fare to collect the taxi GPS data. Taking these characteristics of taxis into account, it is an excellent tool to study accessibility in the city. Overall, Beijing is a typical megacity suffering from serious traffic congestion and taxis are widely used in daily life. This paper measures taxi accessibility based on their trajectory data in Beijing, China. It has to be noted that there are an increasing number of ridesharing services in Beijing, which may affect the use of taxis. Some taxi trips can be replaced by a ridesharing service, such as Didi [28]. However, because of the data limitation, such ridesharing trips are not included in this study.
To explore taxi accessibility, we examine the real-time vehicle trajectory data of more than 46,000 taxis from 12–16 January in 2015 from Beijing, China [29,30,31]. The taxi trajectory data were collected at approximately 1-min intervals. Each record includes the recording time, vehicle ID, location (longitude and latitude), instantaneous velocity, operational status (with passengers or not), and driving direction. There are 2.175 million trips in the dataset, with an average of 0.435 million trips per day. As this study is highly dependent on GPS data to measure accessibility, it is necessary to learn about the GPS signals of each grid cell and select the areas with higher taxi GPS signals to measure accessibility.
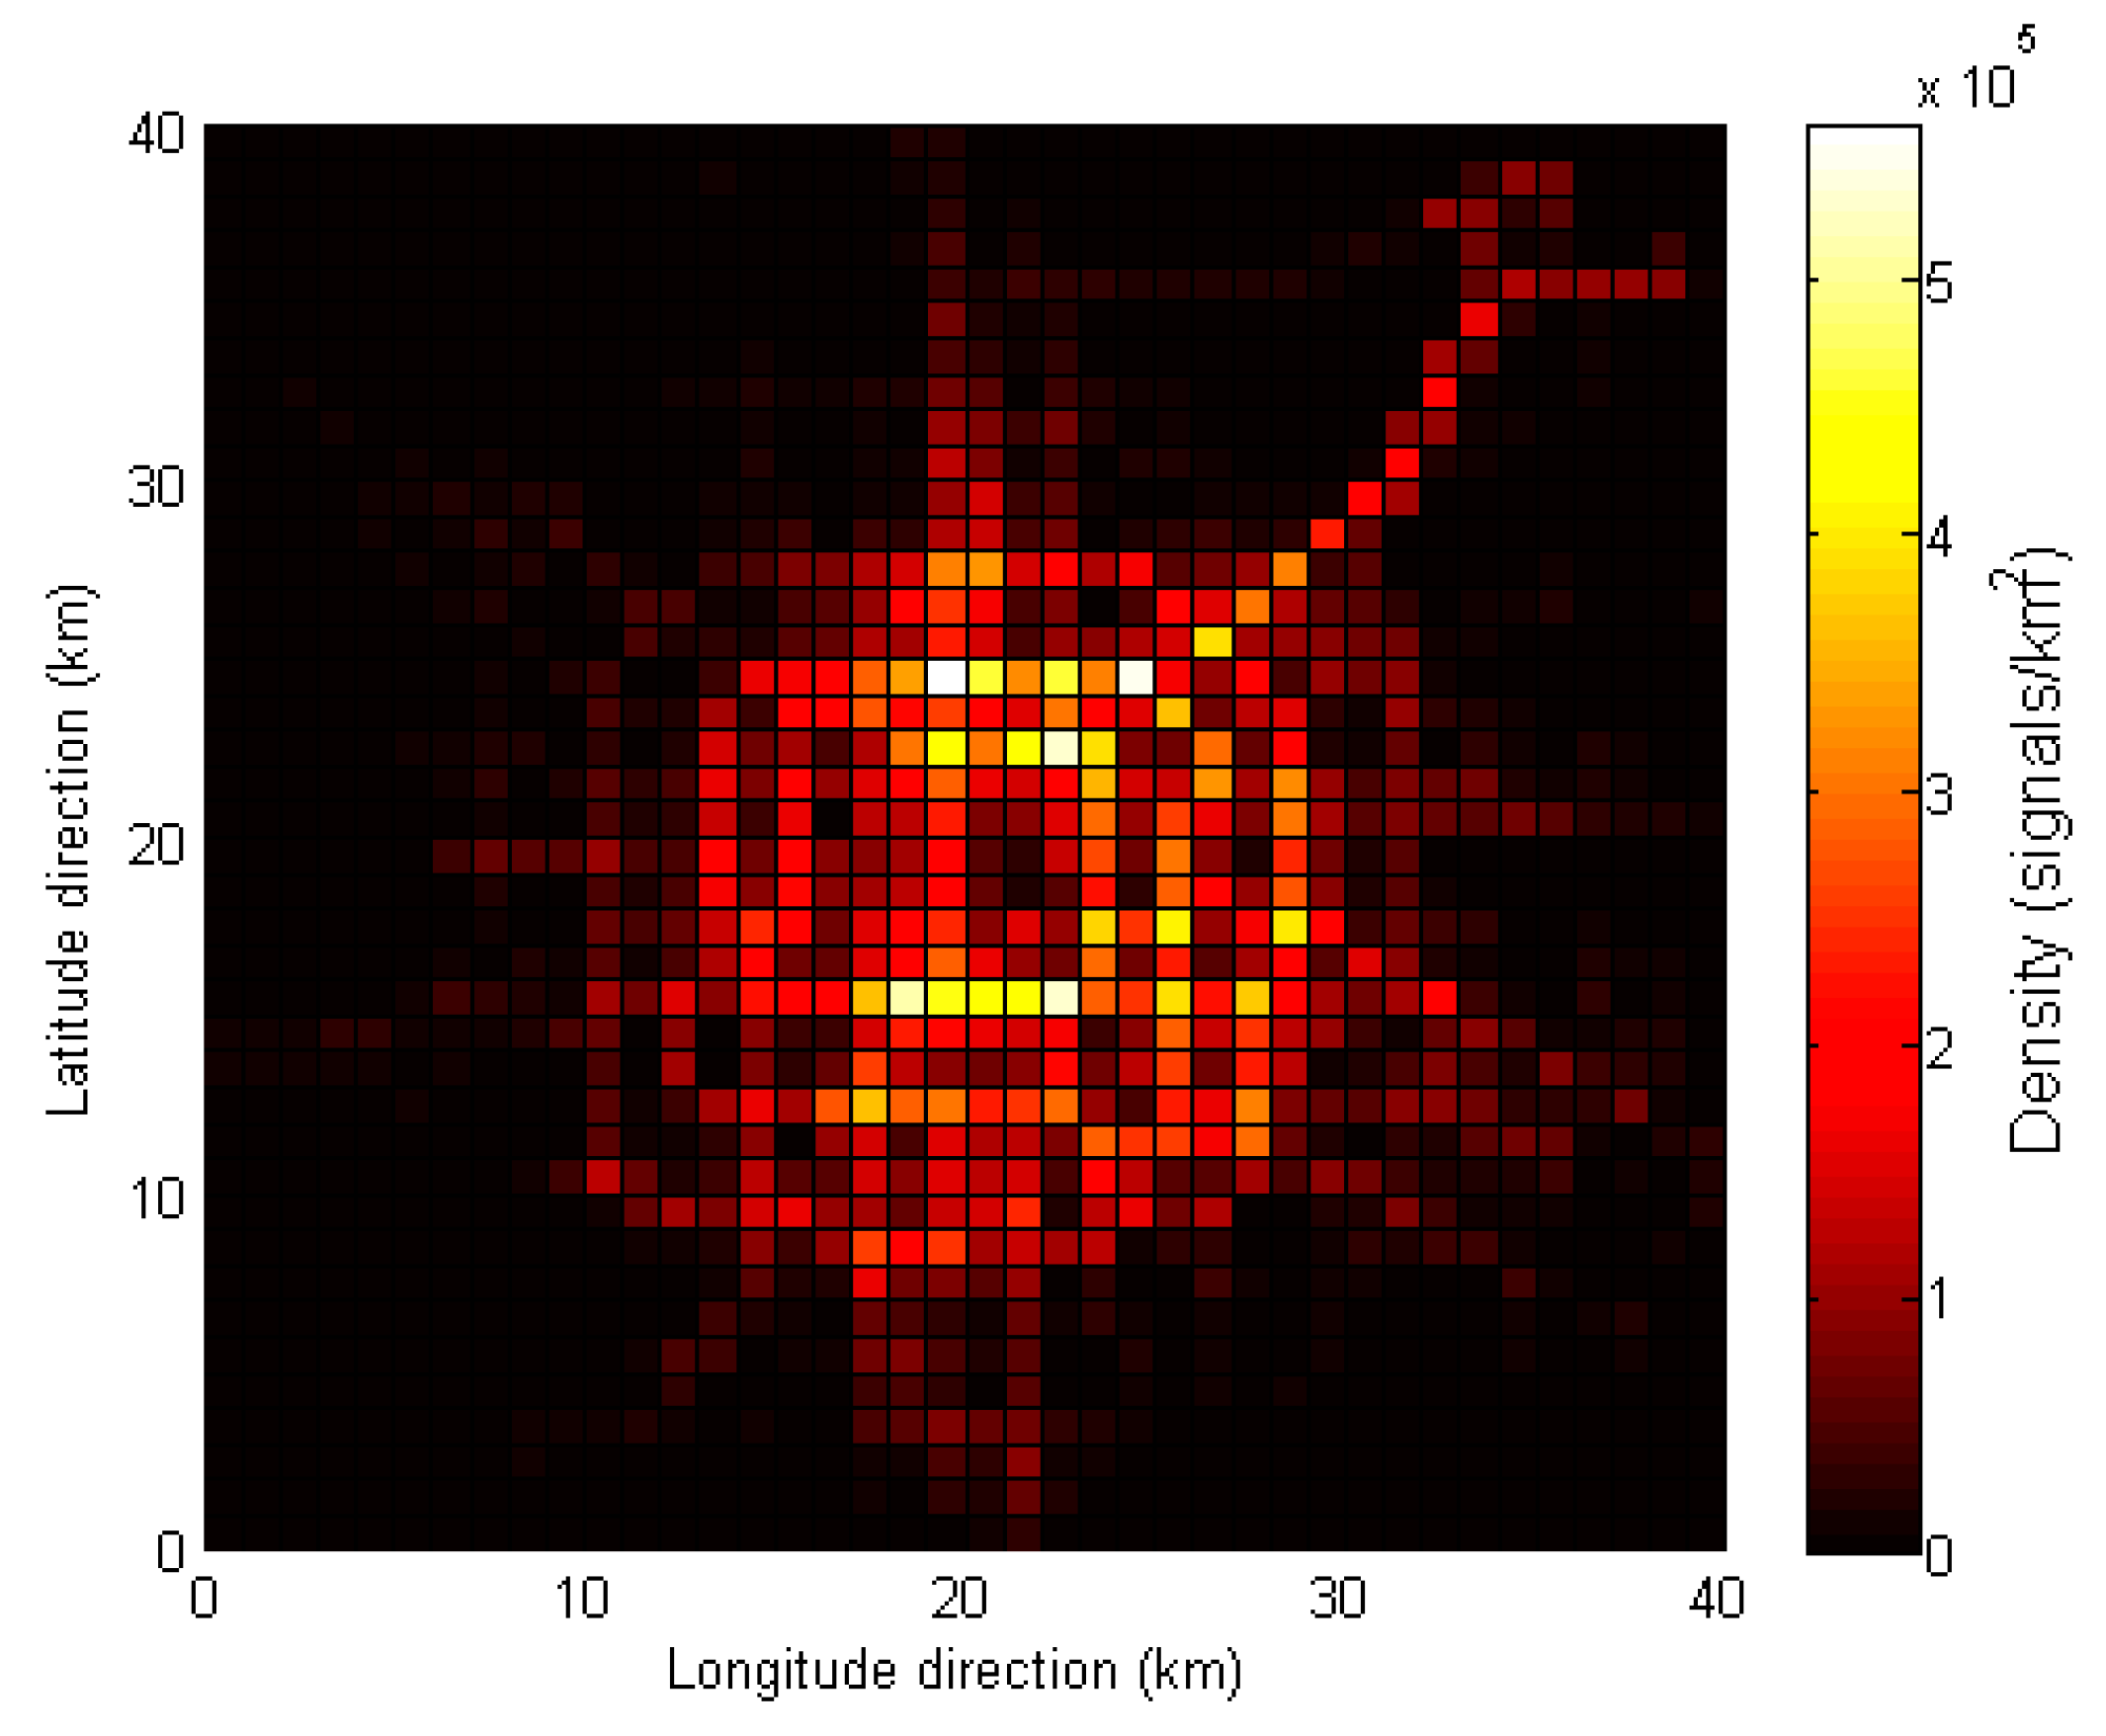
The taxi GPS signals that represent the distribution of taxi vehicles are aggregated in the grid cell level (see Figure 3). According to Figure 3, the signals are highly concentrated in the urban area. In addition, the GPS signals are spread along the radial expressways with a high density. As the method used in this study requires a measured region with a high GPS signal coverage, the central part of the city is selected to measure the taxi accessibility (see Figure 1).
4. Methodology
4.1. Data Processing
The original GPS data usually contain bad signals and missing records with random errors. In order to improve the quality, it is necessary to identify and delete the invalid records that are not consistent with the actual traffic phenomena. During the data processing, three types of records are removed: (i) records with zeros as either longitude or latitude attributes, (ii) records with a velocity higher than 120 km/h, and (iii) records outside of the city.
Compared with empty taxis in the urban road network, occupied taxis can represent the actual traffic situation better, such as the driving speed and route selection. We can determine when and where passengers are picked up and dropped off based on operational status shifts. Thus, a sequence of time-stamped records within a pick-up and drop-off pair constitutes an occupied trajectory. However, there are some anomalous trips that need to be removed from the trajectory dataset. For example, the trajectory ought to be regarded as invalid if the duration is less than 1 min or more than 120 min, because it is abnormal for a passenger to take a taxi for such a short or long time.
4.2. Taxi Accessibility Measure
Accessibility measures are based on the travel time from a grid cell to other grid cells and the number of opportunities available in each grid cell. Thus, the taxi accessibility is the number of opportunities reachable from each grid cell. According to previous studies [8,25], the cumulative opportunity measure can be defined as
where denotes the cumulative opportunity accessibility from zone to the considered types of opportunities that are reachable within a time threshold during a time period , is the opportunity of the considered type in zone j and represents the real travel time of a journey from zone to zone during a time period . The time threshold , which is the time used to calculate the number of opportunities that can be reached, is here set at 10 min in this study. The 10 min is selected because the number of reachable grid cells increases with the increase of time boundary. However, after the time boundary arrives 10 min, the number of reachable grid cells does not see notable increase. In addition, we select four typical time periods to measure the cumulative opportunity accessibility and identify the accessibility differences in a day, including the morning peak hours (7:00–9:00), midday off-peak hours (12:00–14:00), evening peak hours (17:00–19:00), and late-night hours (22:00–24:00).
There are several kinds of widely used opportunities, including the number of available jobs, population, and the number of POIs. In this paper, we adopt three kinds of opportunities to measure the accessibility. The detailed definitions are presented in Table 2. This paper innovatively introduces total drop-offs and dynamic drop-offs as opportunities. Drop-offs represent the number of taxi trips where passengers are dropped off at a given grid cell, which can be seen as the realized attractiveness (i.e., opportunity) of that grid cell. A POI is a specific point location where someone may find something interesting or useful. All three of the taxi accessibility measures are calculated under a time-varying traffic condition.
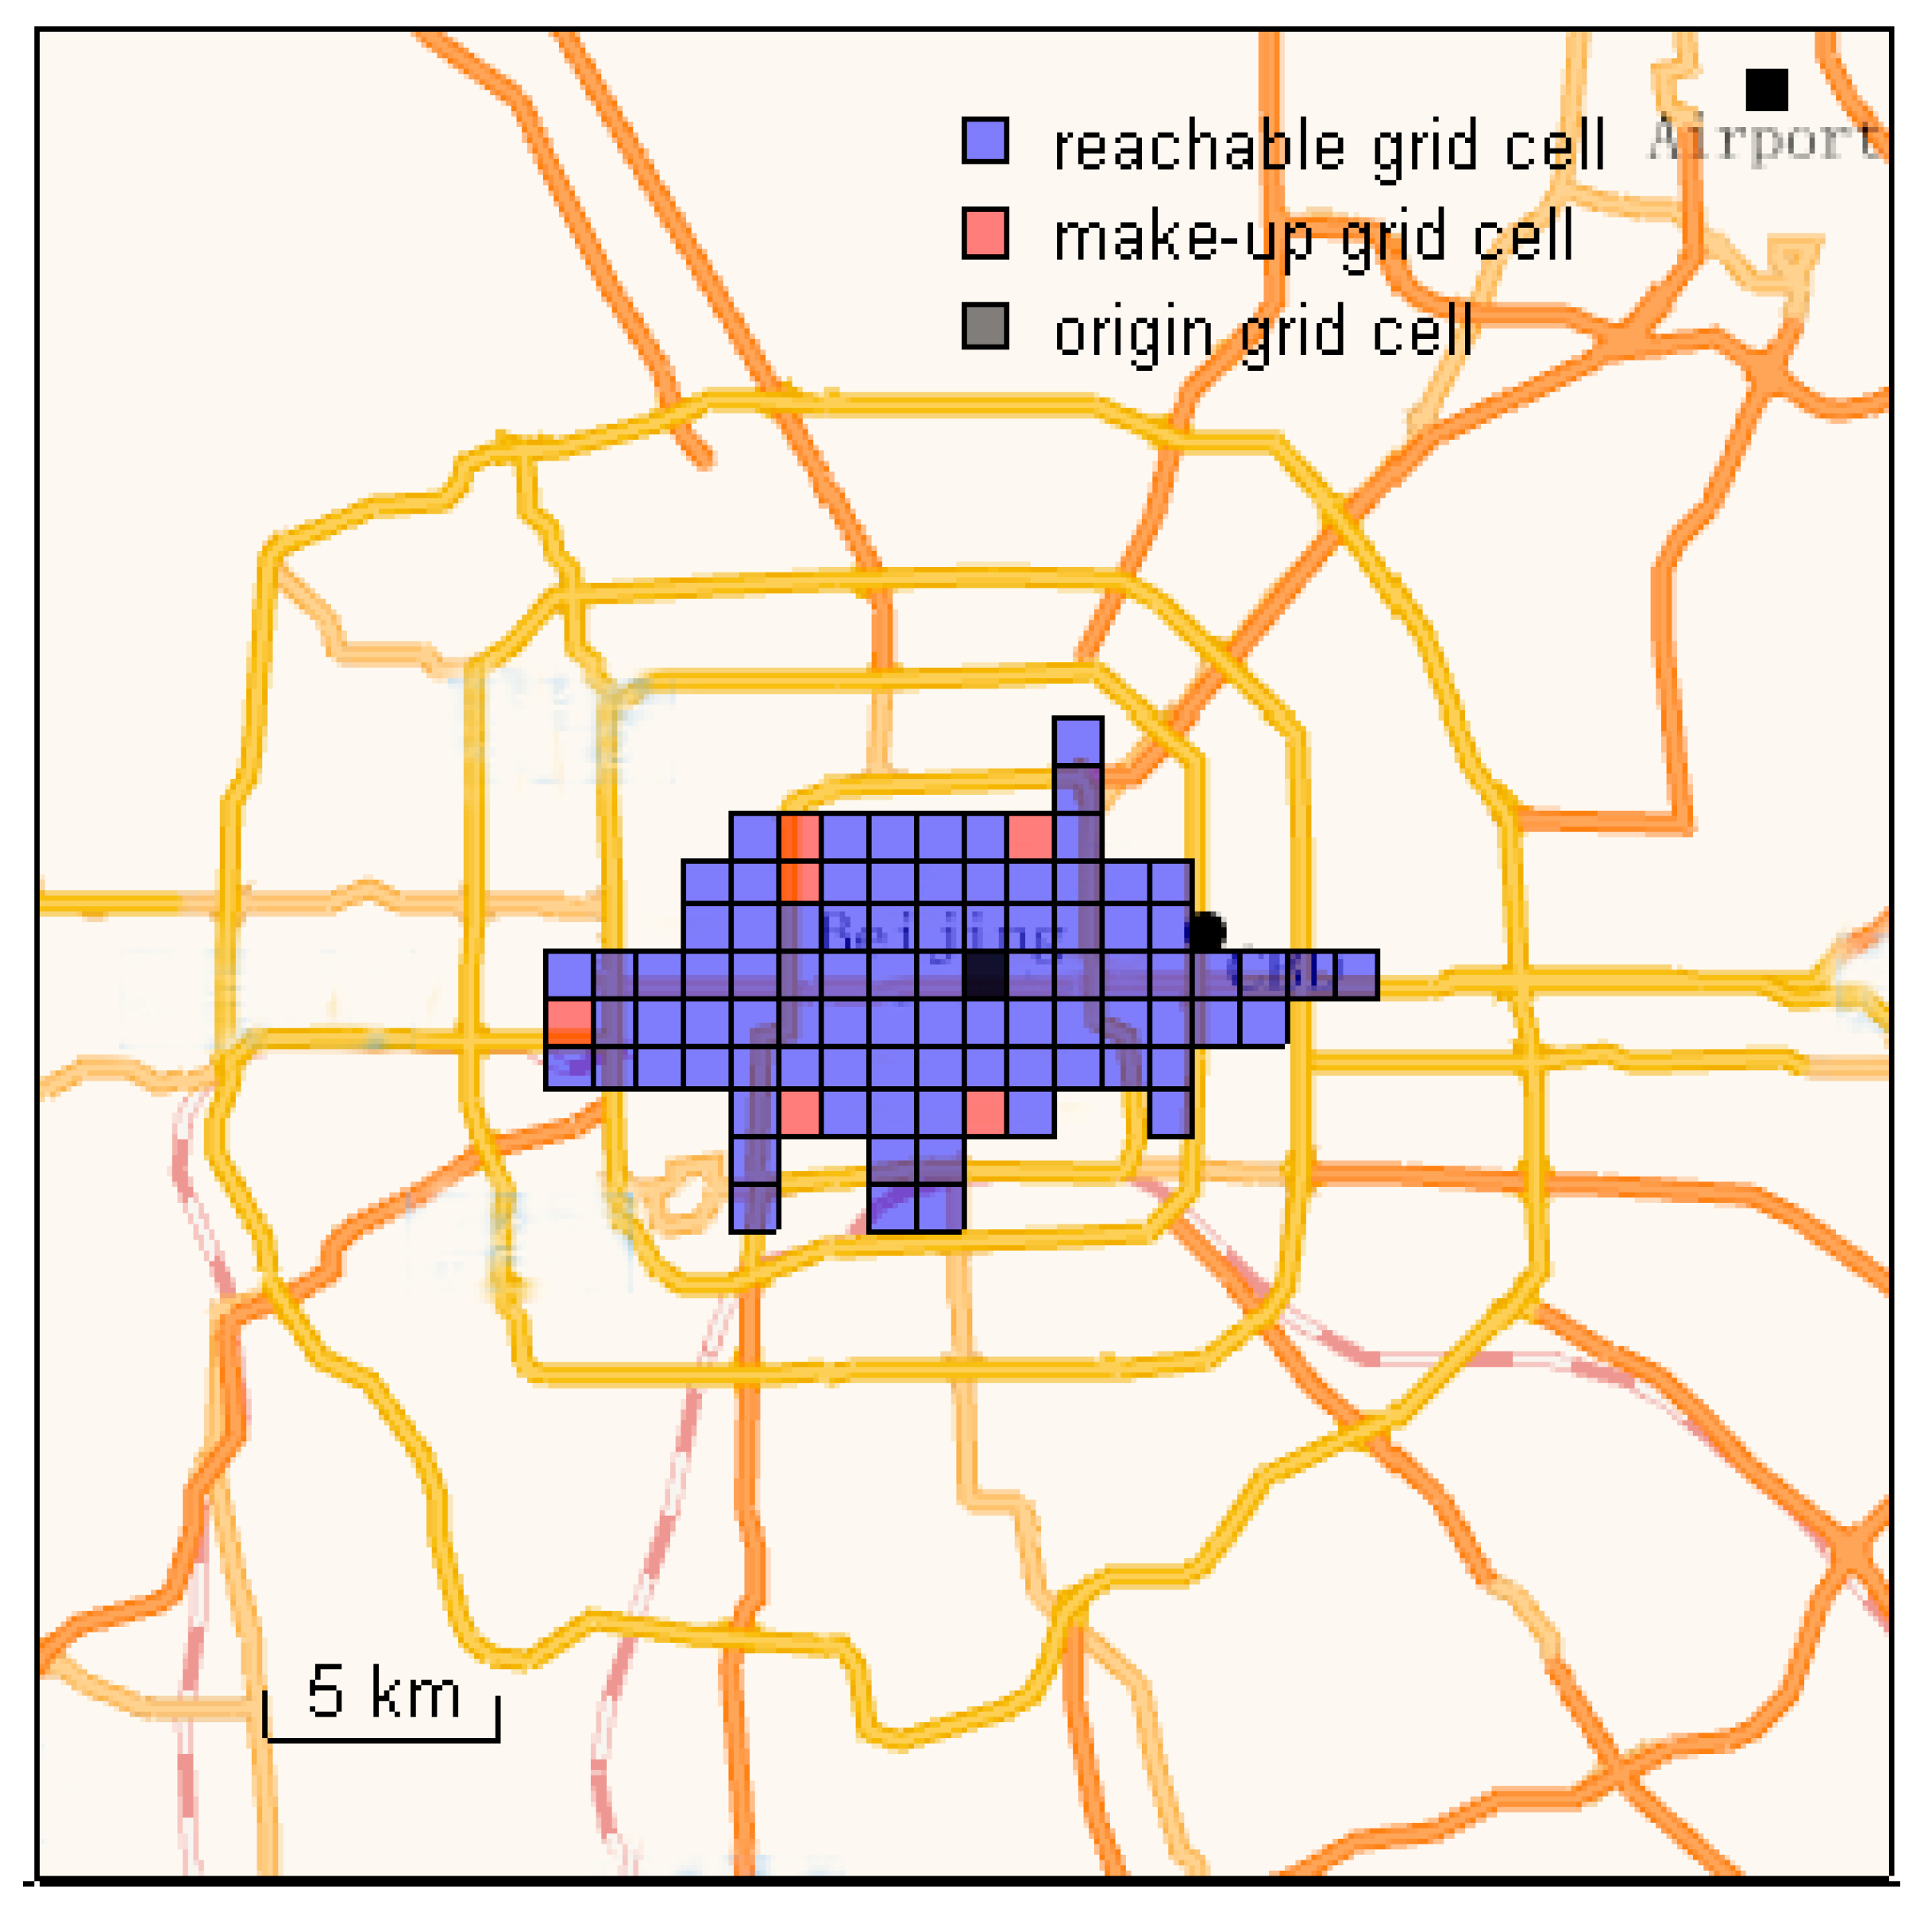
However, because of the current road network and land use, there are some regions in the city that cannot be directly reached by taxi, such as parks. As a result, some grid cells lack GPS data to determine the travel time. To deal with such situations, we propose a method to make up for the shortage of GPS signals. For a grid cell, if the majority of the four adjacent grid cells are reachable for the origin grid cell, the grid cell will be regarded as reachable. The process is executed iteratively until such grid cells are all marked as reachable ones (see Figure 4).
As the cumulative opportunity accessibilities are based on different opportunities, the values of accessibilities are significantly different. To make a comparison between accessibilities of different opportunities, the relative accessibility is calculated. The relative accessibility is defined as the level of accessibility of a grid cell compared to the accessibility values of all the others, which is the standardized (z-scores) accessibility of each opportunity measure [34,35]. The larger value of the relative accessibility represents the higher accessibility. The calculation of relative accessibility is presented in Equation (3)
where denotes the relative accessibility of zone , is the accessibility of zone , denotes the mean of accessibilities, and is the standard deviation of accessibilities.
5. Results
5.1. Spatial Distribution of Opportunities
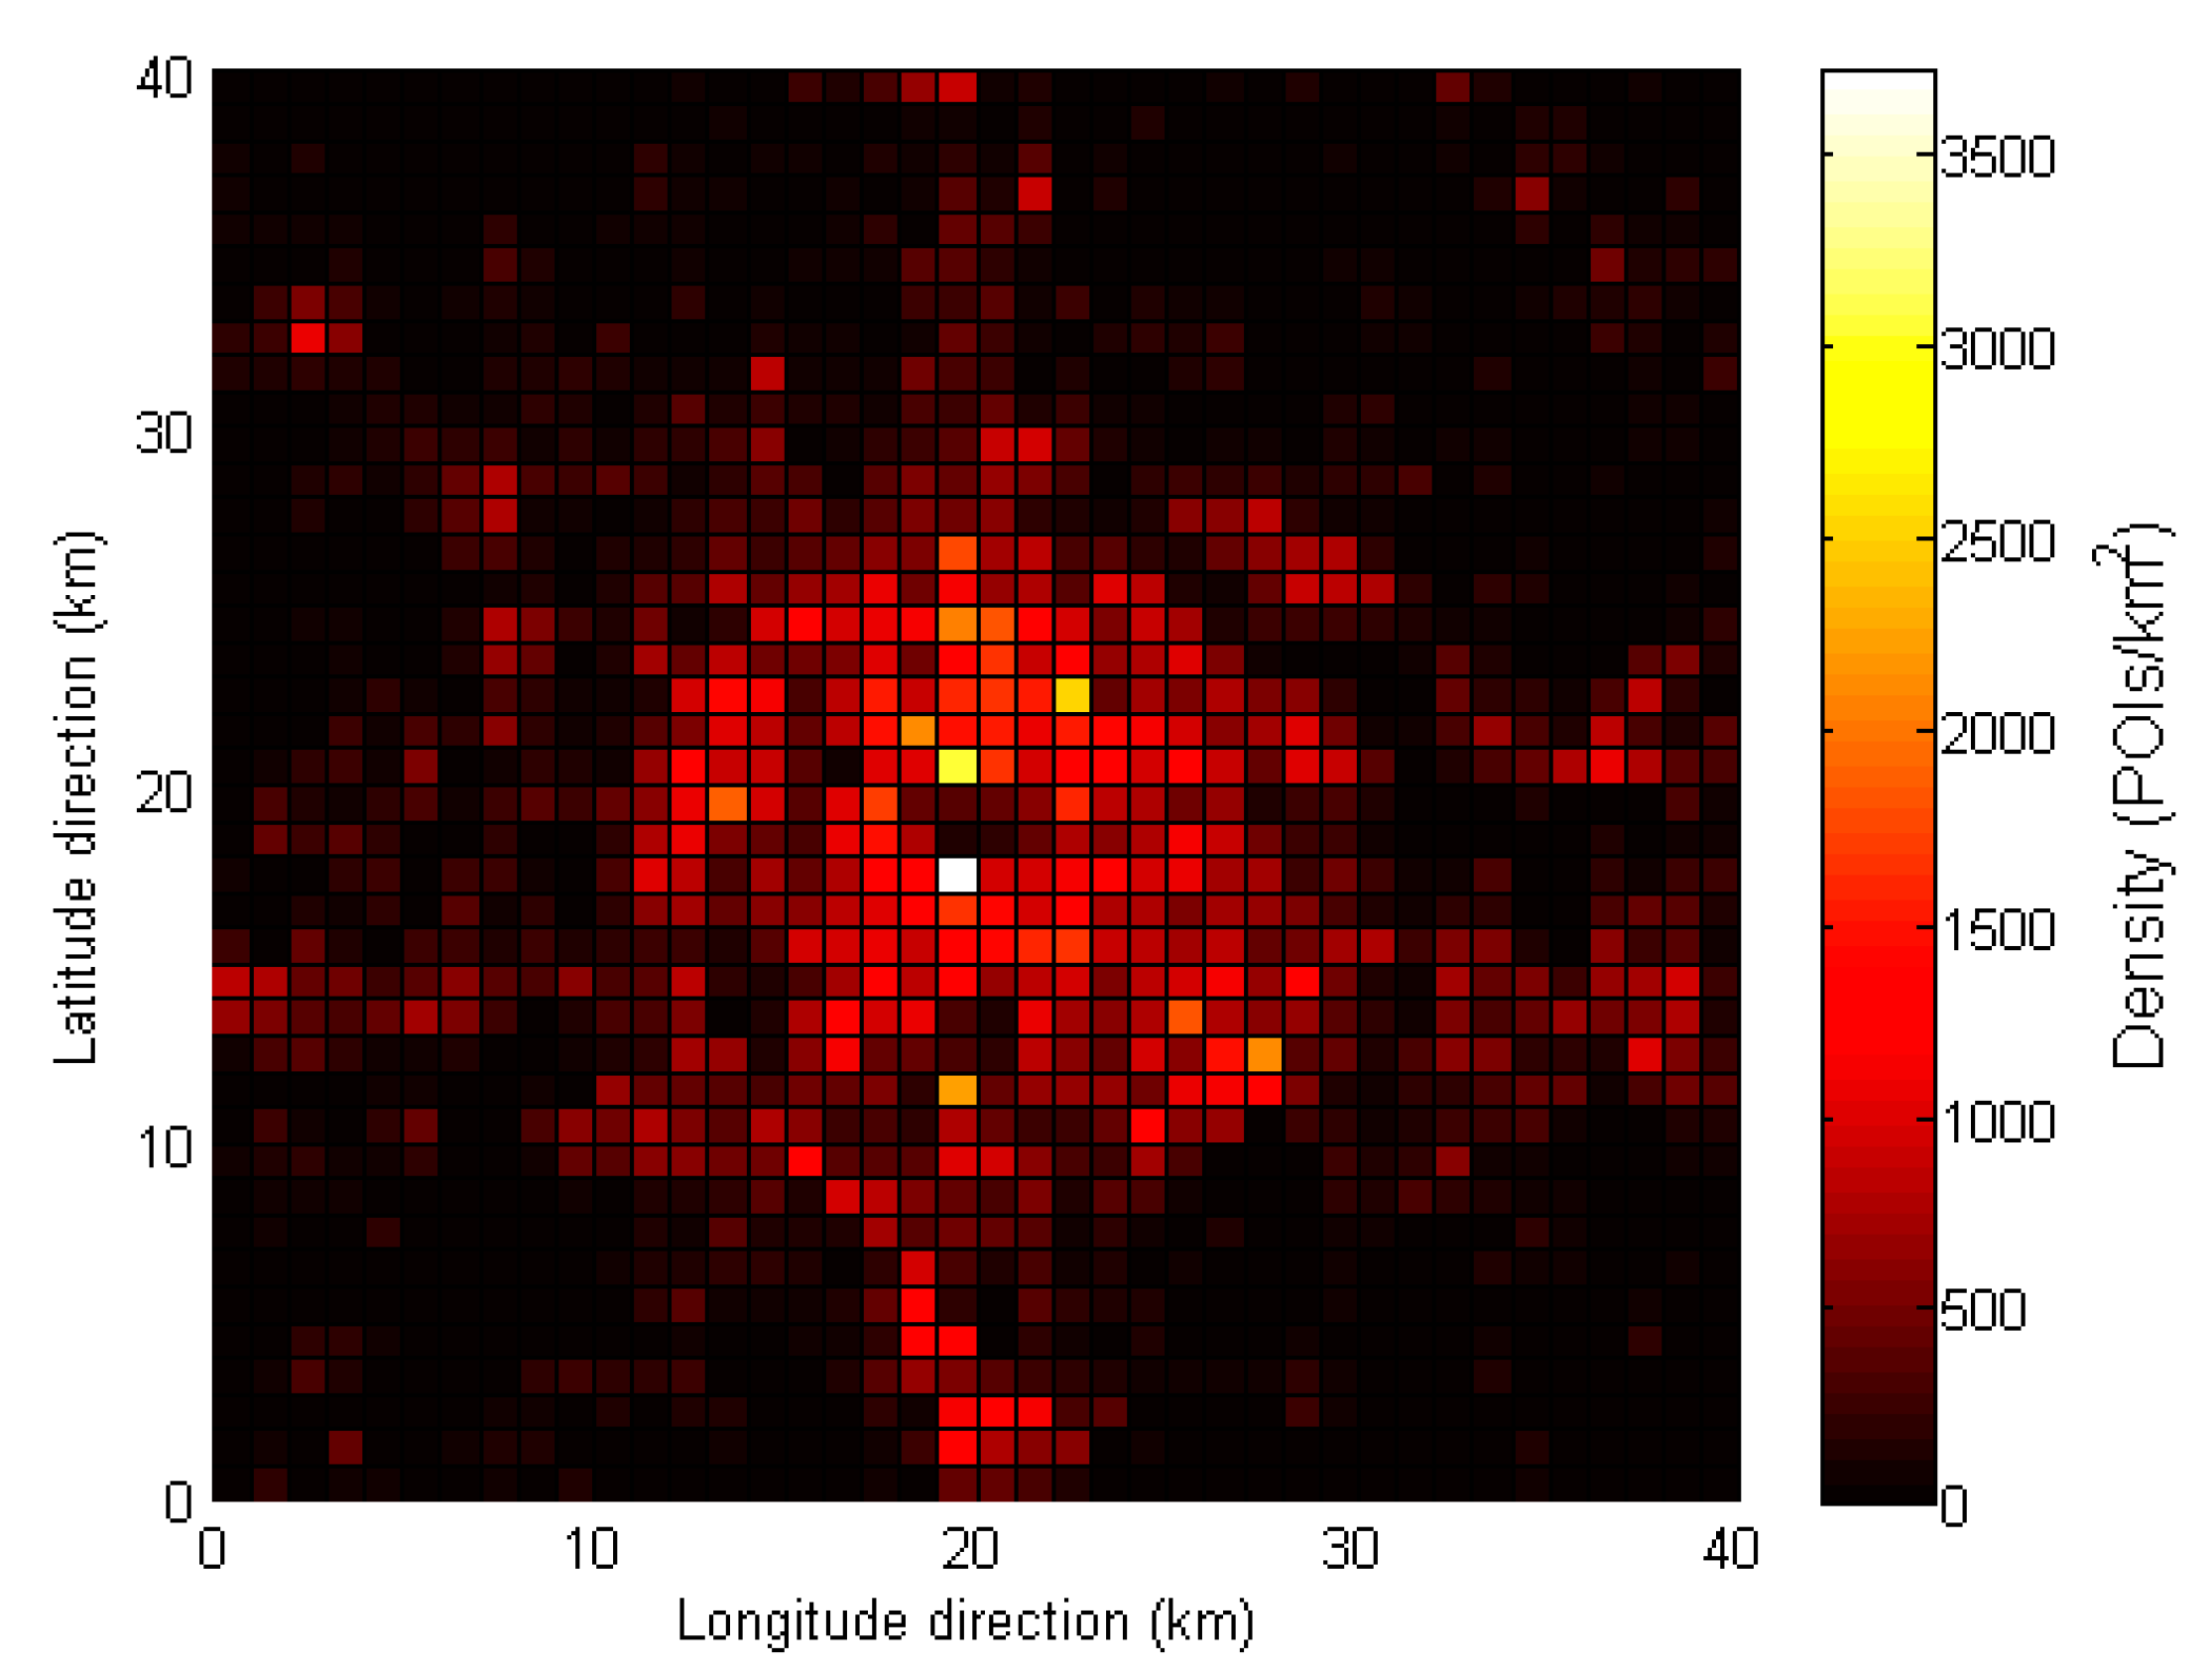
The distribution of constant POIs is presented in Figure 5. POIs are the potential places attracting travelers, which are concentrated in the urban area and vary in different regions. In general, as the distance from the city center increases, the density of POIs decreases. Moreover, some satellite towns also have regions with a high density of POIs, as seen in Figure 5.
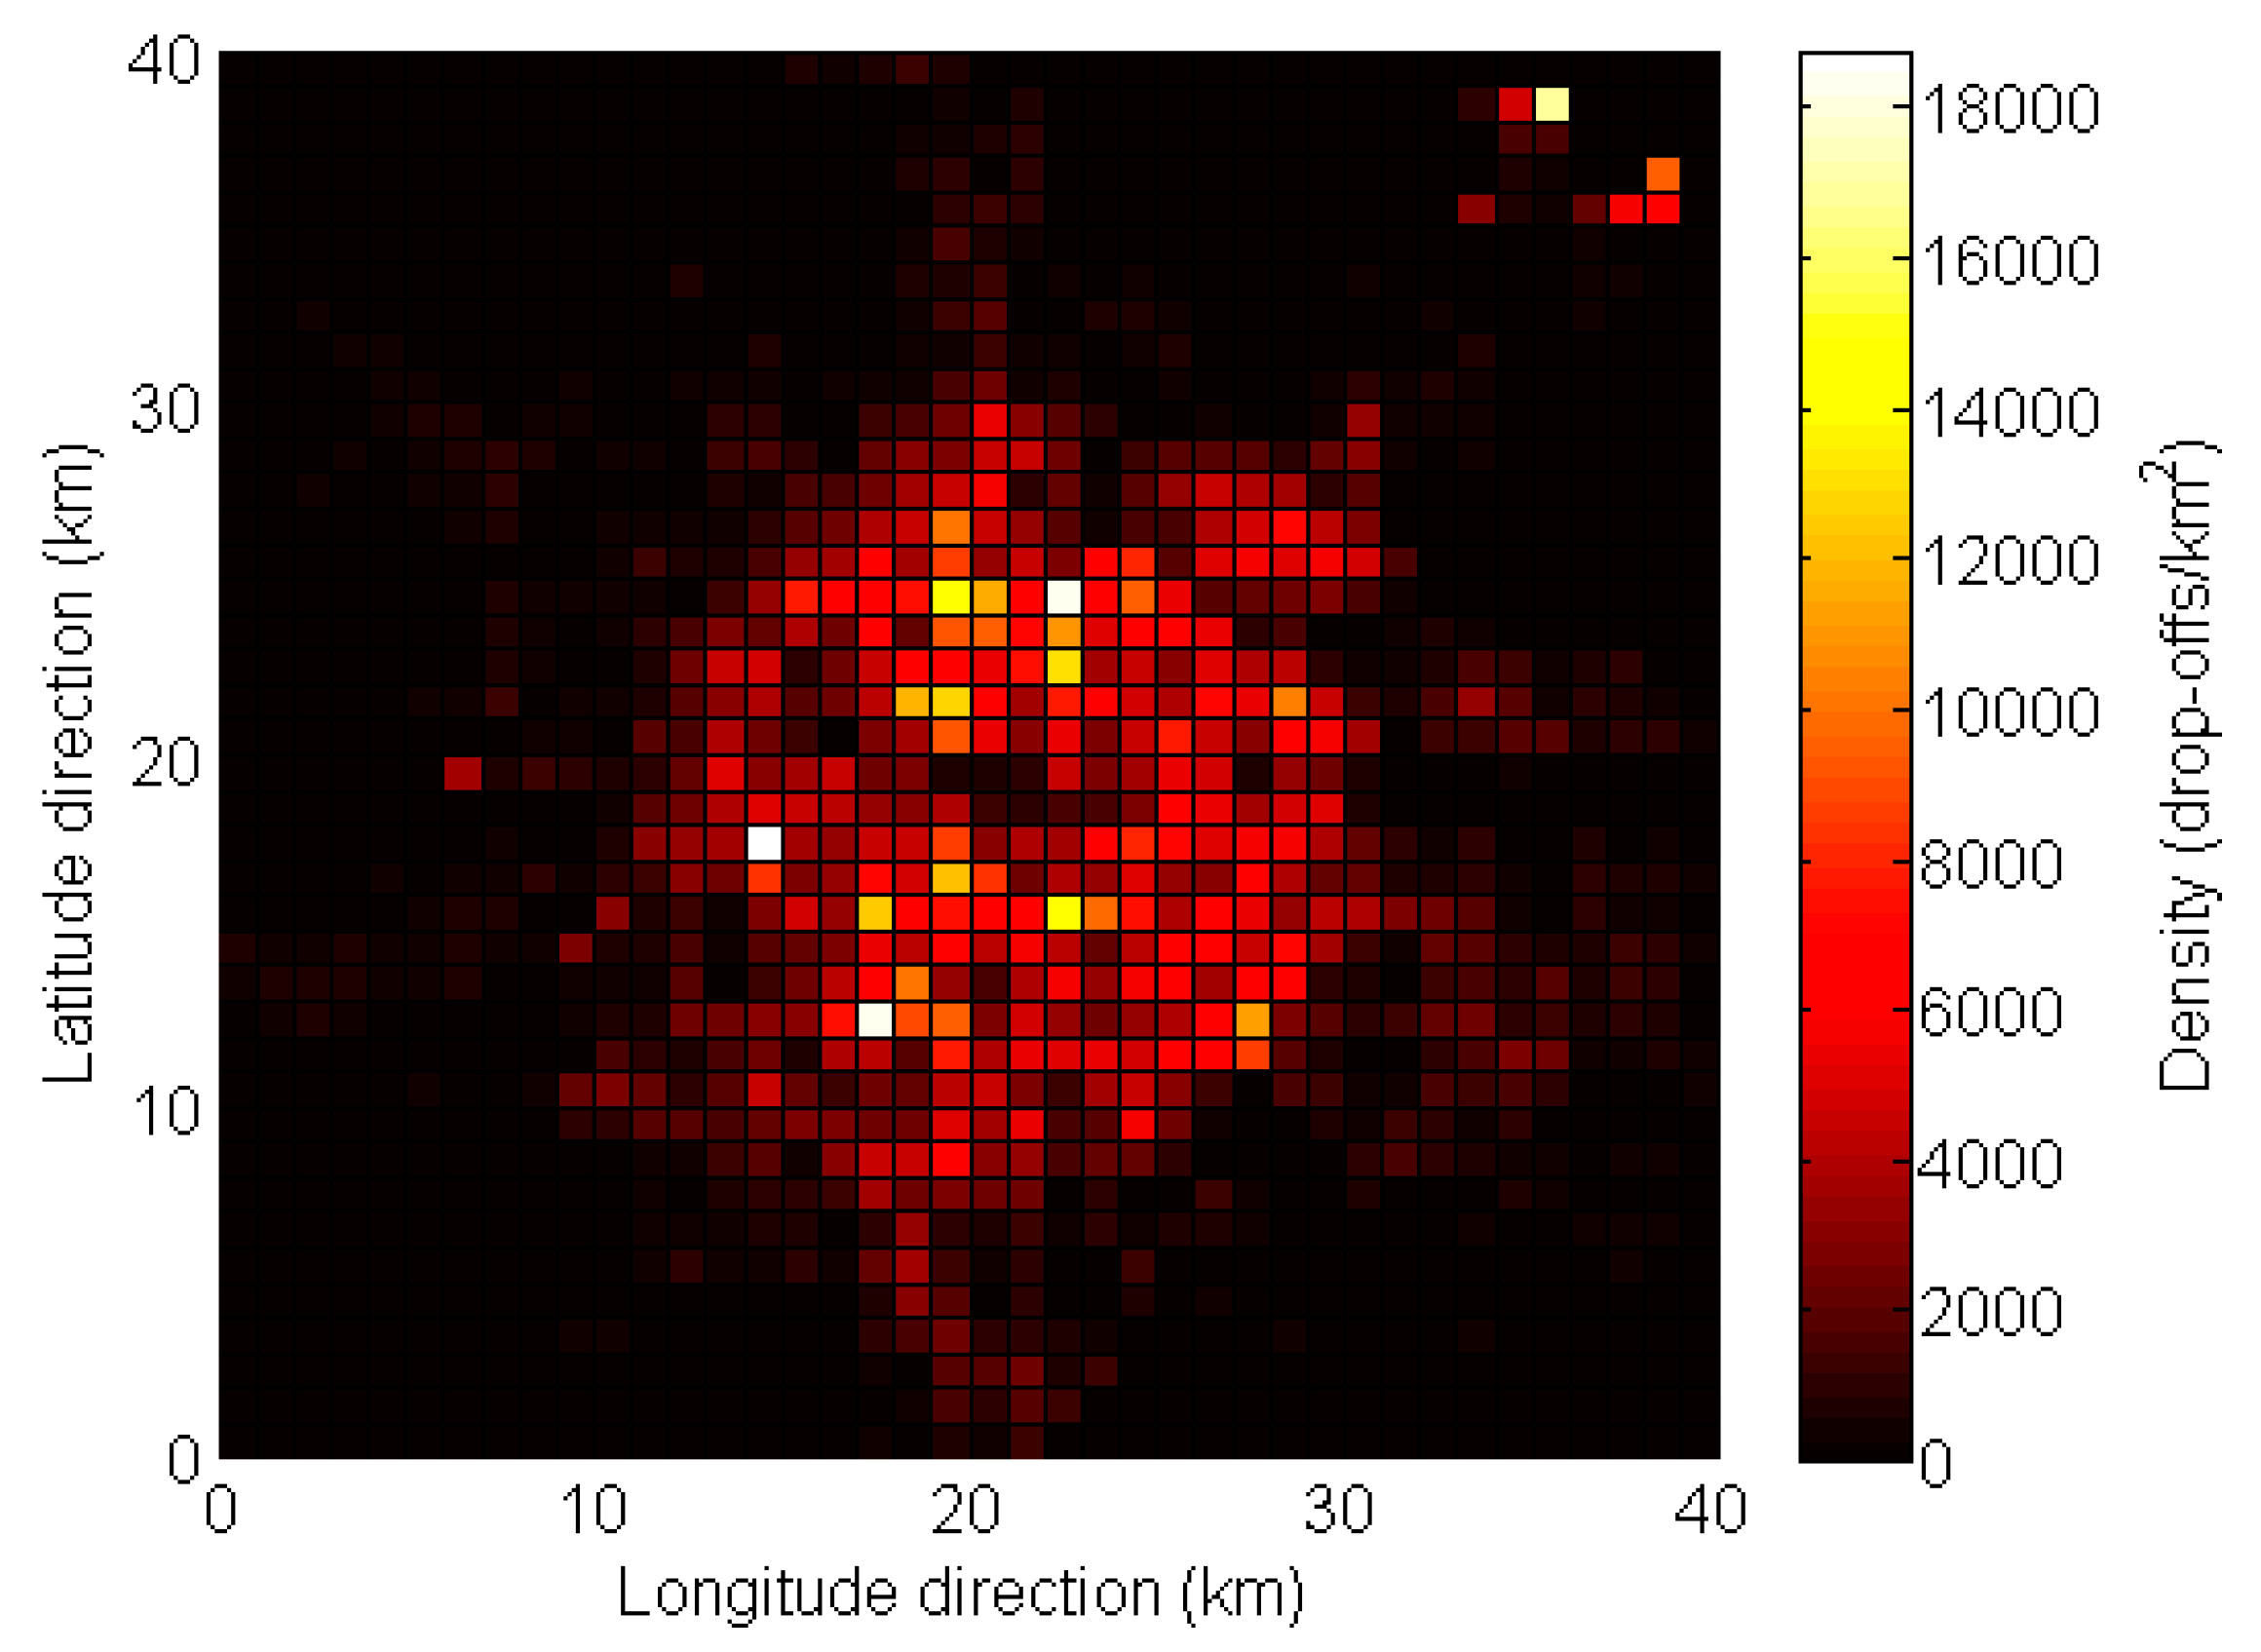
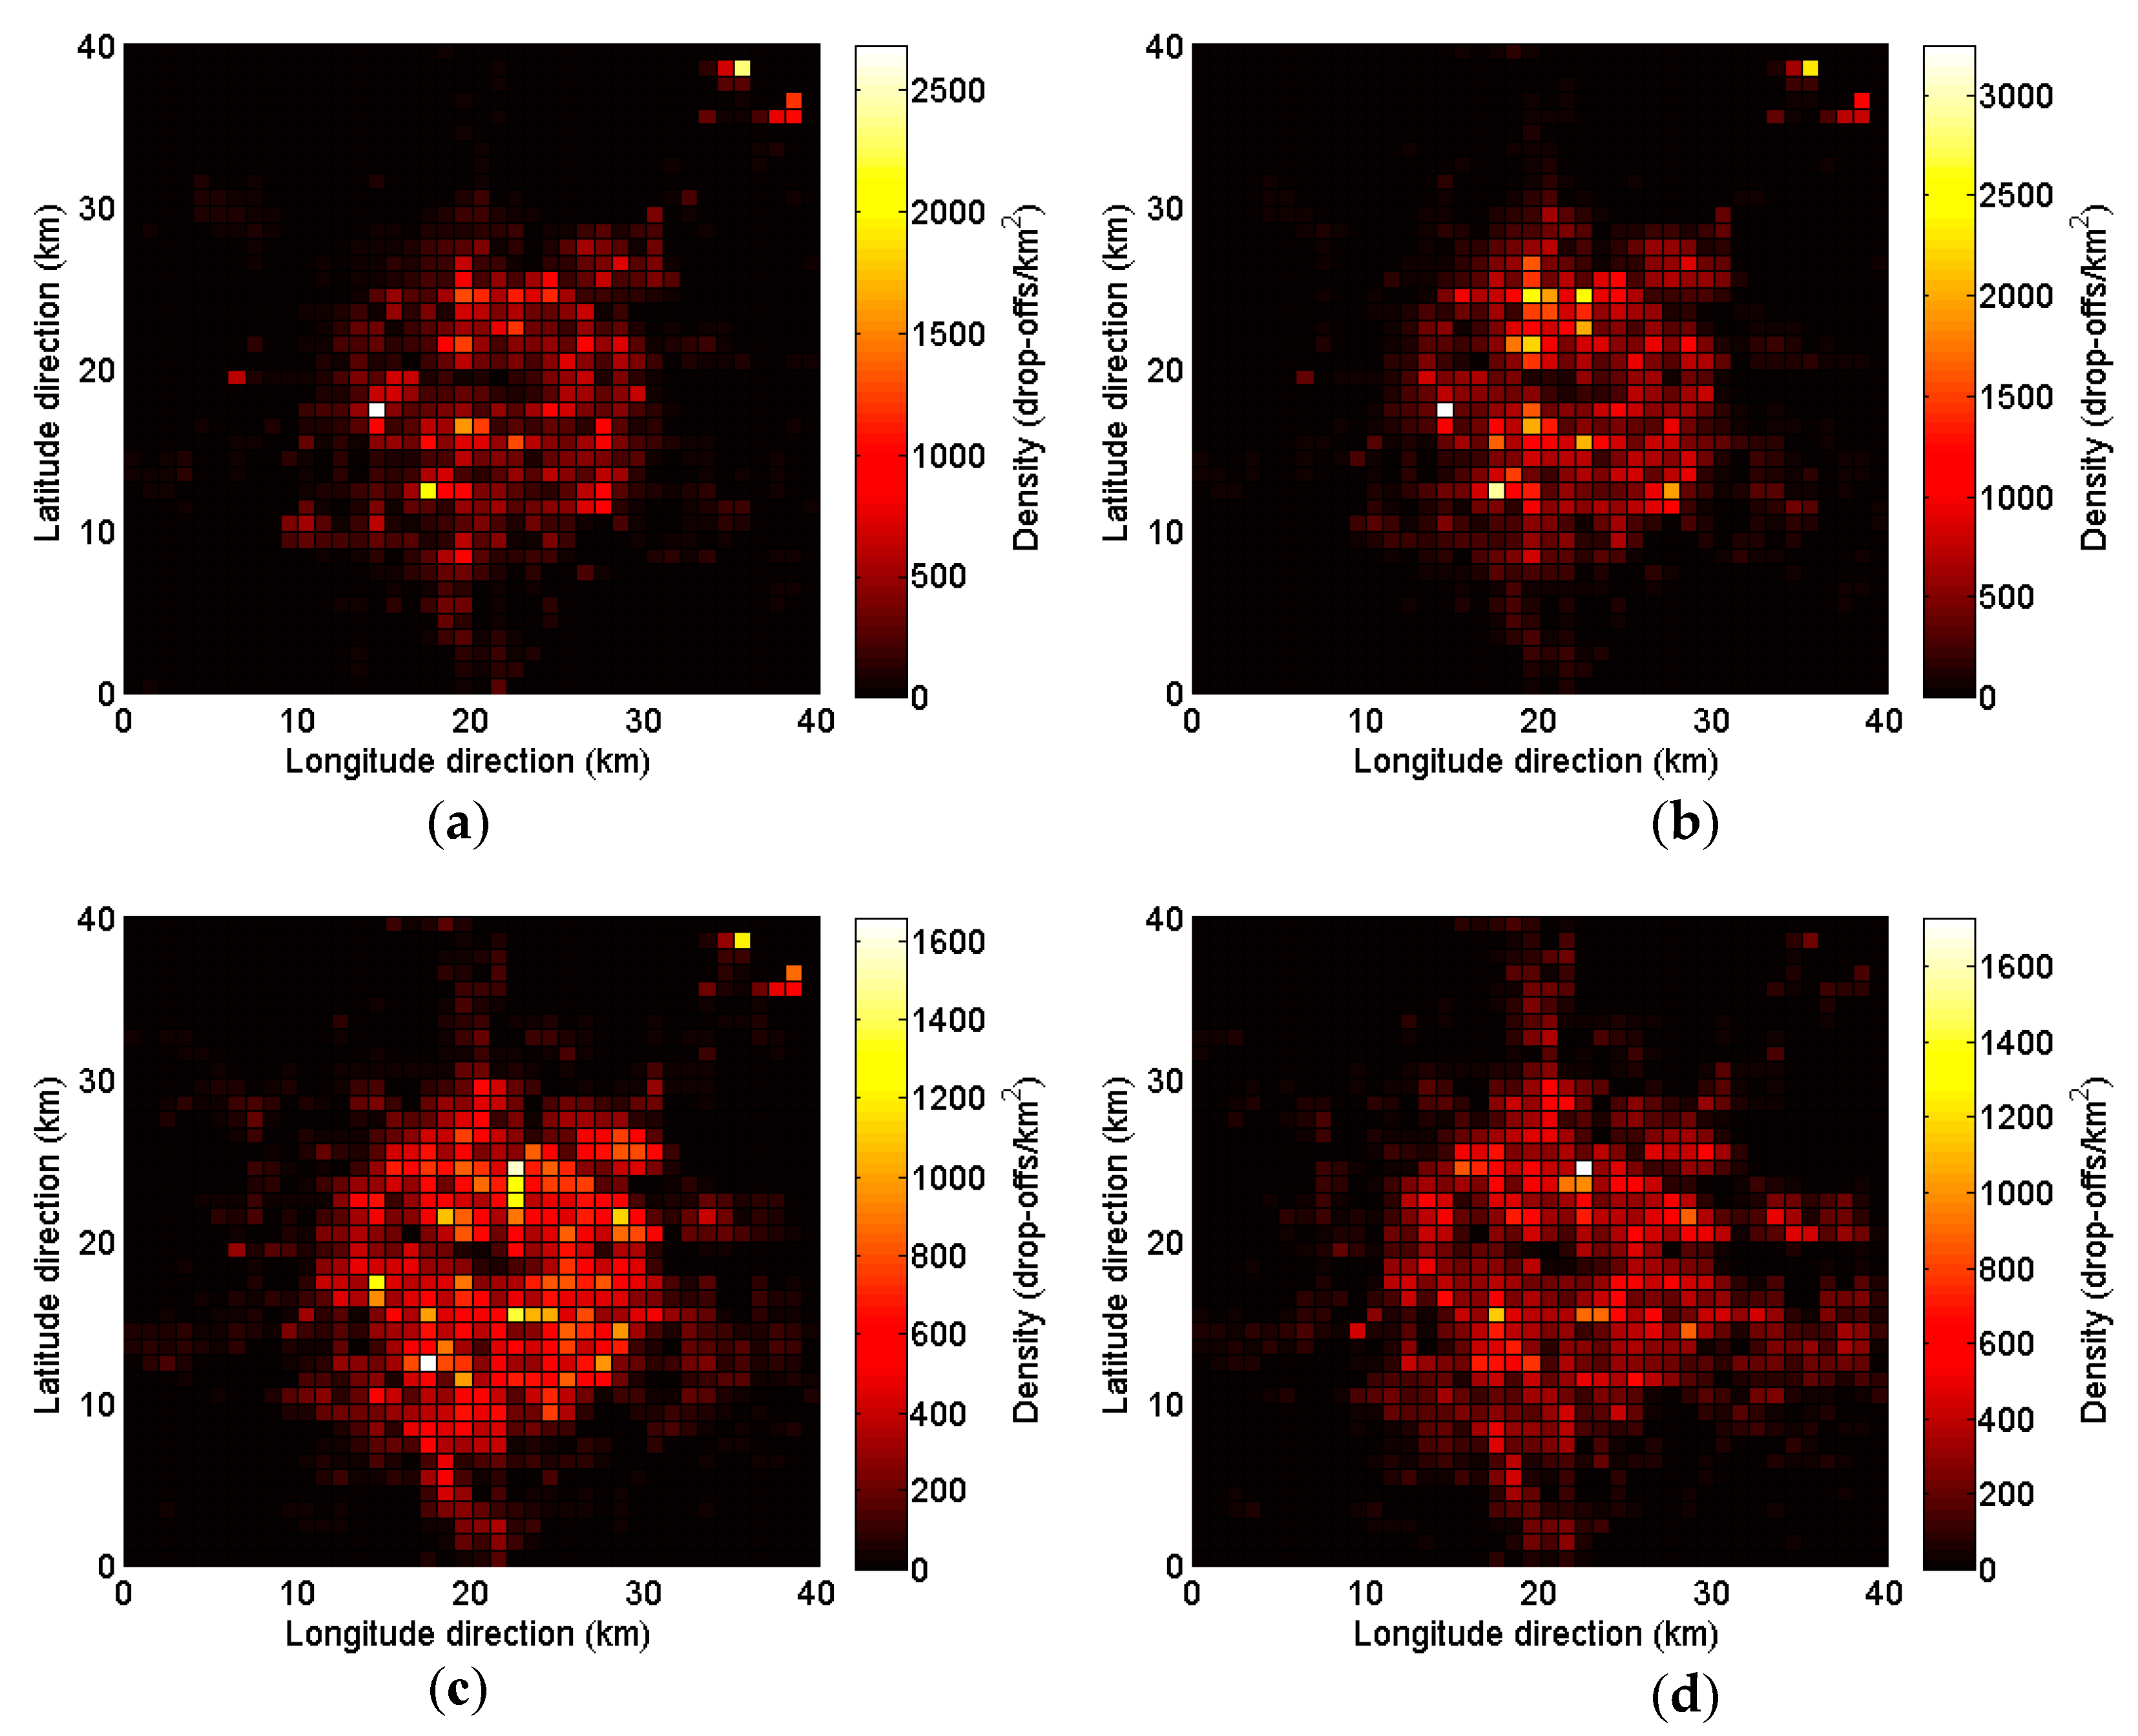
Figure 6 shows the distribution of total drop-offs, in which the high drop-offs grid cells are located in the urban area. Besides, the total drop-offs are low in the most central area, which is similar to the constant POIs in Figure 5. Figure 7 presents the distributions of the dynamic drop-offs in the four typical time periods, in which the midday off-peak hours have higher drop-offs in general. The drop-off distributions show great differences in the four time periods. In the morning peak hours and midday off-peak hours, the taxi drop-offs are concentrated on some grid cells. This is attributed to the fact that most trips are ended in the work places in the morning and midday. In addition, there are some grid cells with high taxi drop-offs in the morning peak hours and midday off-peak hours. This shows that these grid cells are extremely attractive in these specific time periods. While in the evening peak hours and late-night hours, the taxi drop-offs are widely spread, which are more likely to end in residential places.
Compared with the constant POIs, both the total and dynamic drop-offs are more concentrated in the urban areas, with the other places showing much lower densities. In addition, Beijing Capital International Airport in the northeast shows a high density because many passengers travel with large luggage and prefer to take a taxi. As shown in Figure 7d, the density of the dynamic drop-offs is lower during the late-night hours, which is consistent with the number of departure flights. The drop-offs are the destinations of the taxi trips, which reveal the realized attraction of each grid cell to taxi passengers in real travels. They can be utilized to identify the differences between the possible accessibility and the realized accessibility.
5.2. Three Kinds of Accessibilities
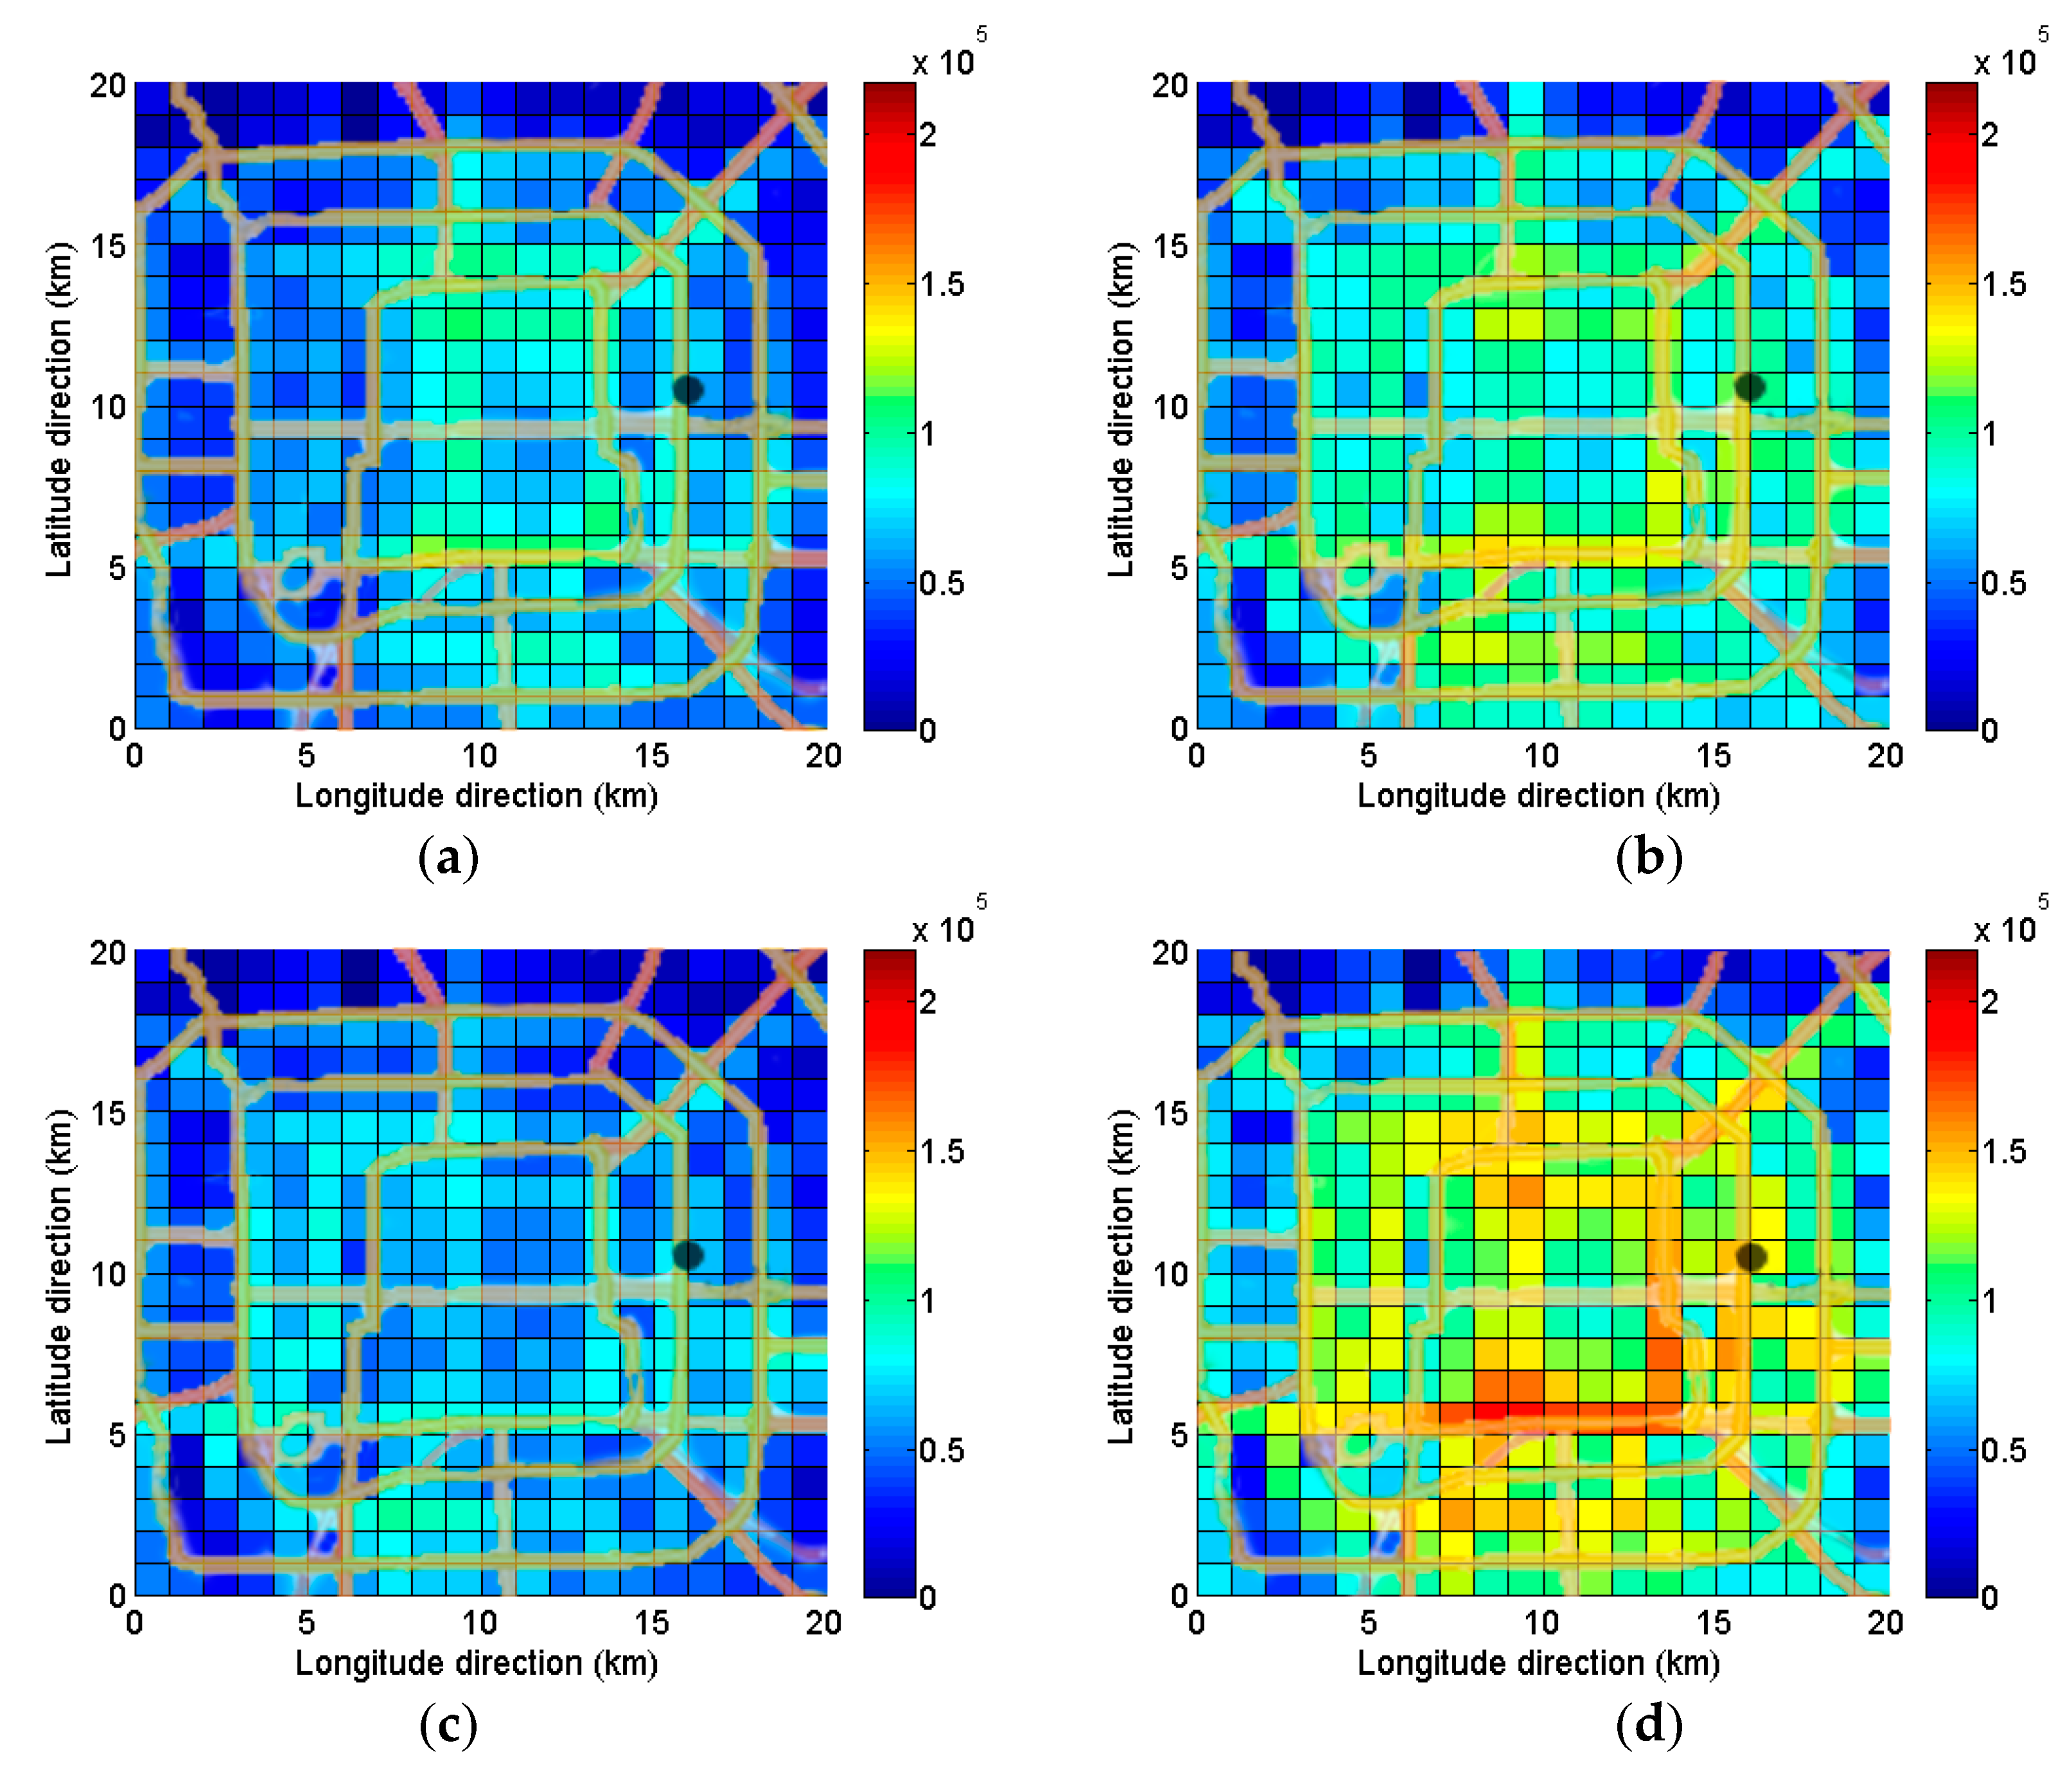
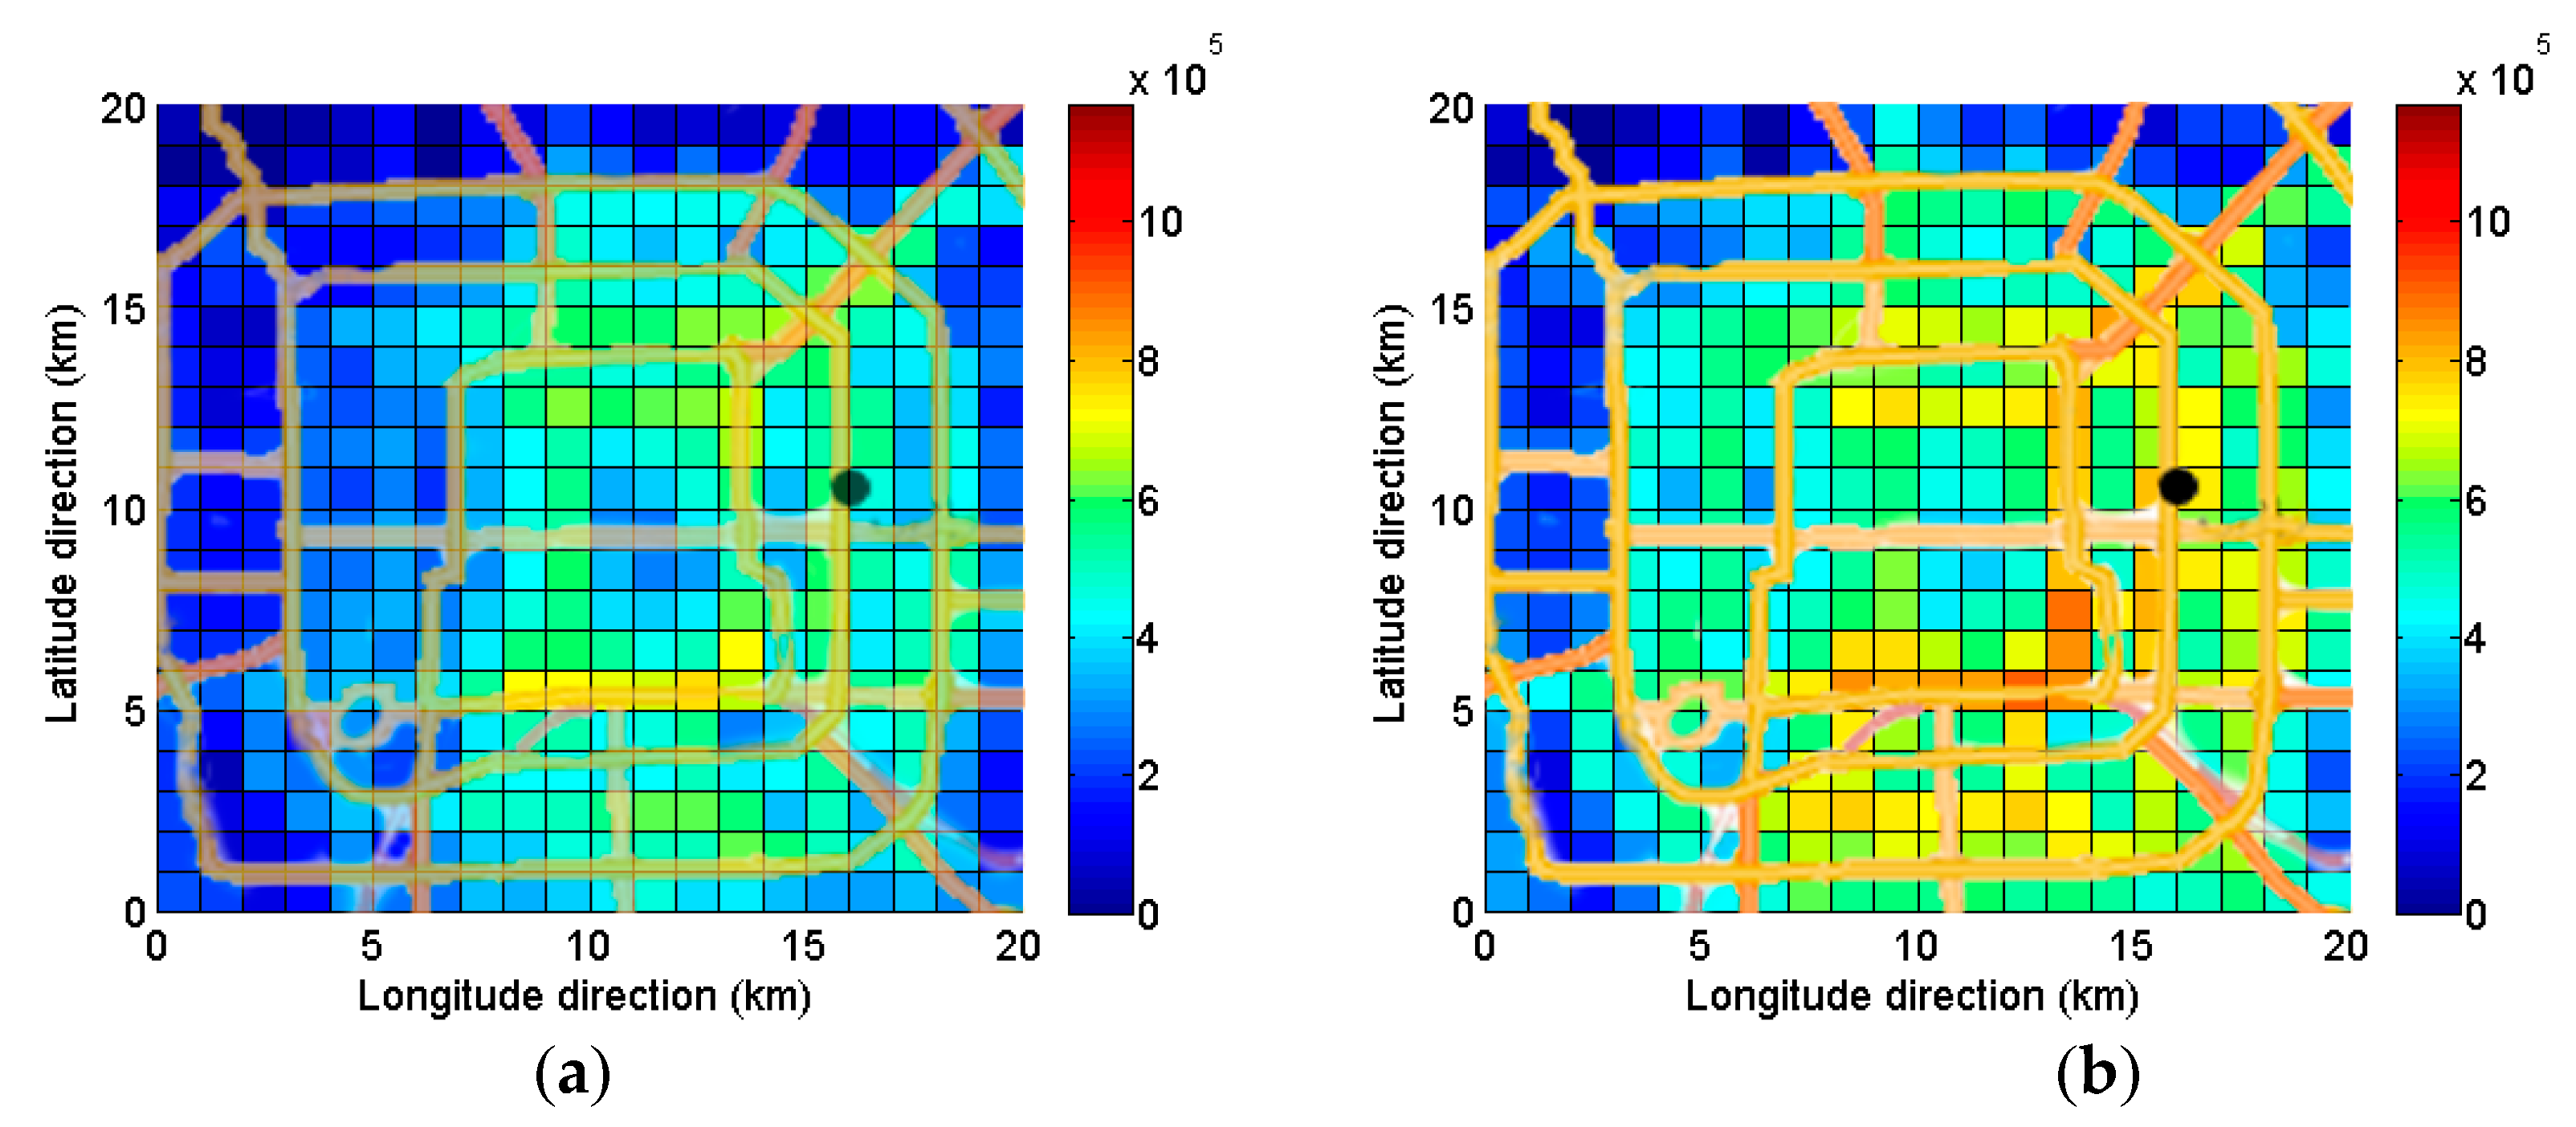
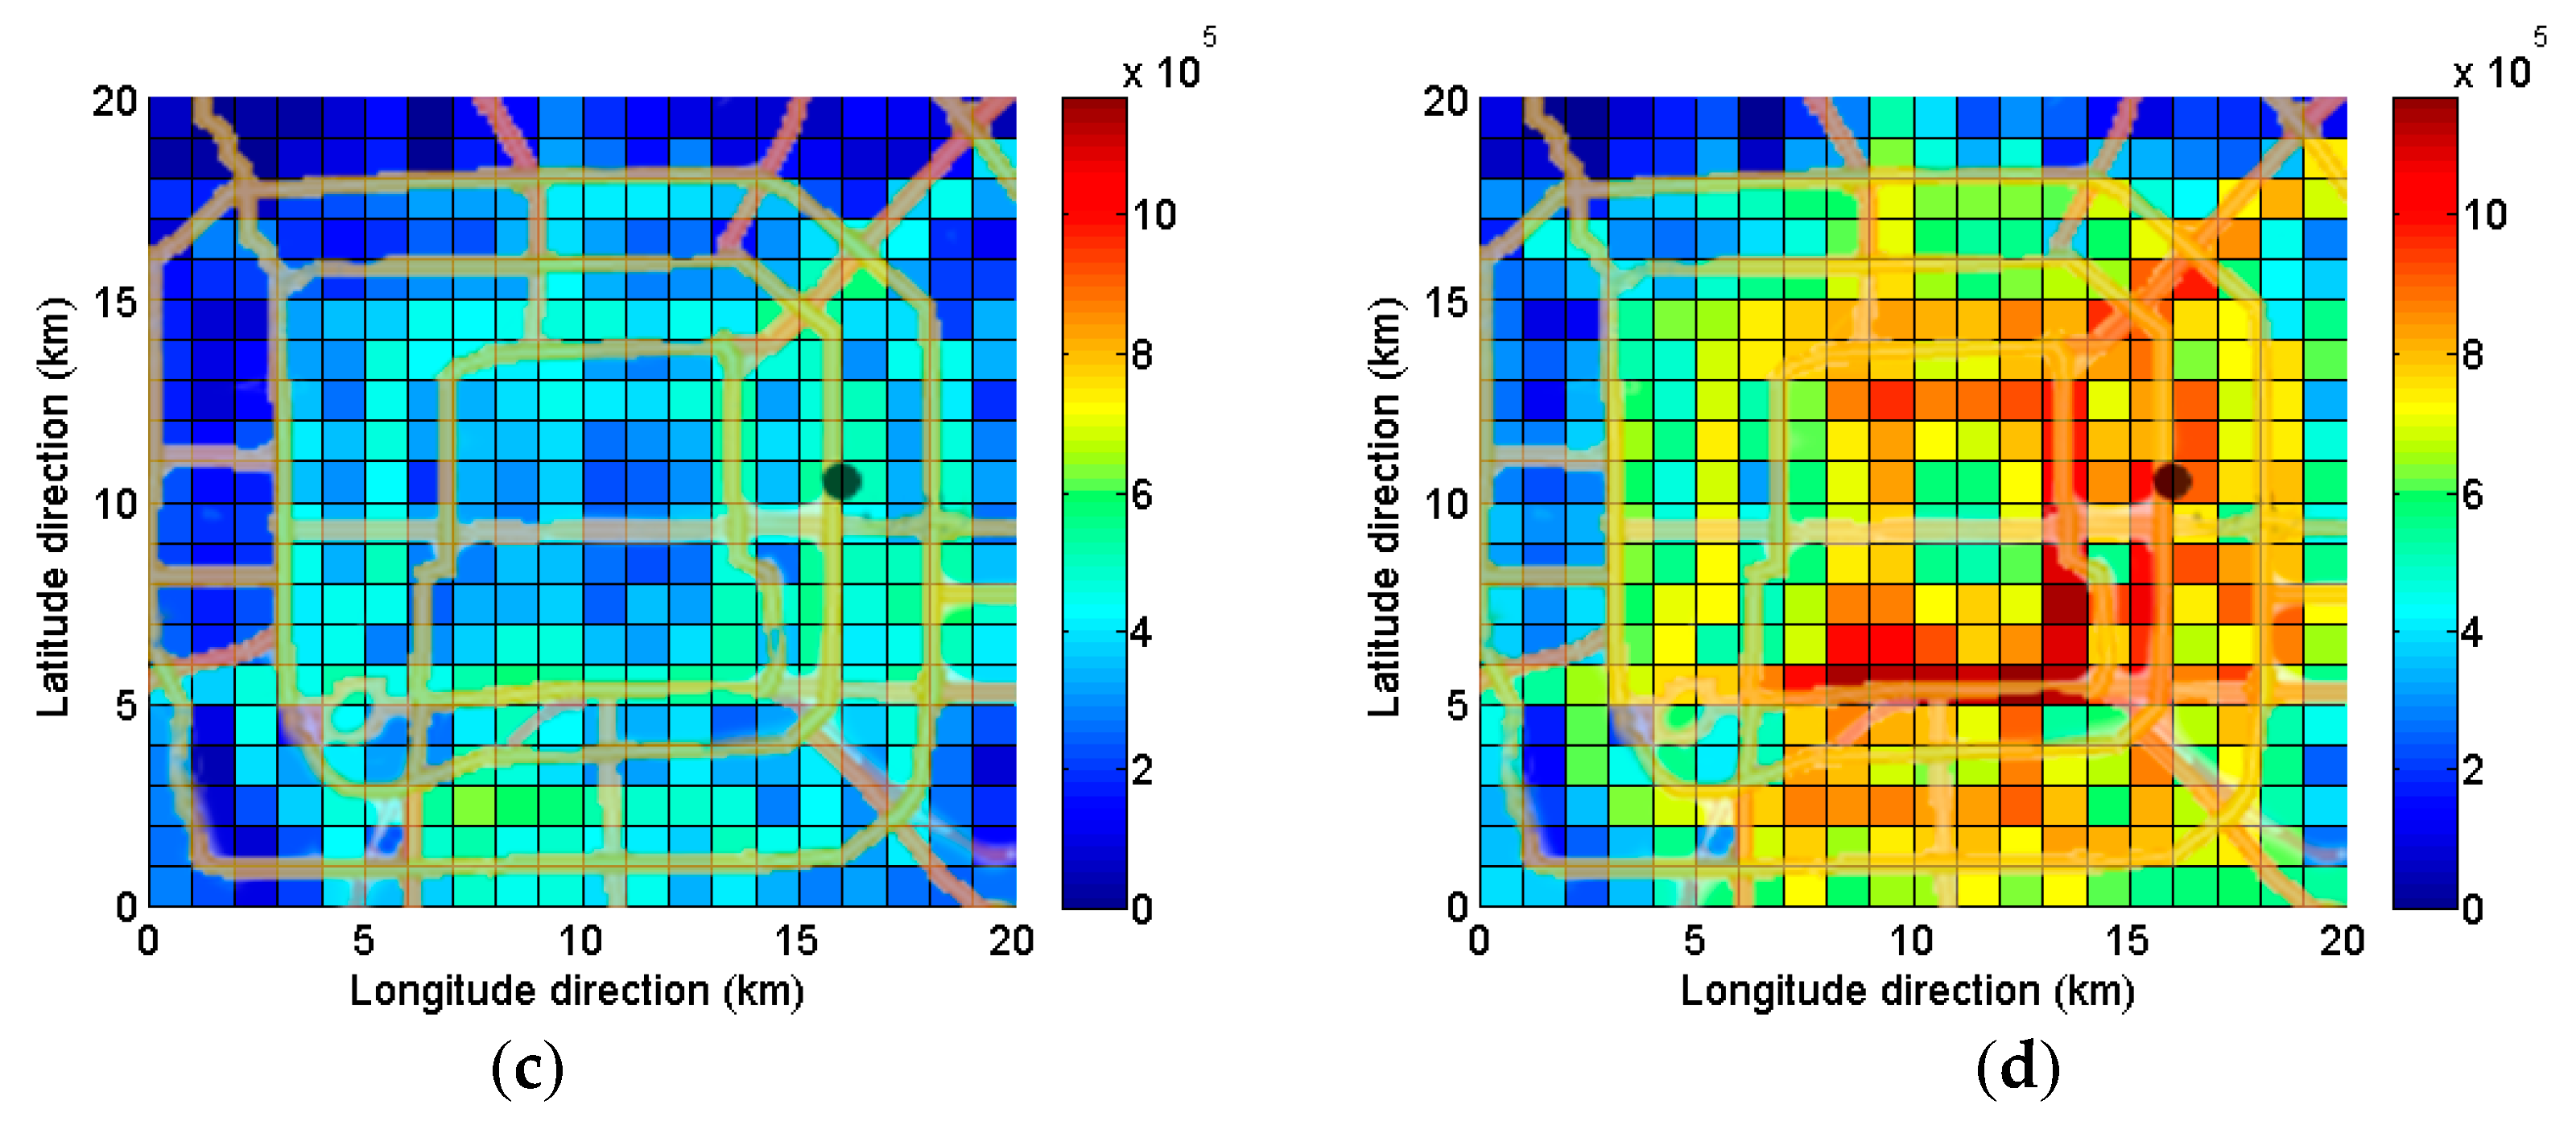
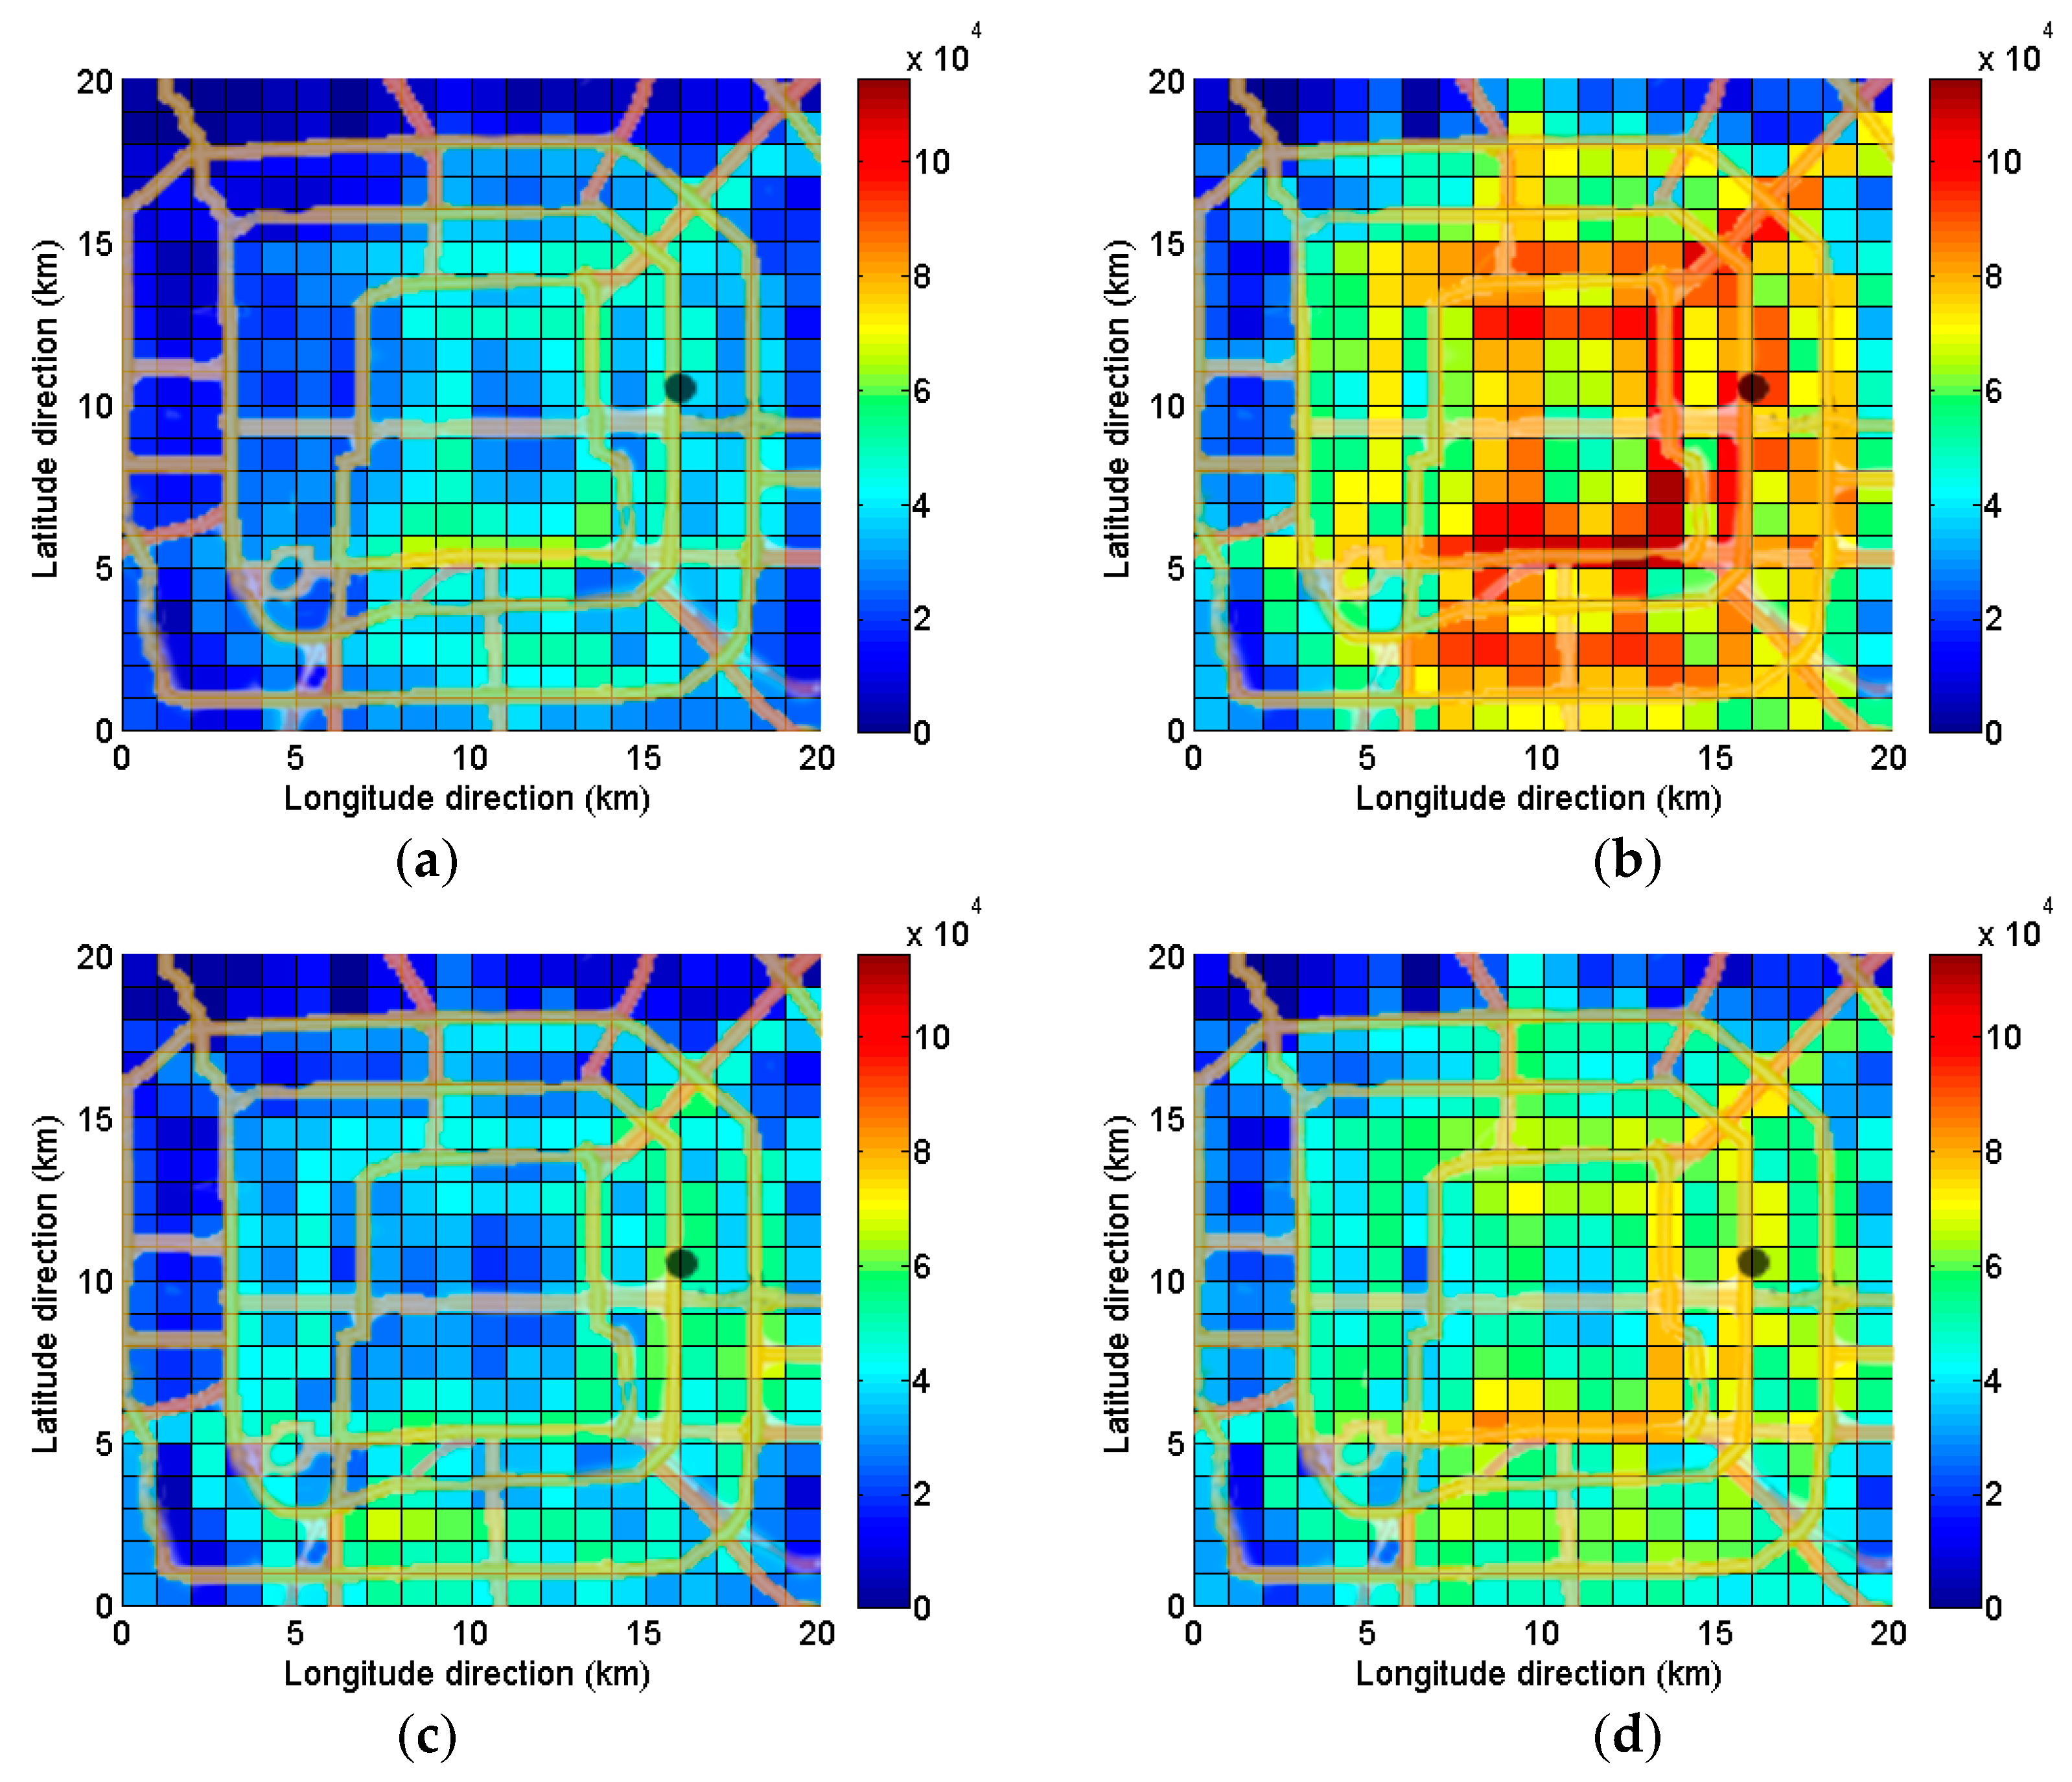
Three kinds of accessibilities are measured based on their respective opportunities. The spatial distributions of these accessibilities based on the constant POIs, total drop-offs and dynamic drop-offs, are presented in Figure 8, Figure 9 and Figure 10, respectively. For constant POIs accessibility in Figure 8, the accessibility is higher in the late-night hours and lower in the evening peak hours. Similar results are also observed in Figure 9 for the total drop-off accessibility. However, the dynamic drop-off accessibility is higher in the midday off-peak hours. Besides, it can be observed that the high accessibility grid cells are near the expressways.
From Figure 8, Figure 9 and Figure 10, it can be concluded that the accessibility varies from one grid cell to another, which is the result of the unique structure of the road network and land use pattern related to each grid cell. In general, the eastern part has a higher accessibility and the inner part shows better accessibility than the outer part. However, the accessibility of the most core area is not well. From the perspective of the road network, the grid cells connected to expressways tend to have higher accessibility. The distributions of high accessibility grid cells in the figures are similar to the outline of the urban expressways. As the accessibility is influenced by the opportunities and road network, the high accessibility grid cells tend to cluster together.
The accessibilities vary over time during a day as the traffic conditions change. The opportunities might also vary over time during a day. Figure 8, Figure 9 and Figure 10 show the accessibilities measured for the four typical time periods. The average accessibility of each selected time period can represent the performance of the road network as a whole. The three kinds of accessibilities are listed in Table 3. The constant POIs measure and total drop-offs measure have similar tendencies in a day (see Table 4). For the two measures, the late-night hours have the highest accessibility, and the evening peak hours have the lowest accessibility, which is less than 60% of that of the late-night hours, in which all of the opportunities are assumed to be available all the time. The dynamic drop-offs measure has the highest accessibility in the midday off-peak hours and the lowest accessibility in the morning peak hours. In general, the morning peak hours and evening peak hours do not show good performances.
5.3. Correlation between Accessibilities with Different Opportunities
The constant POIs refer to the possible attractiveness for passengers. While the total drop-offs and dynamic drop-offs mean the realized attractiveness for passengers. It is necessary to understand the differences between the possible and realized accessibility. The correlation between accessibilities with different opportunities is tested to compare one kind of accessibility to another. The total drop-offs measure is compared to the constant POIs measure and the dynamic drop-offs measure in all the time periods (see Table 5). Most coefficients are larger than 0.95, with the lowest one being 0.946, indicating that the three kinds of accessibilities are highly correlated. Although the accessibilities are measured from different opportunities, the relative accessibilities of one grid cell in the three kinds of accessibilities are similar. The results also indicate that grid cells with higher accessibility for total drop-offs tend to have higher value for the dynamic drop-offs accessibility. Although the total drop-offs and dynamic drop-offs are introduced as opportunities to measure accessibilities, the results are similar to those calculated using the constant POIs. As the drop-offs are converted from taxi GPS data, this demonstrates that the total drop-offs accessibility and the dynamic drop-offs accessibility can be measured using only the taxi GPS data.
A correlation matrix between different time periods is calculated for each kind of accessibility. According to Table 6 and Table 7, the coefficients are all higher than 0.90, with an average of 0.947 for the constant POIs measure and an average of 0.938 for the total drop-offs measure. It shows that the relative accessibility of a grid cell is stable over the day, but not as constant as that of the transit measures [8]. However, the relative accessibility of the dynamic drop-offs measure is less stable, with the lowest coefficient being 0.875 and an average value of 0.918 (see Table 8).
6. Discussion and Conclusions
Good transport accessibility and its equity are important goals that must be achieved in the urban for transport managers and urban planners. With the rapid development of city, the measurement of accessibility is challenging. To deal with the issue, this study combined the taxi GPS data and POIs data to measure the taxi accessibility. This study applied a grid-based approach, which can simplify the calculation and deal with the complex environment, to objectively measure the level of the cumulative opportunity accessibility in the Beijing region. This approach utilized the massive taxi trajectory data from complicated real-world traffic situations to accurately reflect the true accessibility. The constant generation of the taxi GPS data and POIs data enable the results to catch up with urban expansion [1].
The proposed method can be utilized to measure the taxi accessibility at the grid cell level, and the size of grid cell can be adjusted according to the research goal. This method provided a practical way to measure taxi accessibility. Three kinds of opportunities were employed, including the constant POIs, total drop-offs, and dynamic drop-offs. In addition, four typical time periods were selected to show the dynamic accessibility in a day. To handle the limitations of road network, land use, and taxi GPS data, a make-up method was proposed to identify the grid cells that are likely to be reachable according to their adjacent grid cells. Furthermore, the grid cells with poor accessibility in specific time periods can be identified, thus some policies can be put forward to improve the accessibility. The method can also be applied to predict accessibility conditions for future scenarios which have some changes in opportunity [1]. In all, the proposed method can provide objective, representative, and cost-effective accessibility values, with temporal and spatial sensitivity.
The findings indicated that the three kinds of opportunities are highly concentrated in the inner part of city. However, the distribution of the POIs is more dispersed. For dynamic drop-offs, it was observed that the midday off-peak hours have a higher value. From the spatial perspective, the eastern part has the higher accessibility than the western part and the inner part of the city has better accessibility than the outer part, whereas the core areas such as Tiananmen Square do not show a high value in accessibility. In addition, it was observed that high accessibility grid cells are likely to cluster together. From a temporal perspective, the peak hours (7:00–9:00 and 17:00–19:00) had lower accessibilities in all three measures. The late-night hours had the best performance in the constant POIs measure and the total drop-offs measure. It is also found that accessibility conditions change significantly depending on the time of day [18]. However, the dynamic drop-offs measure had the best accessibility in the midday off-peak hours. Overall, the fluctuations of accessibility are consistent with the traffic situation in a day, which is consistent with the previous findings [18,23]. Dynamic of accessibility in a day provide more insight to analyze the accessibility issues that is hard to find in the static accessibility [18]. A comparison of different time periods indicated that grid cells with higher accessibility at a time period tend to have higher accessibility at other time periods. In addition, the total drop-off accessibility is similar to the constant POIs accessibility. However, the total drop-off accessibility is different from the dynamic drop-off accessibility in the four time periods, which has the largest value in the midday off-peak hours. This is not consistent with the previous study which found that the constant job accessibility and variable job accessibility are highly correlated [8].
Most studies measuring accessibility are based on the road network and transit network [6,26], which utilized the GIS software to calculate accessibility with the given travel speed or schedule [6,8,14]. In a previous study [1], the GPS data were utilized to generate the average road speed, which would ignore details of different vehicles. However, this study used the taxi GPS data to measure the taxi accessibility. The study area was divided into grid cells and the size of grid cell can be adjusted according to different research objectives. Furthermore, we proposed a make-up method to deal with the limitation of data. The widely used opportunities for accessibility included the number of jobs, population, and POIs. This study innovatively introduced the total drop-offs and dynamic drop-offs as opportunities to measure taxi accessibility. Thus, taxi accessibility could be calculated by the cumulative opportunity measure with the taxi GPS data only. Besides, the POIs data and the taxi GPS data can be updated constantly, the accessibility can be updated to match the rapid development of the city [1]. Overall, the proposed approach is easy to implement. The cumulative opportunity measure based on GPS data can be applied for taxis in other cities around the world. It is feasible to utilize this method using only the available taxi GPS data. Grid cells with low accessibility can be identified and corresponding actions can be recommended to improve it. In addition, the accessibility distribution can be applied to site selection such as for residences and hospitals. Combined with other socio-economic characteristics, this method can be adopted to show the accessibility of a specific service or activity. Furthermore, the continuous generation of taxi GPS data and the updated information on POIs can be used to derive new accessibility values, which can keep pace with the rapid development of a city.
There were also some limitations in this study. There were still some grid cells with insufficient information, especially in suburban regions. This study only concentrated on a regular urban area rather than the whole city. In future work, more data should be taken into consideration, such as the trajectories of ridesharing services. In addition, the accessibility of transit is an indispensable part of the city which can be explored using transaction and route data.
Author Contributions
Conceptualization, S.J. and Z.H.; Methodology, S.J.; Software, S.J.; Validation, W.G., Z.H., and L.Y.; Formal Analysis, S.J. and L.Y.; Investigation, S.J.; Resources, W.G. and Z.H.; Data Curation, S.J. and Z.H.; Writing—Original Draft Preparation, S.J.; Writing—Review & Editing, W.G., Z.H., and L.Y.; Visualization, S.J.; Supervision, W.G.; Project Administration, W.G.; Funding Acquisition, W.G.
Funding
This research was funded by NSFC Projects (71621001, 91746201, 71871010) and the Fundamental Research Funds for Central Universities (2017YJS112).
Acknowledgments
The author is grateful to Xu Chen for the assistance in English writing. The author would like to thank the anonymous reviewers for their constructive suggestions and comments that lend to the improvement of the paper.
Conflicts of Interest
The authors declare no conflict of interest.
References
- Cui, J.X.; Liu, F.; Janssens, D.; An, S.; Wets, G.; Cools, M. Detecting urban road network accessibility problems using taxi gps data. J. Transp. Geogr. 2016, 51, 147–157. [Google Scholar] [CrossRef]
- Hansen, W.G. How accessibility shapes land use. J. Am. Inst. Plan. 1959, 25, 73–76. [Google Scholar] [CrossRef]
- Qian, X.; Ukkusuri, S.V. Spatial variation of the urban taxi ridership using gps data. Appl. Geogr. 2015, 59, 31–42. [Google Scholar] [CrossRef]
- Wachs, M.; Kumagai, T.G. Physical accessibility as a social indicator. Socio-Econ. Plan. Sci. 1973, 7, 437–456. [Google Scholar] [CrossRef]
- Dalvi, M.Q.; Martin, K.M. The measurement of accessibility: Some preliminary results. Transportation 1976, 5, 17–42. [Google Scholar] [CrossRef]
- Geurs, K.T.; Wee, B.V. Accessibility evaluation of land-use and transport strategies: Review and research directions. J. Transp. Geogr. 2004, 12, 127–140. [Google Scholar] [CrossRef]
- Litman, T. Measuring transportation: Traffic, mobility and accessibility. ITE J. Inst. Transp. Eng. 2003, 73, 28–32. [Google Scholar]
- Boisjoly, G.; El-Geneidy, A. Daily fluctuations in transit and job availability: A comparative assessment of time-sensitive accessibility measures. J. Transp. Geogr. 2016, 52, 73–81. [Google Scholar] [CrossRef]
- Horner, M.W. Spatial dimensions of urban commuting: A review of major issues and their implications for future geographic research. Prof. Geogr. 2004, 56, 160–173. [Google Scholar]
- Benenson, I.; Martens, K.; Rofe, Y. Measuring the gap between car and transit accessibility: Estimating access using a high-resolution transit network geographic information system. Transp. Res. Rec. 2010, 2144, 28–35. [Google Scholar] [CrossRef]
- Bertolini, L.; Clercq, F.L.; Kapoen, L. Sustainable accessibility: A conceptual framework to integrate transport and land use plan-making. Two test-applications in the netherlands and a reflection on the way forward. Transp. Policy 2005, 12, 207–220. [Google Scholar]
- Djurhuus, S.; Hansen, H.S.; Aadahl, M.; Glümer, C. Building a multimodal network and determining individual accessibility by public transportation. Environ. Plan. B 2016, 43. [Google Scholar] [CrossRef]
- Gamper, J.; Cometti, W.; Innerebner, M. Defining isochrones in multimodal spatial networks. In Proceedings of the 20th ACM International Conference on Information & Knowledge Management, Glasgow, UK, 24–28 October 2011; pp. 2381–2384. [Google Scholar]
- Owen, A.; Levinson, D.M. Modeling the commute mode share of transit using continuous accessibility to jobs. Transp. Res. Part A 2015, 74, 110–122. [Google Scholar] [CrossRef] [Green Version]
- Tasic, I.; Zhou, X.S.; Zlatkovic, M. Use of spatiotemporal constraints to quantify transit accessibility case study of potential transit-oriented development in west Valley city, Utah. Transp. Res. Rec. 2014, 2417, 130–138. [Google Scholar] [CrossRef]
- Kaza, N. Time dependent accessibility. J. Urban Manag. 2015, 4, 24–39. [Google Scholar] [CrossRef]
- Lei, T.L.; Chen, Y.; Goulias, K.G. Opportunity-based dynamic transit accessibility in southern California. Transp. Res. Rec. 2012, 2276, 26–37. [Google Scholar] [CrossRef]
- Moya-Gómez, B.; Salas-Olmedo, M.H.; García-Palomares, J.C.; Gutiérrez, J. Dynamic accessibility using big data: The role of the changing conditions of network congestion and destination attractiveness. Netw. Spat. Econ. 2018, 18, 273–290. [Google Scholar] [CrossRef]
- Ertugay, K.; Duzgun, S. GIS-based stochastic modeling of physical accessibility using gps-based floating car data and monte carlo simulation. Int. J. Geogr. Inform. Sci. 2011, 25, 1491–1506. [Google Scholar] [CrossRef]
- Li, Q.; Zhang, T.; Wang, H.; Zeng, Z. Dynamic accessibility mapping using floating car data: A network-constrained density estimation approach. J. Transp. Geogr. 2011, 19, 379–393. [Google Scholar] [CrossRef]
- Nam, D.; Hyun, K.; Kim, H.; Ahn, K.; Jayakrishnan, R. Analysis of grid cell–based taxi ridership with large-scale gps data. Transp. Res. Rec. 2016, 2544, 131–140. [Google Scholar] [CrossRef]
- Yang, Z.; Franz, M.L.; Zhu, S.; Mahmoudi, J.; Nasri, A.; Zhang, L. Analysis of washington, dc taxi demand using gps and land-use data. J. Transp. Geogr. 2018, 66, 35–44. [Google Scholar] [CrossRef]
- Moya-Gomez, B.; Garcia-Palomares, J.C. The impacts of congestion on automobile accessibility. What happens in large european cities? J. Transp. Geogr. 2017, 62, 148–159. [Google Scholar] [CrossRef]
- Yue, Y.; Wang, H.D.; Hu, B.; Li, Q.Q.; Li, Y.G.; Yeh, A.G.O. Exploratory calibration of a spatial interaction model using taxi gps trajectories. Comput. Environ. Urban Syst. 2012, 36, 140–153. [Google Scholar] [CrossRef]
- Anderson, P.; Levinson, D.; Parthasarathi, P. Accessibility futures. Trans. GIS 2013, 17, 683–705. [Google Scholar] [CrossRef]
- Paez, A.; Scott, D.M.; Morency, C. Measuring accessibility: Positive and normative implementations of various accessibility indicators. J. Transp. Geogr. 2012, 25, 141–153. [Google Scholar] [CrossRef]
- Liu, Y.; Wang, F.H.; Xiao, Y.; Gao, S. Urban land uses and traffic ‘source-sink areas’: Evidence from gps-enabled taxi data in Shanghai. Landsc. Urban Plan. 2012, 106, 73–87. [Google Scholar] [CrossRef]
- Yu, B.Y.; Ma, Y.; Xue, M.M.; Tang, B.J.; Wang, B.; Yan, J.Y.; Wei, Y.M. Environmental benefits from ridesharing: A case of Beijing. Appl. Energy 2017, 191, 141–152. [Google Scholar] [CrossRef]
- Tang, J.J.; Jiang, H.; Li, Z.B.; Li, M.; Liu, F.; Wang, Y.H. A two-layer model for taxi customer searching behaviors using gps trajectory data. IEEE Trans. Intell. Transp. Syst. 2016, 17, 3318–3324. [Google Scholar] [CrossRef]
- He, Z.; Zheng, L.; Chen, P.; Guan, W. Mapping to cells: A simple method to extract traffic dynamics from probe vehicle data. Comput. Aided Civ. Infrastruct. Eng. 2017, 32, 252–267. [Google Scholar] [CrossRef]
- Li, M.; Jia, Y.; Shen, Z.; He, F. Improving the electrification rate of the vehicle miles traveled in Beijing: A data-driven approach. Transp. Res. Part A 2017, 97, 106–120. [Google Scholar] [CrossRef]
- Amap. Available online: https://www.amap.com/ (accessed on 6 July 2016).
- Saghapour, T.; Moridpour, S.; Thompson, R.G. Public transport accessibility in metropolitan areas: A new approach incorporating population density. J. Transp. Geogr. 2016, 54, 273–285. [Google Scholar] [CrossRef]
- Foth, N.; Manaugh, K.; El-Geneidy, A.M. Towards equitable transit: Examining transit accessibility and social need in Toronto, Canada, 1996–2006. J. Transp. Geogr. 2013, 29, 1–10. [Google Scholar] [CrossRef]
- Widener, M.J.; Farber, S.; Neutens, T.; Horner, M. Spatiotemporal accessibility to supermarkets using public transit: An interaction potential approach in Cincinnati, Ohio. J. Transp. Geogr. 2015, 42, 72–83. [Google Scholar] [CrossRef]
Figure 1.
Major road structures and study area.

Figure 2.
(a) Annual taxi ridership in Beijing, China and (b) modal split.

Figure 3.
Spatial distribution of taxi GPS signals.

Figure 4.
Example of the make-up method.

Figure 5.
Distribution of constant POIs.

Figure 6.
Distribution of total drop-offs.

Figure 7.
Distributions of dynamic drop-offs: (a) 7:00–9:00; (b) 12:00–14:00; (c) 17:00–19:00; and (d) 22:00–24:00.
Figure 7.
Distributions of dynamic drop-offs: (a) 7:00–9:00; (b) 12:00–14:00; (c) 17:00–19:00; and (d) 22:00–24:00.

Figure 8.
Constant POIs accessibility in four time periods: (a) 7:00–9:00; (b) 12:00–14:00; (c) 17:00–19:00; and (d) 22:00–24:00.
Figure 8.
Constant POIs accessibility in four time periods: (a) 7:00–9:00; (b) 12:00–14:00; (c) 17:00–19:00; and (d) 22:00–24:00.

Figure 9.
Total drop-off accessibility in four time periods: (a) 7:00–9:00; (b) 12:00–14:00; (c) 17:00–19:00; and (d) 22:00–24:00.
Figure 9.
Total drop-off accessibility in four time periods: (a) 7:00–9:00; (b) 12:00–14:00; (c) 17:00–19:00; and (d) 22:00–24:00.


Figure 10.
Dynamic drop-off accessibility in four time periods: (a) 7:00–9:00; (b) 12:00–14:00; (c) 17:00–19:00; and (d) 22:00–24:00.
Figure 10.
Dynamic drop-off accessibility in four time periods: (a) 7:00–9:00; (b) 12:00–14:00; (c) 17:00–19:00; and (d) 22:00–24:00.


Table 1.
Points of interest.
| POI Category | Explanation | Count | Percent (%) |
|---|---|---|---|
| Motor vehicle facilities | Automobile sales, maintenance and repair services, car rentals, car washing stations, gasoline stations | 18,792 | 3.49 |
| Food and beverage stores | Food and beverage stores | 73,920 | 13.78 |
| Shopping locations | Furniture stores, electronics stores, clothing stores, general merchandise stores, miscellaneous retailers | 128,017 | 23.86 |
| Life facilities | Telecommunication services, personal and laundry services | 67,515 | 12.58 |
| Sport and recreation facilities | Sport services, leisure facilities, cinemas and theaters | 20,298 | 3.78 |
| Medical and treatment facilities | Hospitals, pharmacies, health care services | 18,166 | 3.39 |
| Accommodation services | Hotels and similar services | 11,894 | 2.22 |
| Scenic spots | Scenic spots, parks, squares | 5378 | 1.00 |
| Residential resources | Residential areas | 20,400 | 3.80 |
| Governmental agencies and social organizations | Governmental agencies, foreign consulates, social organizations | 31,483 | 5.87 |
| Science and cultural facilities | Museums, galleries, schools, scientific research institutions | 32,549 | 6.07 |
| Transport hubs | Airports, railway stations, subway stations, bus stops, parking lots | 41,045 | 7.65 |
| Finance and insurance facilities | Banks, insurance offices, securities | 17,613 | 3.28 |
| Companies | Companies and enterprises | 35,579 | 6.63 |
| Public facilities | Public toilets, news kiosks | 13,846 | 2.58 |
Table 2.
Three kinds of opportunities.
| Opportunity | Definition |
|---|---|
| Constant POIs | The number of POIs in each grid cell |
| Total drop-offs | The total number of taxi trip drop-offs in each grid cell throughout a day (24 h) |
| Dynamic drop-offs | The number of taxi trip drop-offs in each grid cell in the specific time period (7:00–9:00, 12:00–14:00, 17:00–19:00, 22:00–24:00) |
Table 3.
Average accessibilities in four time periods.
| Time Period | 7:00–9:00 | 12:00–14:00 | 17:00–19:00 | 22:00–24:00 |
|---|---|---|---|---|
| Constant POIs | 55,543 | 76,388 | 53,095 | 96,976 |
| Total drop-offs | 343,819 | 476,394 | 327,666 | 596,755 |
| Dynamic drop-offs | 28,314 | 59,614 | 33,593 | 45,680 |
Table 4.
Average relative accessibilities in four time periods.
| Time Period | 7:00–9:00 | 12:00–14:00 | 17:00–19:00 | 22:00–24:00 |
|---|---|---|---|---|
| Constant POIs | −0.729 | 0.287 | −0.849 | 1.291 |
| Total drop-offs | −0.732 | 0.319 | −0.860 | 1.274 |
| Dynamic drop-offs | −0.969 | 1.279 | −0.589 | 0.279 |
Table 5.
Correlation coefficients between measures with different opportunities.
| Time Period | Total Drop-Offs and Constant POIs | Total Drop-Offs and Dynamic Drop-Offs |
|---|---|---|
| 7:00–9:00 | 0.965 | 0.976 |
| 12:00–14:00 | 0.976 | 0.994 |
| 17:00–19:00 | 0.948 | 0.992 |
| 22:00–24:00 | 0.986 | 0.988 |
Table 6.
Correlation between relative accessibilities of different time periods in constant POIs measure.
Table 6.
Correlation between relative accessibilities of different time periods in constant POIs measure.
| Time Period | 12:00–14:00 | 17:00–19:00 | 22:00–24:00 |
|---|---|---|---|
| 7:00–9:00 | 0.943 | 0.914 | 0.938 |
| 12:00–14:00 | - | 0.958 | 0.970 |
| 17:00–19:00 | - | - | 0.939 |
Table 7.
Correlation between relative accessibilities of different time periods in total drop-offs measure.
Table 7.
Correlation between relative accessibilities of different time periods in total drop-offs measure.
| Time Period | 12:00–14:00 | 17:00–19:00 | 22:00–24:00 |
|---|---|---|---|
| 7:00–9:00 | 0.947 | 0.902 | 0.942 |
| 12:00–14:00 | - | 0.953 | 0.966 |
| 17:00–19:00 | - | - | 0.919 |
Table 8.
Correlation between relative accessibilities of different time periods in dynamic drop-offs measure.
Table 8.
Correlation between relative accessibilities of different time periods in dynamic drop-offs measure.
| Time Period | 12:00–14:00 | 17:00–19:00 | 22:00–24:00 |
|---|---|---|---|
| 7:00–9:00 | 0.942 | 0.875 | 0.921 |
| 12:00–14:00 | - | 0.904 | 0.962 |
| 17:00–19:00 | - | - | 0.906 |
© 2018 by the authors. Licensee MDPI, Basel, Switzerland. This article is an open access article distributed under the terms and conditions of the Creative Commons Attribution (CC BY) license (http://creativecommons.org/licenses/by/4.0/).
Share and Cite
MDPI and ACS Style
Jiang, S.; Guan, W.; He, Z.; Yang, L. Measuring Taxi Accessibility Using Grid-Based Method with Trajectory Data. Sustainability 2018, 10, 3187. https://0-doi-org.brum.beds.ac.uk/10.3390/su10093187
AMA Style
Jiang S, Guan W, He Z, Yang L. Measuring Taxi Accessibility Using Grid-Based Method with Trajectory Data. Sustainability. 2018; 10(9):3187. https://0-doi-org.brum.beds.ac.uk/10.3390/su10093187
Chicago/Turabian StyleJiang, Shixiong, Wei Guan, Zhengbing He, and Liu Yang. 2018. "Measuring Taxi Accessibility Using Grid-Based Method with Trajectory Data" Sustainability 10, no. 9: 3187. https://0-doi-org.brum.beds.ac.uk/10.3390/su10093187
Note that from the first issue of 2016, this journal uses article numbers instead of page numbers. See further details here.