Simulation of Urban Growth and Urban Living Environment with Release of the Green Belt


1
Department of Environmental Science and Ecological Engineering, Korea University, 145 Anam-ro, Seongbuk-gu, Seoul 02841, Korea
2
Korea Environment Institute, 370 Sicheong-daero, Sejong 30147, Korea
3
Green Simulation Co., Ltd., 1523 Jungang-daero, Dongrae-gu, Busan 47710, Korea
*
Author to whom correspondence should be addressed.
Sustainability 2018, 10(9), 3260; https://0-doi-org.brum.beds.ac.uk/10.3390/su10093260
Submission received: 29 June 2018
/
Revised: 10 September 2018
/
Accepted: 11 September 2018
/
Published: 12 September 2018
(This article belongs to the Special Issue Sustainable Built Environment and Urban Growth Management)
Abstract
:Green belts in developing or developed countries have been released because city-center development has reached a saturation point, and the strict protections and restrictions within green belts has led to an increase in opposition from local residents and property owners. However, green belt release has led to urban growth within the associated regions and cities, resulting in an increase in the temperature and the accumulation of pollutants in the atmosphere. We intend to prove quantitatively the effect of the release of green belts at the local level based on the interactions among land cover, climate, and air quality and to provide information for policy decisions accordingly. Our simulation results show that the urban areas of Jeju and Chuncheon, in South Korea, where green belts have been completely released, will increase by up to 21.83% by 2025 and 123.93% by 2020, respectively, compared to areas that have retained green belts. The simulations also show that the surface temperature within the released region of Jeju and Chuncheon will increase by up to 0.83% by 2025 and 0.03% by 2020, respectively. The average atmospheric concentrations within the released region of Jeju and Chuncheon were modelled to increase by up to 256.93% by 2025 and 337.29% by 2020, respectively.
1. Introduction
Rapid urban growth and land development following industrialization and urbanization have led to overpopulation, housing shortages, traffic jams, and damage to the environment [1]. To address these issues, the green belt system was introduced. However, green belts have been released, especially in developing or developed countries [2,3], because (1) development of the city centers has reached a saturation point and (2) the strict protection and development restrictions within green belts has led to an increase in opposition from local residents and property owners [4,5].
Developing or developed countries have been attempting to rationalize the change in the type of land use (land cover) by releasing green belts in locations with low conservation value, or where the purpose of the original designation has been achieved. Portions of green belts have been released, and such adjustments are expected to continue in the near future, based on applicable regional urban master planning. In combination with increasing demand and pressure for community development, land use changes rapidly with the release of green belts. Urban regions released from their green belts have spread in connection with existing downtowns. The expansion of urban regions that have been released from green belts is threatening ecosystems and their associated natural services, owing to the acceleration of production activities and an energy-consumptive lifestyle within them.
Therefore, we should evaluate and predict the impact of green belt releases quantitatively in various fields and deal with these threats to nature conservation and human well-being. Although there have been numerous studies globally on the impact of green belt releases, including in the food, resource, water, biodiversity, real estate, community service and health fields [6,7,8,9], there has been a lack of studies aiming to demonstrate its impact on the living environment, especially concerning the climate and air. As awareness increases regarding the fact that land cover change can amplify or mitigate climate change, recently, the number of studies on the evaluation of the interaction between land cover change and climate change has also increased [10,11,12]. However, there is a shortage of studies evaluating the entire system of green belt release, urban growth, climate change, and air pollution.
In this study, we intended to quantify green belt release effects at the local level, based on the interactions among land cover, climate, and air quality. As, however, the effects of the release of green belts becomes more apparent over a longer period of time, it is difficult to prove them conclusively through short-term, empirical observations. Therefore, we deduced long-term effects indirectly, by setting a future target year, defining scenarios, and simulating urban growth and urban environmental changes that would be expected by that year. This study will support policy decision makers in approving or disapproving the release of green belts, by providing more information regarding the changes to the urban environment caused by green belt release.
2. Materials and Methods
2.1. Study Area
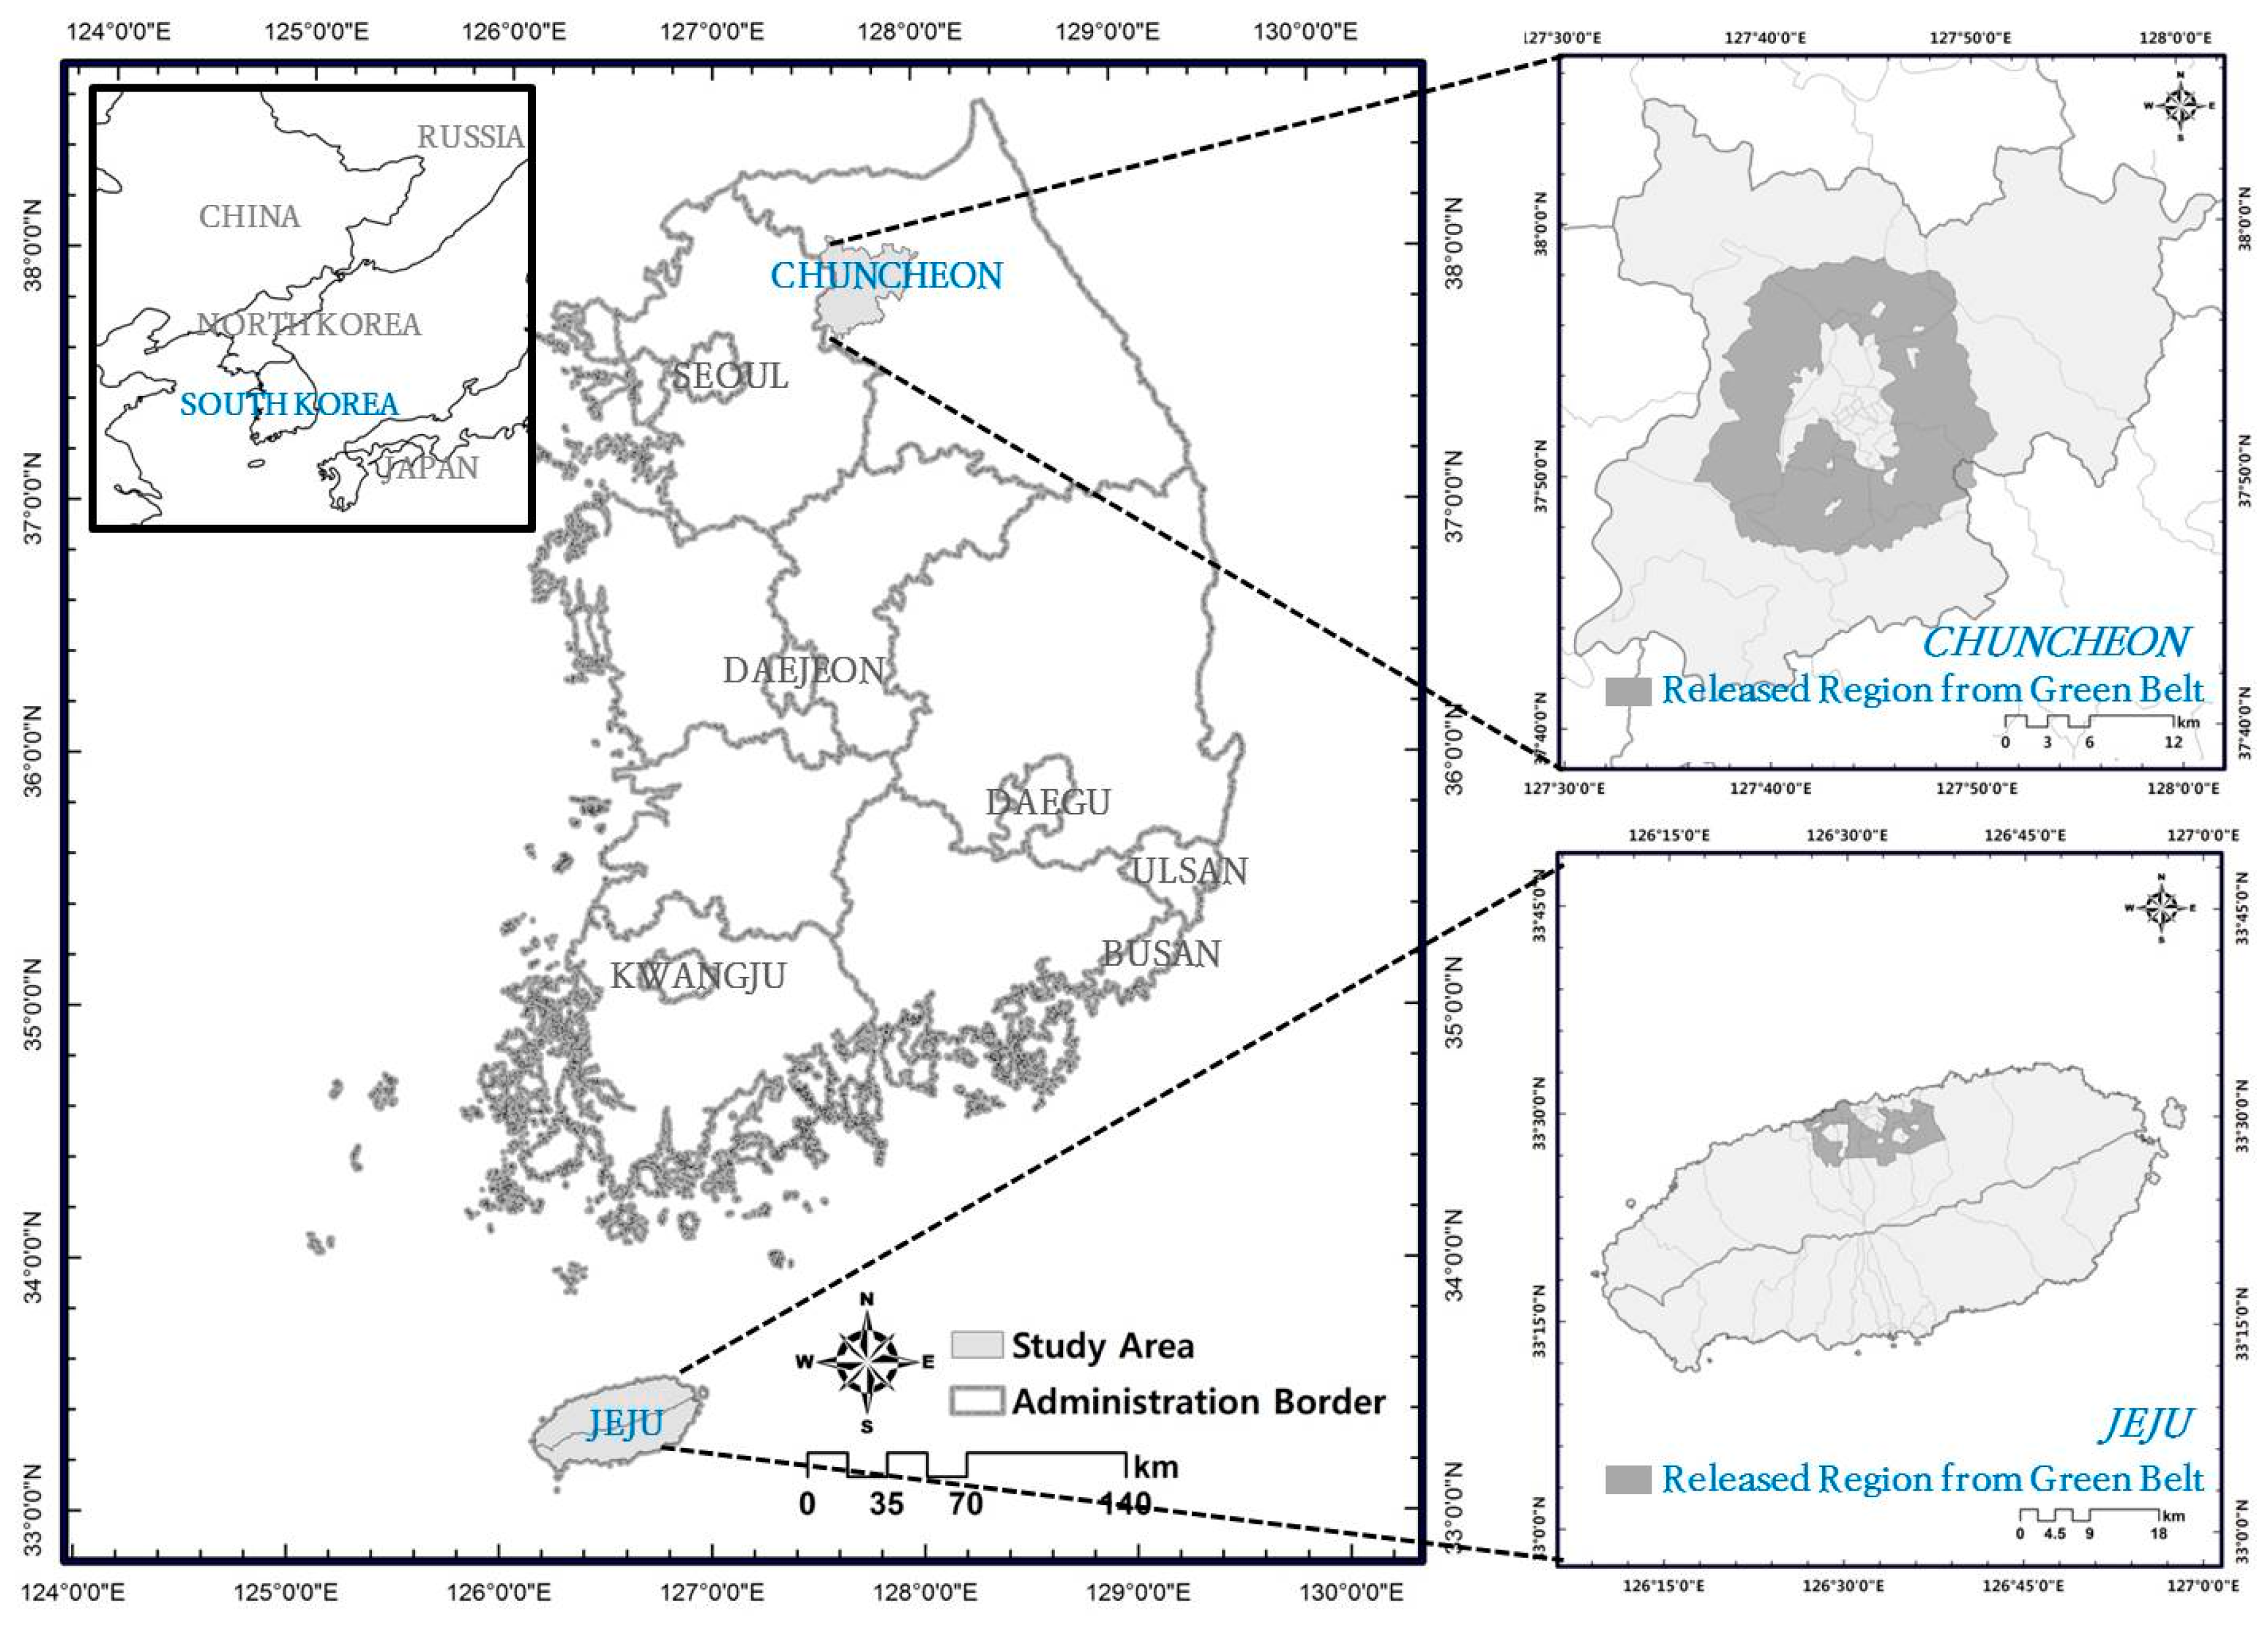
The South Korean Ministry of Land, Infrastructure and Transport (MOLIT) released the entire green belt (82.6 km2) within Jeju Island, which had been designated and maintained for 30 years, on 4 August 2001. On 13 December 2001, all green belts (291.8 km2) within Chuncheon and some (2.6 km2) in Hongcheon (the administrative district next to Chuncheon) were also released.
Using our case studies, we examined urban growth following the release of green belts and its impact on the urban living environment. Jeju and Chuncheon were used as sites for this research (Figure 1) as they have the following characteristics: (1) Due to their geographic and environmental isolation, it was possible to perform an accurate impact assessment of green belt releases, as the possibilities of external urban development pressure, or conurbation were low; (2) these regions comprise medium-sized cities, which allowed spatial analysis at a medium-scale resolution.
2.2. Assessment of Effects from the Release of Green Belts
The study flow is shown in Figure 2, and includes the following six steps: (1) we set up scenarios in which green belts were maintained or released; and (2) estimated the urban region area for the target year, based on increasing trends in the urban area for a certain period of time. (3) Using spatial and statistical techniques, we then analyzed the location characteristics of regions where the land cover was converted into urban land. (4) The probability of the change from non-urban lands to urban lands was estimated based on those characteristics. (5) The estimated probability allowed us to predict changes in the spatial structure within regions released from the green belts by expanding them to the extent of the estimated urban area of the target year. (6) Based on changes in land cover, the ground surface temperature and atmospheric concentrations within those regions were predicted by applying the urban meteorology and climate prediction model.
2.2.1. Scenario Development
We set up scenarios to determine to what extent urban sprawl would continue after release of the green belts, compared to the case in which the green belts were maintained (Table 1). Scenario 1 (SCN 1) was defined as BAU (Business As Usual), and in SCN 1, it was assumed that (1) the sites maintained their green belt boundary as originally designated, and (2) the fluctuation trend of urban areas over the maintenance of the green belt continued until the target year (the target year for simulating urban growth and living environment change following the maintenance or release of the green belts was set as the year to reach an objective in each urban master plan (Chuncheon Urban Master Plan, Jeju Metropolitan City Region Plan). The target year for the simulation of the Chuncheon site was set as 2020, and that of the Jeju site as 2025).
In South Korea, urban growth at the local level has generally progressed via the following process: (1) measuring the demand for development, (2) selecting green belt sites for release, (3) releasing green belts within the total releasable quantity, (4) centrally developing released regions, and (5) expanding built-up zones in connection with existing downtowns. In comparison with BAU, we set up Scenario 2 (SCN 2) to reflect this general progression of urban expansion within South Korea. SCN 2 assumed that an entire green belt was released and that the site maintained its urban growth trend, as shown over the most recently analyzed 20 years (1989–1999–2009) up to the target year.
For urban development to facilitate vitalization of the regional economy, the local government follows three steps in a forward planning process. (1) It estimates the future population of the target year, including the resident population, utilization population, and working population, by reviewing the overall demand for development, the currently available land, and development funds. Based on the estimated forward population, the local government (2) forecasts land demand for additional urban sites, including residential, commercial, and industrial sites, for the long term, and then (3) commences development. We set up Scenario 3 (SCN 3) to reflect the intentional aspect of urban expansion considering the land demand of the local government in comparison with that of BAU. In SCN 3, it was assumed that the entire green belt of the site was released and that the site would be urbanized to the extent of the values published in the urban master plan up to the target year.
2.2.2. Estimation of the Urban Area for the Target Year
A protected zone is the legally controlled geographic space for the purpose of preserving and improving ecological and cultural values [13,14]. It is difficult to alter a land category within the protected zone because property rights and specific actions within it should be reported and permitted in advance based on the relevant law. Therefore, we excluded protected zones when estimating urban areas for target years and the probability of conversion into urban lands.
We excluded the protected zones listed in Table 2 from land cover maps, and confirmed the fluctuation trends of urban areas by considering residential, industrial, commercial, cultural, sports, leisure, transportation, and public areas. Future urban areas based on SCNs 1 and 2 were estimated as follows: we determined linear equations using time-series analysis of urban areas to be derived from land cover maps and estimated future urban areas by inserting target years (2020, 2025) into the equations. In addition, the future urban area based on SCN 3 was substituted with the value of urban areas expected in the urban master plan.
2.2.3. Identification of the Location Characteristics to Determine the Land Cover Change
Simulation of the change in land cover is based on understanding the statistical relationship between spatial patterns of land cover and the driving factors of land cover change [15]. Lim and Choi [16], Allen and Lu [17], Oh et al. [18], Lee et al. [19], and others identified elevation, slope, population density, soil, distance from a river/city/road, and presence of protected zones as factors for determining land cover change. Based on literature review and internal circumstances (in South Korea, the most significant factor leading to the government’s policy decision-making on the release of green belts is the determination to retain the growing population within the urban region. Projects to construct public housing, infrastructure, and industrial complexes are implemented when green belts are released. To reflect this phenomenon, we selected production amount, distance from public transport, population density, distance from public facilities, and distance from cultural facilities as the economic and social factors affecting conversion of non-urban land into urban land), we selected factors affecting the conversion of non-urban land into urban land in terms of the overall (1) topography, (2) economy, (3) society, and (4) environment. From these factors, the elements that we selected as affecting the conversion of non-urban land into urban land were: (1a) elevation, (1b) slope, and (1c) distance from rivers; (2a) production amount and (2b) distance from transportation facilities; (3a) population density, (3b) distance from public facilities, and (3c) distance from cultural facilities; and (4a) soil, (4b) forest, and (4c) ecology. We constructed thematic maps with a spatial resolution of 30 m using these factors as raster data (Table 3).
2.2.4. Estimation of the Conversion Probability from Non-Urban Land into Urban Land
Logistic regression analysis is useful in situations in which the predictor variable is determined by the independent variable or judged by its presence and is suitable when the dependent variable is in the binary mode. It is the statistically applicable method for analysis and prediction of urban growth using several causative factors related to urban growth [11,17,20]. We calculated the conversion probability of transformation into urban regions by using the basic logistic regression model equation—Equation (1).
where p is the conversion probability for transformation into urban regions, Χi is the independent variable, α is constant, and βi is the regression coefficient.
A sample of the independent variable was extracted via systematic random sampling. We extracted non-urban regions from the land cover map for 1989 and divided them into two categories using time-series analysis: (1) the regions that had been changed from non-urban lands to urban lands since 1989, and (2) all other regions. An equivalent number of pixels was extracted in regions that had been converted from non-urban land to urban land to that in all other regions that had remained non-urban. We conducted regression analysis on these pixels using the driving factors. At this time, logistic regression analysis was performed through phased selection of the variable (forward procedure). We established the logistic regression equation by obtaining the regression coefficient and constant and calculated the probability of the conversion of non-urban land into urban land by applying the regression equations based on the different scenarios, to each thematic map.
2.2.5. Simulation of the Urban Growth by Green Belt Release
The estimated probability allowed us to predict the changes in the spatial structure of the urban regions in which the green belt had been released by expanding them to the extent of the estimated urban area (refer to Section 2.2.2). Based on the conversion probability, we extended the urban region until it converged with the value of the area for the target year derived from the linear equations or urban master plan.
2.2.6. Simulation of the Urban Living Environment by Urban Growth
Land cover change affects the heat balance between the land surface and atmosphere above. The accumulation of heat balance changes would result in local changes of the climate and the air quality (the rise in surface temperature from land cover change induces an increase in the height of the atmospheric mixing layer. This leads to the degradation of air quality by the intensification of the greenhouse effect, because the mixing layer height determines the volume available for dispersion of emitted pollutants [21,22,23,24]). We performed simulations of the urban living environment, including the climatic and atmospheric changes, based on the results of the urban expansion prediction. As the Atmosphere to CFD (Computational Fluid Dynamics) (A2C) model is the forecasting model for urban climate and weather based on the 3D non-static primitive equation, it is appropriate for predicting the urban living environment within the complex topography of South Korea. We predicted change to the local climate and air quality within regions released from green belts by inserting land cover and topographic data (digital elevation model) into this model. At that time, the physical properties of the model—such as absorption, reflection, roughness length, maximum moisture, and surface thermal inertia—were reflected as fixed values based on measurements from the early summer when the atmospheric conditions were stable. Areas designated as manufacturing land within urban regions were assumed to be pollutant emission spots (the main cause of air pollution is vehicle operation (0.43 vehicles per capita in South Korea), but it is difficult to predict these for the study areas in the target year. Therefore, we decided to simulate air pollution concentration based on land cover change, because the larger the area of urban lands, the more vehicles there are, leading to more air pollution). In consideration of the overall conditions, such as the atmospheric model, handling devices, and time required, we degraded the spatial resolution of the land cover maps to 200 m and reduced the extent of the target regions to the land surrounding the released green belt area.
3. Results
3.1. Short-Term Effects of the Release of Green Belts Based on Observation
Prior to simulating urban change caused by the release of green belts, we analyzed actual observed short-term changes in land cover and air quality occurring before and after green belt releases.
The changes that appeared within the released regions of the Jeju green belt were as follows (Figure 3 and Figure 4): the urban area within the released regions in 1999 (the 26th year after the designation of the green belt and 2 years before its release) was 3.90 km2, a decrease of 26.44% compared with 1989 (the 16th year post designation). The agricultural area was 17.90 km2, which was an increase of 21.00%, and the forest area was 55.10 km2, increasing by 11.18% compared with 1989. The urban area within the released regions in 2009 (the 8th year after release) was 5.07 km2, an increase of 30.14% compared with 1999. The agricultural area was 56.29 km2, which was an increase of 214.50%, and the forest area was 15.34 km2, a decline of 72.16% compared with 1999. The annual average concentrations of SO2, NO2, O3, CO, and PM10 within the released regions (Ido-dong) in 1999 were 0.005 ppm, 0.018 ppm, 0.031 ppm, 0.700 ppm, and 33.00 µg/m3, respectively. In 1999, the average concentrations of NO2 and CO had increased by 16.67% and 75.50%, but the concentrations of SO2, O3, and PM10 had decreased by 40.63%, 0.54%, and 15.38%, respectively, compared with 1995, which was the 1st year of air quality observations for Ido-dong, and the 22nd year after green belt designation. In 2009, the annual average concentrations of SO2, NO2, O3, CO, and PM10 were 0.002 ppm, 0.013 ppm, 0.041 ppm, 0.400 ppm, and 40.00 µg/m3, respectively. In that year, the concentrations of SO2, NO2, and CO had decreased by 57.89%, 25.71%, and 42.86%, but the concentrations of O3 and PM10 had increased by 32.97% and 42.86%, respectively, compared with 1999.
Changes appeared within the released regions of Chuncheon as follows (Figure 3 and Figure 4): in 1999 (the 26th year after designation of the green belt, and 2 years before its release), the urban area within the released regions was 2.17 km2, an increase of 87.32% compared with 1989, the 16th year after its designation. Compared with 1989, the agricultural area was 47.70 km2, a decrease of 3.22%, and the forest area was 210.18 km2, a decrease of 1.12%. The urban area within the released regions in 2009 (8 years after release) was 4.75 km2, an increase of 119.48% compared with 1999. Agricultural area was 46.40 km2, a decrease of 2.73%, and forest area was 213.53 km2, an increase of 1.59% compared with 1999. However, grassland coverage was 5.13 km2—a decrease of 44.33% compared with 1999. In 2009, the annual average concentrations of SO2, NO2, O3, CO, and PM10 within the released regions (Seoksa-dong) were 0.004 ppm, 0.018 ppm, 0.025 ppm, 0.600 ppm, and 58.00 µg/m3, respectively. By that year, the concentrations of NO2, CO, and PM10 had increased by 100.00%, 50.00%, and 13.73%, respectively; SO2 remained unchanged, and O3 had decreased by 10.71% compared with 2004, which was the 3rd year after the release of the green belt, and the year that air quality monitoring commenced at Seoksa-dong.
We intended to demonstrate the long-term effect of the release of green belts indirectly, by setting the future target year, defining scenarios, and simulating urban growth and environmental change based on the interactions between land cover, climate, and air quality. We decided to do this for the following reasons:
- (1)
- As the effect of the release of green belts appeared to accumulate over a long period of time, it was difficult to demonstrate effects from just short-term empirical observations.
- (2)
- Atmospheric gas concentrations are monitored continually, in order to track the status of air pollution and climate-changing substances in real time and at the national level. There are approximately 300 monitoring stations, acting as representative sites for air quality in South Korea, with just one of these in each of the released regions of Jeju and Chuncheon. Numerous external influences contribute to influence the monitored air quality values, not just effects from release of the green belts, and these other air quality influences cannot be separated from any actual air quality change caused by the release of the green belts. Therefore, there was a limit to our ability to validate the effect of the green belt release accurately, using observational data alone.
3.2. Long-Term Effects of the Release of Green Belts Based on the Simulation
3.2.1. Urban Area of the Target Year
The urban area of Jeju for the target year (2025) was 146.20 km2 in SCN 1, 125.81 km2 in SCN 2, and 178.11 km2 in SCN 3 (Table 4). The urban area of Chuncheon for the target year (2020) was 19.64 km2 in SCN 1, 28.99 km2 in SCN 2, and 43.98 km2 in SCN 3 (Table 4).
Regarding Jeju, the value of the urban area in SCN 1 was higher than that of SCN 2, which assumes green belt release. The cause of this is considered to be that urbanization within South Korea progressed rapidly from the 1970s to the 1990s, but the speed of urban growth has slowed since then, causing the rate of urban growth from 1989 to 1999 to be higher than that from 1999 to 2009. As the equation based on the above-mentioned phenomenon was applied to calculating the future urban area, although the green belt was not released in SCN 1, the urban area in SCN 1 is 1.16 times greater than that in SCN 2. However, these values do not exceed the values reported in the urban master plan.
3.2.2. Location Characteristics and the Probability of Conversion into Urban Land
The analysis confirmed that population density, production amount, and barren land on the land cover map were positively correlated with the conversion of non-urban land into urban land (Table 5). The distance from public facilities, distance from transportation facilities, water on the land cover map, and ecological and natural class are negatively correlated with the conversion of non-urban land into urban land (Table 5).
In SCN 1, ecological and natural class, forest age class, and water on the land cover map primarily affected the conversion of non-urban land into urban land in Jeju, with wetland, barren land, forest age class, ecological and natural class, and soil drainage class the main conversion influencers in Chuncheon. In SCNs 2 and 3, wetland, barren land, grassland, and forest land on the land cover map, forest age class, and ecological and natural class affected the conversion of non-urban land into urban land in Jeju, with forest age class, soil drainage class, and barren land affecting the conversion in Chuncheon. The coefficients, constants, and thematic maps based on driving factors were applied to each logistic regression equation according to the scenarios, and the conversion probabilities were computed.
3.2.3. Change in Urban Growth, Climate, and Air Quality via Green Belt Release within Jeju
Results are shown in Table 6 and Figure 5. In SCN 1 (green belt maintained), the urban area of Jeju in 2025, including protected zones, was 146.20 km2, an increase of 64.53% compared to the urban area in 1999 (the last year prior to the green belt release in which the actual urban area was known). The agricultural area was 357.19 km2, which is a decrease of 9.37%, and the forest area was 1018.29 km2, a decrease of 1.66%, compared to the area in 1999. Of the regions that were converted into urban land, 64.41% was utilized as agricultural land, 29.94% as forest land, and 4.24% as barren land in 1999. In SCN 2 (release of the green belt and development reflecting the past and current trends), the urban area of Jeju in 2025, including protected zones, was 125.81 km2, an increase of 27.22% compared to that of 2009 (the last year after green belt release in which the actual urban area was known). The agricultural area was 799.28 km2 (2.50% decrease since 2009), and the forest area was 646.96 km2 (0.36% decrease since 2009). Of the regions that were converted into urban land, 76.08% was used as agricultural land, 11.18% as barren land, and 8.66% as forest land in 2009. In SCN 3 (release of the green belt and development reflecting the local demand), the urban area of Jeju in 2025 was 178.11 km2, reflecting an 80.10% increase since 2009. The agricultural area was 762.07 km2 (7.04% decrease since 2009), and the forest area was 637.81 km2 (1.77% decrease since 2009). Of the regions that were converted into urban land, 72.82% was classified as agricultural land, 14.49% as forest land, and 6.82% as grassland in 2009.
Based on SCN 1, the urban area within the released regions was 3.90 km2 in 2025. The area based on SCN 2 was 7.11 km2, an increase of 82.51%, and the area based on SCN 3 was 10.86 km2, reflecting an increase by 178.70% since 1999, the year before the green belt release. The forest area within the released regions decreased rapidly owing to the expansion of urban areas. In 2025, the forest area of the released regions was 55.00 km2 in SCN 1, 15.21 km2 in SCN 2 (72.39% decrease), and 14.60 km2 in SCN 3 (73.51% decrease). The more green belt released, and the higher the demand for local development, the more urban areas within the released regions and downtown expanded.
The average surface temperature in the released region in 2025 was 31.45 °C in SCN 1, 31.71 °C in SCN 2, and 31.45 °C in SCN 3. The surface temperature in the existing downtown (classified as downtown on the land cover map of 2009) was 32.47 °C in SCN 1, 32.63 °C in SCN 2, and 32.36 °C in SCN 3. The surface temperature in regions released from the green belt and the existing downtown in SCN 2 increased by 0.83% and 0.49%, respectively, compared to those of SCN 1. However, the temperatures in SCN 3 decreased by 0.01% and 0.34%, respectively, compared to those of SCN 1, because the spatial resolution of the land cover had been degraded from 30 m to 200 m, resulting in the decrease of urban expansion (we tried to improve the spatial resolution of the input and result data from 200 m to 90 m and simulated the local climate change. At 90 m spatial resolution, the surface temperature in the released regions was 29.21 °C in SCN 1, 29.38 °C in SCN 2, and 29.49 °C in SCN 3. The surface temperature in the downtown was 29.81 °C in SCN 1, 30.13 °C in SCN 2, and 29.89 °C in SCN 3. The surface temperature in regions released from the green belt and in the existing downtown in SCN 3 increased by 0.96% and 0.27%, respectively, compared to those of SCN 1. This shows that the release of the green belt led to the increase in the urban surface temperature compared with the maintenance of the green belt). However, the difference between the average surface temperature within downtown and the released region decreased by 1.02 °C in Scenario 1, 0.92 °C in SCN 2, and 0.91 °C in SCN 3, indicating that higher-temperature regions expanded after the green belt release.
The average atmospheric concentrations within the released regions in 2025 were 2.67 × 10−07 g/m2, 8.70 × 10−07 g/m2, and 9.53 × 10−07 g/m2 in SCNs 1, 2, and 3, respectively. The average atmospheric concentrations in SCNs 2 and 3 rapidly increased by 225.84% and 256.93%, respectively, compared to that of SCN 1. In 2025, the atmospheric concentrations in the existing downtown in each scenario were 4.42 × 10−06 g/m2, 4.33 × 10−06 g/m2, and 4.51 × 10−06 g/m2, respectively. The average atmospheric concentration of the downtown in SCN 2 decreased by 2.04% compared to that of SCN 1. However, the average atmospheric concentration of the downtown in SCN 3 increased by 2.04% compared to that of SCN 1.
3.2.4. Changes in Urban Growth, Climate, and Air Quality via Green Belt Release within Chuncheon
Results are presented in Table 7 and shown in Figure 6. In SCN 1, the urban area of Chuncheon in 2020, including the protected zone, was 19.64 km2, reflecting an increase of 28.83% since 1999. The agricultural area was 105.03 km2 (1.22% decrease since 1999), and the forest area was 906.10 km2 (0.15% decrease since 1999). Of the regions that were converted into urban land, 36.24% was utilized as forest land, 34.39% as agricultural land, and 17.20% as barren land in 1999. In SCN 2, the urban area of Chuncheon was 28.99 km2 in 2020, an increase of 11.33% since 2009. The agricultural area was 101.01 km2 (1.73% decrease since 2009), and the forest area was 915.29 km2 (0.05% decrease since 2009). Of the regions that were converted into urban land, 60.34% was classified as agricultural land, 16.61% as forest land, and 12.54% as barren land in 2009. In SCN 3, the urban area of Chuncheon was 43.98 km2 in 2020, an increase by 68.89% since 2009; the agricultural area was 90.05 km2 (12.39% decrease since 2009); and the forest area was 912.64 km2 (0.34% decrease since 2009). Of the regions that were converted into urban land, 71.01% was used as agricultural land, 17.50% as forest land, and 5.74% as barren land in 2009.
In 2020, the urban area within the released regions in SCN 1 was 2.09 km2. It was 5.63 km2 in SCN 2, reflecting an increase of 170.21% since 1999, before the release of the green belt. In SCN 3, it was 14.03 km2, reflecting an increase of 573.84% since 1999. The agricultural area decreased as the urban area within the released region expanded. In 2020, the agricultural area within the released region was 47.47 km2 in SCN 1, 45.76 km2 in SCN 2 (3.62% decrease since 1999, before the release of the green belt), and 39.45 km2 in SCN 3 (decrease of 16.90% since 1999).
The average surface temperatures within the released regions in 2020 were 31.02 °C, 31.03 °C, and 31.03 °C in SCNs 1, 2, and 3, respectively, and the average surface temperatures within the existing downtown were 33.37 °C, 34.34 °C, and 34.41 °C. These values indicated that the surface temperatures of the downtown in all scenarios increased after the green belt was released. As a result of releasing the green belt, the surface temperatures within the released region increased by 0.03%, on average, and those within the downtown increased by 2.91–3.12% compared to those in SCN 1.
In 2020, the average atmospheric concentrations within the released region were 2.95 × 10−08 g/m2, 1.28 × 10−07 g/m2, and 1.29 × 10−07 g/m2 in SCNs 1, 2, and 3, respectively, and the average atmospheric concentrations within the downtown were 3.50 × 10−05 g/m2, 3.71 × 10−06 g/m2, and 4.64 × 10−06 g/m2. The atmospheric concentration within the downtown was improved by releasing the green belt. However, the average atmospheric concentrations within the released regions in SCNs 2 and 3 increased by 333.90% and 337.29%, respectively, compared to that in SCN 1.
4. Discussion
4.1. Effect of Green Belt on the Restriction of the Urban Expansion
The green belt system was introduced to prevent urban sprawl through the designation of development restriction zones and the limitation of activities performed within these zones. We identified the effect of green belts on urban growth control by simulating the future urban area based on the maintenance or the release of the green belts. This simulation demonstrated that green belts promoted and integrated the development district into the center of the city, preventing large-scale development and the spread of development outside of the city. This was shown in our projections, whereby future urban areas of Jeju and Chuncheon decreased by up to 17.92% and 55.34% in the scenario in which the green belt was maintained compared with those in the scenario in which the green belt was released.
However, green belts within developing or developed countries that had been maintained for several decades have been released, and their release is expected to continue for economic vitalization reasons [2,3]. Based on this study, green belt release could lead to expansion of existing urban regions and even acceleration of leapfrogging development (the logistic regression analysis of conversion into urban land showed that population density, production, and barren land on the land cover map were positively correlated with conversion of non-urban land into urban land. On this basis, it can be confirmed that urban land expanded around existing urban lands, as shown in Figure 5 and Figure 6). This goes against the purpose of the green belt, that is, to restrict urban expansion, conserve the natural environment, and secure the living environment of urban residents.
It is expected that urban development will continue to expand as a result of urban master planning focusing on urban growth and targeting agricultural land surrounding cities, which is vulnerable to conversion into urban land. It is possible that the urban spatial structure will be changed in the following sequence: urbanization of regions released from green belts, urban spread connected with existing downtowns, and urban sprawl. Broad urban sprawl negatively affects forest land, which produces resources and energy, improves air quality, mitigates climate change, conserves ecosystems, and improves health [25,26]. There is concern that urban expansion will lead to encroachment onto urban farmland and will damage forest land. Protected zones, as well as forest land, might be released, which would reduce the quality of the urban environment if development demand increases continuously and development capacity exceeds the availability of developable land within non-protected zones of the city.
4.2. Effect of the Green Belt on Conservation of the Urban Living Environment
The green belt ensures a healthy living environment for citizens through the prevention of urban sprawl and conservation of the natural environment that surrounds cities. However, urban growth that results from green belt release leads to a higher temperature in downtown centers, and a lower temperature outside the city. The high-temperature region of >32 °C will expand across the existing downtown and new urban regions as a result of green belt release. The average surface temperature within the released region in the scenario that was set for green belt release increased by up to 0.83% in Jeju and 0.03% in Chuncheon, compared to that of the scenario in which the green belt was maintained. Surface temperature rise due to land cover change induces an increase in the atmospheric mixing layer height which in turn determines the volume of the air shed into which emitted pollutants disperse. This enhances degradation of the air quality through intensification of the greenhouse effect [21,22,23,24], because the higher the mixing layer height, the less it is influenced by the external weather conditions that dilute pollutants.
In the short term, this phenomenon will cause pollutants to accumulate in the urban canopy directly above their emission source and the atmospheric concentrations will increase. The average atmospheric concentrations within the released region in the scenario of green belt release increased by up to 256.93% in Jeju and 337.29% in Chuncheon compared to that of the scenario set for green belt maintenance. If entire green belts are released and development is accomplished to accommodate all local development demand, more pollutants will be accumulated, and higher atmospheric concentrations will appear. In the medium/long term, this could result in the more frequent occurrence of severe weather phenomena, including tropical nights and localized heavy rain. This could deplete the output of primary and secondary industries and accelerate energy consumption. In addition, it is postulated that this, in turn, could create obstacles to the supply of energy within the urban region.
4.3. Sustainable Management of Green Belts for Coexistence between Nature and Humans
In the initial stage of urbanization, the primary purpose of the national policy within the developing or developed countries is economic development. Existing downtowns that have already been equipped with infrastructure are generally selected as the development sites for economic growth because the effectiveness and productivity of the national land use are considered important. Because of significant investments in existing downtowns, population growth is remarkable and social infrastructure is created accordingly. This results in the expansion of urban lands.
The green belt system was introduced as a means for controlling urban growth because development expanded from urban regions to suburban regions. However, green belts have been released to promote the rationalization of land use change, because the discomfort of residents and landowners worsened owing to standardized and excessive regulations. In South Korea, particularly, the population is concentrated in urban regions—the urban residential population proportion was 91.82% in 2017, and it is necessary to prepare housing and infrastructure for their support of the concentrated population. However, development sites are in short supply within urban regions. Accordingly, South Korea’s government releases green belts surrounding urban regions and implements development plans and projects for these released regions from green belts. As a result, horizontal sprawl, and vertical growth within the released regions, have caused cities to expand and to be combined, resulting in changes in the urban spatial structure. A wide range of human activities that consume natural resources have led to changes in the living environment, including increases in the surface and atmospheric temperatures, expansion of high temperature regions, and changes in wind speed. These changes have caused accumulation of pollutants in the atmosphere.
In South Korea, England, Japan, Canada, United States of America, Australia, New Zealand, France, Netherland, and Russia, green belts are being maintained [27]. Even then, parts of green belts have been released, or the related system abolished, in some of these countries—South Korea, England, and Japan [27]. Especially in South Korea, where there has been great environment benefit from retaining green belts over decades, green belts are now being released based on urban master plans, and this phenomenon is expected to continue into the near future. As green belt release occasionally contributes to resolving urban crises, in combination with time and space situations, such as housing shortages and their high cost [9,28], there is debate with regard to the need to adjust green belt borders and to the regulations that apply to their conservation [28,29,30,31]. Importantly, it is almost impossible for released green belt areas to be re-designated as green belts, for economic and social reasons, and it is also difficult to reverse the environmental damage; therefore, designation and release of green belts should be carefully decided, in order to promote coexistence between nature and humanity.
First, for the management of sustainable urban growth, green belts should be designated as confined regions, in which it is necessary to restrict development. This is necessary (1) to prevent disorderly urban sprawl, (2) to prevent neighboring cities from being linked by continuous urban corridor areas, (3) to conserve the natural environment and ecosystems surrounding cities, and (4) to ensure a healthy living environment for city dwellers. More effort should be made to preserve green belts with high conservation values, and to restore broken and damaged ecosystems within existing green belts, by restoring ecological corridors (the green (forest), blue (river), yellow (soil), and white (wind) networks) around green belts, connecting with ecosystems inside and outside of the green belts, and building green spaces.
Second, green belts should be used and managed sustainably, as they directly affect the lives of local residents. We should encourage lifestyle activities that have minimal influence on the ecosystem, through transferring technology, providing supporting finance for sustainable agricultural production, diversifying community support programs, and aiding development of compatible facilities. We could render parts of the green belts eco-friendly, by transforming them into public parks and constructing green leisure facilities on land purchased for that purpose. Traffic and movement networks (white belts) around the green belts should be constructed for commuting, while still ensuring low-density or low-impact use and maintaining a pleasant urban environment.
Third, green belts could have their shapes adjusted, or could be released if necessary, if issues arise concerning the adequate supply of urban land, or land-use rationalization, in their vicinity, provided environmental assessment of the green belt shows that the released land embodies low conservation value. Such a review should include the following questions:
- Is the urban development necessary, taking into consideration the decline of the city (that is, that the rate of urbanization has slowed down)?
- Should urban development definitely be accommodated within the green belt?
If the release and development of green belts is inevitable, it should at least be discouraged within more environmentally sensitive regions, in order to conserve the urban ecosystem that provides diverse ecosystem services, generates pleasant urban environments, and responds to climate change. It should be developed in connection with areas in need of urban regeneration, or urban revitalization, not in the context of building a new town or industrial complex.
We should encourage eco-friendly use and development of released areas, for tours or as recreational spaces for citizens, where the environmental burden of use is low, and the environmental impact assimilating capacity can be maintained. We should also ensure that a minimum green zone width is retained within the released region to prevent urban conurbation. We should:
- Select the released and developed locations from the green belt in light of the current situation and potential development impacts,
- Develop and apply techniques to minimize environmental change,
- Prepare measures to mitigate development impacts,
- Arrange solutions to reasonably manage pollutants,
- Establish and apply customized methods to reflect the local characteristics, and
- Periodically monitor whether the above measures are implemented or not.
Basic investigation should be carried out, and environmental monitoring using purpose-built facilities should be enforced. We expect the above measures to create a comfortable urban environment which promotes and maintains a harmonious balance between nature and human beings through the sustainable management of green belts.
5. Conclusions
Green belts are development-restricted zones created with the aim of preventing urban sprawl and ensuring a healthy living environment for citizens through conservation of the natural environment surrounding cities. However, green belts have been released to promote the rationalization of land use change, and the urban land within the released regions has enlarged through existing downtowns in response to increasing demand for community development. The environment of these regions has been degraded and threatened by the acceleration of development activities and a lack of management. Therefore, we conducted a quantitative assessment to prove the impact of green belt releases on urban growth and urban living environment degradation, focusing on the changes in land cover, climate, and air quality.
This study has concluded that the urban areas of Jeju (by 2025), and Chuncheon (by 2020), where green belt land was released, would increase by up to 21.83% and 123.93%, respectively, compared to the BAU scenario, where green belts were maintained intact. The surface temperatures within the released regions of Jeju (by 2025) and Chuncheon (by 2020) are predicted to increase by up to 0.83% and 0.03%, respectively. The average atmospheric concentrations within the released regions of Jeju (by 20205) and Chuncheon (by 2020) would increase by up to 256.93% and 337.29%, respectively.
However, these results have the following limitations. (1) Scenarios were set up based on the simple assumption that the current urban growth trends would continue into the future for the study areas. (2) A linear equation was applied to estimate the future urban area, owing to a lack of input data. (3) This prediction was accomplished at the medial spatial resolution level because of limited simulation models and infrastructure. Environmental change trends following the release of the green belts could be analyzed; however, detailed estimates were impossible. Therefore, a database including historic information on green belts should be generated. In addition, further studies should set and verify scenarios in consideration of future change and potential demands on the environment, economy, and society. Finally, various models based at the local, metropolitan, and national levels should be developed and applied; these models would help researchers and policy makers to predict future change, and the likely influence and demands of the urban environment, and to establish policies for the sustainable management of associated green belts.
Although limitations exist within this study, our results show that the significant benefits of green belts are compromised when they are released, their designated purposes are not followed, and their spatial characteristics are not considered. This causes exaggerated growth and expansion of existing cities, conurbation between existing towns and new towns, degradation of the environmental quality of downtown and released regions, and renders remaining green belt areas non-sustainable. It is impossible for green belts to solve all urban problems, and they in fact contribute occasionally to urban crises, in combination with issues of time and space [9,28]. There is debate with regard to the need to adjust green belt borders, and on the regulations to apply for their conservation [28,29,30,31]. This study has shown, however, that green belts are able to contribute positively to controlling urban growth, and to conserving the urban living environment, and that they require a minimal but necessary amount of maintenance. It is almost impossible for released green belt areas to be re-designated as green belts, or for them to be returned to their pre-release environmental state. Therefore, the designation and the release of green belts should be carefully decided in order to promote the coexistence between nature and human beings.
For the management of sustainable urban growth, green belts should be designated as confined regions in which it is necessary to restrict development. This is necessary for the following reasons: (1) to prevent disorderly urban sprawl, (2) to prevent neighboring cities from being linked by continuous urban corridors, (3) to conserve the natural environment and ecosystems surrounding cities, and (4) to ensure a healthy living environment for city dwellers. More effort should be made to conserve green belts with high conservation value, and to restore damaged ecosystems within them. Within green belts, human activities that do not degrade ecosystem functions, and minimally affect natural resources within the green belt zone should be encouraged. Parts of green belts should be dedicated to eco-friendly uses, by transforming them into public parks and constructing environmentally friendly facilities in land purchased for the purpose. Traffic and movement networks (white belts) around the green belts should be constructed for commuters, while ensuring that low-density use and low-impact use are encouraged, maintaining a pleasant urban environment. Green belts could have their shapes adjusted, or could be released if necessary, if issues arise concerning the adequate supply of urban land, or land-use rationalization, in their vicinity, as long as environmental assessment of the green belt shows that the released land embodies low conservation values. However, the release of green belts should be discouraged within environmentally sensitive regions in order to conserve the urban ecosystem, and released green belt land should be developed in connection with areas that are in need of urban regeneration or revitalization, and should not be used for building new towns or industrial complexes. We should select sites for release from green belts only after conducting analysis considering geographic, economic, social, and environmental factors, and should encourage eco-friendly use and development of released areas for tourism, or as recreational spaces for citizens, where the environmental burden is low, and the environmental impact assimilating capacity can be maintained. We should contribute to the sustainable management of green belts by introducing eco-friendly or low-impact development techniques, implementing environmental monitoring, and constructing environmental infrastructure within released areas. Finally, we should also ensure that a minimum green zone width is retained within the released region, to prevent urban conurbation.
This study is significant, as we intended to support policy decision-making with respect to green belts by predicting urban growth and the changes that green belt release could cause in the urban living environment using various development scenarios. We anticipate that a balance between conservation and use will be kept by managing green belts reasonably through more studies based on our research, and that healthy urban environments will be promoted and improved.
Author Contributions
Conceptualization, S.J.; Methodology, H.H., and S.K.; Software, H.H., and S.K.; Validation, H.H., and S.K.; Formal Analysis, S.J., H.H., and S.K.; Investigation, H.H., and S.K.; Resources, H.H., and S.K.; Data Curation, S.J.; Writing-Original Draft Preparation, H.H.; Writing-Review & Editing, S.J. and H.H.; Visualization, H.H., and S.K.; Supervision, S.J.; Project Administration, S.J.; Funding Acquisition, S.J.
Funding
This study was funded by Korea Environment Institute project (GP2013-01-32) and Korea University Grant.
Acknowledgments
This study was conducted as part of “Sustainable Management of Green Belt by Changing Land Environment Management” supported by the Korea Environment Institute. For publication, this study was supported by Korea University Grant.
Conflicts of Interest
The authors declare no conflict of interest.
References
- Bhatta, B. Analysis of urban growth and sprawl from remote sensing data. Adv. Geogr. Inf. Sci. 2010, 17–36. [Google Scholar] [CrossRef]
- Yamamoto, K. Comparison of the garden city concept and green belt concept in major Asian and Oceanic cities. J. Hum. Soc. Sci. 2009, 3, 1055–1064. [Google Scholar]
- Department for Communities and Local Government. Local Planning Authority Green Belt: England 2014/15. Available online: https://www.gov.uk/government/collections/green-belt-statistics (accessed on 3 August 2018).
- Kim, J.H.; Jung, S.H.; Hwang, K.M.; Lee, J.M.; Kim, S.M.; Hwang, S.K.; Lee, J.Y. Policy Development for Quality Innovation of Forest Resources; Korea Forest Service: Seoul, Korea, 2012. [Google Scholar]
- Yang, J.C.; Kim, S.W. Policy Agenda Change and Perspective for the Restricted Development Zone, Green Belt under Socio-Economic Paradigm Change. J. Korea Reg. Sci. Assoc. 2013, 29, 123–143. [Google Scholar]
- Choi, J.W.; Lee, K.J.; Noh, T.H.; Min, S.H. Changes of landuse for eight years (1999–2007) in greenbelt area. Seoul Environ. Sci. 2010, 19, 1025–1034. [Google Scholar]
- Oh, J.K.; Yang, S.W. The development activity control in the German outer-area. Seoul City Res. 2011, 12, 65–82. [Google Scholar]
- Steffen, W.; Sanderson, A.; Tyson, P.D.; Jäger, J.; Matson, P.A.; Moore, B., III; Oldfield, F.; Richardson, K.; Schellnhuber, H.-J.; Turner, B.L.; et al. Global Changes and the Earth System: A Planet under Pressure; Springer: Heidelberg, Germany, 2004. [Google Scholar]
- Han, A.T. Effects of relaxing the urban growth management policy: Greenbelt policy of Seoul metropolitan area, South Korea. J. Plan. Educ. Res. 2017. [Google Scholar] [CrossRef]
- Civerolo, K.; Hogrefe, C.; Lynn, B.; Rosenthal, J.; Ku, J.-Y.; Solecki, W.; Cox, J.; Small, C.; Rosenzweig, C.; Goldberg, R.; et al. Estimating the effects of increased urbanization on surface meteorology and ozone concentrations in the New York City metropolitan region. Atmos. Environ. 2007, 41, 1803–1818. [Google Scholar] [CrossRef]
- Rosenthal, J.K.; Sclar, E.D.; Kinney, P.L.; Knowlton, K.; Crauderueff, R.; Brandt-Rauf, P.W. Links between the built environment, climate and population health: Interdisciplinary environmental change research in New York City. Ann. Acad. Med. Singap. 2007, 36, 834–846. [Google Scholar] [PubMed]
- Ward, P.J.; Balen, R.T.; Verstraeten, G.; Renssen, H.; Vandenberghe, J. The impact of land use and climate change on late Holocene and future suspended sediment yield of the Meuse catchment. Geomorphology 2009, 103, 389–400. [Google Scholar] [CrossRef]
- Dudley, N. Guidelines for Applying Protected Area Management Categories; World Conservation Union: Gland, Switzerland, 2008; Available online: http://www.iucn.org/dbtw-wpd/edocs/paps-016/pdfShare (accessed on 3 September 2017).
- Park, Y.H.; Jeon, S.W.; Eum, J.H.; Hong, H.J.; Choi, H.A.; Byun, B.S. Sustainable Use and Management of Protected Areas: Site-Based Approaches Considering Ecological and Socio-Economic Factors; Korea Environment Institute: Seoul, Korea, 2012. [Google Scholar]
- Verburg, P.H.; Soepboer, W.; Veldkamp, A.; Limpiada, R.; Espaldon, V.; Mastura, S.S. Modeling the spatial dynamics of regional land use the CLUE-S model. Environ. Manag. 2002, 30, 391–405. [Google Scholar] [CrossRef] [PubMed]
- Lim, C.H.; Choi, D.S. Predicting micro land use dynamics: A cellular automata modelling approach. Korea Plan. Assoc. 2002, 37, 229–239. [Google Scholar]
- Allen, J.; Lu, K. Modeling and prediction of future urban growth in the Charleston region of South Carolina: A GIS-based integrated approach. Conserv. Ecol. 2003, 8, 2. [Google Scholar] [CrossRef]
- Oh, Y.G.; Choi, J.Y.; Bae, S.J.; Yoo, S.H.; Lee, S.H. A probability mapping for land cover change prediction using CLUE model. Korea Soc. Rural Plan. 2010, 16, 47–55. [Google Scholar]
- Lee, D.G.; Ryu, D.H.; Kim, H.G.; Lee, S.H. Analyzing the future land use change and its effects for the region of Yangpyeong-gun and Yeoju-gun in Korea with the Dyna-CLUE model. Korea Soc. Environ. Restor. Technol. 2011, 14, 19–310. [Google Scholar]
- Kwon, H.C.; Lee, B.G.; Lee, C.S.; Ko, J.W. The landslide probability analysis using logistic regression analysis and artificial neural network methods in Jeju. Korean Soc. GIS 2011, 19, 33–40. [Google Scholar]
- Russell, P.B.; Uthe, E.E.; Ludwig, F.L.; Shaw, N.A. A comparison of atmospheric structure as observed with monostatic acoustic sounder and lidar techniques. J. Geophys. Res. 1974, 79, 5555–5566. [Google Scholar] [CrossRef]
- Menut, L.; Flamant, C.; Pelon, J. Urban boundary-layer height determination from lidar measurements over the Paris area. Appl. Opt. 1999, 38, 945–954. [Google Scholar] [CrossRef] [PubMed]
- Kim, S.W.; Yoon, S.C.; Won, J.G.; Choi, S.C. Ground-based remote sensing measurements of aerosol and ozone in an urban area: A case study of mixing height evolution and its effect on ground-level ozone concentrations. Atmos. Environ. 2007, 41, 7069–7081. [Google Scholar] [CrossRef]
- Wang, X.Y.; Wang, K.C. Estimation of atmospheric mixing layer height from radiosonde data. Atmos. Meas. Tech. 2014, 7, 1701–1709. [Google Scholar] [CrossRef] [Green Version]
- Jeon, K.W. Role and direction of forest business for the promotion of water recharge function. Ann. Acad. Korean For. Soc. Korea 2002, 0, 25–44. [Google Scholar]
- Kim, J.I.; Yeo, C.H. Measuring greenbelt policy effects through the urban growth prediction model. Korea Plan. Assoc. 2008, 43, 211–223. [Google Scholar]
- Kwon, Y.W. City and Green Belt; Purungil: Seoul, Korea, 2006. [Google Scholar]
- Zhao, Y. Space as method: Field sites and encounters in Beijing’s green belts. City 2017, 21, 190–206. [Google Scholar] [CrossRef]
- Thomas, K.; Littlewood, S. From green belts to green infrastructure? the evolution of a new concept in the emerging soft governance of spatial strategies. J. Plan. Pract. Res. 2010, 25, 203–222. [Google Scholar] [CrossRef]
- Morrison, N. A Green Belt under Pressure: The Case of Cambridge, England. J. Plan. Pract. Res. 2010, 25, 157–181. [Google Scholar] [CrossRef]
- Mace, A. The Metropolitan Green Belt, changing an institution. Prog. Plan. 2018, 121, 1–28. [Google Scholar] [CrossRef]
Figure 1.
Study area: Jeju and Chuncheon are medium-sized isolated regions, and green belts within these regions which had been maintained for 30 years were released totally in the early 2000s. These regions were used as study sites to prove quantitatively the effect of the release of green belts.
Figure 1.
Study area: Jeju and Chuncheon are medium-sized isolated regions, and green belts within these regions which had been maintained for 30 years were released totally in the early 2000s. These regions were used as study sites to prove quantitatively the effect of the release of green belts.

Figure 2.
Flow chart: the main flow of this study is as follows: (1) the set of scenarios, (2) the estimation of urban area for the target year, (3) the identification of location characteristics to determine land cover change, (4) the estimation of the probability of conversion from non-urban land into urban land, (5) the simulation of urban growth by green belt release, and (6) the simulation of urban living environment by urban growth.

Figure 3.
Land cover change before and after the release of green belts, based on observation; we conducted the time series (1989, 1999, 2009) analysis on the observed change of the area based on land cover type within the regions released from green belts.
Figure 3.
Land cover change before and after the release of green belts, based on observation; we conducted the time series (1989, 1999, 2009) analysis on the observed change of the area based on land cover type within the regions released from green belts.

Figure 4.
Air quality change before and after the release of green belts, based on observation: we conducted the time series (1999, 2009) analysis based on the observed change of air quality (SO2, NO2, O3, CO, PM10) within the regions released from green belts.
Figure 4.
Air quality change before and after the release of green belts, based on observation: we conducted the time series (1999, 2009) analysis based on the observed change of air quality (SO2, NO2, O3, CO, PM10) within the regions released from green belts.

Figure 5.
Spatial distribution of urban growth, climate, and air quality in the region released from the green belt within Jeju; we represented spatially the effect of the release of green belts within Jeju through the prediction of the urban expansion and the simulation of the urban living environment based on the interactions among land cover, climate, and air quality.

Figure 6.
Spatial distribution of urban growth, climate, and air quality in the region released from the green belt within Chuncheon; we represented spatially the effect of the release of green belts within Chuncheon through the prediction of the urban expansion and the simulation of the urban living environment based on the interactions among land cover, climate, and air quality.


Table 1.
Scenarios for analyzing the effect of green belt release: we set up scenarios to determine to what extent urban sprawl would continue after releasing of the green belts compared to that in the case in which the green belts were maintained (Table 1).
Table 1.
Scenarios for analyzing the effect of green belt release: we set up scenarios to determine to what extent urban sprawl would continue after releasing of the green belts compared to that in the case in which the green belts were maintained (Table 1).
| SCN 1 | SCN 2 | SCN 3 | |
|---|---|---|---|
| Green Belt | Maintained | Released | Released |
| Development | Restricted | Non-restricted | Non-restricted |
| Urban Expansion | Restricted | General Expansion | Intentional Expansion |
| Based on Linear Trend before Green Belt Release (1989–1999) * | Based on Linear Trend of Most Recent 20 years of available data (1989–1999–2009) * | Based on Reported Trend in Urban Master Plan |
* When estimating the urban area of the target year, we used land cover maps prepared by the South Korean Ministry of Environment using LANDSAT satellite imagery from 1989, 1999, and 2009.
Table 2.
Protected zones excluded from the simulation of urban growth from green belt release: we excluded ecological, water and other protected zones when estimating future urban areas and the probability of conversion into urban lands, because it is difficult to alter a land category within protected zones due to the restriction on property rights and activities based on the relevant law.
| Ecological Environment | Water Environment | Other Environment |
|---|---|---|
|
|
|
* Vital Mountain Range of South Korea.
Table 3.
Construction of thematic maps via driving factors to determine the urbanization: based on the literature review, we selected factors affecting the conversion of non-urban land into urban land in terms of topography, economy, society, and environment, and constructed thematic maps as raster data.
| Driving Factor | Raw Data | Method | |
|---|---|---|---|
| Topography | Elevation | DEM | Construction of Elevation from DEM |
| Slope | DEM | Construction of Slope from Elevation | |
| Distance from River | Stream Order Map | Calculation of Euclidean Distance from Rivers | |
| Economy | Production Amount | Statistics Annual Report | Assignment of 1st, 2nd, and 3rd Industrial Production Amounts to Agricultural/Industrial/Commercial lands |
| Land Cover Map (Middle Level) | |||
| Distance from Transportation Facility | Land Cover Map (Middle Level) | Calculation of Euclidean Distance from Transportation Lands | |
| Society | Population Density | Statistics Annual Report | Assignment of Population Density to Residential Lands |
| Land Cover Map (Middle Level) | |||
| Distance from Public Facility | Land Cover Map (Middle Level) | Calculation of Euclidean Distance from Public Lands | |
| Distance from Cultural Facility | Land Cover Map (Middle Level) | Calculation of Euclidean Distance from Cultural, Sport, and Recreational Lands | |
| Environment | Soil | Soil Map | Reclassification by Soil Drainage Class * |
| Forest | Forest Map | Reclassification by Forest Age Class ** | |
| Ecology | Ecological and Natural Map | Reclassification by Ecological and Natural Class *** | |
* Soil Drainage Class: 1st class (very well), 2nd class ((very) well), 3rd class (well), 4th class (normal), 5th class (poor), 6th class (very poor), 7th class (exposed rock). ** Forest Age Class: 1st class (1–10 years old), 2nd class (11–20), 3rd class (21–30), 4th class (31–40), 5th class (41–50), 6th class (51–60), 7th class (61–70), 8th class (71–80), 9th class (81–90), 10th class (91–100). *** Ecological and Natural Class: 1st class (major habitat; major ecological axis; spectacular scenery; abundant biodiversity), 2nd class (worthy of conservation in the future; buffer for 1st class zone for the protection of a 1st class zone), 3rd class (all others; suitable for development or utilization).
Table 4.
Linear equation and estimated urban area for each scenario: we calculated the future urban areas by adding urban areas in protected zones to values to be estimated from the linear equations or to be cited from the urban master plan.
Table 4.
Linear equation and estimated urban area for each scenario: we calculated the future urban areas by adding urban areas in protected zones to values to be estimated from the linear equations or to be cited from the urban master plan.
| Scenario | Linear Trend Equation | Urban Area (Including Urban Area of Protected Zones) | ||||
|---|---|---|---|---|---|---|
| 1989 | 1999 | 2009 | 2020(25) | |||
| Jeju | SCN 1 | y = 2.19x − 4290.39 ( = 1.00 *) | 69.39 | 88.86 | 98.89 | 146.20 |
| SCN 2 | y = 1.44x − 2788.77 ( = 0.95) | 125.81 | ||||
| SCN 3 | - | 178.11 | ||||
| Chuncheon | SCN 1 | y = 0.68x − 1345.12 ( = 1.00 *) | 11.87 | 15.86 | 26.04 | 19.64 |
| SCN 2 | y = 0.44x − 861.58 ( = 0.93) | 28.99 | ||||
| SCN 3 | - | 43.98 | ||||
* SCN 1 is the scenario considering the trend of urban expansion at the time of urban growth control via the designation and maintenance of the green belts, and the urban area of SCN 1 was derived by the following process: (1) calculating areas of urban lands to be extracted from land cover maps of 1989 and 1998, (2) deriving the linear equation between areas of two periods, (3) inputting the target year into the linear equation and deducting the urban area at the target year. Therefore, R2 of the linear equation is 1.00.
Table 5.
Coefficients and constants based on the logistic regression analysis of the conversion into urban land; we obtained coefficients and constants for each driving factor contributing to the conversion of non-urban land into urban land by performing binary logistic regression analysis on systematic random sampling data (p < 0.05).
| Item | Jeju | Chuncheon | ||||
|---|---|---|---|---|---|---|
| SCN 1 | SCN 2, 3 | SCN 1 | SCN 2, 3 | |||
| Coefficient | Elevation | −0.0003 | 0.0004 | −0.0079 | −0.0027 | |
| Slope | 0.0031 | −0.0005 | - | −0.0089 | ||
| River | −0.0001 | −0.0001 | 0.0009 | −0.0004 | ||
| Population Density | 0.0187 | 0.0313 | 0.0117 | 0.0109 | ||
| Public Facilities | −0.0006 | −0.0004 | −0.0004 | −0.0002 | ||
| Cultural Facilities | −0.0001 | −0.0001 | - | −0.0001 | ||
| Production Amount | 0.0003 | 0.0004 | 0.0004 | 0.0005 | ||
| Traffic Facilities | −0.0013 | −0.0021 | −0.0014 | −0.0017 | ||
| Land Cover | Water | −1.2475 | −0.4934 | −0.6369 | −0.7078 | |
| Urban Land | - | - | - | - | ||
| Barren Land | 0.7086 | 1.2794 | 1.4004 | 1.7318 | ||
| Wetland | 0.2250 | 3.0034 | 21.5742 | - | ||
| Grassland | −0.8611 | −1.0632 | 0.9838 | 0.2797 | ||
| Forest Land | −0.8811 | −1.0400 | −0.1193 | −0.1090 | ||
| Agricultural Land | - | - | - | - | ||
| Soil Drainage Class | Very Well | - | - | 0.9563 | −0.9589 | |
| (Very) Well | 0.2890 | 0.4902 | 0.4139 | −1.9050 | ||
| Well | 0.6968 | 0.0033 | 0.9169 | −0.7887 | ||
| Normal | - | - | 1.4265 | −0.7833 | ||
| Poor | 0.3731 | 0.3299 | 0.9357 | −0.6466 | ||
| Very Poor | 0.3328 | −0.0479 | - | - | ||
| Exposed Rock | - | - | - | - | ||
| Forest Age Class | 1st Class | −2.5156 | 2.2282 | 16.8759 | −21.2623 | |
| 2nd Class | −0.5642 | 0.8666 | 15.1851 | −0.6532 | ||
| 3rd Class | −0.2923 | 0.1544 | 15.7588 | −0.4955 | ||
| 4th Class | 0.0600 | 0.0748 | 16.5151 | −0.9146 | ||
| 5th Class | 0.3716 | 0.1450 | 15.2279 | −0.5156 | ||
| 6th Class | 0.3387 | −0.2757 | 15.4118 | −0.6132 | ||
| 7th Class | - | - | - | - | ||
| Ecological and Natural Class | 1st Class | −2.6659 | −1.4699 | −2.3240 | −0.7857 | |
| 2nd Class | −0.7273 | −0.4247 | −1.8046 | −0.3780 | ||
| 3rd Class | −1.0542 | −0.3806 | −1.8881 | −0.4549 | ||
| Constant | 1.2022 | 1.1127 | −15.1472 | 3.6239 | ||
Table 6.
Land cover change and living environment change in Jeju; we proved quantitatively the effect of the release of green belts within Jeju through the prediction of the urban expansion and the simulation of the urban living environment based on the interactions among land cover, climate, and air quality.
| Land Cover (km2) | Surface Temperature (°C) | Atmospheric Concentration (g/m2) | ||||||||||
|---|---|---|---|---|---|---|---|---|---|---|---|---|
| Urban Land | Agri. Land | Forest Land | Grass Land | Wet Land | Barren Land | Water | Released Region | Down Town | Released Region | Down Town | ||
| 1989 | 69.39 | 379.32 | 924.93 | 466.55 | 0.59 | 7.83 | 37.12 | - | - | - | - | |
| 1999 | 88.86 | 394.12 | 1035.46 | 322.08 | 0.39 | 15.10 | 29.17 | - | - | - | - | |
| 2009 | 98.89 | 819.76 | 649.29 | 271.38 | 0.38 | 15.34 | 31.29 | - | - | - | - | |
| 2025 | SCN 1 | 146.20 | 357.19 | 1018.29 | 321.28 | 0.39 | 12.67 | 29.16 | 31.45 | 32.47 | 2.67 × 10−07 | 4.42 × 10−06 |
| SCN 2 | 125.81 | 799.28 | 646.96 | 270.40 | 0.38 | 12.33 | 31.17 | 31.71 | 32.63 | 8.70 × 10−07 | 4.33 × 10−06 | |
| SCN 3 | 178.11 | 762.07 | 637.81 | 265.98 | 0.38 | 10.81 | 31.17 | 31.45 | 32.36 | 9.53 × 10−07 | 4.51 × 10−06 | |
Table 7.
Land cover change and living environment change in Chuncheon; we proved quantitatively the effect of the release of green belts within Chuncheon through the prediction of the urban expansion and the simulation of the urban living environment based on the interactions among land cover, climate, and air quality.
| Land Cover (km2) | Surface Temperature (°C) | Atmospheric Concentration (g/m2) | ||||||||||
|---|---|---|---|---|---|---|---|---|---|---|---|---|
| Urban Land | Agri. Land | Forest Land | Grass Land | Wet Land | Barren Land | Water | Released Region | Down Town | Released Region | Down Town | ||
| 1989 | 11.87 | 114.04 | 908.59 | 16.28 | 0.05 | 8.66 | 56.04 | - | - | - | - | |
| 1999 | 15.86 | 106.33 | 907.47 | 23.97 | 0.12 | 10.19 | 51.58 | - | - | - | - | |
| 2009 | 26.04 | 102.79 | 915.78 | 13.81 | 0.14 | 7.09 | 49.85 | - | - | - | - | |
| 2020 | SCN 1 | 19.64 | 105.03 | 906.10 | 23.51 | 0.12 | 9.54 | 51.58 | 31.02 | 33.37 | 2.95 × 10−08 | 3.50 × 10−05 |
| SCN 2 | 28.99 | 101.01 | 915.29 | 13.51 | 0.14 | 6.72 | 49.84 | 31.03 | 34.34 | 1.28 × 10−07 | 3.71 × 10−06 | |
| SCN 3 | 43.98 | 90.05 | 912.64 | 12.79 | 0.14 | 6.06 | 49.84 | 31.03 | 34.41 | 1.29 × 10−07 | 4.64 × 10−06 | |
© 2018 by the authors. Licensee MDPI, Basel, Switzerland. This article is an open access article distributed under the terms and conditions of the Creative Commons Attribution (CC BY) license (http://creativecommons.org/licenses/by/4.0/).
Share and Cite
MDPI and ACS Style
Jeon, S.; Hong, H.; Kang, S. Simulation of Urban Growth and Urban Living Environment with Release of the Green Belt. Sustainability 2018, 10, 3260. https://0-doi-org.brum.beds.ac.uk/10.3390/su10093260
AMA Style
Jeon S, Hong H, Kang S. Simulation of Urban Growth and Urban Living Environment with Release of the Green Belt. Sustainability. 2018; 10(9):3260. https://0-doi-org.brum.beds.ac.uk/10.3390/su10093260
Chicago/Turabian StyleJeon, Seongwoo, Hyunjung Hong, and Sungdae Kang. 2018. "Simulation of Urban Growth and Urban Living Environment with Release of the Green Belt" Sustainability 10, no. 9: 3260. https://0-doi-org.brum.beds.ac.uk/10.3390/su10093260
Note that from the first issue of 2016, this journal uses article numbers instead of page numbers. See further details here.