Microclimatic Volatility and Elasticity of Glacier Skiing Demand


1
Institute of Geography and Geology, University of Greifswald, 17489 Greifswald, Germany
2
Department of Geography and Economic History, Umeå University, 901 87 Umeå, Sweden
3
Department of Economics, Istanbul University, 34452 Istanbul, Turkey
*
Author to whom correspondence should be addressed.
Sustainability 2018, 10(10), 3536; https://0-doi-org.brum.beds.ac.uk/10.3390/su10103536
Submission received: 12 September 2018
/
Revised: 28 September 2018
/
Accepted: 28 September 2018
/
Published: 1 October 2018
(This article belongs to the Special Issue Sustainable Winter Tourism in Changing Climate)
Abstract
:The effects of climate conditions and weather on ski tourism have become a hot topic as the negative impacts of climate change on ski tourism become increasingly visible. This study aims at measuring the significance and magnitude of long-term diurnal and daily weather conditions on lift frequentation at an Austrian glacier ski area in terms of the winter and the summer skiing offers. In doing so, it utilizes an autoregressive conditional heteroskedasticity (ARCH) model to reveal and quantify any volatility associated with ski area visitation and then employs regression models to account for any microclimatic elasticity of glacier skiing demand. The main findings reveal a significant volatility in ski area visitation, especially during the summer seasons. While this study does not aim for an ultimate determination on the reasons for such volatility, skiing demand models illustrate the importance of thermal comfort, especially wind chill factor (WCF), as a major determinant of demand sensitivity for glacier skiing as well as non-skier visits during the summer season. Significant, albeit inelastic, relationships between other microclimatic characteristics, such as snow depth and relative humidity, with visitation and lift frequentation are also identified. Based on these findings, implications according to a changing climate and practical suggestions on the sustainability of winter and summer skiing activities are provided.
1. Introduction
The effects of short term weather and long-term climate conditions on ski area/resort/destination performances have been a hot topic over the last two decades [1,2,3], especially as the impacts of climate change on ski businesses are becoming increasingly visible. Since the 19th century, increases in anthropogenic greenhouse gas (GHG) emissions have contributed to a global temperature rise and a consequent decline in the depth and the duration of snow cover [4]. Such physical change has already had its impacts on the highly snow-dependent ski tourism sector [5,6,7,8,9], and more are anticipated throughout the 21st century [10,11] alongside various representative concentration pathways (RCPs) that indicate different magnitudes on the change [4]. Ski tourism as an outdoor recreation activity is also sensitive to intra- and inter-annual climate variability, besides climate change, of not only the most essential snow cover but also other climate elements such as temperature and wind [12,13]. In that sense, empirical studies on the relationship of climate elements with skiing demand provide science, policy, and industry with crucial information on the sustainability of the sector [14].
In a changing climate, high altitude glacier ski areas are regarded as the final frontiers to sustain winter sports [15,16]. Additionally, they are also the few unique venues of the global ski tourism industry in offering a year-round ski activity extended to the summer seasons [17,18]. This study aims for measuring the long-term effects of weather conditions on the visitation and lift frequentation of such a glacier ski resort in Austria in terms of elasticity and volatility in order to account for any associated demand sensitivity and variability for both the winter and the summer offers. In doing so, we contribute to the knowledge on the relationship between the microclimatic characteristics and the business performance of glacier ski areas and analyze the impact of multiple weather variables on summer skiing demand in the Alps for the first time. We also provide methodological contributions by, firstly, utilizing climate data of highest temporal resolution (10 min), used for the first time in climate and ski tourism research, to account for the more relevant diurnal, rather than the daily effects, and secondly, by introducing the use of the (generalized) autoregressive conditional heteroskedasticity (ARCH/GARCH) model in understanding climate variability based volatility of ski tourism demand.
2. Background
The relationship of weather and climate with ski area/resort/destination performance had been reported in a total of 22 papers at the time of the preparation of this manuscript. These studies provide us with statistical and econometric models for France [19], Switzerland [20], Austria [21,22,23,24], Italy [25], Germany, and Slovenia in the Alps [26], Sweden [27,28], Norway [29], and Finland [30,31] in Nordic Europe [26], Czechia, Slovakia [32], and Romania [33,34] in Eastern Europe [26], Spain in Western Europe [26], the USA [13,35,36,37], Australia [6], and Japan [38].
Japan is one of the largest ski destinations in the world, albeit characterized by a continuous decline in skier visits since the 1990s despite the relative recovery in other mature markets [39]. In their pioneering study [38], Fukushima et al. compared observed and derived daily snow depth data with skier visits at one ski area in Central Japan and six others in the Tohoku region in the north for the period 1988–1996. This analysis included factors such as the decline in ski-interested populations, population aging, economic recession, and the calendar effects of weekends and holidays. Snow depth was confirmed as a positive influence factor of the ski area visits. Likewise, a similar pattern was also found for snow cover and visitation to six Australian ski areas [6], but this time acknowledging the partial offsetting effects of snowmaking.
In the USA, Englin and Moeltner [35] studied college ski trips from Nevada to 13 different ski resorts and quantified the impact of snowfall on visitation by estimating the “snow elasticity of demand” as 0.21. Hamilton et al. [36] carried out analyses on the relationship of daily weather conditions at both the destinations and the origins and skier visits for seven to nine seasons at two ski areas in New Hampshire. They concluded that snow depths and snow conditions in the ski resorts and the source market in Southern New Hampshire and Massachusetts significantly increase the number of skiers with a one-day delay, the latter finding confirming the so-called “backyard” hypothesis. The demand for ski tourism is thus influenced not only by the weather conditions in the ski area but also by those of the residence of the skiers. Shih et al. [13] examined two other ski areas in Michigan and revealed significant positive effects of snow depth and wind chill and negative effects of temperature on skier visits but no relationship with snow depths and snowfall conditions at the “backyards.”
In Europe, Damm et al. [26] realized a pan-continental study that investigates the effects of changes in naturally skiable days, defined, under the term “snow index,” as the proportion of days per month with at least 120 mm snow water equivalent (SWE), on overnight stays in the NUTS-3 regions. The results showed that a one standard deviation change in the snow index would lead to up to a 15% change in the overnight stays, with the highest impact measured for Italy.
In Central Europe, Damm et al. [26] found no significant relationship between the snow index and overnight stays in Czechia but a positive relationship with a magnitude of 3–6% in Slovakia, whereas Demiroglu et al. [32] also revealed significant relationships between daily snow depth, visibility, and temperature and skier visits to a particular Slovak ski area, with the snow depth elasticity as high as 1.2, implying that the demand is positively and highly sensitive to changes in snow cover. Temperature, on the other hand, was a negative regressor, as lower temperatures implied a higher snow depth. In Romania, Surugiu et al. [33,34] found out that a 1 °C increase in temperature and a 1 cm decrease in snow depth would reduce the hotel occupancy rates by 1.3 and 0.13% and the number of visitors by 322 and 46 people, respectively, at Predal ski resort, whereas a 1 cm decrease in snow depth and a 1 day decrease in skiable (snow depth > 30 cm) days would reduce the overnight stays by 38 and 71, respectively, but a 1 °C increase would generate 79 additional stays at Sinaia ski resort. The unexpected result for the latter was explained by the diversified offer of the resort beyond the winter sports tourism products.
In Nordic Europe, several recent studies [27,28,29,30,31] provided findings for a traditional, yet under-researched, ski tourism region. In Finland, snow depth was revealed to be a major estimator for ski lift revenues by Falk and Vieru [30], but the sensitivity turned out to be minimal in the north, partly confirming the insignificance of SWE levels on overnight stays as identified by Damm et al. [26]. The same study also reports that early snowfall had positive impacts on ski lift revenues for the whole season, and a positive impact was also confirmed for accommodation demand for the Lapland region from the neighbors Sweden and Russia [31]. In Sweden, similar results were reached, such that early season snowfall led to increased skier visits [27]. However, it was also found out later that the dependence of ski lift revenues on snow depth has been on a decline since the 1980s, especially because of the diffusion of snowmaking systems [28]. In Norway, analysis for one ski resort [29] revealed a wind chill temperature of −9.5 °C as a critical threshold, above which a temperature increase had negative effects on visitation whereas an opposite trend was detected during too cold days.
In the Alps, where 39% of world ski lift supply is present and 43% of global skier visits take place [39], various studies, besides the pan-European one by Damm et al. [26], were carried out on the effects of weather conditions on ski area/resort/destination performance. In Switzerland, Gonseth [20] identified natural snow depth and sunshine as positively correlated significant estimators for skier visits. She also revealed that better snow conditions at ski areas in lower altitudes would reduce the visitation at the ones in higher altitudes. The importance of snowmaking was also acknowledged, such that an increase from 30 to 50% in the snowmaking coverage of ski runs was deemed to be able to compensate for a 42% increase in the natural snow conditions’ variability. In France, Falk [19] underlines the long-term significance of snow depth on skier visits at high altitude ski resorts, but also showed that the detractive effect of a season with weak natural snow cover on skier visits could be as marginal as 2.5%. In South Tyrol, Italy, Falk and Lin [25] discovered that temperature increases lead to decreases in accommodation arrivals, yet are on a declining trend over the long term, once again indicating the restoring effects of snowmaking systems [20,28].
In Austria, which is the scope of this study and the top international ski destination [39] where travel and tourism revenues have total direct contributions of 7.6% to the gross domestic product (GDP) as of 2015 [40], early works [21,22], based on long-term panel data for nationwide ski resorts, revealed that the sensitivity of accommodation demand to snow depth is inelastic (0.1) and almost none, and even negative at times due to spatial substitution towards the high-altitude resorts, whilst the domestic market showed more sensitivity to snow depth and sunshine change, compared to the foreign market.
Despite the declining dependence on natural snow cover and the sustained performance of ski areas/resorts/destinations, especially due to early adoption of snowmaking systems [23], future projections indicate that even the so-called “technical snow reliability” may not suffice to justify future operations at some of the Austrian ski areas [41], mainly due to the technical (requirement for cold and dry weather conditions), financial (installation, energy, and labor costs), and environmental (water consumption) limits to snowmaking [42,43,44]. Indeed, such projections have already started to come alive, e.g., during the anomalously warm ski season of 2006–2007, recorded as the warmest season in Europe in the last 500 years then [45], when mostly the low-lying ski areas suffered from visitation and revenue losses of up to 33 and 22%, respectively, and the high-altitude areas registered a 4% growth in lift ticket sales, despite a seasonal shrinkage of 5% in Tyrol [7].
The comparative advantage of high-altitude ski areas in sustaining winter tourism was already noted by König and Abegg [16] as early as 1997, when they referred to glacier ski areas in Switzerland. However, they also stressed a decline in the original core summer skiing offer of these ski areas due to climate change as well as changing consumer preferences. In the Alps [18,46,47,48], the negative impacts of climate change, along with socioeconomic reasons, has reduced the number of summer skiing areas from 46 to 15 already by the 2010s. In Austria, an analysis based on long-term data for 12 lifts at six glacier ski areas [24] showed that the performance of these aerial lifts was indeed positively sensitive to the changes in the May–September snow depth, especially at the upper terrain, even though it was not differentiated between actual summer skier frequentation and pedestrians. Therefore, although high-altitude ski areas may be regarded as the safeguards of an economically sustainable winter skiing tourism [15,17], still more micro-level analyses are essential for a better understanding of the phenomena and change and their overall vulnerability.
As evident in the state of the art research on climate and skiing relationship, most models, so far [6,13,19,20,21,22,23,24,25,26,27,28,29,30,31,32,33,34,35,36,37,38], have utilized indicators based on weather and climate variables such as snow depth, snow water equivalent, snowfall, snow density, avalanche index, temperature, wind chill, visibility, and cloudiness as the main regressors, whereas other variables such as precipitation (rain, freezing rain, etc.) and wind speed have also been mentioned as important in consumer surveys with winter [49] and summer [50] skiers. Additionally, many studies, especially those based on long-term aggregate data [13,19,21,24,25,26,27,28,31,37], have attempted to control for changes in economic variables such as income, consumer prices, gas and airfare prices, exchange rates, unemployment rates, and changes in ski tourism supply in question. Regarding the calendar effects, especially in models with daily data [13,26,27,31,32,36], dummy variables have been inserted to identify peak times from weekends, holidays such as Christmas, New Year, and Easter, and school breaks at the market origins. As for the dependent variables that represent the ski area/resort/destination performance, lift transports [24], skier visits [6,19,20,32,36,37,38], lift ticket revenues [27,28,31], closures [23], and foreign and domestic accommodation arrivals, overnight stays, and occupancy rates [21,22,25,26,31,33,34] have been the main indicators. Most studies have utilized regression models in estimating the effects based on these variables, and more recently autoregressive models have been in use [19,24,25,26,28,31,36] to analyze the possible impacts of past dynamics of observations on current values of the data.
In this study, we aimed to measure the effects of long-term diurnal weather conditions on the visitation and lift frequentation of a year-round, high-altitude glacier ski area in Austria in terms of elasticity and volatility in order to account for any associated demand sensitivity and variability for both the winter and the summer offers. In doing so, we contribute to the knowledge on the relationship between the microclimatic characteristics and the business performance of glacier ski areas. We also provide methodological contributions by firstly utilizing climate data of ultra-high temporal resolution to account for the more relevant diurnal, rather than the daily, effects, and secondly introducing the use of the (generalized) autoregressive conditional heteroskedasticity (ARCH/GARCH) model in understanding the climate-variability-based volatility of ski tourism demand. Details on the study site, data, and model specifications are provided in the next section.
3. Empirical Model and Data
The study site is one of the first Austrian glacier ski resorts, located in the federal state of Salzburg, and has been a role model for many other glacier ski area developments due to its immediate success and state-of-the-art environmental management. It is one of the easternmost glacier ski areas of the Alps, with good accessibility to major source markets in Austria and Germany. By generating almost a million visits per year at best, it has a very strong economic relevance for its region, where (ski) tourism is a top sector with 2.72 million overnight stays in 2017 [51].
The ski area has a lift system situated within a 2100 m vertical drop. Skiing activity is only possible within the top 1000 vertical meters and summer skiing is usually possible on the shrinking glacier above 2600 m, and, in contrast to almost all seasons from the late 1960s onwards, nowadays suspended from late July until the first large snowfalls in autumn, following the negative climate change impacts during the recent seasons. No skiing is possible in the bottom half of the lift system, so the skiers need to take one of the two cable-cars available to return to the base station. Additionally, lift services of the resort are increasingly popular among non-skiers, especially due to the panoramic viewpoints at its top station where pedestrians can experience snow and ice all year around. The edutainment offer includes a so-called National Park Gallery in cooperation with the bordering Hohe Tauern National Park [48]. The resort has received substantial investments for snowmaking, lifts, and non-ski attractions throughout its existence. This study takes account of the facility conditions valid for the period from 1 November 2005 to 30 April 2013, for which the data on lift frequentation and in-situ weather conditions were generously provided by the ski area operator.
The frequentation data is based on daily up- and downhill transports per aerial lift and uphill transports per surface lift typical for glacier ski resorts. A critical dependent variable is created by a summation of the uphill transports from the two feeder gondolas, which are the main points of lift ticket sales for the ski area. The values of this variable, termed as “first entries” (FE), indicate the number of total single daily visits to the area. The “total frequentation” (TF) variable, in contrast, reflects the overall frequency of all the uphill and the downhill lift transports during a day, whereas the values for the “glacier lifts” (GL) variable is derived by adding up all surface lifts on and around the glacier plateau (GP) with the uphill transports for the two connecting chairlifts in order to create a proxy variable for the number of ski runs. Last, the number of “non-skiers” (NS), e.g., the sightseeing pedestrians, are estimated by treating the downhill transports of a major cable-car that carries visitors back from the summit station at 3000 m to the summer skiing base station (BS), which functions as the skiing mid-station during the winter season. It is assumed that this service is mainly utilized by the non-skiers if the ski-run to BS is open. However, for days with summer ski operation and closed return run to BS, this variable is not valid. Therefore, these NS values are a rough approximation. All variables are used along the whole study period with 2738 observations each.
The weather data is based on records by one lower automatic station at the BS for the study period and another at the GP, which was only active from 11 January 2008 onwards. At both stations, observations with 10 min intervals were available for snow depth (SD), temperature (T), and relative humidity (RH) variables. Wind speed (V) observations were available at the BS, whereas a third station in close vertical and horizontal proximity to the GP did provide wind speed observations, of the same frequency, to be used as a proxy for the upper zone. Each variable consisted of 394,272 observations at the base area and 236,592 observations at the glacier area, including the negligible share of missing values.
Following a quality check on corrupted values, the in-situ weather data were further converted into aggregations and indicators that are more relevant to ski tourism. Snow depth, temperature, relative humidity, and wind speed were aggregated to their diurnal averages, based on the operating hours of the ski area from 9:00 a.m. to 16:00 p.m. Temperature and wind speed were then combined into the thermal comfort indicator, the “wind chill factor” (WCF), according to Formula (1):
where WCF is the wind chill factor in degrees Kelvin, T is the temperature in degrees Kelvin, and V is the wind speed in m/s [52].
WCF = 306.15 + (0.453843 × V0.5 + 0.464255 − 0.0453843 × V) + (306.15 − T)
In order to treat the variables within a lift usage demand model [28,32], logarithmic conversions were applied for the continuous variables, whereas the percentage-based RH variable was maintained in its fractional form. Regarding the independent SD variable as well as the dependent FE, TF, GL, and NS variables, a value of 1 was substituted for null values to correspond to a value of 0 after transformation, following [53]. For the temperature derivative WCF, the original T values were initially converted into Kelvin units to eliminate null and negative values prior to logarithmic standardization. As a result, the ultimate variables to be used as inputs to elasticity analyses were listed as lSD, lWCF, and RH on the independent side, and lFE, lTF, lGL, and lNS on the dependent side.
As a final step before the volatility and the elasticity model specifications, a temporal filter was applied to the data series in order to distinguish the winter and the summer skiing seasons as “November 1–April 30” and “May 1–October 31” (the broader summer ski definition according to [18]), respectively. Regarding volatility assessments, an autoregressive conditional heteroskedasticity (ARCH) model, which is a widely used econometric approach when “the volatility of returns is a central issue” ([54], p. 161), was applied on the main sales performance proxy, FE, in order to identify significance and magnitude of any variation across the two distinct seasonal series. The elasticity models were also based on the two seasonal series and further distinguished by weather conditions at the lower (BS) and the higher (GP) terrains of the ski area. Here, given that the participating variable time series are standardized within percentages or logarithms, the resulting significant model coefficients were treated as elasticity (e) indicators, where e < 1 denotes inelasticity and e > 1 reflects elasticity, i.e., demand (in)sensitivity to the microclimatic characteristics.
In this study, we employ several regression models that incorporate the role of many variables as dependent variables, i.e., lFE, lTF, lGL, and lNS. Here we also deal with a possible conditional heteroscedasticity problem via ARCH/GARCH type of models, whilst the problem may persist due to the usage of daily data. In order to specify the appropriate type of econometric or time-series models, unit root or stationary properties of the series planned to be included in the models needed to be determined. For this purpose, various unit root tests can be employed, while we used the Augmented Dickey-Fuller (ADF) test, which depends on the estimation of a regression model. More specifically, the model can be written with different deterministic variables and the following equation reveals the widest form of the model:
In Equation (2), denotes the first differenced series like and thus refers to the number of lagged differences. The ADF does not always need to include the constant and trend terms, while and refers to the constant and trend terms of the model, respectively. Finally, represents the coefficient of and denotes the residuals of the model. Results of the ADF test related to the series intended to be included into empirical exercise can be provided upon request, while the test results do not interfere with the elasticity analyses.
As for the empirical analysis, we depart from a multiple linear regression model as written below:
where refers to the intercept terms of the regression model, and denotes the error term of the relevant regression model. The coefficients of independent variables () are . The robustness of models is closely related to the significance of the coefficients, and the removal of the autocorrelation problem is also important for the model. All variables used in the empirical exercise can be treated as stationary in levels using various unit root tests and unit root tests’ results are not presented to save space. In this respect, autocorrelation tests can be applied to a single time series, and partial autocorrelation function (PACF) and autocorrelation function (ACF) orders can thus be determined. However, this technique cannot easily be applied to models where the relationship among several variables is studied. More specifically, a common autoregressive (AR) and moving-average (MA) orders cannot be determined for all variables. Accordingly, we performed the Cochrane–Orcutt procedure for dealing with the low Durbin–Watson stats. The Cochrane–Orcutt procedure, which can be summarized as below, was performed:
where is . Equation (5) was thus obtained:
The Cochrane–Orcutt procedure was conducted by multiplying Equation (5) by and subtracting the result from Equation (3). Accordingly, Equation (6) constitutes our final elasticity model specification in the study. The procedure was ultimately applied by specification of the first order autoregressive process term, AR(1), in the elasticity model equations estimated on the EViews 10 platform.
4. Results
4.1. Volatility of Glacier Skiing Demand
The number of first entries (FE) to the ski area reflects the numbers of single visits and sold lift tickets (except season tickets). During the study period of 1 November 2005 to 30 April 2013, the total figure for this variable was realized as 6.4 million, with average visitations of 650,831 (SD: 82,838.1) and 173,951 (SD: 18,032.3) for the winter (78.9%) and the summer seasons (21.1%), respectively. The summer season share of more than a fifth is relatively high for ski areas. During the study period, the first entries in the summer season increased by 31.1%, while the winter season FE shows a stable overall trend with considerable variations over the years reflecting the snow conditions especially in lower altitude ski resorts. For instance, the extremely warm winter 2006/07 [47] led to an FE increase of 28.4% compared to the relatively cold and rich in snow winter 2005/06.
Whilst the estimated share of non-skiers/pedestrians in first entries remains at 6% during the winter seasons, it rises to as high as nearly 57% during summers (excluding the summer of 2006 with continuous summer ski operation which makes the pedestrian share estimation impossible). However, as the summer season per definition also includes May (12.8% non-skiers) and October (23.9% non-skiers), where glacier skiing leads to relatively high numbers of first entries, it is obvious that the share of pedestrians in the high summer season of July (two-thirds non-skiers) and August is much higher and obviously even reaches 100% if summer ski operation is suspended (which was the case for each summer season after 2006).
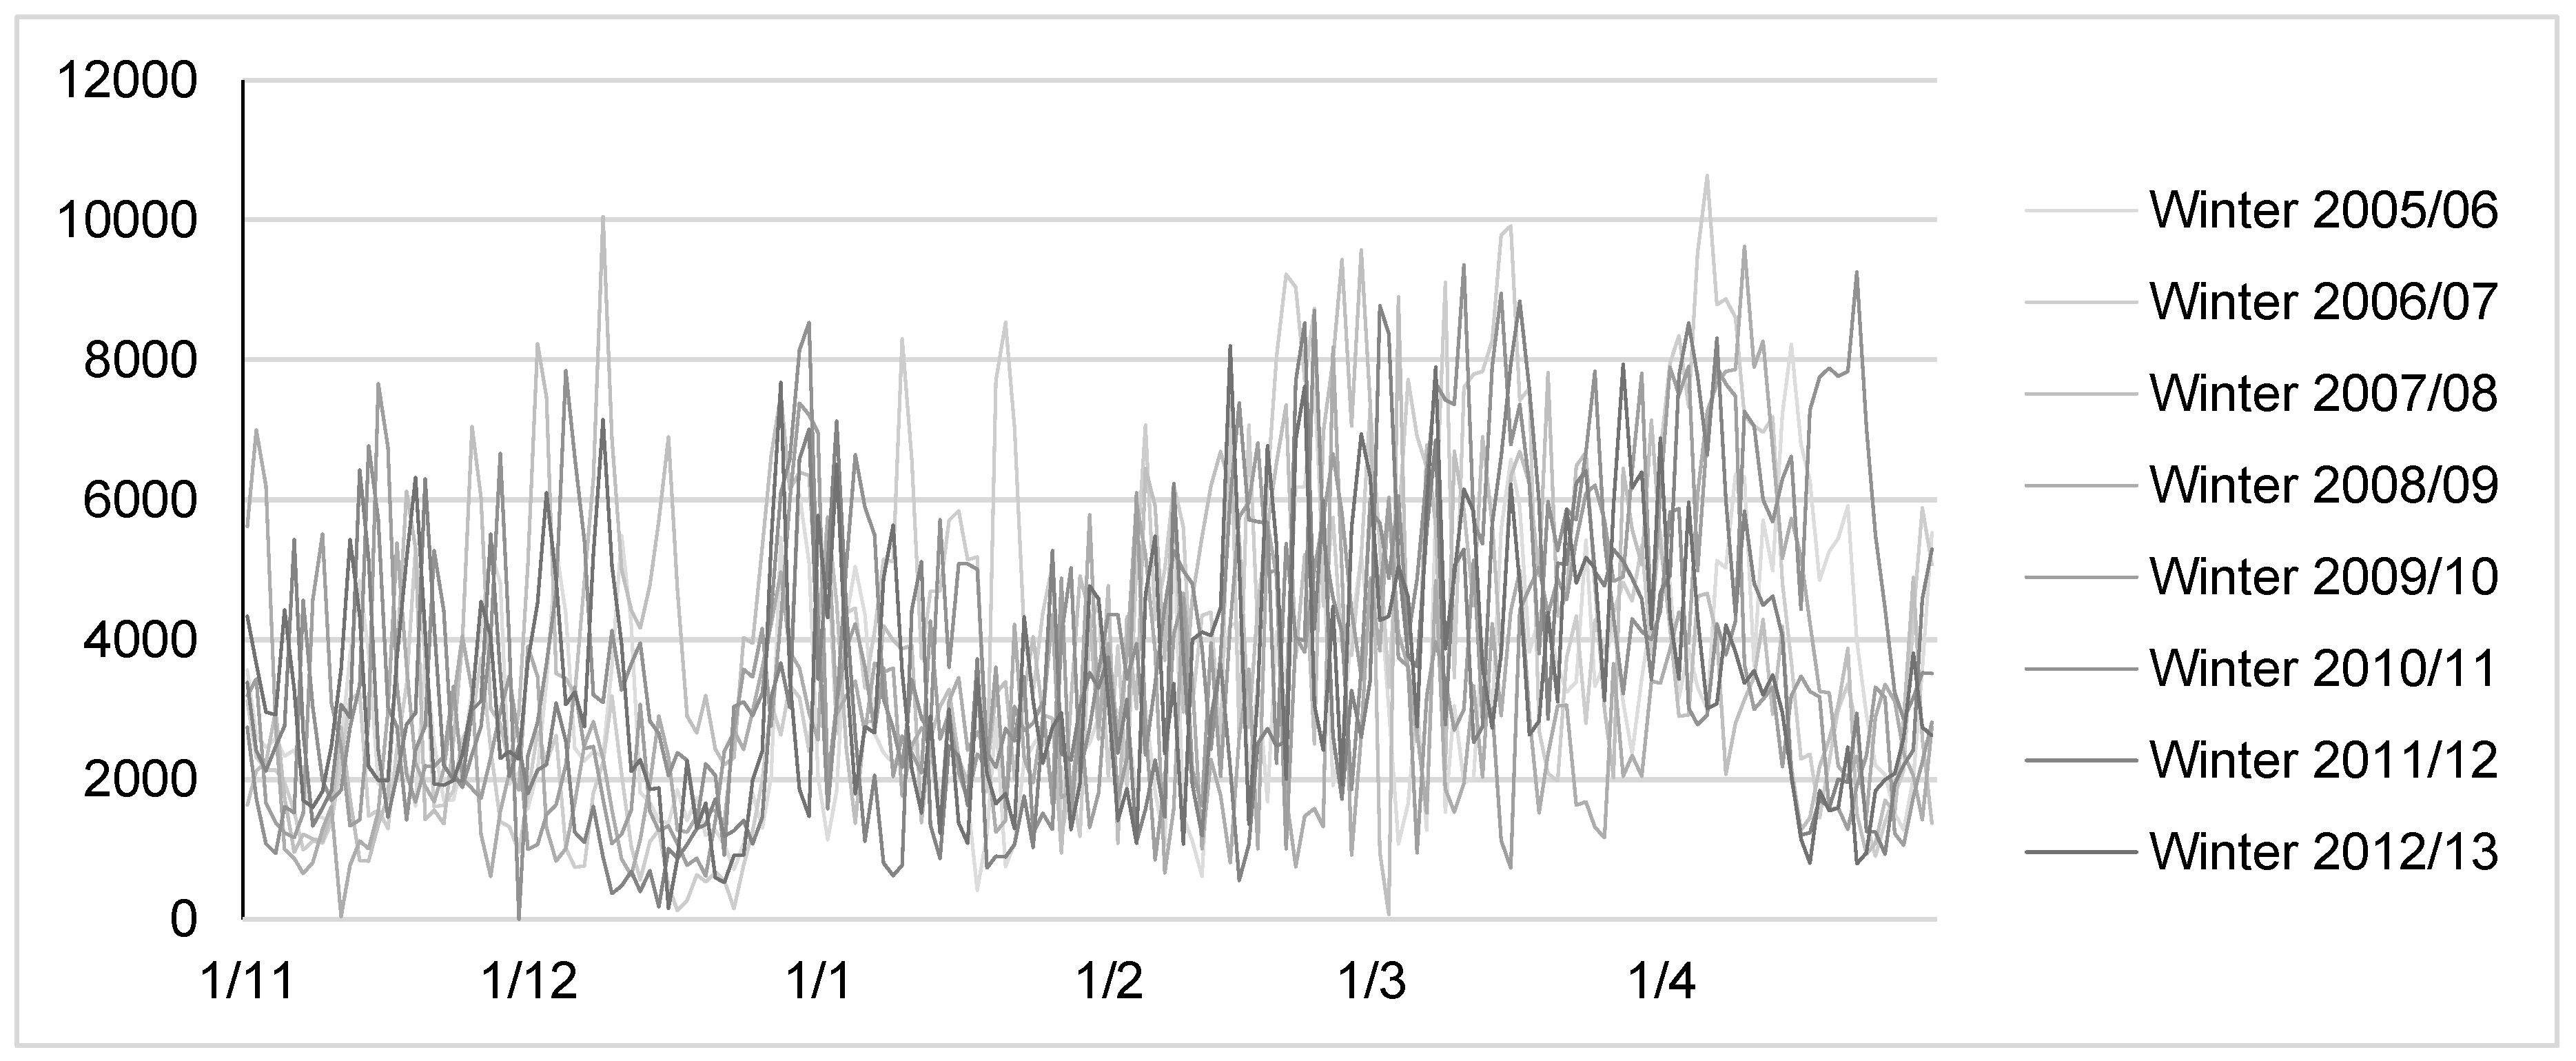
The variation of winter first entries is quite complex to illustrate verbally (Figure 1): Skiing demand is usually high in November and the first half of December due to the unique selling proposition of the glacier ski resort. A demand drop around the Christmas holidays is followed by the very busy second half of the Christmas school vacation. The second half of January is characterized by the so-called “January hole” typical for ski destinations in Austria. The longest demand peak begins in the second half of February and lasts about two months with a sharp demand decline in the second half of April, except for years with very late Easter holidays and vacations. The winter season then finishes with a last demand peak on the long weekend around the first of May.
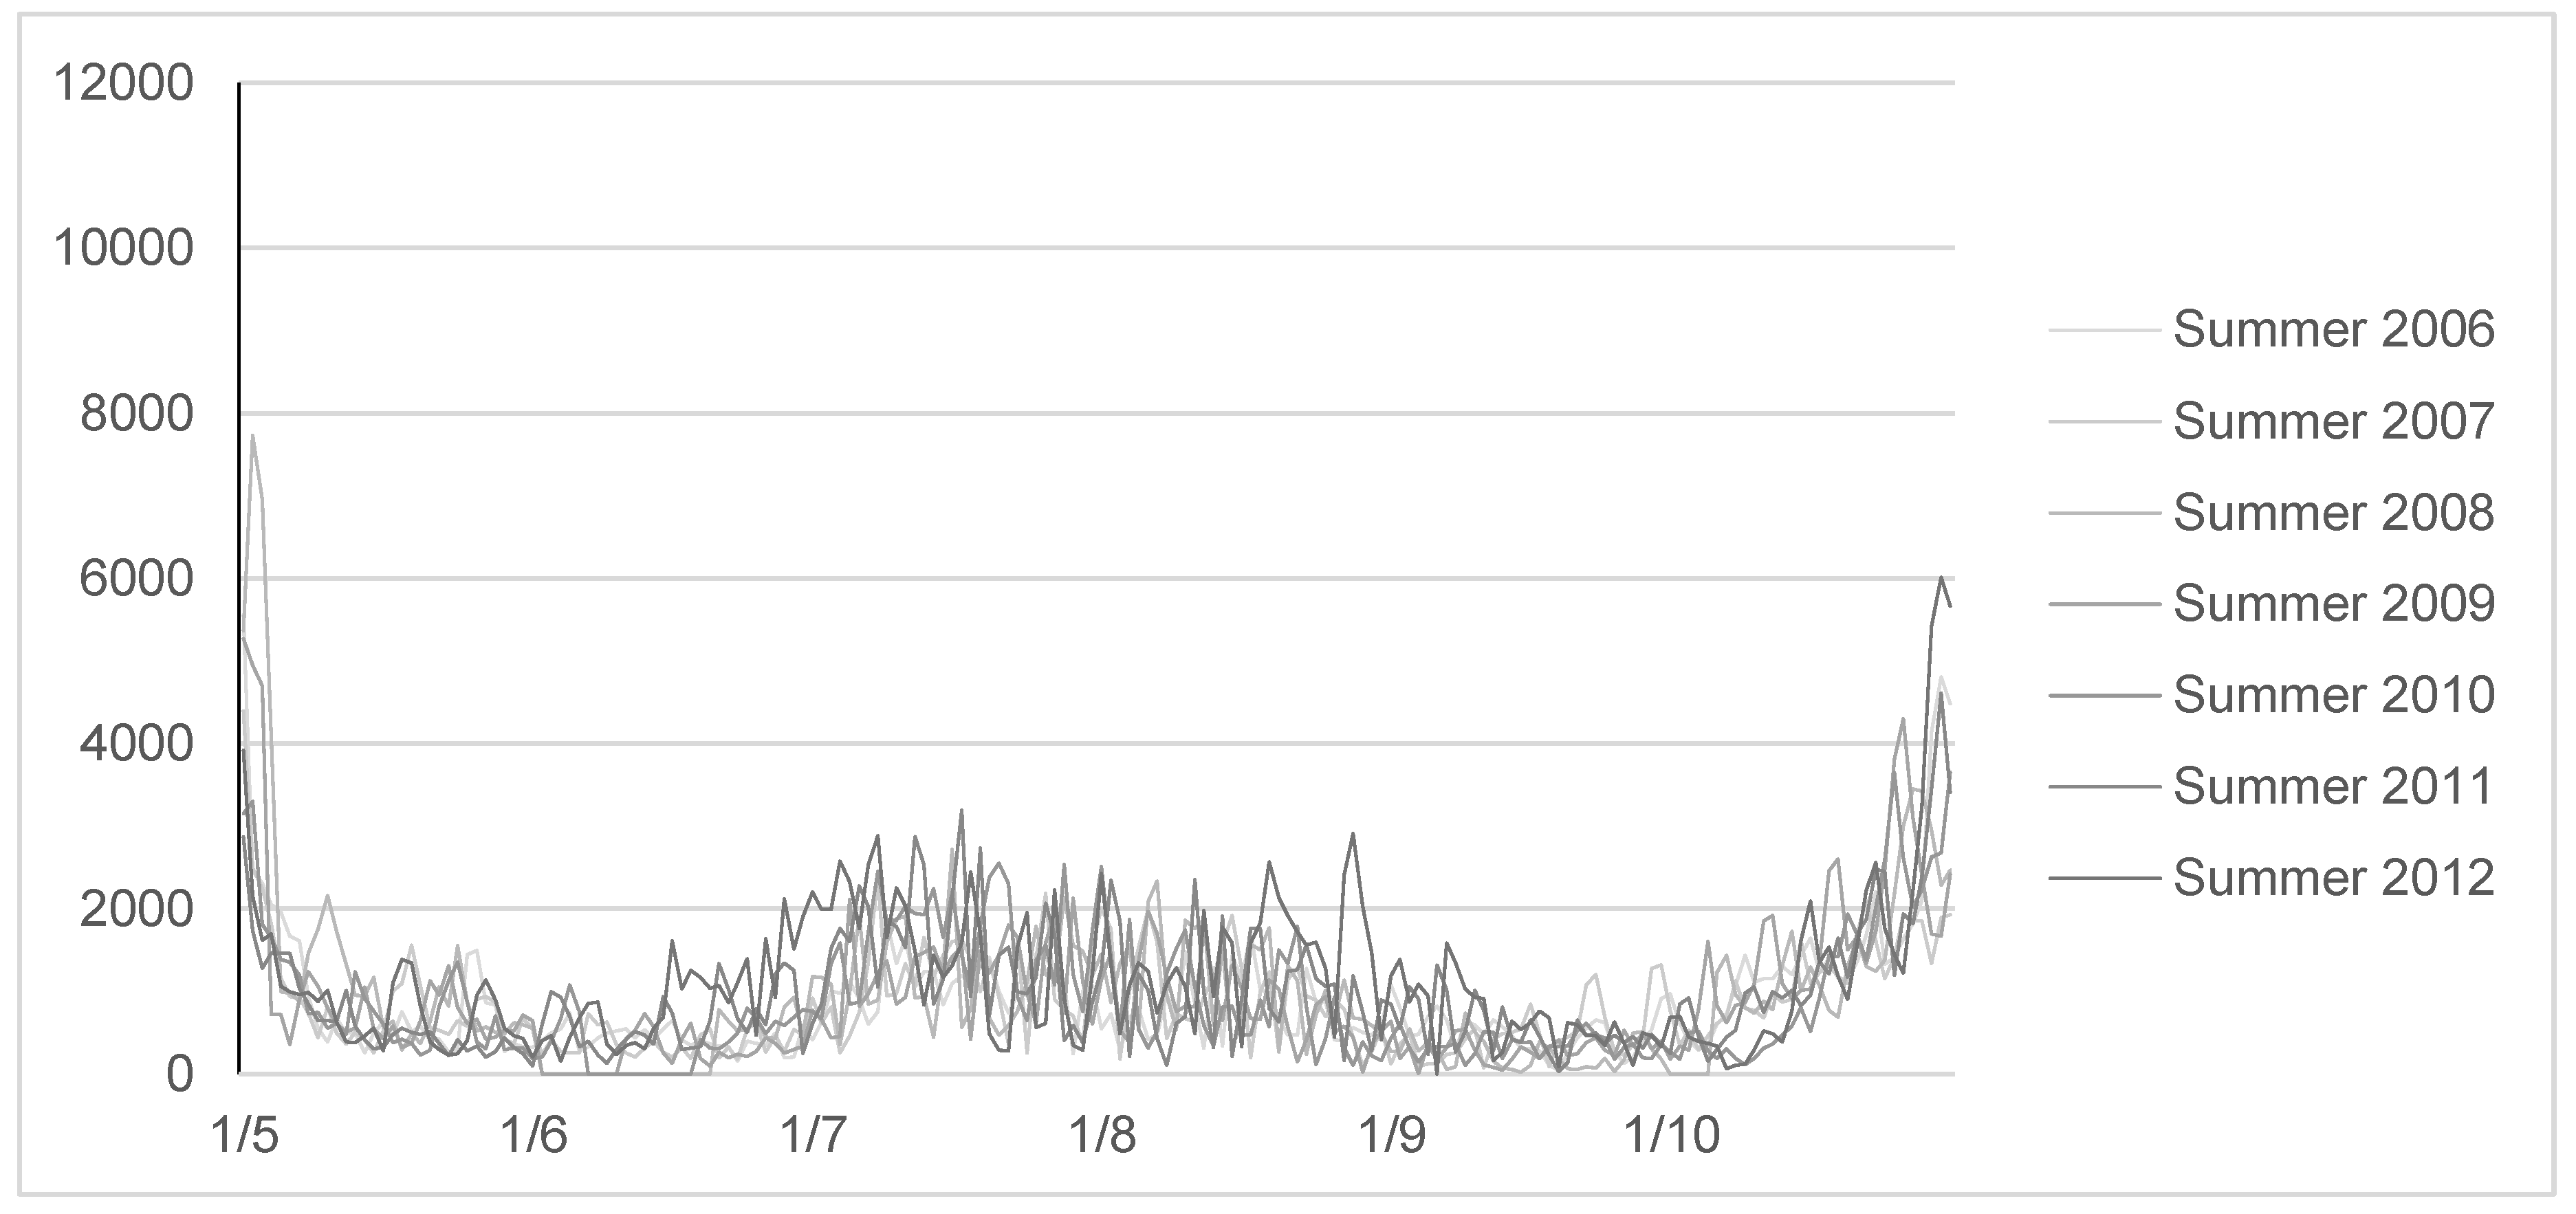
The seasonality in summer can be described much more easily (Figure 2): While the first weekend of May is still heavily influenced by considerable skiing demand, the latter decreases fast despite often good snow conditions. The number of first entries increases then in July and August parallel to the summer holidays in the most important source markets which in recent years also includes the Arabian Gulf Co-Operation Countries [55]. Following a second demand drop in September, the skiing season restarts, varying from year to year with the arrival of the first important snow fall, which usually allows the reopening of the glacier skiing. At the end of October, the high number of first entries of early May is reached, but this usually relies on a much smaller offer in terms of open ski runs and snow depth but driven by the very high early season motivation of avid skiers and racing teams that need to exercise.
The dispersion of overall visitation frequencies for both seasons, on the other hand, demonstrates quite variable patterns, as visible in Figure 1 and Figure 2. Our ARCH-LM tests on both the winter and the summer series yield significant results, implying that there may be a considerable amount of volatility in the dynamics of these series. Thus, we suppressed them by the ARCH/GARCH effect. Table 1 reflects that GARCH (1,1) can be a suitable model to capture such dynamics. The t-statistics herein confirm that both the winter and the summer series have fluctuating structures, with stronger coefficients for the latter. Whilst the latter could be partly explained by the increasing non-skier interest towards one end of the overall summers, a major attribution for both series could be the intra- and the inter-serial weather and climate variability and an associated demand sensitivity.
4.2. Microclimatic Elasticity of Glacier Skiing Demand during the Winter Season
Eight different equations based on our elasticity model help explain 22–63% of the variation in visitation and lift frequentation in terms of the long-term weather conditions at the lower and the higher parts of the ski area during winter seasons (Table 2). The demand for visitation and frequentation is generally inelastic in terms of snow depth and relative humidity at both locations, except for the insignificance found with non-skiers towards the lower zone. In general, and as expected, higher snow depth leads to higher visitation and frequentation as well as increased skiing activity, as noted by the increase in glacier lifts’ uphill transports, whereas relative humidity performs the opposite pattern probably due to increased chances of precipitation as well as reduced visibility and sunshine due to cloud and fog formation and vice versa. Visibility and sunshine are especially crucial factors for such high alpine resorts without any trees providing orientation. In the case of thick clouds or fog, white-out conditions occur easily, especially on the vast glacier plateau. Consequently, a high relative humidity that implies low visibility also reduces the number of pedestrians in the winter season, usually motivated by stunning panoramic views from the top station at 3000 m.
The wind chill factor plays a major role for skiers’ sensitivity, where highly elastic and significant coefficients are found across all first three dependent variables. The impact of the combined temperature and wind speed variable is lowest for first entries, higher for the total frequentation of the resort, and highest for the glacier lifts for both weather measurements on BS and GP. This makes sense for the following reasons: Overnight ski guests usually buy multiple-day lift passes and thus do not decide every morning based on the weather conditions if they will go up the mountain. To avoid too many sunk costs, they give it a try even in case of doubtful conditions as they might improve throughout the day and generate first entries. However, if the conditions are indeed not favorable, do not improve, or become even worse, very few lift rides in the ski resort are made and the guests either spend time in the gastronomy or take the cable cars downhill to the frequent wellness offers of their accommodation. The higher elasticity of the glacier lifts stems from their higher altitude leading to lower temperatures, more exposition and higher wind speed. Furthermore, at the time of our data, no gondola or chairlift was operating on the glacier plateau, providing shelter at least during the uphill transport. The same differences among the three dependent variables occur for the relative humidity, which shows the most negative influence for the frequentation of the glacier lifts.
4.3. Microclimatic Elasticity of Glacier Skiing Demand during the Summer Season
The explanatory power of the elasticity models is much higher for the summer season, where R-squared values range between 74 and 93% (Table 3). The snow depth variable becomes insignificant for all models. This is not surprising for the pedestrians not relying on good snow conditions to ski. For the exotic snow and ice experience of summer guests, for instance, from the Arabian Gulf countries, even the glare ice of the late summer or some snow rests might be sufficient. For the summer skiers, operationalized by the dependent variable “glacier lifts,” this is in contrast quite surprisingly. A possible explanation for this contra-intuitive result might be the fact that, as shown in Figure 2, the demand in May and June decreases faster than the snow cover and rises again faster in October. That is, there is a temporal mismatch between glacier skiing supply and demand, which might lead to an insignificant result for the variable snow depth for a model covering the complete summer season.
The wind chill factor demonstrates a very high demand elasticity—now also and considerably strong for the non-skiing visitors. The dependent variable “glacier lifts” has the weakest influence of the combined temperature and wind speed variable, which is the total opposite to the winter results where it was the strongest. This suggests that extremely warm temperatures might lead to less favorable summer ski conditions as the snow becomes slushy too early in the morning. However, the positive sign nevertheless shows also that summer skiers prefer better weather conditions to storms and (occasional) cold surges in the summer.
Impacts of relative humidity are again negative, yet compared to the winter season with mostly stronger coefficients, and more significance for the pedestrian market. Interestingly, the strength of the coefficients is the complete inverse of that of the winter season; i.e., the first entries and the non-skiers show the strongest impact, while the glacier lifts are the weakest and are not even significant for the GP weather data. This indicates the important role of pedestrians for the summer visitation of the analyzed glacier ski resort but also shows a weaker sensitivity of summer skiers for adverse visibility and precipitation compared to winter skiers. Summer skiers are most likely more avid and experienced skiers or perform the sport on a (semi-)professional level, which requires them to exercise even under less than ideal conditions compared to purely leisure-motivated and less-experienced skiers in the winter who react more sensitively to adverse conditions.
Finally, if we compare pedestrians and summer skiers, it is obvious that the first are more sensitive to the weather conditions than the second, which is not the case in the winter season. Again, this can be explained by the specific target groups of summer skiers and the often foreign pedestrians neither experienced in high-mountain environments nor adequately equipped (at the beginning of their visits at least).
5. Discussion
Glacier ski areas are vital venues for the future sustainability of winter tourism in a changing climate and the very unique offer of summer skiing still important for professional skiers and the work with young talents. This study analyzed effects of 21st century diurnal weather conditions on the visitation and the frequentation of a well-established glacier ski area in Austria for eight consecutive winter and seven summer seasons with the analysis of multivariate weather impact on summer skiing being done for the first time in the Alps. Findings show that the business performance of the area in terms of first entries has been highly volatile in terms of both the winter and the summer seasons. Whilst calendar effects are quite stable to explain such internal dynamism, changing economic conditions and market trends form a basis for attribution. Especially the recent strongly increased interest from the Arabian Gulf Cooperation countries for summer sightseeing in July and August could be one reason to this imbalanced dispersion [55]. Moreover, microclimatic variability could also account for the volatility, especially given the study finding that reveals the high sensitivity of visitors to combined temperature and wind speed changes.
Given the overall tendency to more visitors in the second half of the winter season, it is not surprising that snow depth is positively related to all dependent variables in the winter models as, in contrast to ski resorts in lower altitudes, snow depth accumulates over the winter season in a high alpine glacier ski resort where the highest amount of snow is often reached only in the end of April or beginning of May. This indicates a methodological challenge when it comes to identifying the real influence of snow depth on glacier ski area visitation and frequentation patterns. A potential for further research could therefore be the analysis of the seasonal variations of the operating lifts, as these are most often directly correlated to the snow situation, especially in the early season. However, as this operation level is also interlinked with the demand situation this variable requires careful analysis.
Our results from the summer season models reveal that snow depth has no significant influence on the summer skiing frequentation. Does this result contradict the ongoing glacier shrinking and ice mass loss in the Alps since the early 1980s [56]? Barnick [57] in 1970 had already pointed out the sharp skiing demand decline after the Easter holidays regardless of the snow conditions which are usually very good in high alpine areas. This is reflected also in the opening status of alpine glacier ski resorts for the year 2011 as illustrated in [18]. Given this non-linear relationship between snow depth and glacier ski resort frequentation it is not surprising that this variable does not show significant influences in the summer season models. For future research, it might therefore be reasonable to estimate separate models for the spring/early summer and the autumn ski season, taking account of managed (produced, farmed, groomed, etc.) snow factors.
The high sensitivity of visitors to the WCF also holds an important implication in terms of climate change, as increasing temperature would generally be associated with deteriorating snow cover and ski resort performance [32]. In this glacier case, however, climate change could lead to improved thermal comfort in terms of reduced extreme cold. Nevertheless, such change could have negative implications for summer skiing, but the growing non-skier market that demands high WCF could then compensate for the losses from the skier market and has already done so in the last 15 years. As our results show, pedestrians are more sensitive towards adverse weather conditions than summer skiers, who are usually experienced, or even (semi-)professional skiers [18,50,58]. Moreover, in a warming climate, glacier ski areas are likely to sustain their competitive edges over the ski areas in lower altitudes even in the case of further glacier retreat and shrinking ice masses due to the superior snowmaking conditions and gain from spatial substitution, as demonstrated by the direct comparison of the winter seasons 2005/06 and 2006/07 [7,59], sometimes at the risk of increased congestion and, thus, reduced attractivity. Crowding experiences and their effects on visitor satisfaction as well as its management is a largely under-researched topic in ski tourism. Future research should also address among others the potential effects of weather forecasts on the variability of ski resort frequentation as well as the weather aspects affecting demand forecasting.
Author Contributions
Conceptualization: M.M. and O.C.D.; methodology: M.M., O.C.D., and O.O.; software: O.C.D. and O.O.; validation: O.C.D. and O.O.; formal analysis: M.M., O.C.D., and O.O.; investigation: M.M.; resources: M.M.; data curation: M.M., O.C.D., and O.O.; writing—original draft preparation: M.M. and O.C.D.; writing—review & editing: M.M., O.C.D., and O.O.; visualization: M.M. and O.C.D.; funding acquisition: O.C.D.
Funding
This research was funded by Svenska Forskningsrådet Formas, grant number [2011-72].
Acknowledgments
The authors thank the case study site representatives for their generous provision of data and metadata on weather observations and lift frequentation. We would also like to thank the guest editor and the three anonymous reviewers for their helpful and constructive comments, which helped us to improve the manuscript.
Conflicts of Interest
The authors declare no conflict of interest.
References
- Steiger, R.; Scott, D.; Abegg, B.; Pons, M.; Aall, C. A critical review of climate change risk for ski tourism. Curr. Issues Tour. 2017. [Google Scholar] [CrossRef]
- Becken, S. Measuring the Effect of Weather on Tourism: A Destination- and Activity-Based Analysis. J. Travel Res. 2013, 52, 156–167. [Google Scholar] [CrossRef]
- Becken, S.; Wilson, J. The impacts of weather on tourist travel. Tour. Geogr. 2013, 15, 620–639. [Google Scholar] [CrossRef]
- IPCC. Climate Change 2013: The Physical Science Basis. Contribution of Working Group I to the Fifth Assessment Report of the Intergovernmental Panel on Climate Change; Stocker, T.F., Qin, D., Plattner, G.-K., Tignor, M., Allen, S.K., Boschung, J., Nauels, A., Xia, Y., Bex, V., Midgley, P.M., Eds.; Cambridge University Press: Cambridge, UK; New York, NY, USA, 2013. [Google Scholar] [CrossRef]
- Dawson, J.; Scott, D.; McBoyle, G. Climate change analogue analysis of ski tourism in the northeastern USA. Clim. Res. 2009, 39, 1–9. [Google Scholar] [CrossRef] [Green Version]
- Pickering, C. Changes in demand for tourism with climate change: A case study of visitation patterns to six ski resorts in Australia. J. Sustain. Tour. 2011, 19, 767–781. [Google Scholar] [CrossRef]
- Steiger, R. The impact of snow scarcity on ski tourism: An analysis of the record warm season 2006/2007 in Tyrol (Austria). Tour. Rev. 2011, 66, 4–13. [Google Scholar] [CrossRef]
- Burakowski, E.; Magnusson, M. Climate Impacts on the Winter Tourism Economy in the Unites States; Natural Resources Defense Council: New York, NY, USA, 2012. [Google Scholar]
- Hagenstad, M.; Burakowski, E.; Hill, R. The Economic Contributions of Winter Sports in A Changing Climate; Protect Our Winters: Los Angeles, CA, USA, 2018. [Google Scholar]
- Steiger, R.; Abegg, B. Ski areas’ competitiveness in the light of climate change: Comparative analysis in the Eastern Alps. In Tourism in Transition—Recovering Decline, Managing Change; Müller, D.K., Więckowski, M., Eds.; Springer: Cham, Switzerland, 2018; pp. 187–199. [Google Scholar]
- Scott, D.; Steiger, R.; Rutty, M.; Fang, Y. The changing geography of the Winter Olympic and Paralympic Games in a warmer world. Curr. Issues Tour. 2018. [Google Scholar] [CrossRef]
- Tervo, K. The Operational and Regional Vulnerability of Winter Tourism to Climate Variability and Change: The Case of the Finnish Nature-Based Tourism Entrepreneurs. Scand. J. Hosp. Tour. 2008, 8, 317–332. [Google Scholar] [CrossRef]
- Shih, C.; Nicholls, S.; Holecek, D.F. Impact of weather on downhill ski lift ticket sales. J. Travel Res. 2009, 47, 359–372. [Google Scholar] [CrossRef]
- Scott, D. Why sustainable tourism must address climate change. J. Sustain. Tour. 2011, 19, 17–34. [Google Scholar] [CrossRef]
- Abegg, B.; König, U.; Maisch, M. Klimaänderung und Gletscherskitourismus. Geogr. Helv. 1994, 49, 103–114. [Google Scholar] [CrossRef] [Green Version]
- König, U.; Abegg, B. Impacts of climate change on tourism in the Swiss Alps. J. Sustain. Tour. 1997, 5, 46–58. [Google Scholar] [CrossRef]
- Haimayer, P. Glacier-Skiing Areas in Austria: A Socio-Political Perspective. Mt. Res. Dev. 1989, 9, 51–58. [Google Scholar] [CrossRef]
- Mayer, M. Summer ski areas in the Alps: First victims of climate change? In Transforming and Managing Destinations: Tourism and Leisure in a Time of Global Change and Risks; Kagermeier, A., Saarinen, J., Eds.; MetaGIS: Mannheim, Germany, 2012; pp. 27–36. ISBN 978-3-936438-41-3. [Google Scholar]
- Falk, M. The demand for winter sports: Empirical evidence for the largest French ski-lift operator. Tour. Econ. 2015, 21, 561–580. [Google Scholar] [CrossRef]
- Gonseth, C. Impact of snow variability on the Swiss winter tourism sector: Implications in an era of climate change. Clim. Chang. 2013, 119, 307–320. [Google Scholar] [CrossRef]
- Falk, M. A dynamic panel data analysis of snow depth and winter tourism. Tour. Manag. 2010, 31, 912–924. [Google Scholar] [CrossRef]
- Töglhofer, C.; Eigner, F.; Prettenthaler, F. Impacts of snow conditions on tourism demand in Austrian ski areas. Clim. Res. 2011, 46, 1–14. [Google Scholar] [CrossRef] [Green Version]
- Falk, M. A survival analysis of ski lift companies. Tour. Manag. 2013, 36, 377–390. [Google Scholar] [CrossRef]
- Falk, M. The stagnation of summer glacier skiing. Tour. Anal. 2016, 21, 117–122. [Google Scholar] [CrossRef]
- Falk, M.; Lin, X. Sensitivity of winter tourism to temperature increases over the last decades. Econ. Model. 2018, 71, 174–183. [Google Scholar] [CrossRef]
- Damm, A.; Greuell, W.; Landgren, O.; Prettenthaler, F. Impacts of +2 °C global warming on winter tourism demand in Europe. Clim. Serv. 2017, 7, 31–46. [Google Scholar] [CrossRef]
- Falk, M.; Hagsten, E. Importance of early snowfall for Swedish ski resorts: Evidence based on monthly data. Tour. Manag. 2016, 53, 61–73. [Google Scholar] [CrossRef] [Green Version]
- Falk, M.; Lin, X. The declining dependence of ski lift operators on natural snow conditions. Tour. Econ. 2018, 24, 662–676. [Google Scholar] [CrossRef]
- Malasevska, I.; Haugom, E.; Lien, G. Modelling and forecasting alpine skier visits. Tour. Econ. 2017, 23, 669–679. [Google Scholar] [CrossRef]
- Falk, M.; Vieru, M. Demand for downhill skiing in subarctic climates. Scand. J. Hosp. Tour. 2017, 17, 388–405. [Google Scholar] [CrossRef]
- Falk, M.; Vieru, M. International tourism demand to Finnish Lapland in the early winter season. Curr. Issues Tour. 2017. [Google Scholar] [CrossRef]
- Demiroglu, O.C.; Kučerová, J.; Ozcelebi, O. Snow reliability and climate elasticity: Case of a Slovak ski resort. Tour. Rev. 2015, 70, 1–12. [Google Scholar] [CrossRef]
- Surugiu, C.; Dinca, A.I.; Micu, D. Tourism destinations vulnerable to climate change: An econometric approach on Predal resort. Buletinul Unversitatii Petrol—Gaze din Ploieşti 2010, 62, 111–120. [Google Scholar]
- Surugiu, C.; Surugiu, M.-R.; Frent, C.; Breda, Z. Effects of climate change on Romanian mountain tourism: Are they positive or mostly negative? Eur. J. Tour. Hosp. Recreat. 2011, 2, 42–71. [Google Scholar]
- Englin, J.; Moeltner, K. The Value of Snowfall to Skiers and Boarders. Environ. Resour. Econ. 2004, 29, 123–136. [Google Scholar] [CrossRef]
- Hamilton, L.C.; Brown, C.; Keim, B.D. Ski areas, weather and climate: Time series models for New England case studies. Int. J. Climatol. 2007, 27, 2113–2124. [Google Scholar] [CrossRef]
- King, M.A.; Abrahams, A.S.; Ragsdale, C.T. Ensemble methods for advanced skier days prediction. Expert Syst. Appl. 2014, 41, 1176–1188. [Google Scholar] [CrossRef]
- Fukushima, T.; Kureha, M.; Ozaki, N.; Fujimori, Y.; Harasawa, H. Influences of air temperature change on leisure industries: Case study on ski activities. Mitig. Adapt. Strateg. Glob. Chang. 2002, 7, 173–189. [Google Scholar] [CrossRef]
- Vanat, L. International Report on Snow & Mountain Tourism: Overview of the Key Industry Figures for Ski Resorts 2018; Laurent Vanat: Genève, Switzerland, 2018. [Google Scholar]
- Wirtschaftskammer Österreich. Tourismus- und Freizeitwirtschaft in Zahlen. Österreichische und internationale Tourismus- und Wirtschaftsdaten 54. Ausgabe, Juni 2018. Available online: https://www.wko.at/branchen/tourismus-freizeitwirtschaft/tourismus-freizeitwirtschaft-in-zahlen-2018.pdf (accessed on 22 August 2018).
- Steiger, R.; Abegg, B. The sensitivity of Austrian ski areas to climate change. Tour. Plan. Dev. 2013, 10, 480–493. [Google Scholar] [CrossRef]
- Steiger, R.; Mayer, M. Snowmaking and climate change. Future options for snow production in Tyrolean ski resorts. Mt. Res. Dev. 2008, 28, 292–298. [Google Scholar] [CrossRef]
- Pickering, C.M.; Buckley, R.C. Climate response by the ski industry: The shortcomings of snowmaking for Australian resorts. AMBIO 2010, 39, 430–438. [Google Scholar] [CrossRef] [PubMed]
- Damm, A.; Köberl, J.; Prettenthaler, F. Does artificial snow production pay under future climate conditions?—A case study for a vulnerable ski area in Austria. Tour. Manag. 2014, 43, 8–21. [Google Scholar] [CrossRef]
- Luterbacher, J.; Liniger, M.A.; Menzel, A.; Estrella, N.; Della-Marta, P.M.; Pfister, C.; Rutishauser, T.; Xoplaki, E. Exceptional European warmth of autumn 2006 and winter 2007: Historical context, the underlying dynamics, and its phenological impacts. Geophys. Res. Lett. 2007, 34, L12704. [Google Scholar] [CrossRef]
- Schmude, J.; Berghammer, A. Gletscher und Skitourismus: Eine Beziehung vor dem Aus? In Warnsignal Klima: Das Eis der Erde; Lozán, J.L., Grassl, H., Kasang, D., Notz, D., Escher-Vetter, H., Eds.; Verlag Wissenschaftliche Auswertungen: Stuttgart, Germany, 2015; pp. 289–293. [Google Scholar]
- Steiger, R.; Dawson, J.; Stötter, J. Last chance tourism in alpine regions. Last chance to ski? In Last Chance Tourism. Adapting Tourism Opportunities in A Changing World; Lemelin, R.H., Dawson, J., Stewart, E.J., Eds.; Routledge: Abingdon, UK, 2012; pp. 42–54. [Google Scholar]
- Mayer, M.; Mose, I. The opportunity costs of worthless land: The nexus between national parks and glacier ski resorts in the Alps. Ecomont 2017, 9, 35–45. [Google Scholar] [CrossRef] [Green Version]
- Rutty, M.; Andrey, J. Weather forecast use for winter recreation. Am. Meteorol. Soc. 2014, 6, 293–306. [Google Scholar] [CrossRef]
- Demiroglu, O.C.; Dannevig, H.; Aall, C. Climate change acknowledgement and responses of summer (glacier) ski visitors in Norway. Scand. J. Hosp. Tour. 2018. [Google Scholar] [CrossRef]
- Land Salzburg. Tourismusstatistik. Das Kalenderjahr 2017 in Zahlen. Available online: https://www.salzburg.gv.at/statistik_/Seiten/statistik-tourismus.aspx (accessed on 11 September 2018).
- Priddy, T. Understanding Wind Chill. Available online: Weather.uky.edu/aen599/wchart.htm (accessed on 12 August 2018).
- Wooldridge, J.M. Introductory Econometrics—A Modern Approach, 2nd ed.; Cengage Learning: London, UK, 2003. [Google Scholar]
- Engle, R. GARCH 101: The use of ARCH/GARCH models in applied econometrics. J. Econ. Perspect. 2001, 15, 157–168. [Google Scholar] [CrossRef]
- Bernal-Barella, I.; Scharfenort, N. Gaudi-Arabien in Zell am See—Wahrnehmung arabischer Reisender durch deutsche Touristen. Mitteilungen der Österreichischen Geographischen Gesellschaft 2015, 157, 169–194. [Google Scholar] [CrossRef]
- Lambrecht, A.; Kuhn, M. Glacier changes in the Austrian Alps during the last three decades, derived from the new Austrian glacier inventory. Ann. Glaciol. 2007, 46, 177–184. [Google Scholar] [CrossRef]
- Barnick, H. Sommerschigebiete in den Alpen und ihre Einzugsbereiche. Berichte zur Raumforschung und Raumplanung 1970, 14, 30–42. [Google Scholar]
- Leitner, W. Winterfremdenverkehr. Entwicklung, Erfahrungen, Kritik, Anregungen. Bundesland Salzburg 1955/56–1980/81; Amt der Salzburger Landesregierung: Salzburg, Austria, 1984. [Google Scholar]
- Mayer, M.; Steiger, R. Skitourismus in den Bayerischen Alpen—Entwicklung und Zukunftsperspektiven. In Tourismus und Regionalentwicklung in Bayern (=Arbeitsberichte der ARL 9); Job, H., Mayer, M., Eds.; Verlag der ARL: Hannover, Germany, 2013; pp. 164–212. [Google Scholar]
Figure 1.
First entries during winter seasons 2005/06–2012/13.

Figure 2.
First entries during summer seasons 2006–2012.


Table 1.
GARCH Estimations with normal distributed errors for winter and summer seasons.
| t-Statistic | Winter | Summer |
|---|---|---|
| intercept | 5.11729 | 8.69490 |
| gamma(1) | 7.15612 | 8.64457 |
| beta(1) | 6.15998 | 8.19611 |
Table 2.
Microclimatic elasticities of glacier skiing demand during the winter season.
| Dependent | First Entries | T. Frequentation | Glacier Lifts | Non-Skiers | ||||
|---|---|---|---|---|---|---|---|---|
| Location | BS | GP | BS | GP | BS | GP | BS | GP |
| Snow Depth | 0.21 ** | 0.18 ** | 0.22 ** | 0.17 ** | 0.29 ** | 0.20 * | 0.00 | 0.23 ** |
| Wind Chill | 2.59 ** | 1.52 * | 4.61 ** | 3.11 ** | 9.22 ** | 7.21 ** | 0.02 | 1.36 |
| R. Humidity | −0.26 ** | −0.13 ** | −0.34 ** | −0.16 ** | −0.60 ** | −0.24 * | 0.00 | −0.23 ** |
| Constant | −3.09 * | −0.49 | −6.79 * | −3.13 | −18.41 ** | −13.51 ** | 1.70 | −1.69 |
| AR(1) | 0.58 ** | 0.50 ** | 0.51 ** | 0.45 ** | 0.40 ** | 0.42 ** | 1.00 ** | 0.78 ** |
| R-squared | 0.42 | 0.33 | 0.37 | 0.28 | 0.24 | 0.22 | 1.00 # | 0.63 |
* p < 0.5, ** p < 0.01; # autocorrelation present; Durbin–Watson stat: 0.91.
Table 3.
Microclimatic elasticities of glacier skiing demand during the summer season.
| Dependent | First Entries | T. Frequentation | Glacier Lifts | Non-Skiers | ||||
|---|---|---|---|---|---|---|---|---|
| Location | BS | GP | BS | GP | BS | GP | BS | GP |
| Snow Depth | 0.23 | 0.12 | 0.06 | 0.16 | 0.16 | 0.05 | −0.04 | 0.20 |
| Wind Chill | 7.93 ** | 4.44 ** | 9.65 ** | 5.92 ** | 9.28 ** | 4.32 * | 10.74 ** | 5.33 * |
| R. Humidity | −0.53 ** | −0.47 ** | −0.48 ** | −0.49 ** | −0.26 ** | −0.21 | −0.49 ** | −0.38 ** |
| Constant | −16.31 ** | −7.90 * | −19.58 ** | −10.60 * | −19.89 ** | −7.88 | −24.04 ** | −11.35 * |
| AR(1) | 0.88 ** | 0.87 ** | 0.89 ** | 0.90 ** | 0.94 ** | 0.97 ** | 0.90 ** | 0.91 ** |
| R-squared | 0.78 | 0.74 | 0.81 | 0.79 | 0.87 | 0.93 | 0.82 | 0.83 |
* p < 0.5, ** p < 0.01.
© 2018 by the authors. Licensee MDPI, Basel, Switzerland. This article is an open access article distributed under the terms and conditions of the Creative Commons Attribution (CC BY) license (http://creativecommons.org/licenses/by/4.0/).
Share and Cite
MDPI and ACS Style
Mayer, M.; Demiroglu, O.C.; Ozcelebi, O. Microclimatic Volatility and Elasticity of Glacier Skiing Demand. Sustainability 2018, 10, 3536. https://0-doi-org.brum.beds.ac.uk/10.3390/su10103536
AMA Style
Mayer M, Demiroglu OC, Ozcelebi O. Microclimatic Volatility and Elasticity of Glacier Skiing Demand. Sustainability. 2018; 10(10):3536. https://0-doi-org.brum.beds.ac.uk/10.3390/su10103536
Chicago/Turabian StyleMayer, Marius, O. Cenk Demiroglu, and Oguzhan Ozcelebi. 2018. "Microclimatic Volatility and Elasticity of Glacier Skiing Demand" Sustainability 10, no. 10: 3536. https://0-doi-org.brum.beds.ac.uk/10.3390/su10103536
Note that from the first issue of 2016, this journal uses article numbers instead of page numbers. See further details here.