Article

Changes in the Distribution of Temperature in a Coal Deposit and the Composition of Gases Emitted during Its Heating and Cooling

by
Marek Więckowski
1,
Natalia Howaniec
2,
Eugene B. Postnikov
3,
Mirosław Chorążewski
4 and
Adam Smoliński
5,*
1
Department of Mining Aerology, Central Mining Institute, Plac Gwarków 1, 40-166 Katowice, Poland
2
Department of Energy Saving and Air Protection, Central Mining Institute, Plac Gwarków 1, 40-166 Katowice, Poland
3
Department of Theoretical Physics, Kursk State University, Radishchevast., 33, 305000 Kursk, Russia
4
Institute of Chemistry, Department of Physical Chemistry, University of Silesia in Katowice, Szkolna 9, 40-006 Katowice, Poland
5
Central Mining Institute, Pl. Gwarków 1, 40-166 Katowice, Poland
*
Author to whom correspondence should be addressed.
Sustainability 2018, 10(10), 3587; https://0-doi-org.brum.beds.ac.uk/10.3390/su10103587
Submission received: 5 September 2018 / Revised: 2 October 2018 / Accepted: 2 October 2018 / Published: 9 October 2018
(This article belongs to the Special Issue Sustainable Use of Mineral Resources)

Abstract

:
This article presents the results of tests conducted on a measuring system for monitoring changes in the distribution of temperature in a coal deposit during the heating and cooling phases, and their correlation with the analysis of the concentration of gases. The tests were conducted on five samples of hard coal collected in deposits mined in Poland. Measurements of the changes in temperature and changes in gas concentration were conducted from the temperature of 35 to 300 °C, for the heating phase, and from 300 to 35 °C, for the cooling phase. The percentage share of coal of given temperatures was calculated. When comparing the percentage share for the same temperature in the hot spot, for the heating and cooling phase, significant differences in the distribution of the given percentages were observed. Changes in gas concentrations during heating and cooling were analyzed and the dynamics of changes in gas concentrations were determined for the coals tested. Changes in the values of fire hazard indices were analyzed. There were significant differences in the concentration of gases and the values of fire hazard indices between the heating and the cooling phase. The application of different criteria to assess coal during heating and cooling was proposed.

1. Introduction

Effective control of endogenous fires requires sufficiently early and accurate identification of processes leading to them as well as the recognition of the process of coal cooling. Exothermic processes are accompanied by the emission of numerous gases. The gases are, among others, carbon monoxide, carbon dioxide, hydrogen, and hydrocarbons [1]. Of the unsaturated hydrocarbons, ethylene, propylene, and acetylene are the most important when it comes to assessing how coal heating develops. Emission of the aforementioned gases is accompanied by an oxygen content decrease [2,3]. The spontaneous heating of coal is possible when coal is supplied with a sufficient amount of oxygen and the coal has a possibility to accumulate the released heat. If such equilibrium occurs in gobs, the process of spontaneous heating and then the self-ignition of coal will follow [4,5,6,7]. Research on the process of spontaneous heating and the self-ignition of coal has been conducted for many years [8,9,10,11,12,13,14], developing numerous methods of assessing coal self-ignition.
Endogenous fires cause huge financial losses as it is necessary to seal off and decommission whole coal mine sections. They also pose a serious threat to the health and safety of the personnel. In gassy mines, they may also lead to methane ignition and explosions. Despite continuous monitoring and fire prevention, new fires and explosions still occur in hard coal mines [13,15]. The development of gas chromatography has enabled the measuring of unsaturated hydrocarbons and using them to assess coal heating and cooling. In a coal deposit, which is heating up the concentration of hydrocarbons, together with the concentrations of carbon monoxide and hydrogen, increase, followed by an increase in temperature, and decrease as the temperature decreases. They are an important indicator of the rate of the spontaneous heating and cooling of coal. By measuring their content in the mine air, it is possible to assess the rate of self-heating and take necessary actions to prevent the heating from spreading [16]. The results of the research presented in this article may contribute to determining changes in coal temperature in a separated area, and state whether it is possible to reopen or extinguish the sealed-off area. Erecting stoppings enables sealing off an area to stop fire spreading and then extinguish it due to insufficient amounts of oxygen. Many methods to assess the fire in a sealed-off area have been developed. However, they are unreliable because some of the parameters are determined indirectly and are approximated. To assess a fire, concentrations of gases are analyzed in places where coal heating occurs. Results of the tests enable the determination of indices which could help find an answer to the question whether there is a danger of re-igniting a fire if the sealed-off area is reopened. The methods of assessing fire hazard were discussed in the literature [17,18,19]. American scientists base assessments of a fire in a sealed-off area on the Litton index, determined based on the analyses of gases collected within a sealed-off area [19]. Bystron [17] proposes estimating the temperature of rocks that were heated during a fire and then subjected to the process of “natural cooling”. In the case of a fire in gobs, very little is known about the composition of gases flowing to the hot spot, especially about the oxygen content. The gas flow rate through the gobs is also unknown. Hitherto, analyses of fire hazard have been based on a quantitative assessment at a given temperature, assuming that the temperature of the whole mass of coal is identical. There is still a need for novel solutions to assess fire hazard, which would make it possible to monitor and control the course of the spontaneous heating and cooling of a heated coal deposit. One of such methods is the method of early fire detection based on the measured concentration of gases emitted as a consequence of coal spontaneous heating [1,5]. In laboratory conditions, gases, emitted when a model sample is heated, are collected from a hot spot of constant temperature and subjected to gas chromatographic analyses. Hence, fire indices determined in laboratory conditions differ from those determined in the actual conditions. In the actual conditions, the temperature of a hot spot is not constant. It is rather characterized by a range of temperatures: From the maximum temperature in the center of the hot spot to the temperature of the rock mass. Analyses of heating and cooling should consider the composition of gases emitted from the heated coal throughout the range of temperature for the heating phase and the cooling phase. The device applied in the research presented in this article enabled the distribution of temperature within the test vessel to be obtained, i.e., it was more similar to actual conditions.
The article presents the distribution of the temperature and results of chromatographic analyses of concentrations of gases from the tested coal samples, which follow the increase in their temperature, as well as the distribution of temperature and results of gas analyses for a decrease in temperature. The graphs show changes in the concentration of analyzed gases depending on the temperature of a coal sample. Graphs of changes in selected fire indices in relation to the temperature are also presented. The tests were conducted for different types of coal occurring in Poland in gassy and non-gassy coal deposits. The obtained results may be used as a basis to assess the process of the spontaneous heating of coal in gobs and the fire hazard in a cooling sealed-off area.

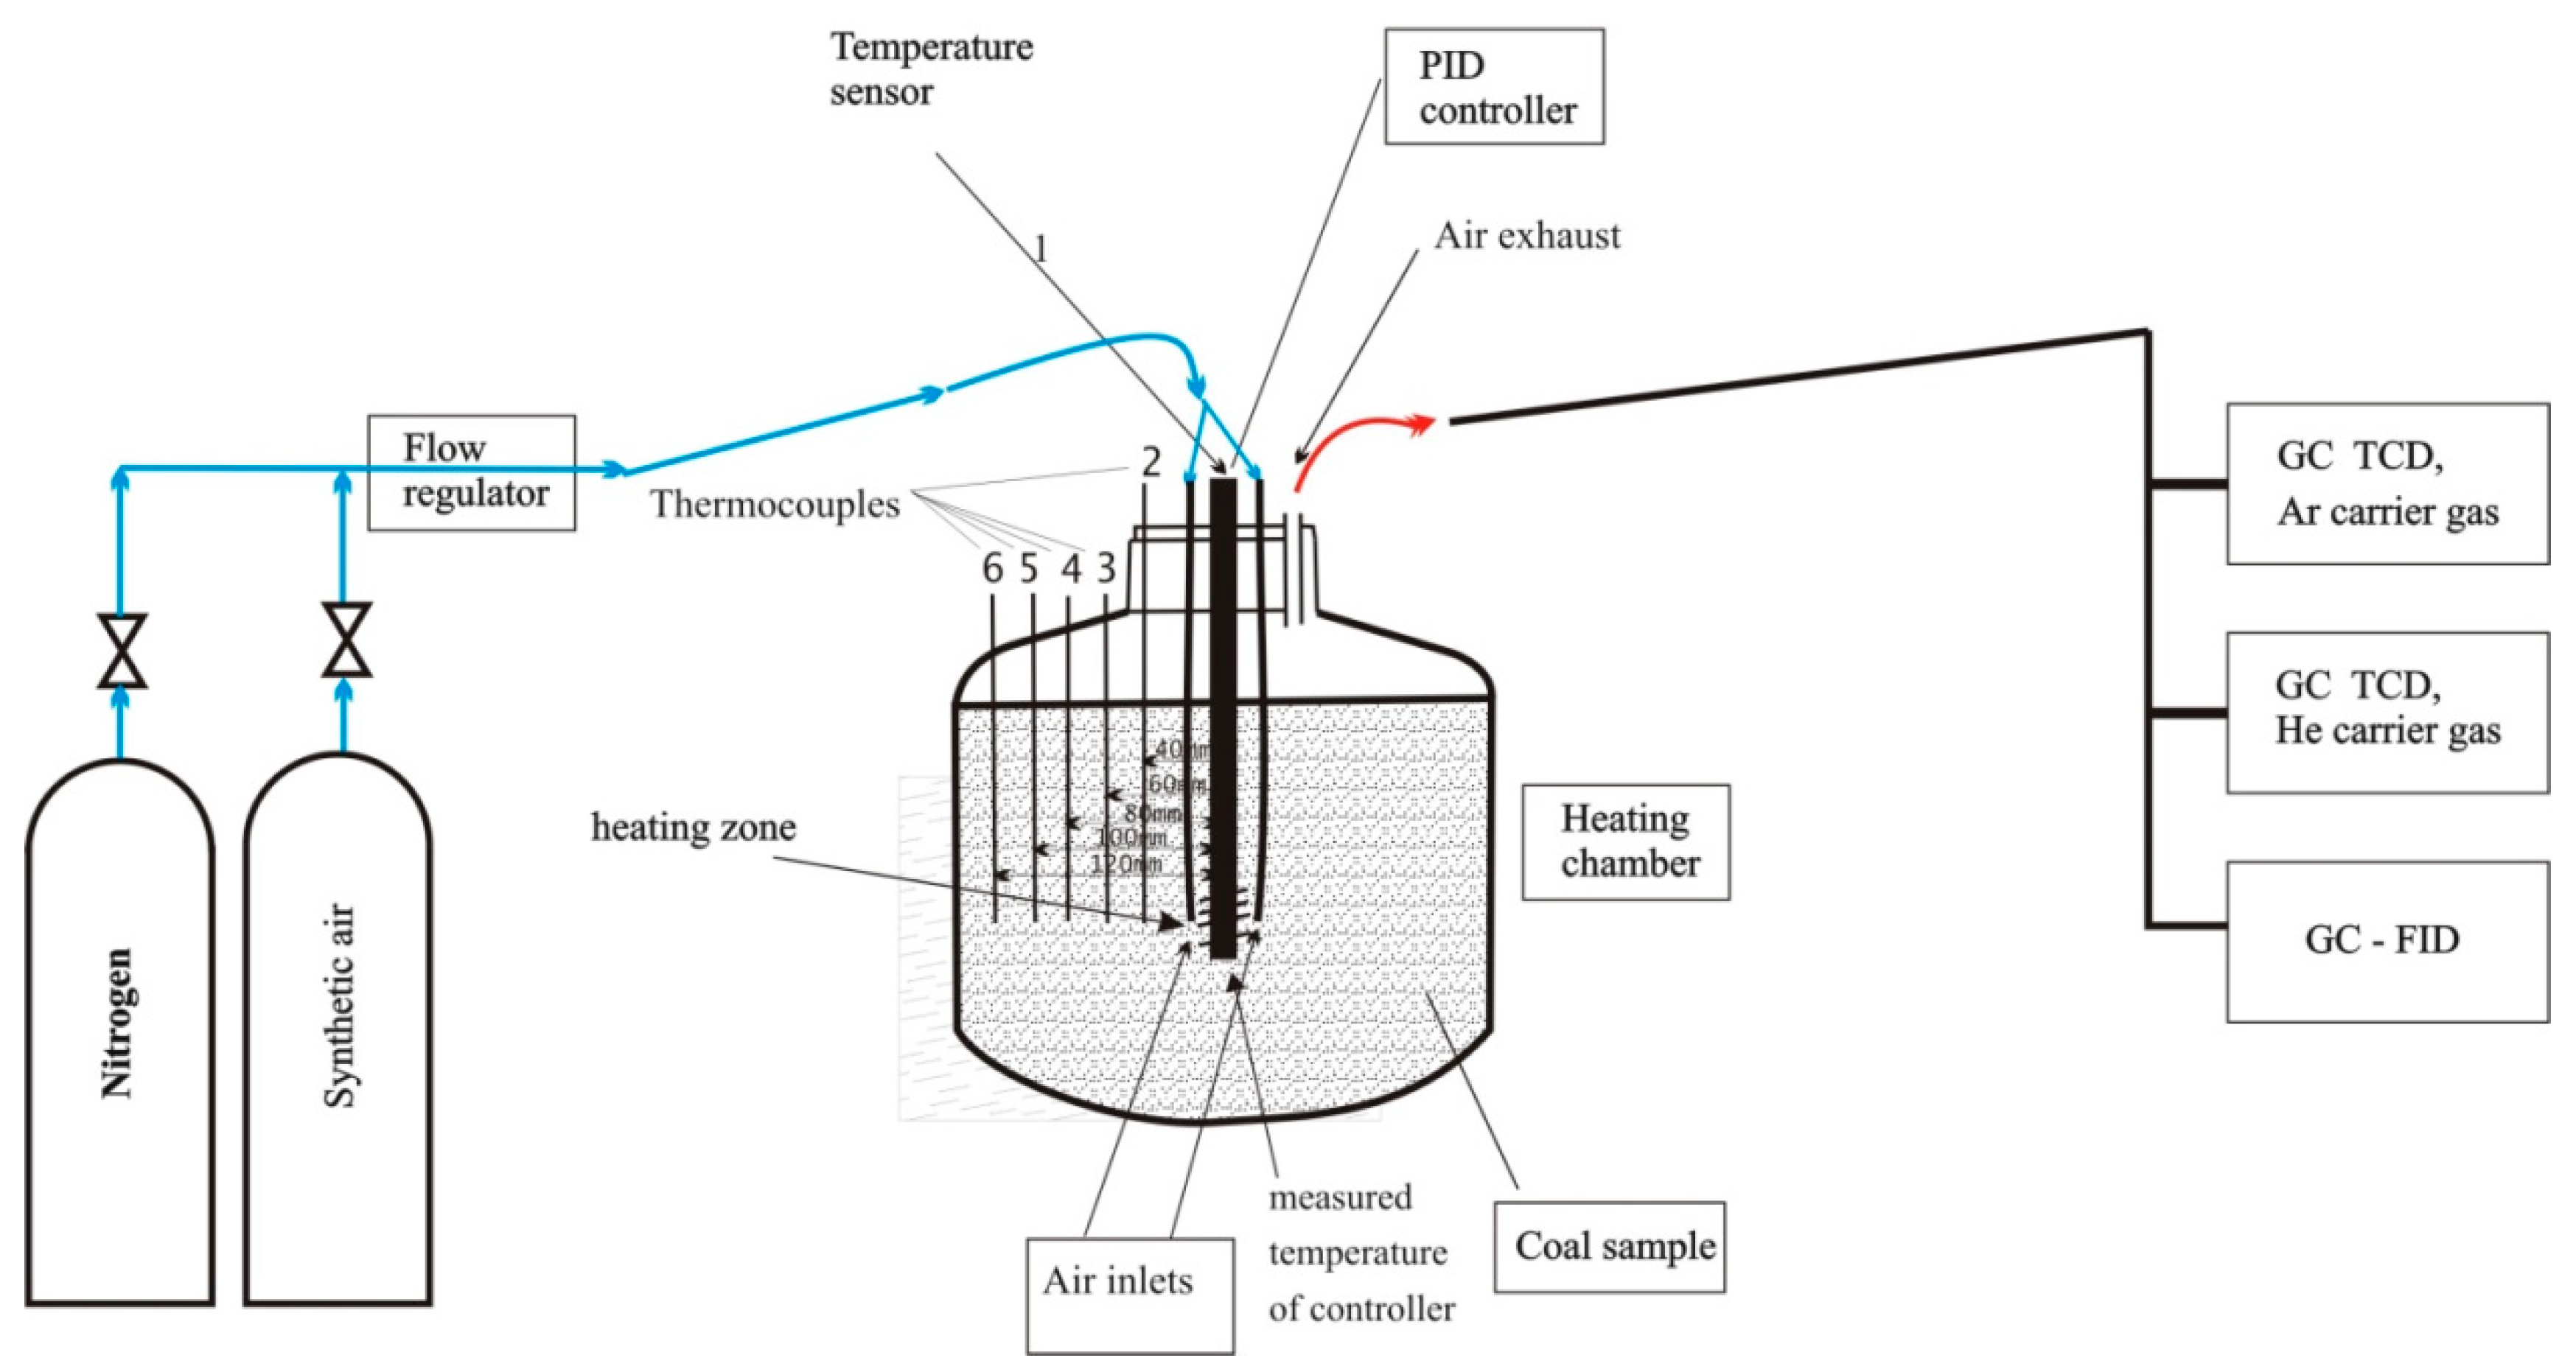
2. Materials and Methods

2.1. Materials

Coal samples were collected in five Polish mines and denoted as Samples 1–5, respectively. The samples were collected from a newly-accessed body of a coal seam, from places representing the average properties of the coal seam, with regards to its endogenous fire hazard, in the biggest possible lumps of coal. After collection, the samples were placed in an air-tight container, covered with coal dust, and tightly sealed.
Prior to tests, the coal samples were pulverized in a crusher disk. Test material consisted of 6 kg of coal, with a grain size below 2.5 mm. They were placed in a metal container and blown with nitrogen. A sieve analysis of the samples in air-dry state was conducted (see Table 1) and the values of selected physical and chemical parameters of the coals were determined (see Table 2).
Fire hazard is described by a course of the components of fire gases and a course of the fire indices. In Poland, the main criteria to assess the intensity of the oxidizing and developing of a hot spot with the spontaneous heating of coal in hard coal mining is the Graham index:
G = CO 0.265 N 2 O 2
where CO, N2, and O2 denote percentage concentrations of carbon monoxide, nitrogen, and oxygen, respectively, and G values determine the actions required [20,21]:
0 < G ≤ 0.0025—no actions needed, no fire risk;
0.0025 < G ≤ 0.0070—enhanced scrutiny of the atmosphere, more frequent collections of gas samples;
0.0070 < G ≤ 0.0300—preventive actions;
G > 0.0300—firefighting;
and the Litton index:
LiR = 1 3 CO ( 100 4.774 O 2 ( CH 4 + C 2 H 6 ) ) 3 / 2 O 2 1 / 2
where CO, O2, CH4, and C2H6 denote percentage concentrations of carbon monoxide, oxygen, methane, and ethane, respectively.
If LiR > 1, the heated area did not cool down to the ambient temperature. If LiR < 1, it is believed that it is possible to have it cooled down to the ambient temperature [19].

2.2. Methods

The tests of coal oxidizing and cooling were conducted in a spherical metal reaction chamber (see Figure 1). Ground coal samples were placed inside the reactor and synthetic air (heating phase) or nitrogen (cooling phase) were flown between the sample grains. The heating was performed with the use of a heater made of a loosely coiled heating cable (40 mm high and 40 mm diameter). The space between the heating cable coils was filled with ground coal, forming a cylindrical sample of a given temperature that could be adjusted in the system. The process temperature was between 35 °C and 300 °C. The process of coal temperature increase and decrease was slow and one experiment took a few days. Heat losses were determined based on system dimensions and temperature values measured by six sensors (one measurement within the hot spot, the second one approximately 40 mm, the third 60 mm, fourth 80 mm, fifth 100 mm, and sixth 120 mm from the chamber zone center), with a 0.2 °C accuracy. By applying a sample of sufficient heat capacity (approximately 6 kg of coal), the effect of damping temperature fluctuation was obtained. The centrally mounted sensor controlled the heating process with a PID controller (proportional integral derivative controller). Gas flow was measured with a mass flow meter, ALICAT M-200SCCM-D/5M.
Composition of gases was analyzed with gas chromatographs, the standard PN-74/Z-04094/02—Clean Air Protection-Carbon monoxide content test, and the respective procedures.
Air of a flow rate of V = 4.0 L/h was supplied to the coal sample in the reaction chamber. The first phase of the experiment consisted in analyzing the maximum temperature increase in the hot spot (sensor 1), and 5 temperatures in measuring points located at 40, 60, 80, 100, and 120 mm from the centre of the hot spot (sensors 2, 3, 4, 5, and 6) as well as the concentrations of gases in the reactor chamber and the composition of exhaust gas during the heating-up of a coal sample at the temperatures of 35, 50, 100, 150, 200, 250, and 300 °C. In the second phase of a test, the decrease in temperature during the cooling of coal by sensors 1–6 readings was measured, and gas composition analyses were performed. The experiment was stopped when a coal sample reached the final temperature, T = 30 °C.

3. Results and Discussion

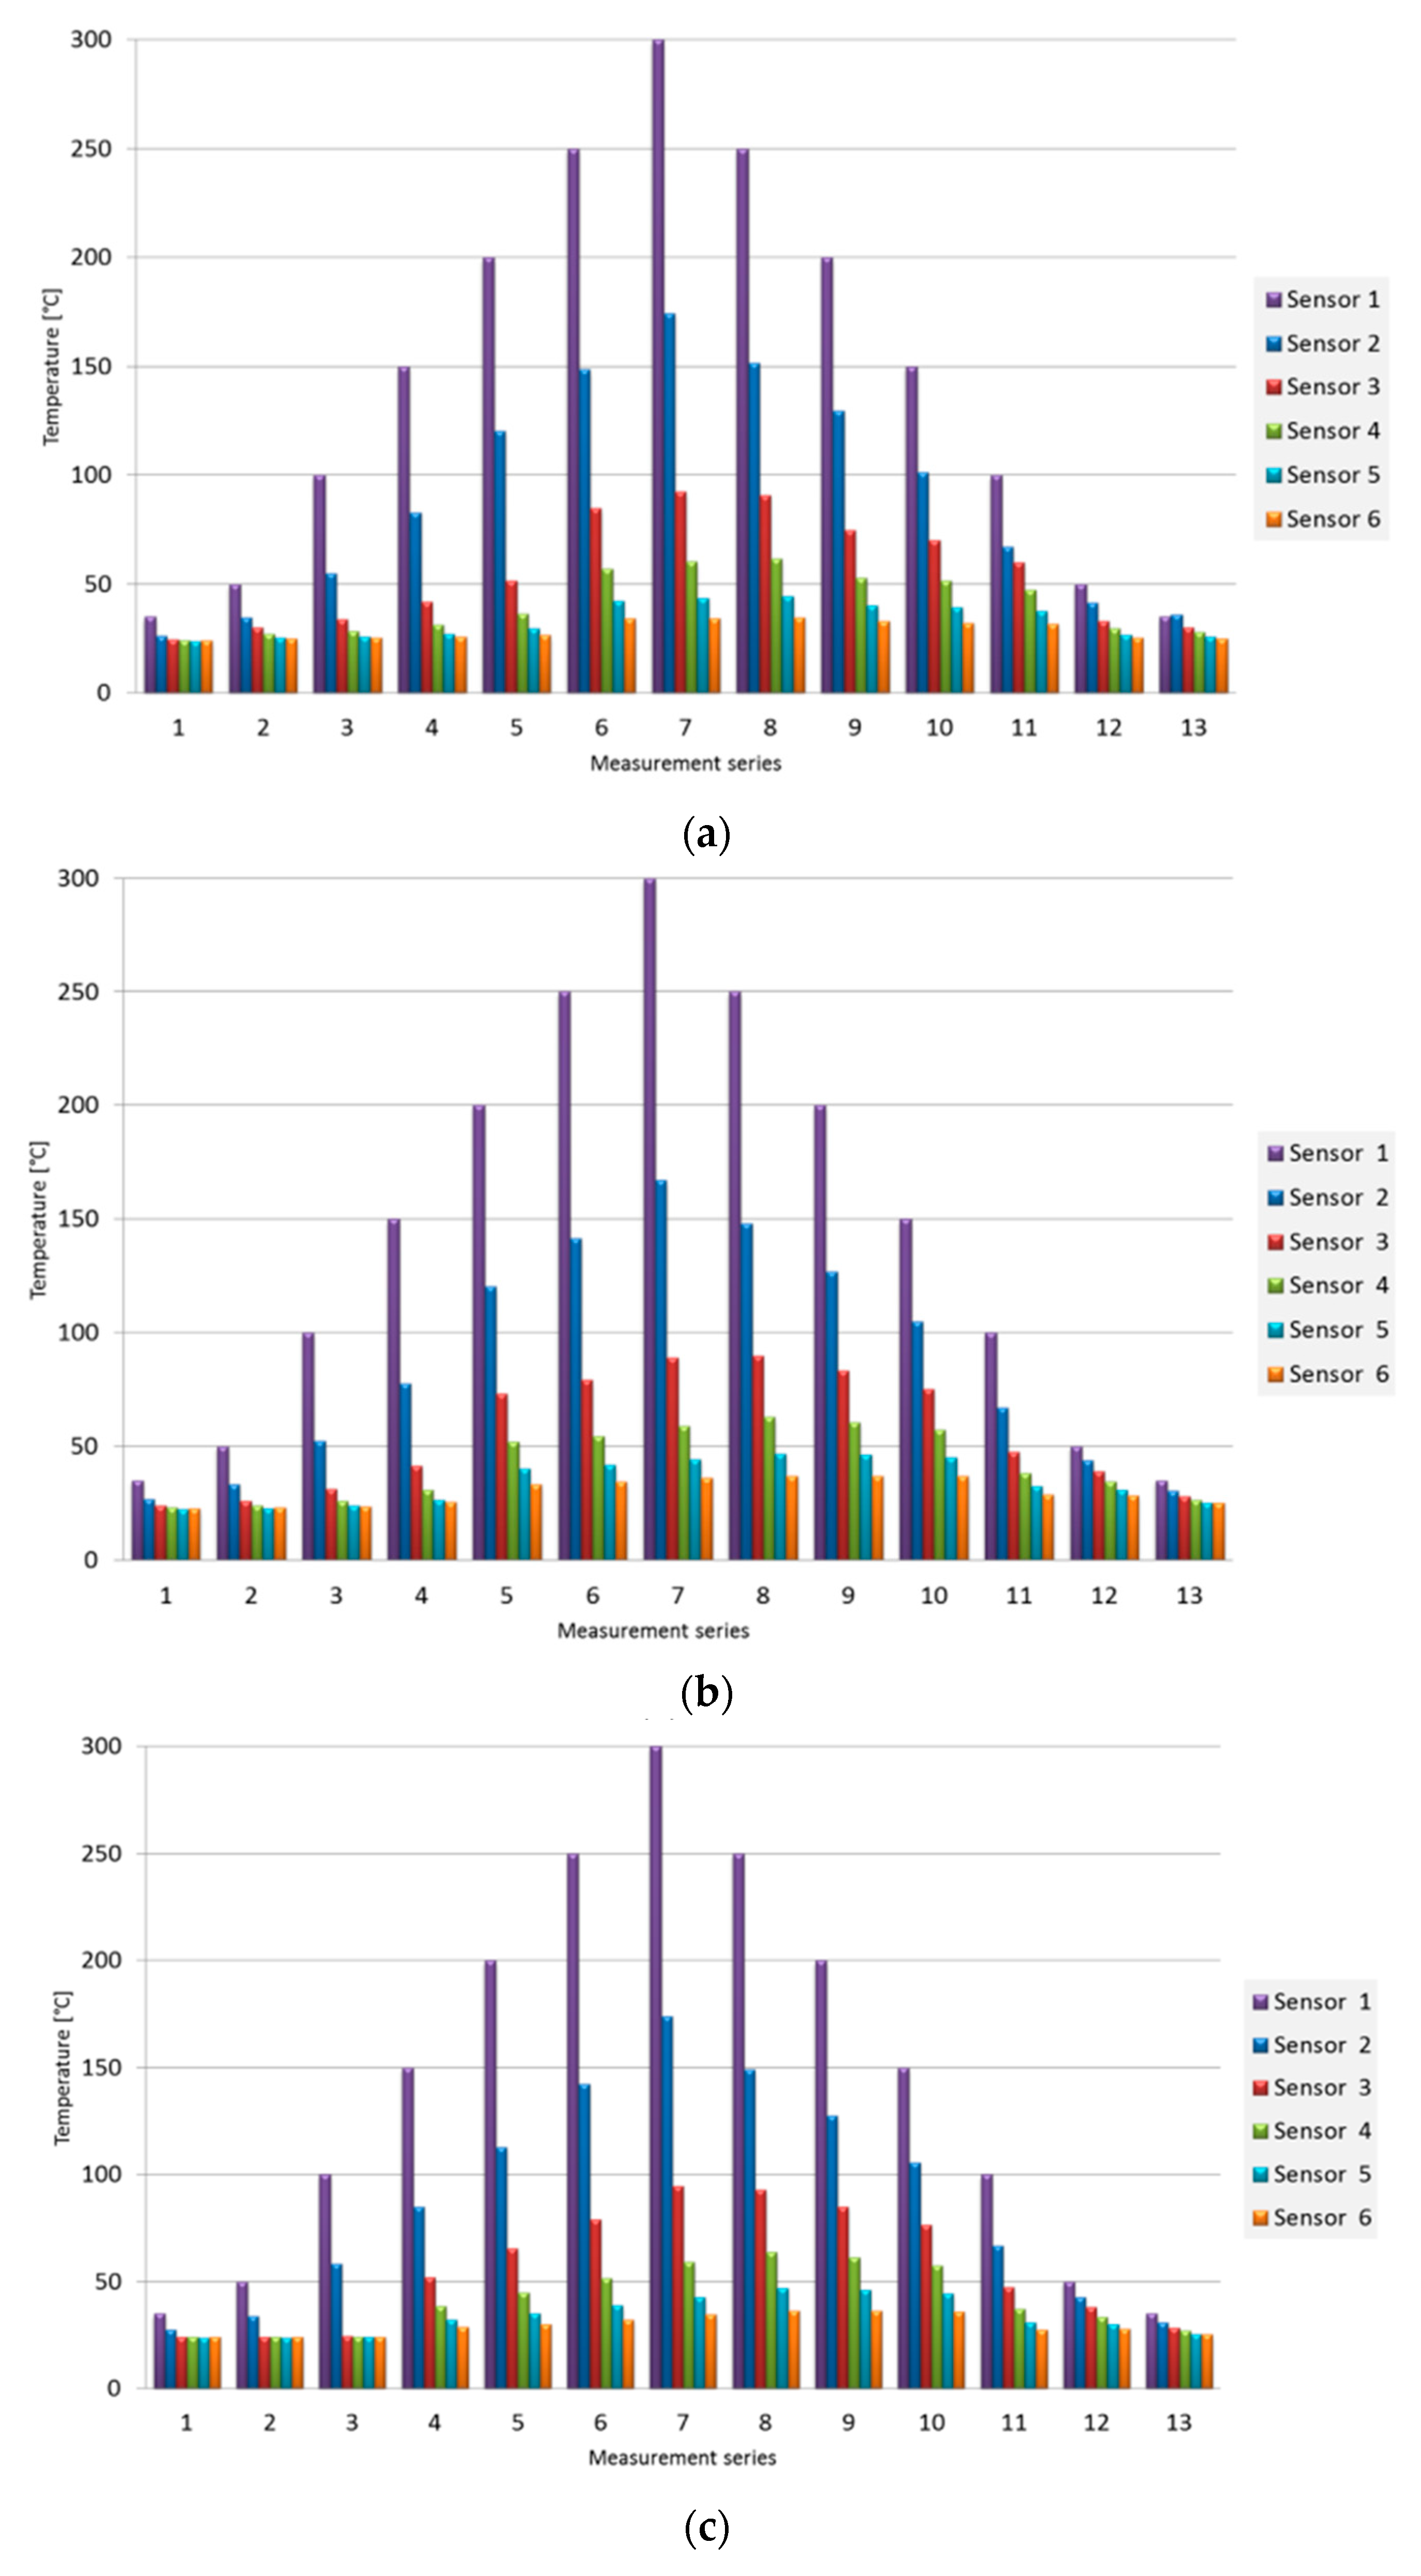
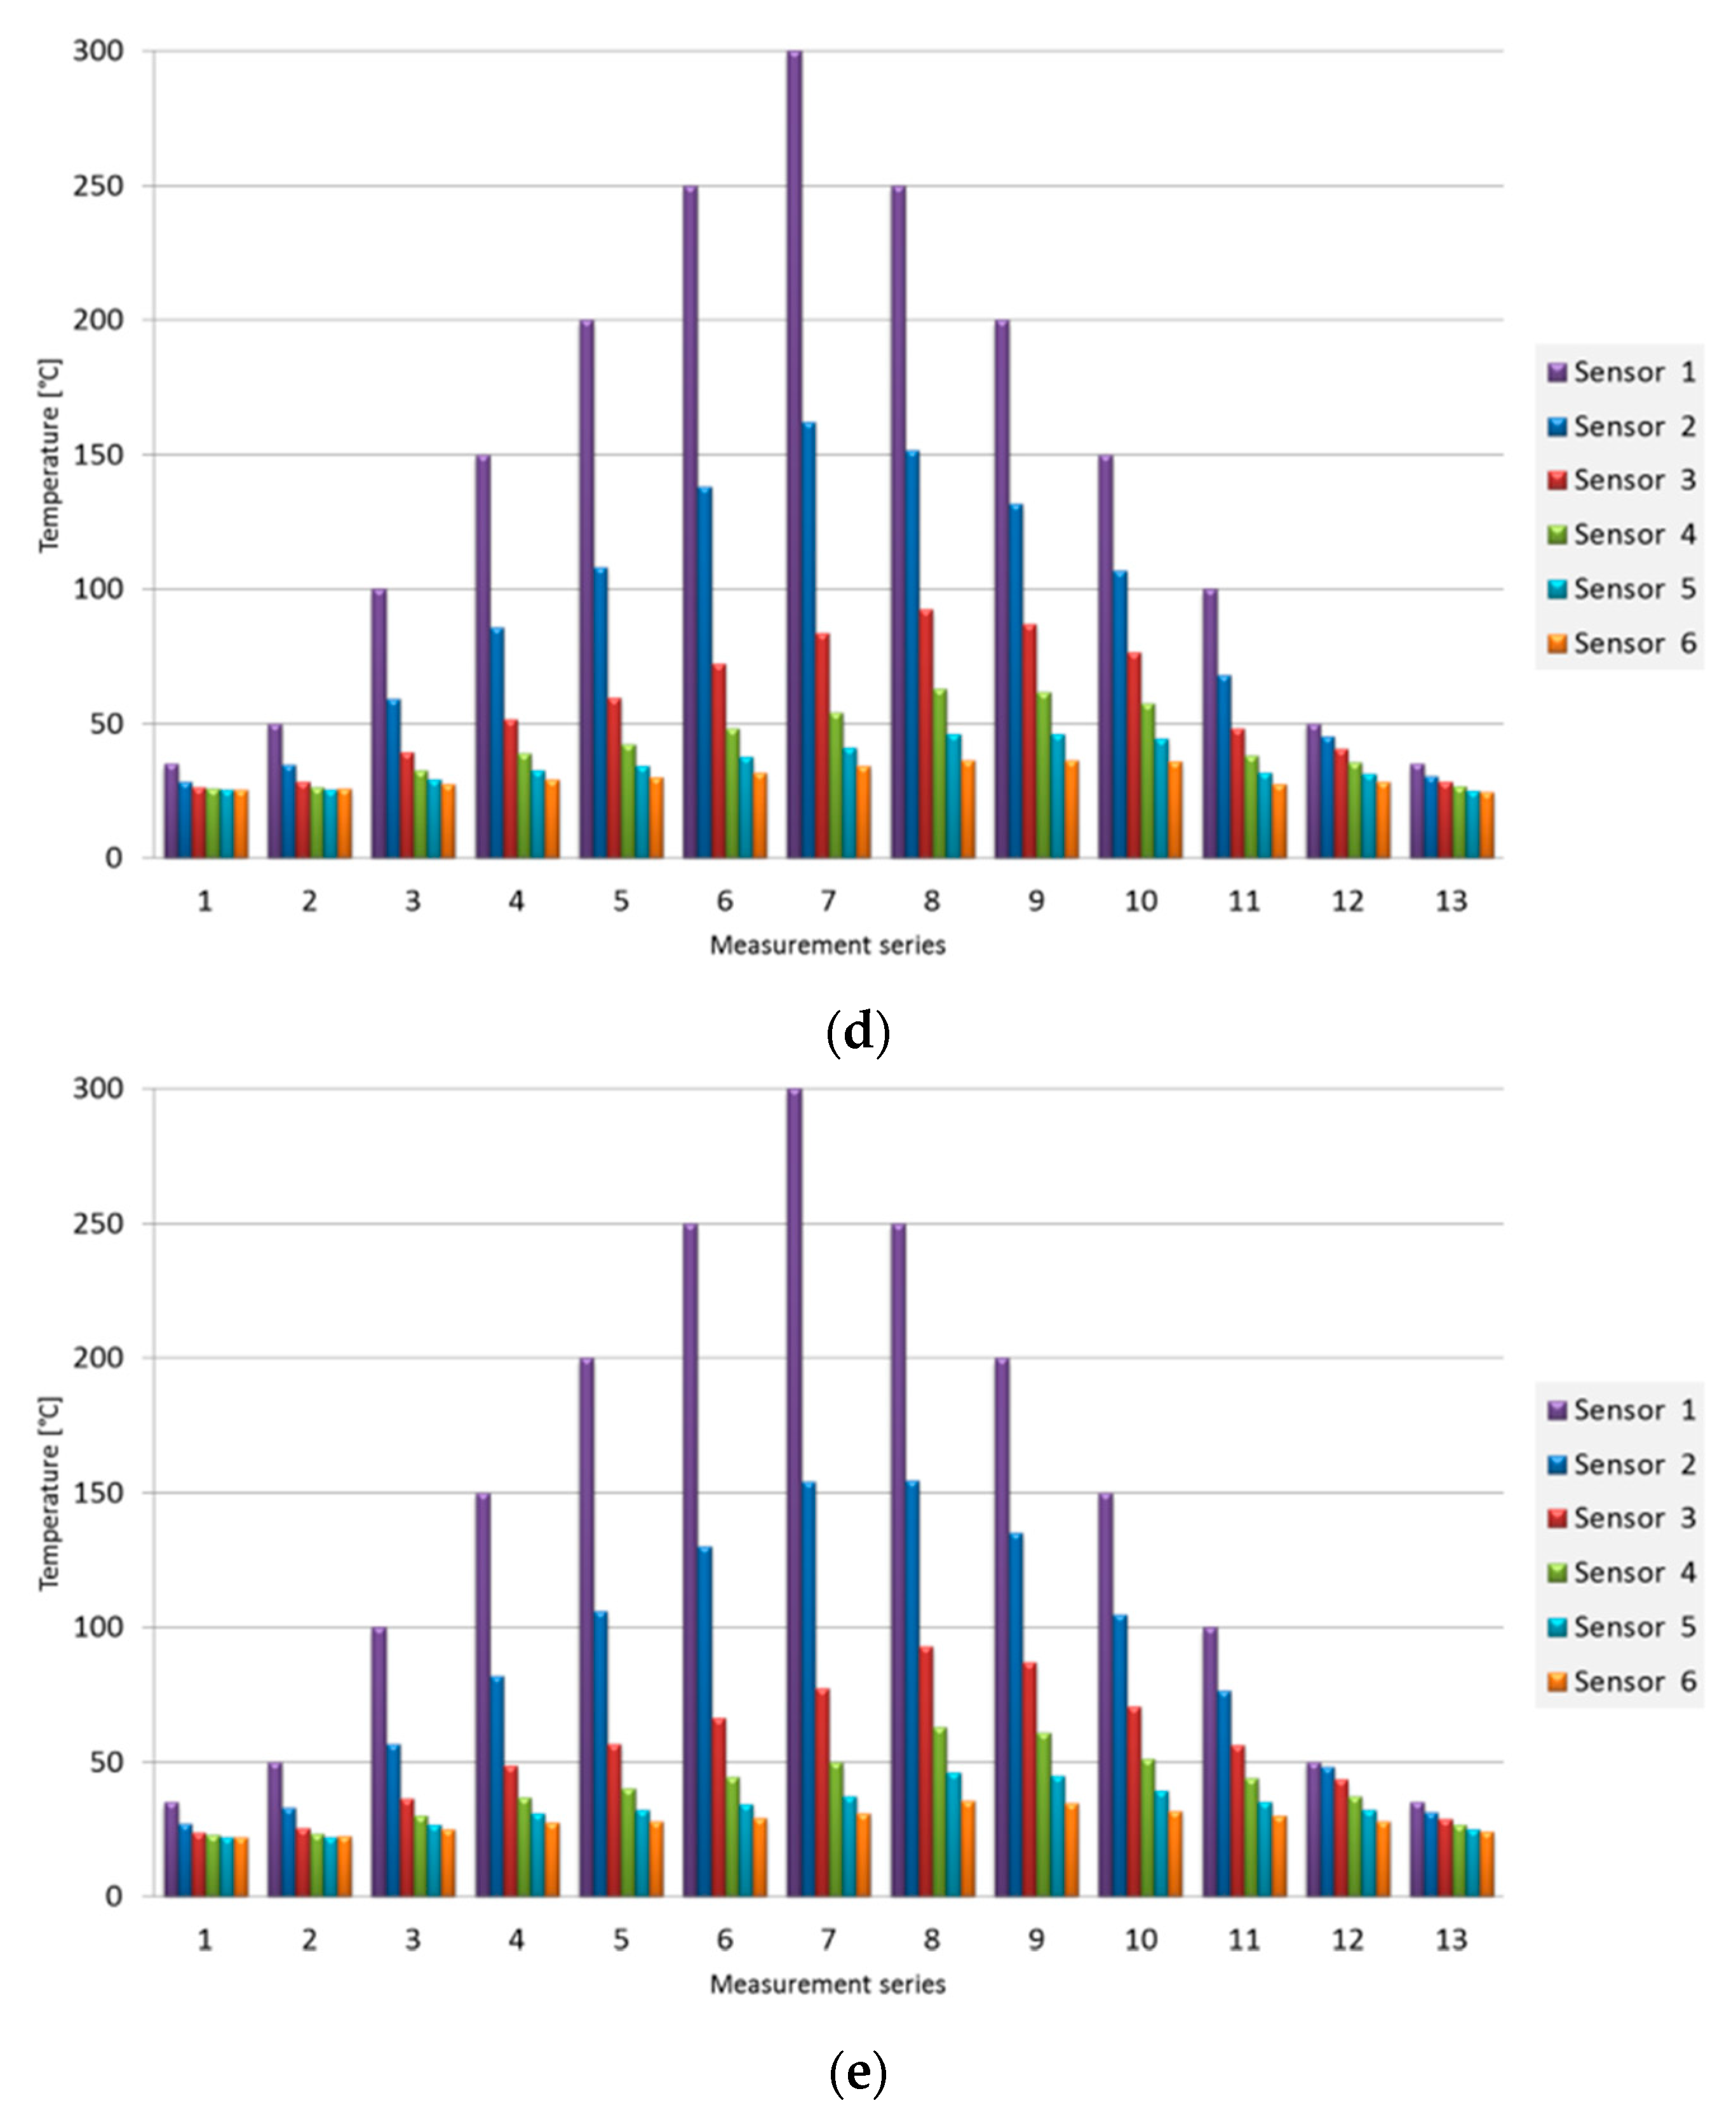
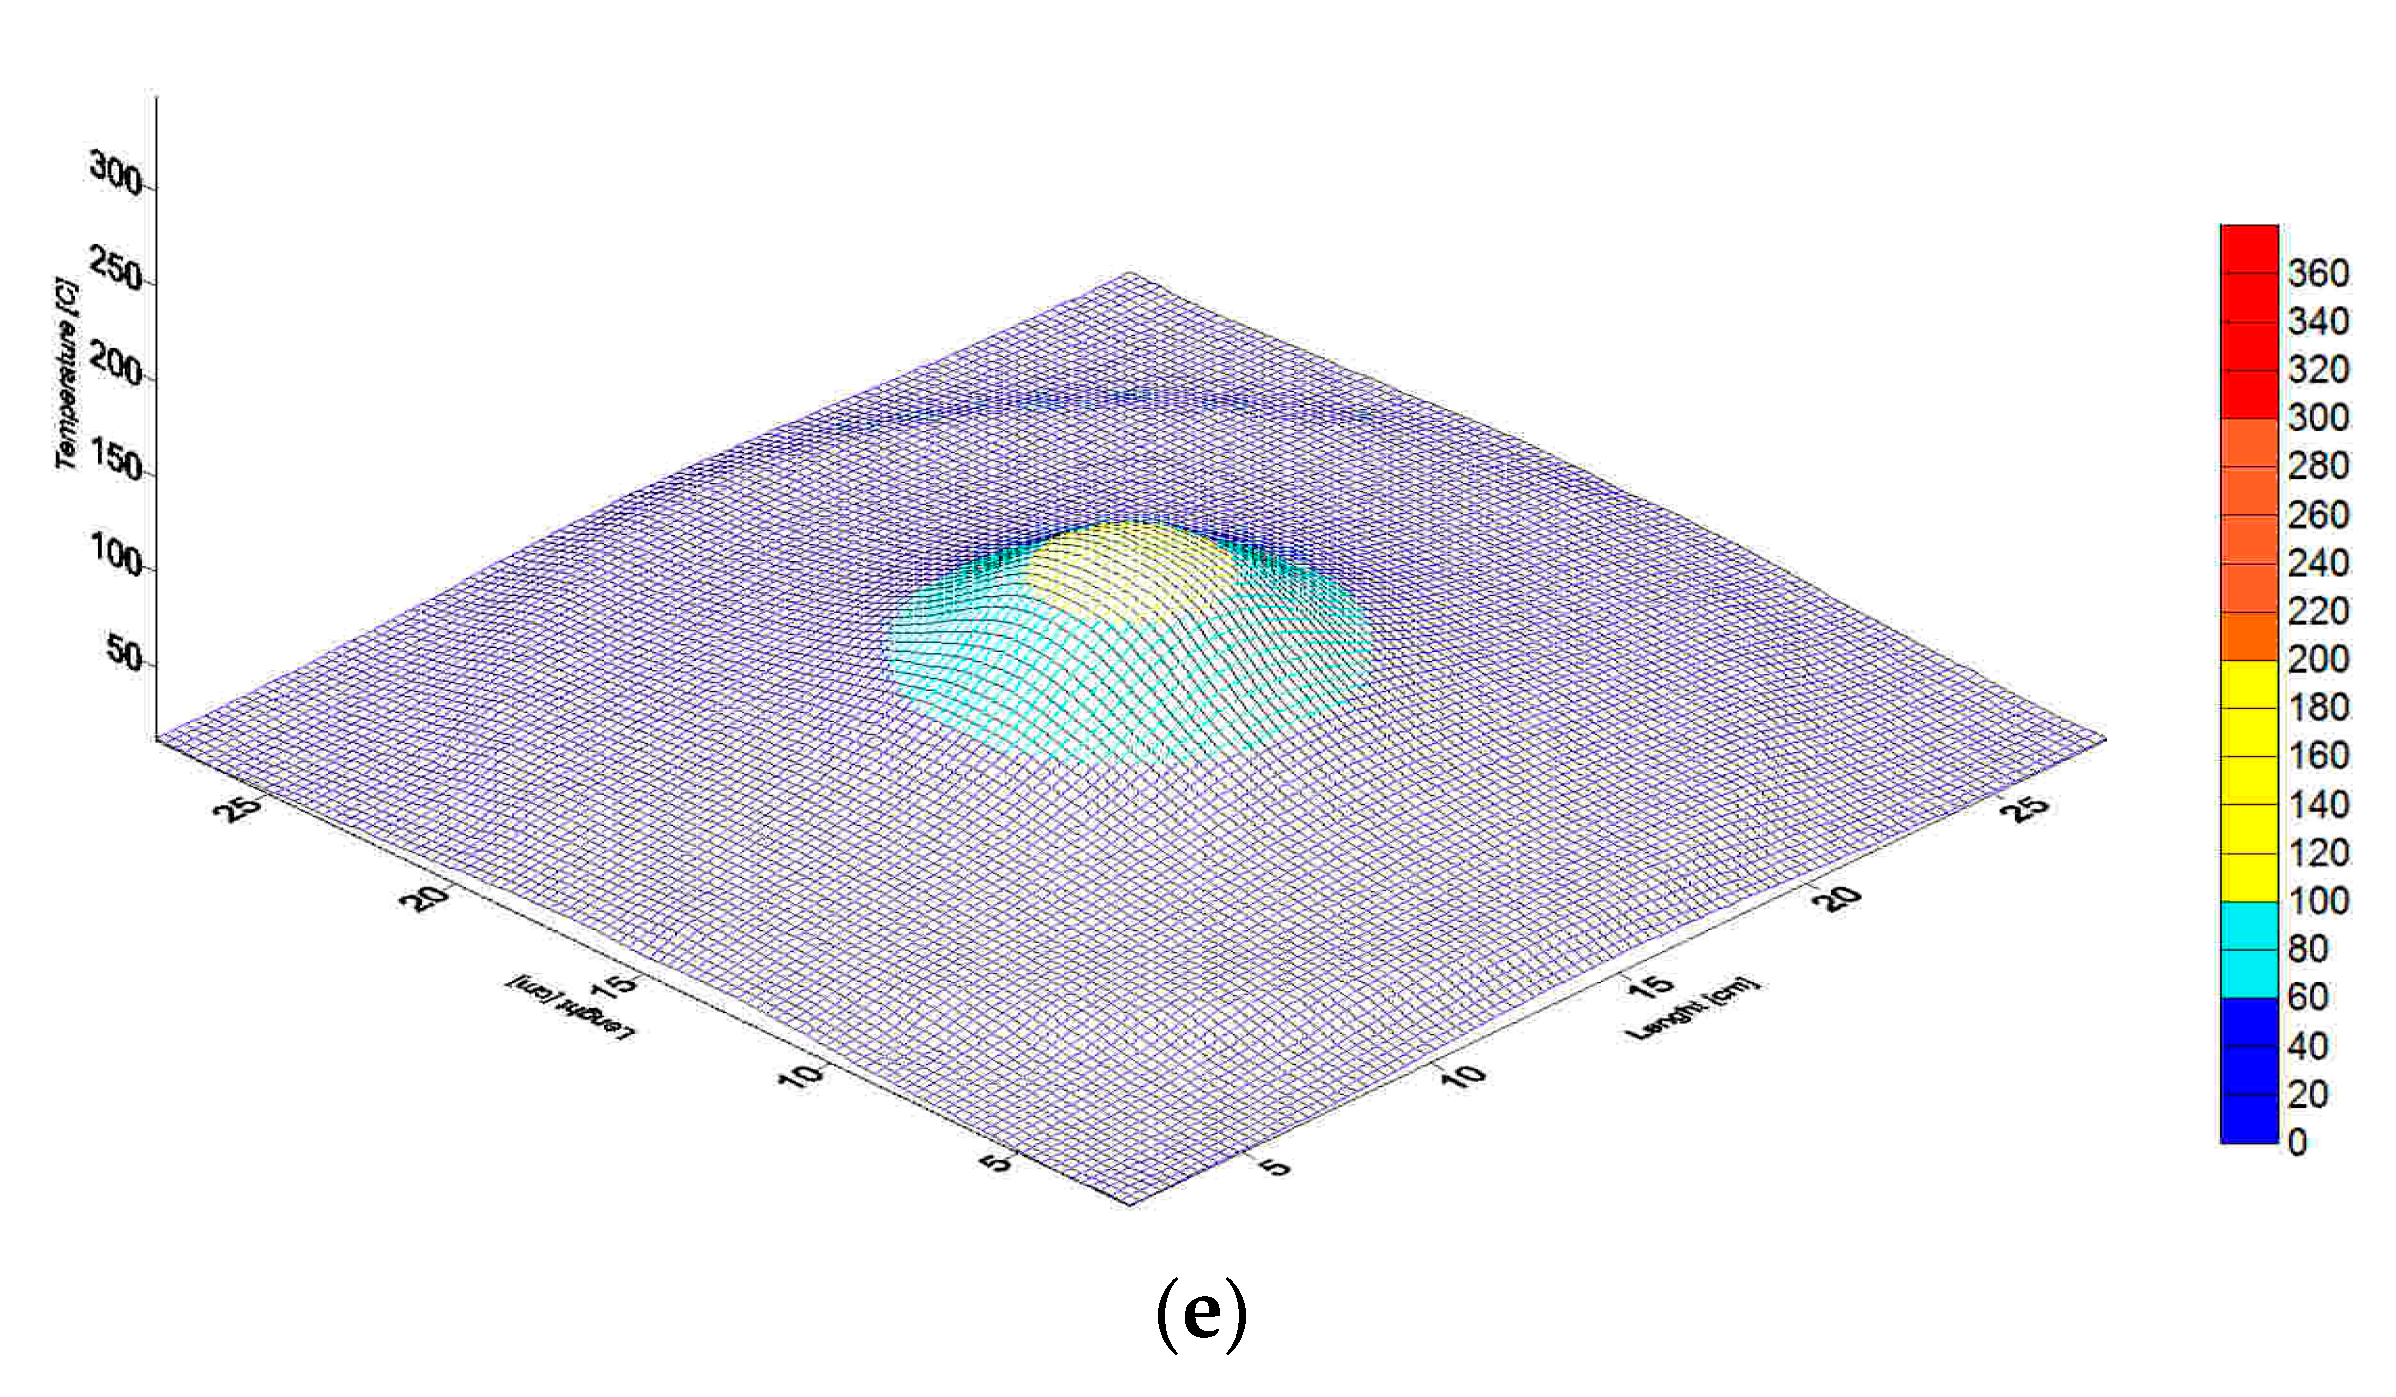
3.1. Temperature Changes

Figure 2 presents changes in the temperature for given measurements, both during heating and cooling. The bars illustrate the values of temperature measured by sensors 1–6. Measurement series 1–7 referred to heating with the temperature in the hot spot of: 35, 50, 100, 150, 200, 250, and 300 °C, while measurement series 8–13 correspond to cooling with the values of temperature in the hot spot of: 250, 200, 150, 100, 50, and 35 °C.
By analyzing changes in the temperature distribution during heating, rapidly increasing differences between measurements made by sensors were observed. For the temperature in the hot spot of 50 °C, the difference in temperature between sensors 1 and 2 was several °C. It gradually increased, reaching approximately 130 °C for the temperature in the hot spot of 300 °C. The difference in temperature between sensors 1 and 3 increased even faster, from approximately 25 °C, at the temperature of the hot spot of 50 °C, to approximately 250 °C, at the temperature of the hot spot of 300 °C. The distance between sensors 1 and 3 was only 60 mm, yet the difference was up to 250 °C. Such huge differences in temperature confirmed that hard coal has good insulating properties. The course and distribution of changes in temperature in heating-up coal confirmed that both in laboratory conditions and in actual conditions, for each moment of heating and cooling, the distribution was different. Hence, the percentage of coal at given temperatures changed. Figure 3 presents the distribution of temperature for sample 2 in the heating and cooling.
Previous assessments of fire hazard were based on quantitative analyses at a given temperature [5], assuming that the whole mass of coal has the same temperature. This is the point of reference for assessing the actual hazard level. Mathematical methods enabled the determination of percentages for consecutive measurement series. The calculated percentages for given temperatures enabled the determination of how much coal in the reactor falls in the assumed temperature ranges up to 50, 50–100, 100–150, 150–200, 200–250, and 250–300 °C.
Slow changes in the distribution of the coal temperature in the reactor were observed. For the temperature in the hot spot of 100 °C, the percentage of coal in the reactor below 50 °C was between 93 and 96%, for the hot spot temperature of 200 °C, it was between 66 and 82%, while for the temperature of 300 °C, the percentage of coal below 50 °C was between 55 and 71%. Analogically, changes in the percentage of coal in other ranges of temperature, such as 50–100, 100–150, 150–200, 200–250, and 250–300 °C, could be observed (Table 3).
An increase in the percentage of coal at lower ranges of temperature was observed during the temperature decrease. For the hot spot temperature of 200 °C, the percentage of coal below 50 °C was only between 62 and 76%, and for the temperature in the hot spot of 100 °C, it was between 80 and 89%. By comparing percentages for the same values of temperature in the hot spot for the heating phase and the cooling phase, significant differences in the distribution of given percentages could be observed. For all the coals, the average temperature in the cooling phase was higher in each of the sensors (Figure 2). The temperature measured with sensor no. 6, farthest from (120 mm) the core of heated coal, with a temperature of 300 °C in the hot spot, did not exceed 40 °C for any of the coals (Figure 2). This illustrates the very good insulation properties of coal.

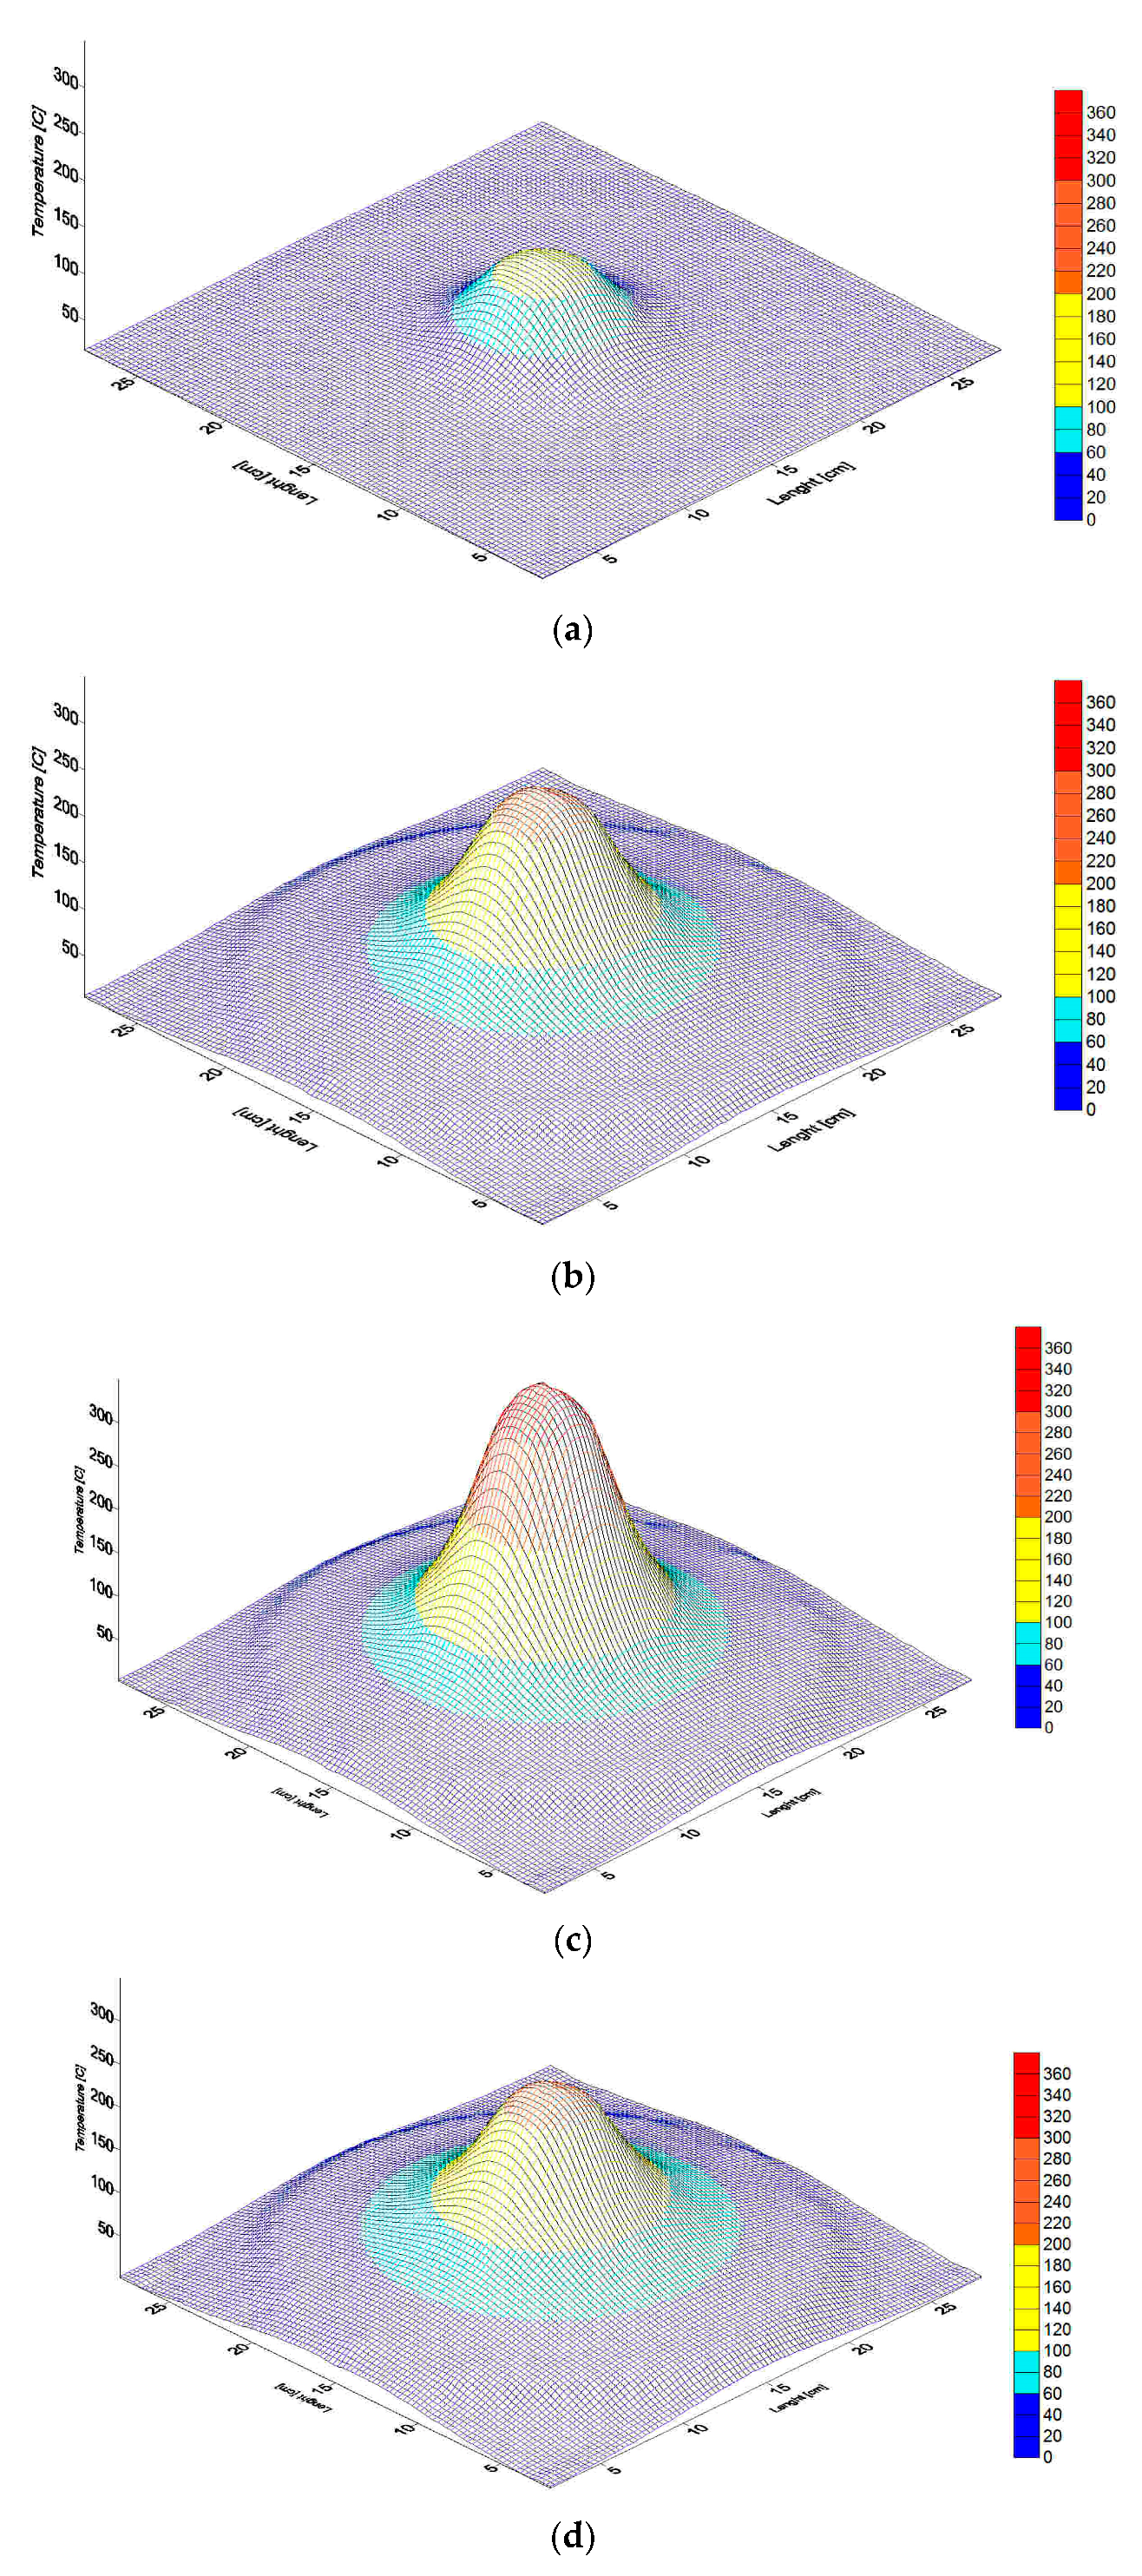
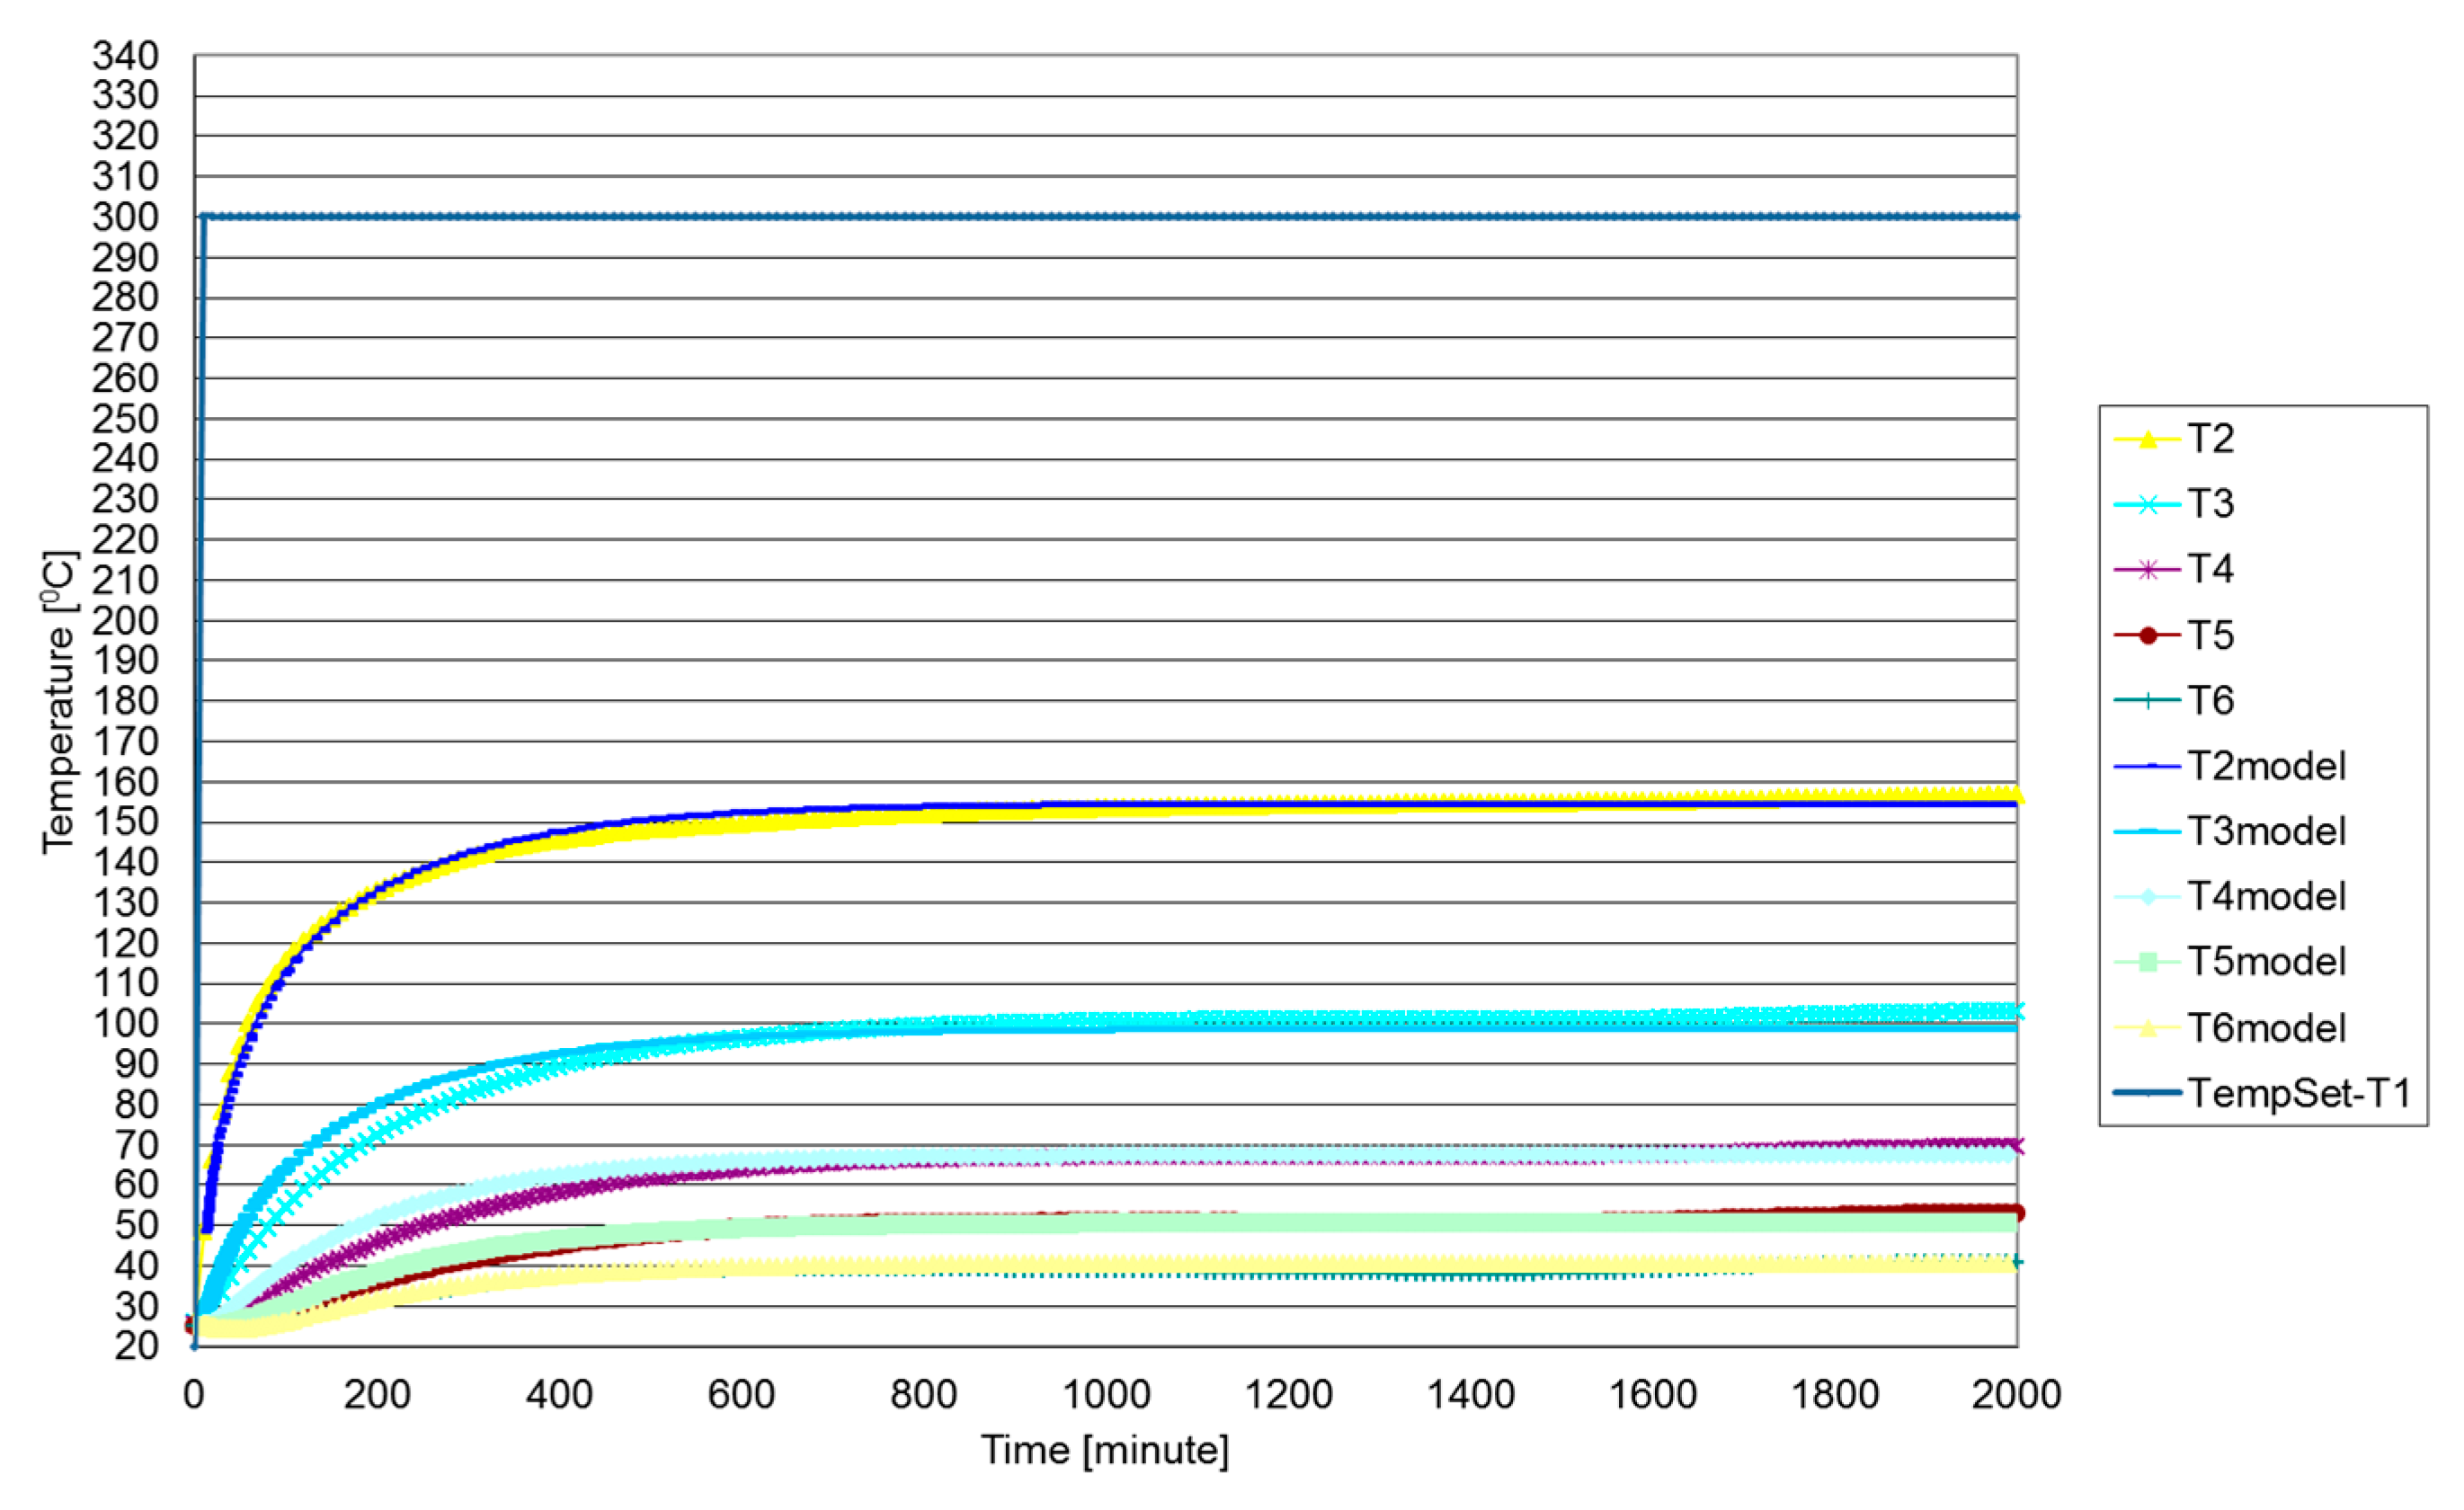
3.2. Simulation of Heating Process

The simulation was performed to check the mechanisms of heating provided by factors of the experiment, and for this reason, the non-stationary regime was taken. The temperature evolution during the heating process was modeled as a simplified radially symmetric inhomogeneous boundary value problem stated by the partial differential equation:
T t = α 1 r 2 r ( r 2 T r ) β ( T T out ) + q 0 e r 2 σ 2
as a function of time, t, on the interval, r ( 0 , R ) , with R = 125 mm, supplied with the initial T(0) = 27 °C and boundary conditions, r T ( R ) = b ( T T out ) , which states heat exchange with the outer medium, which has the temperature, T out = 22 °C, and coefficient, b = 0.25 mm−1.
The first term in Equation (3) represents the radial part of the Laplace operator acting on the temperature field, 2 T = divgrad T , multiplied by the thermal diffusivity, α = 12.2 mm2·min−1. The second term describes the bulk cooling by the airflow through the coal powder with the coefficient equal to β = 1.8 × 10⁻³ min−1. The third term mimics the constantly operating heater; the amplitude coefficient, q0 = 8.61 °C·min−1, and the dispersion parameter, σ = 31 mm, which is close to the arithmetic mean of the heating coil radius and height. Note that it is the most approximate part of the model since the full realistic simulation should include a detailed 3D imitation that is outside of the main aim of this work. However, even the approximation of the heat source as a spherical one gives a sufficiently reasonable approximation in the region outside of the heating spot, which is the main area of interest, and allows for the analysis of principal heat flow processes. As the initial conditions for the boundary problem stated above, the distribution of temperatures measured by the sensor at time, t = 10 min, fitted by the cubic spline interpolation was used, as shown in Appendix A.
Note also that all numerical values for the parameters of Equation (3) (except geometric quantities) listed above were not derived from material properties of the setup and the filling substance, but fitted via an adjustment of simulated and experimental data for the whole set of temperatures and spatial locations minimizing absolute pair-wise differences between them. This is motivated by the primarily goal of such a simulation: To analyze the sufficiency of the processes considered, but not to develop methods for estimating constants, which cannot be defined by the direct measurements. Figure 4 shows the results of modeling in comparison with the experimental records, including the transient regime. One can see a quite satisfactory reproduction of temperature growth curves and the final steady state distribution. There are only two time ranges for two sensors, where the calculated temperature visibly deviated from the actual one, but this deviation does not exceed Tout = 6 °C during an active non-stationary growth; furthermore, the agreement goes to a practically perfect correspondence. These localized features originate from the reason mentioned above: Sensors, T3 and T4, are located in the spatial region, which is most affected by the radial asymmetry of the heating coil. Its replacement by a wider (but shorter) effective heat source results in faster temperature growth due to closeness to the heat source and more uniform instant heat isotropic flows. However, after a while, this instant realistic anisotropy is compensated via the heat conduction processes and the predicted spatially isotropic temperature curve tends to the time equilibrated experimental one. This conclusion is also supported by good agreement with the data registered by sensor T2, which is close to the heat source and the latter provides the main input into the temperature dynamics, and by the sensors, T5 and T6, located closely to the boundaries of the spherical chamber; therefore, certain anisotropy of the heat source can be neglected.
Thus, we can conclude that the linear thermophysical model, with the heat source, the heat sink due to the airflow, and the thermal conductivity stated by Equation (3), is sufficient to describe the thermal part of the problem and it does not require introducing any non-linear reaction-diffusion coupling, i.e., the gas production by the heated coal can be discussed as a consequence of the thermal state without a backward loop influence on the thermal problem.

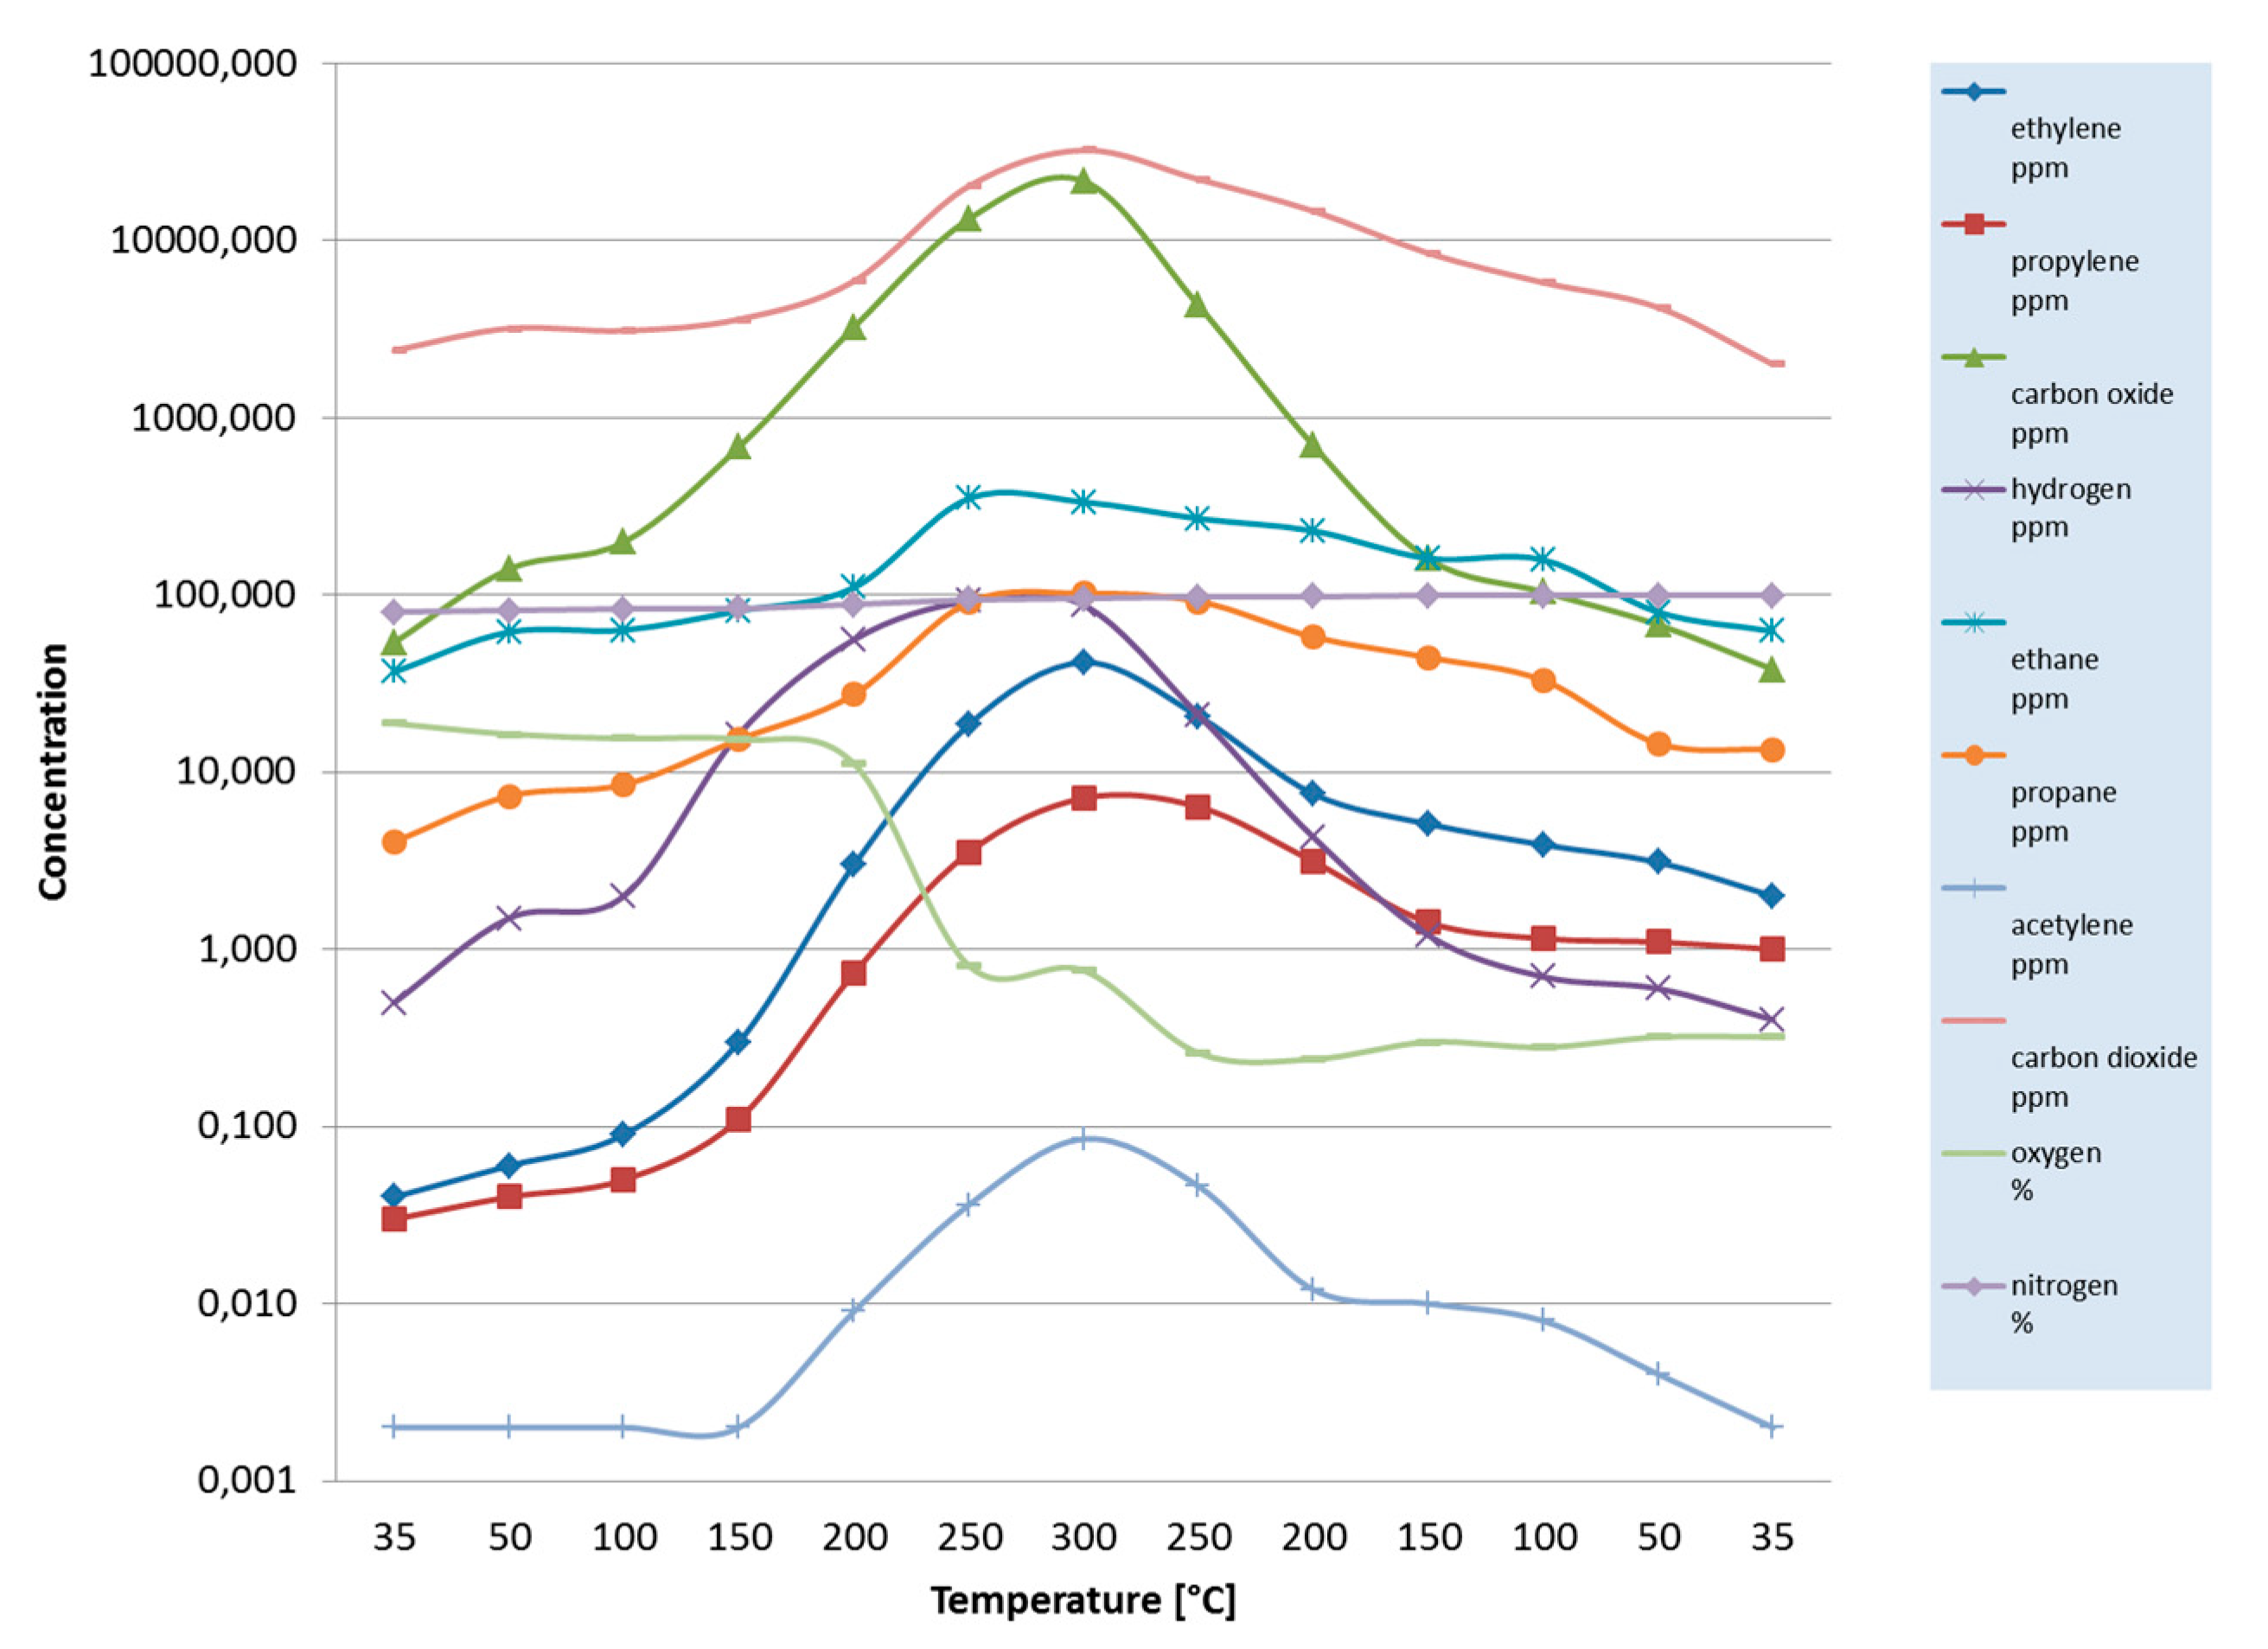
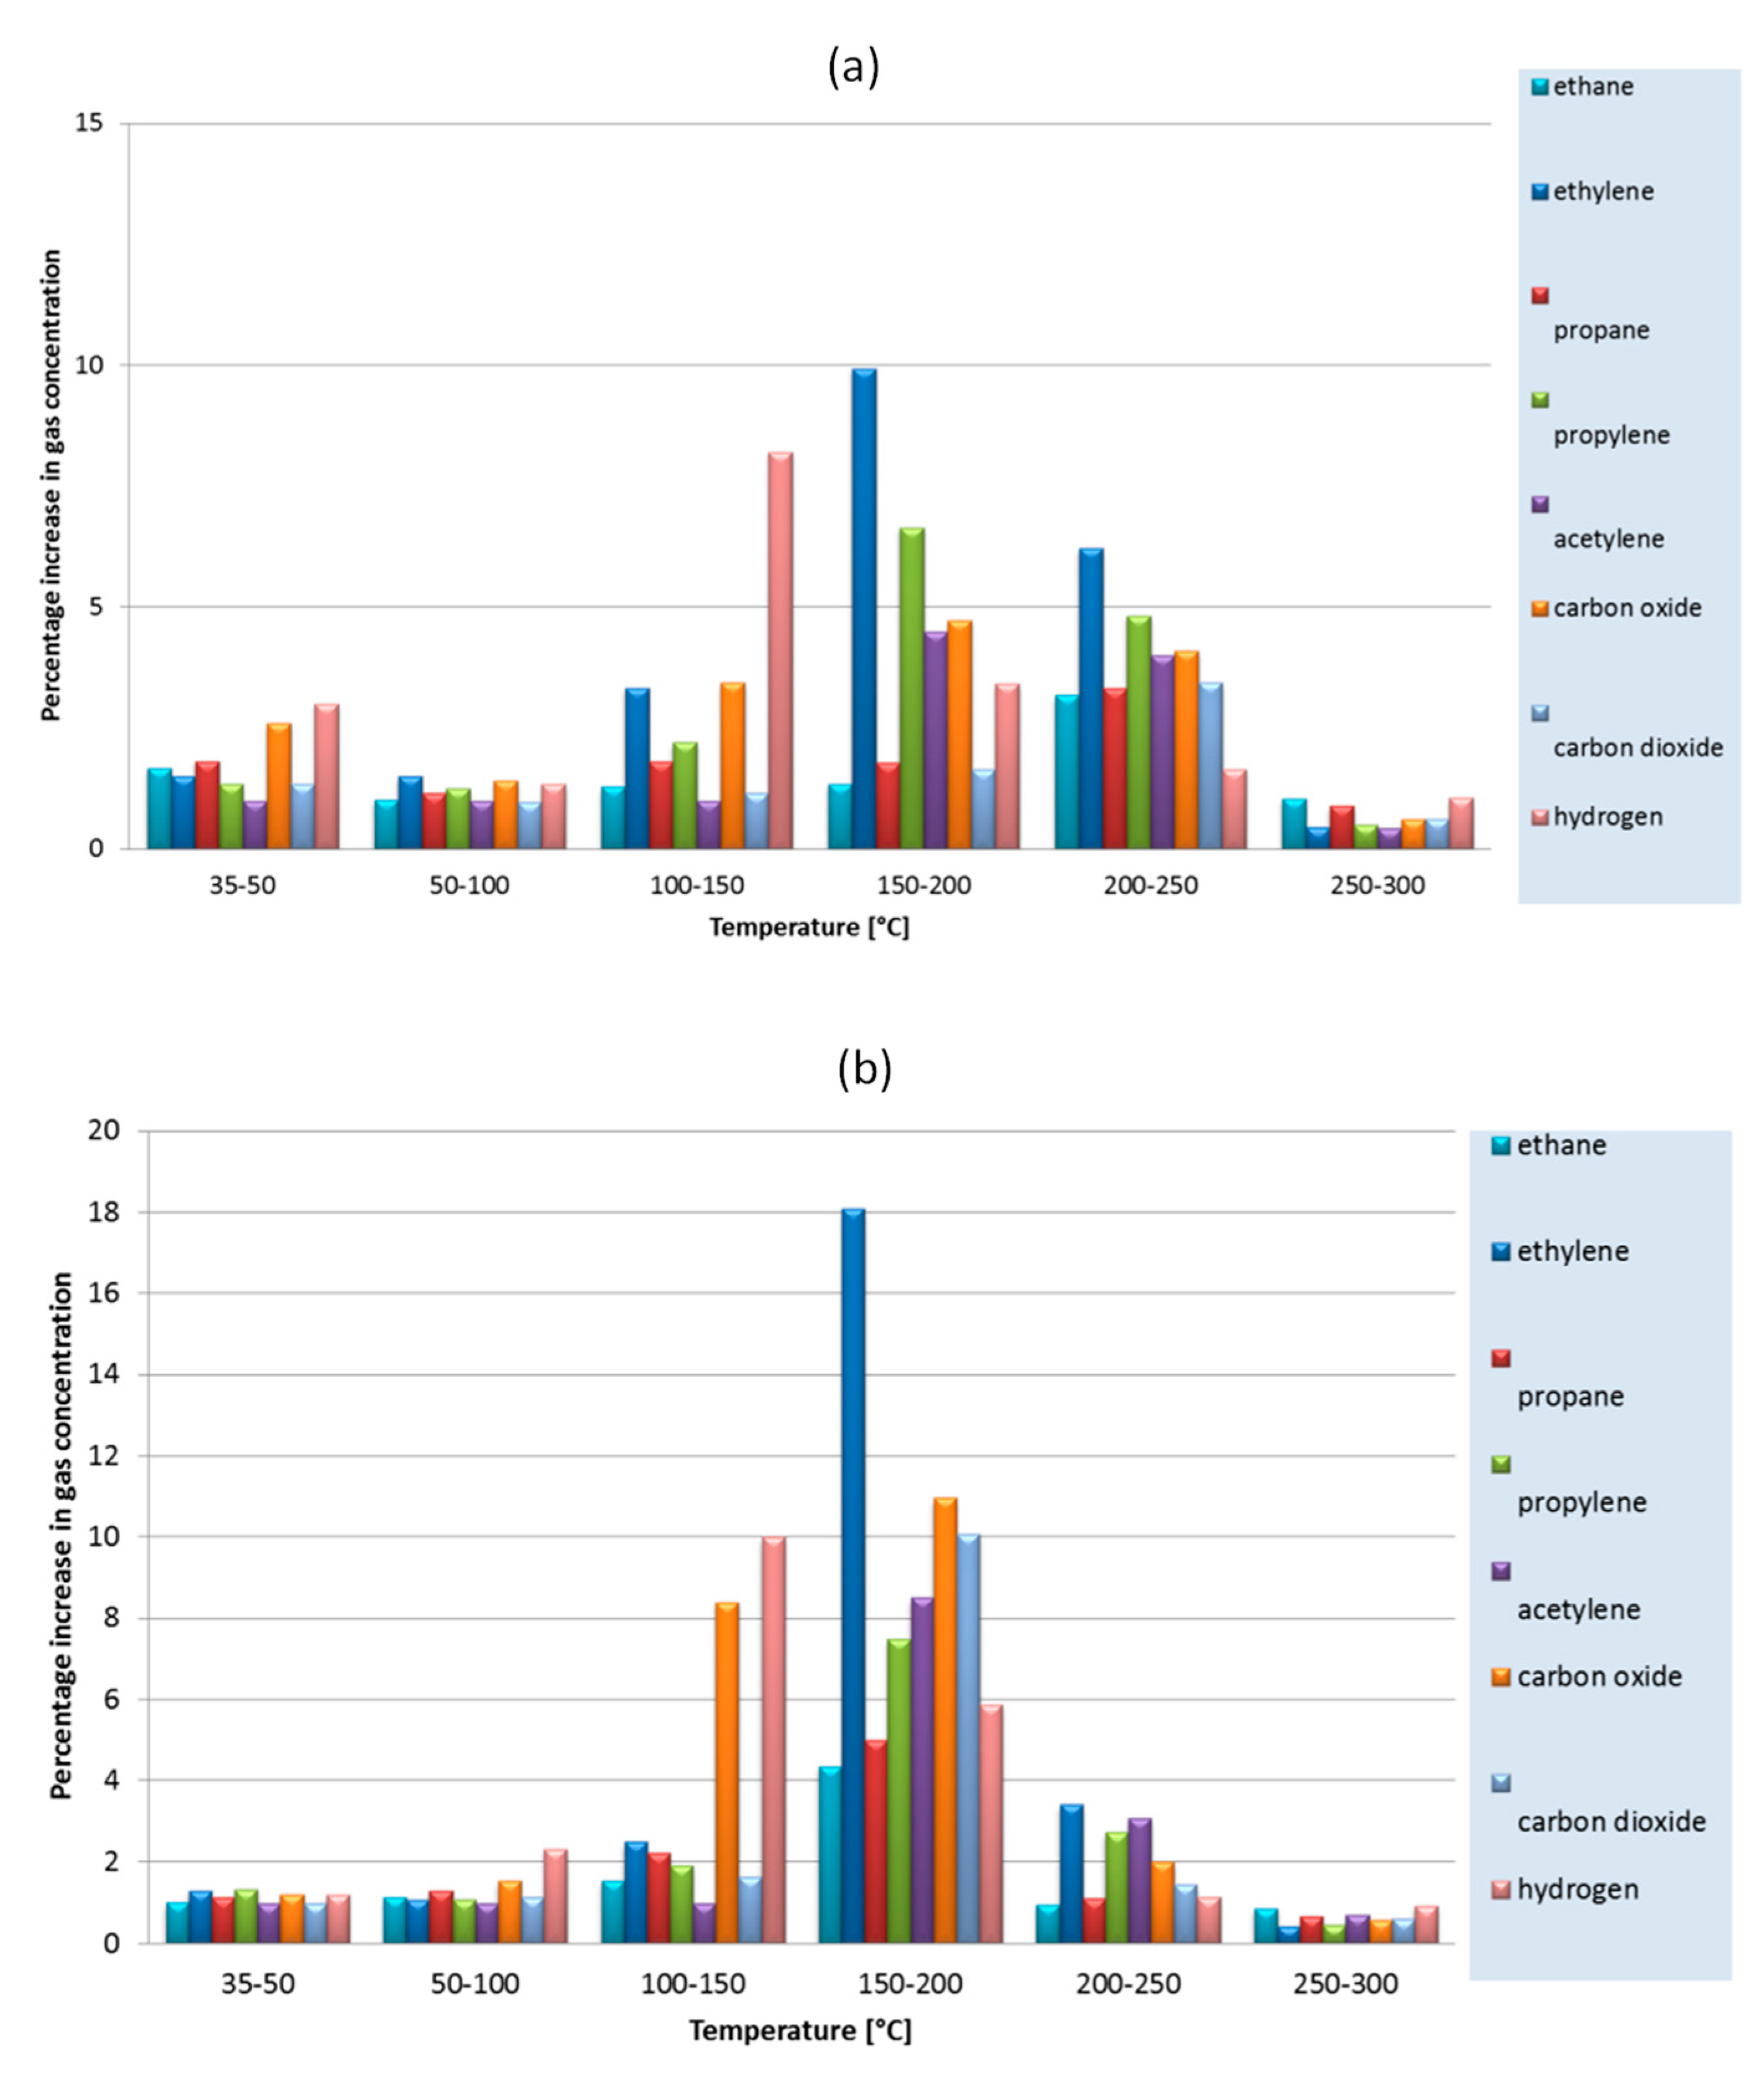
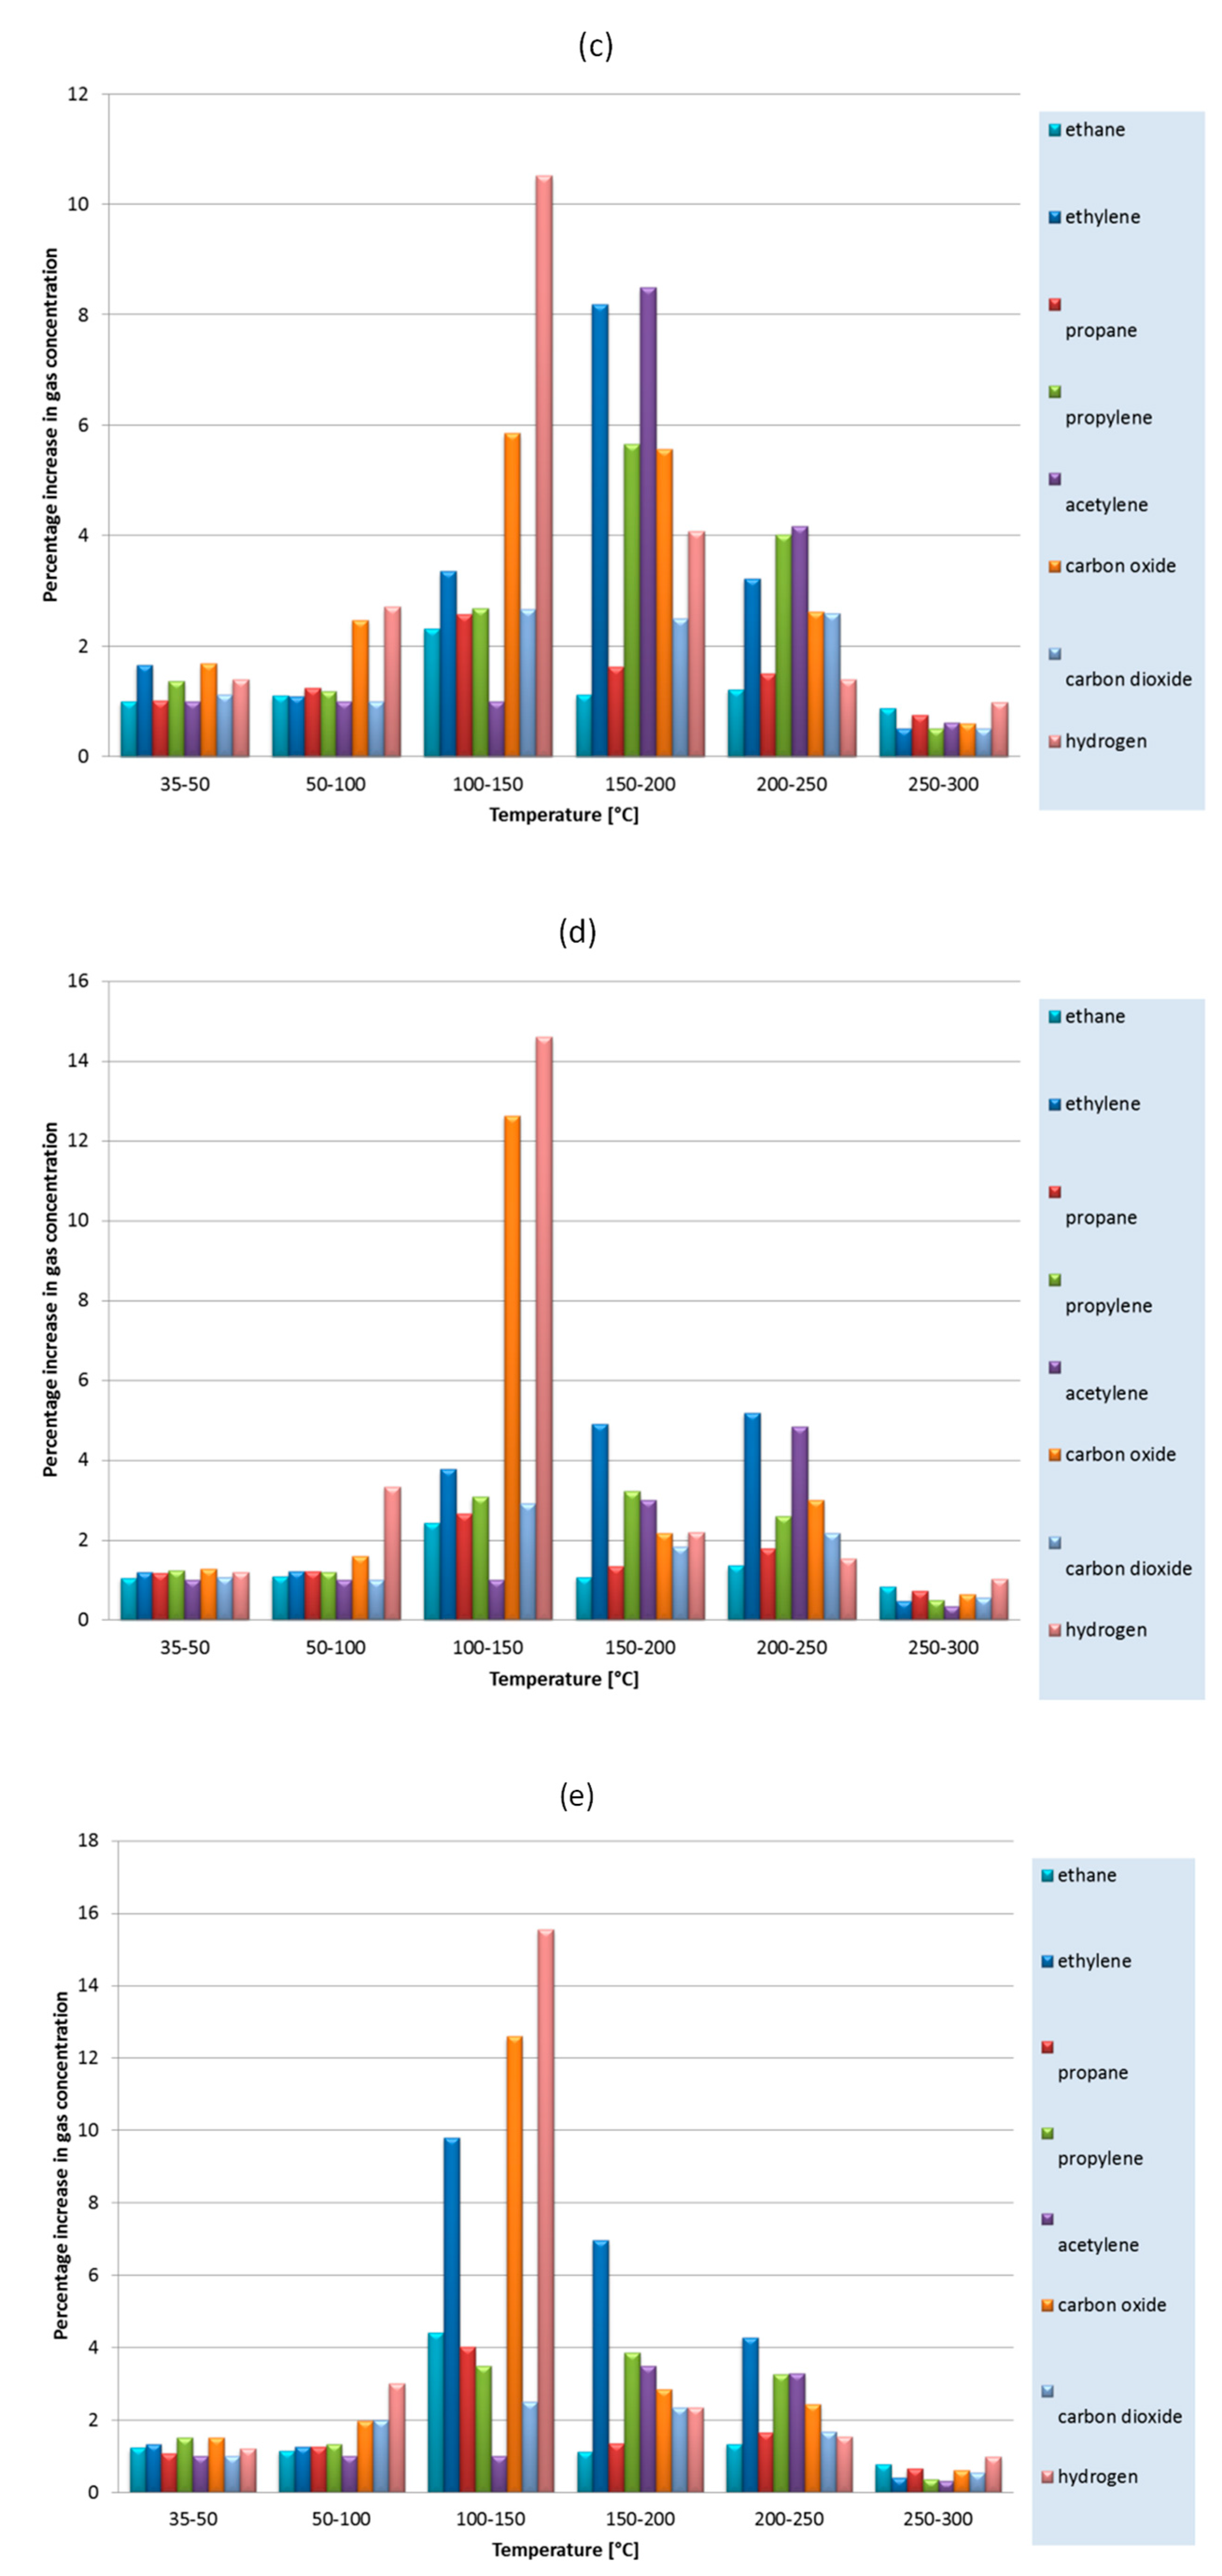
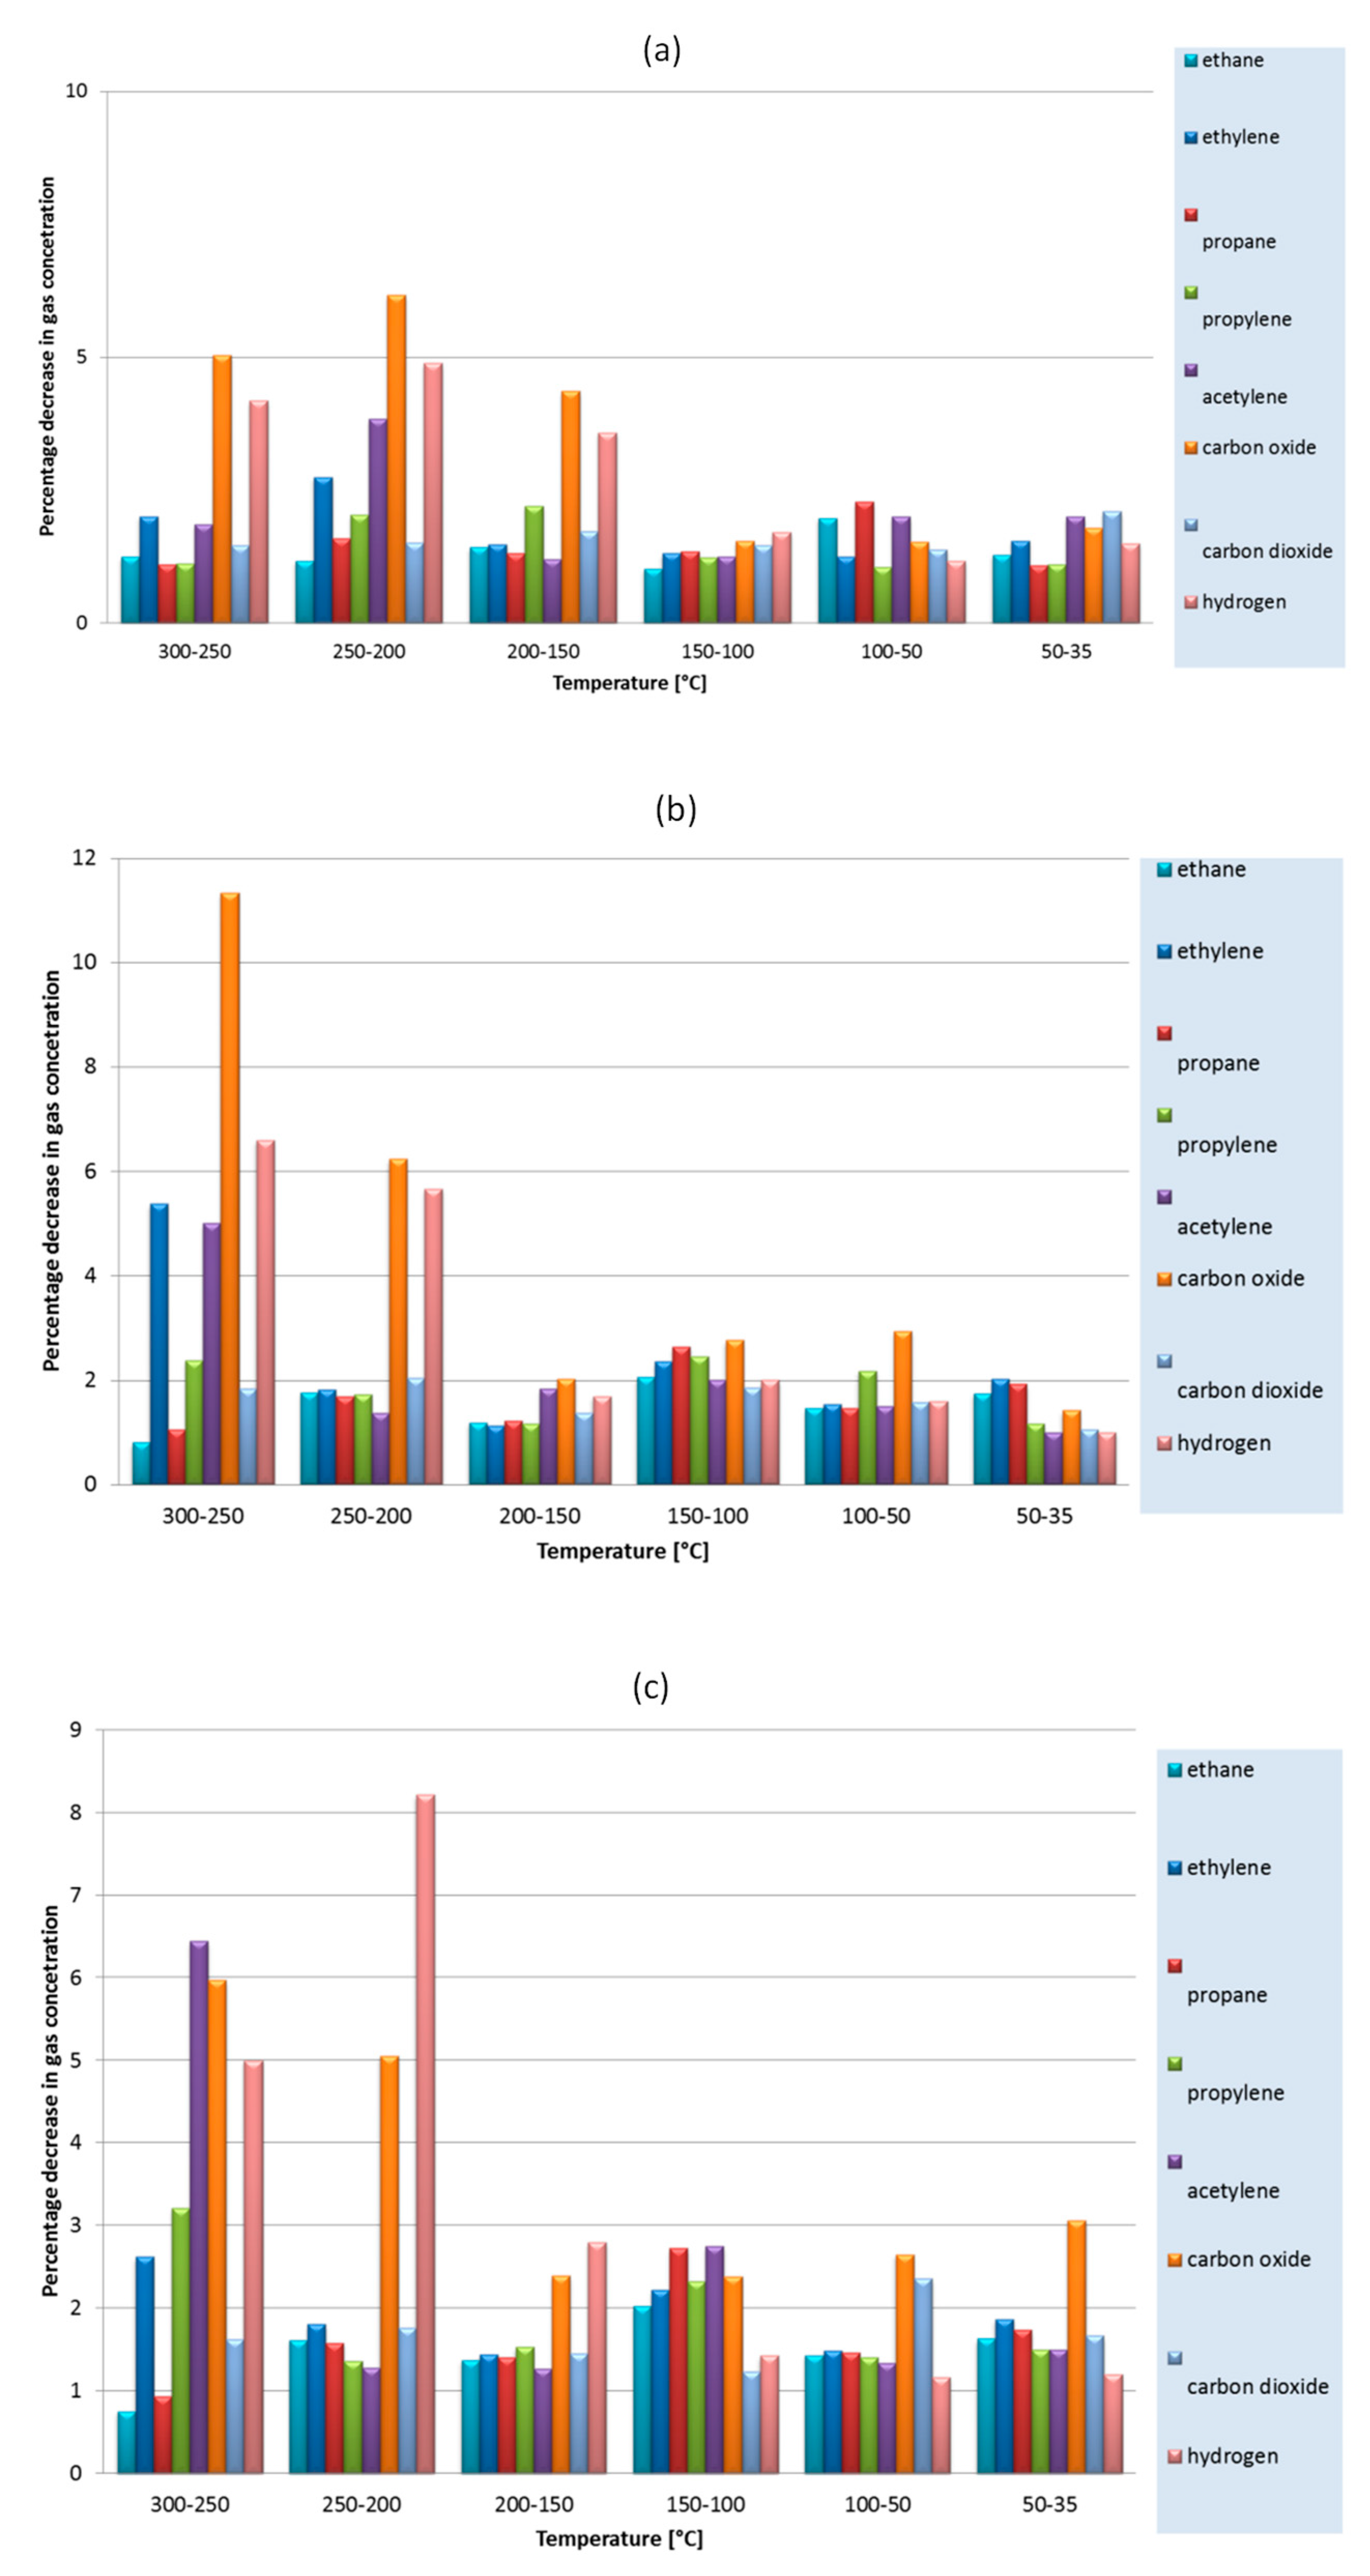
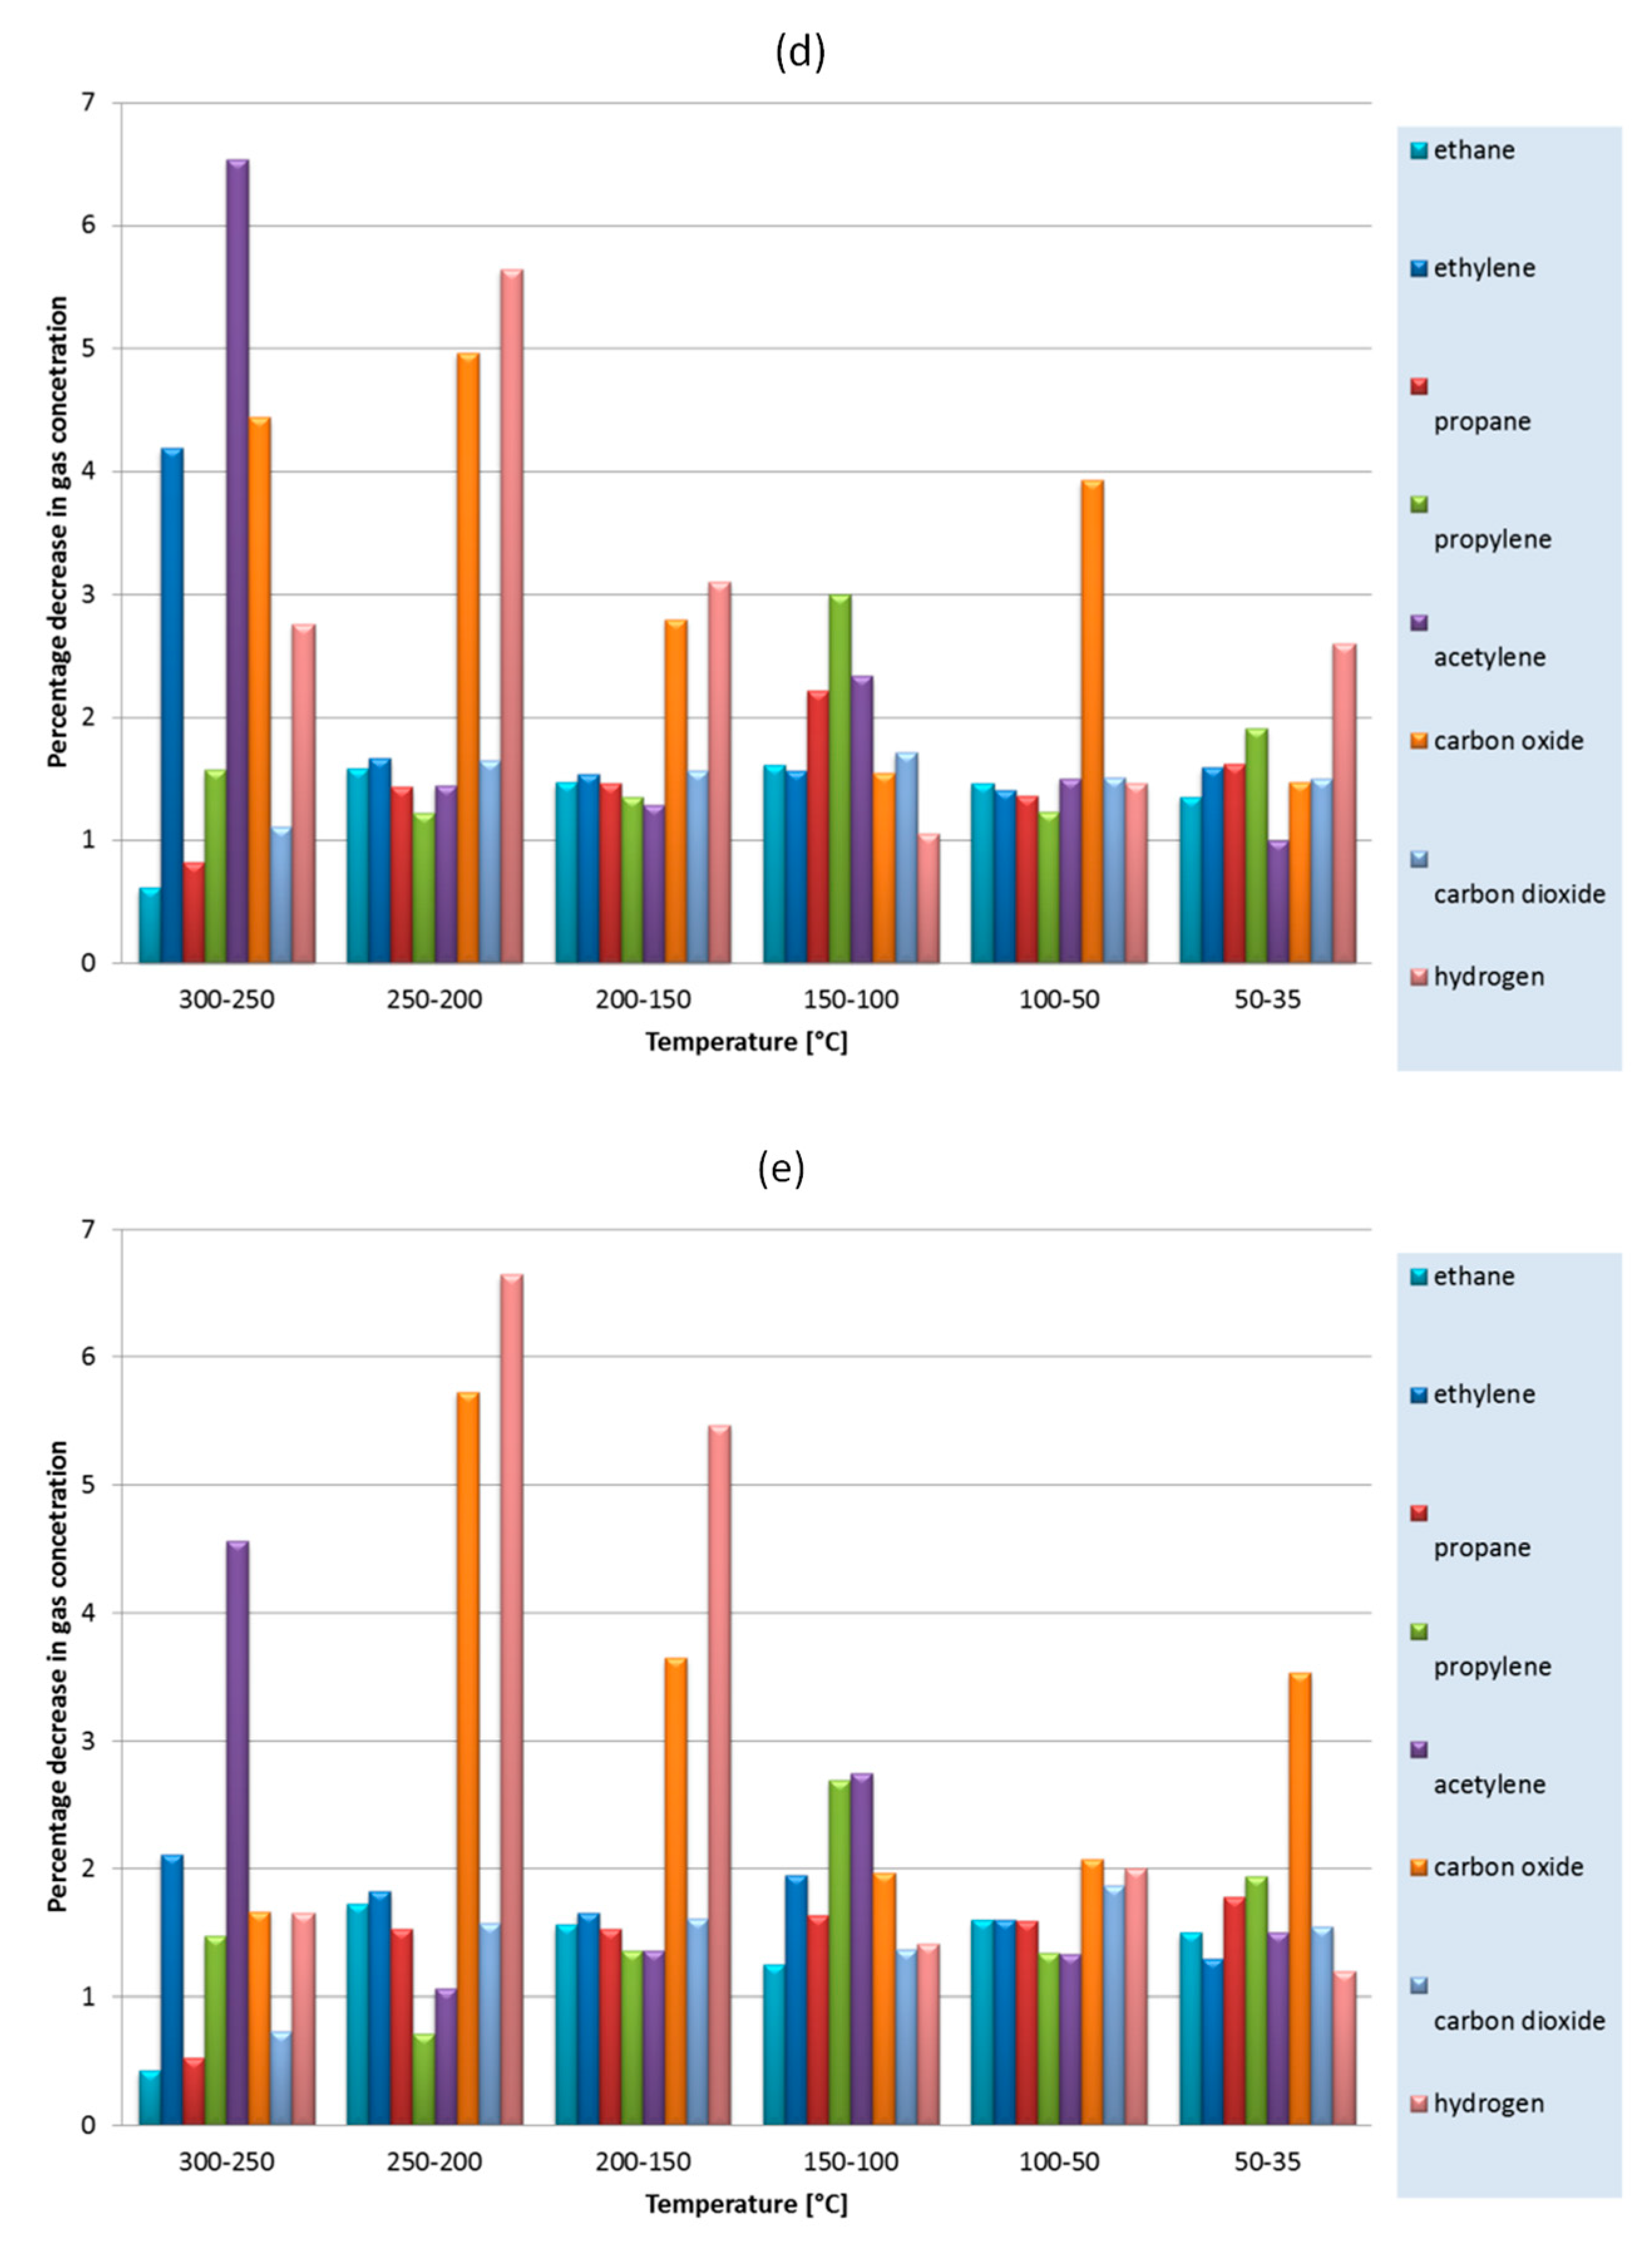
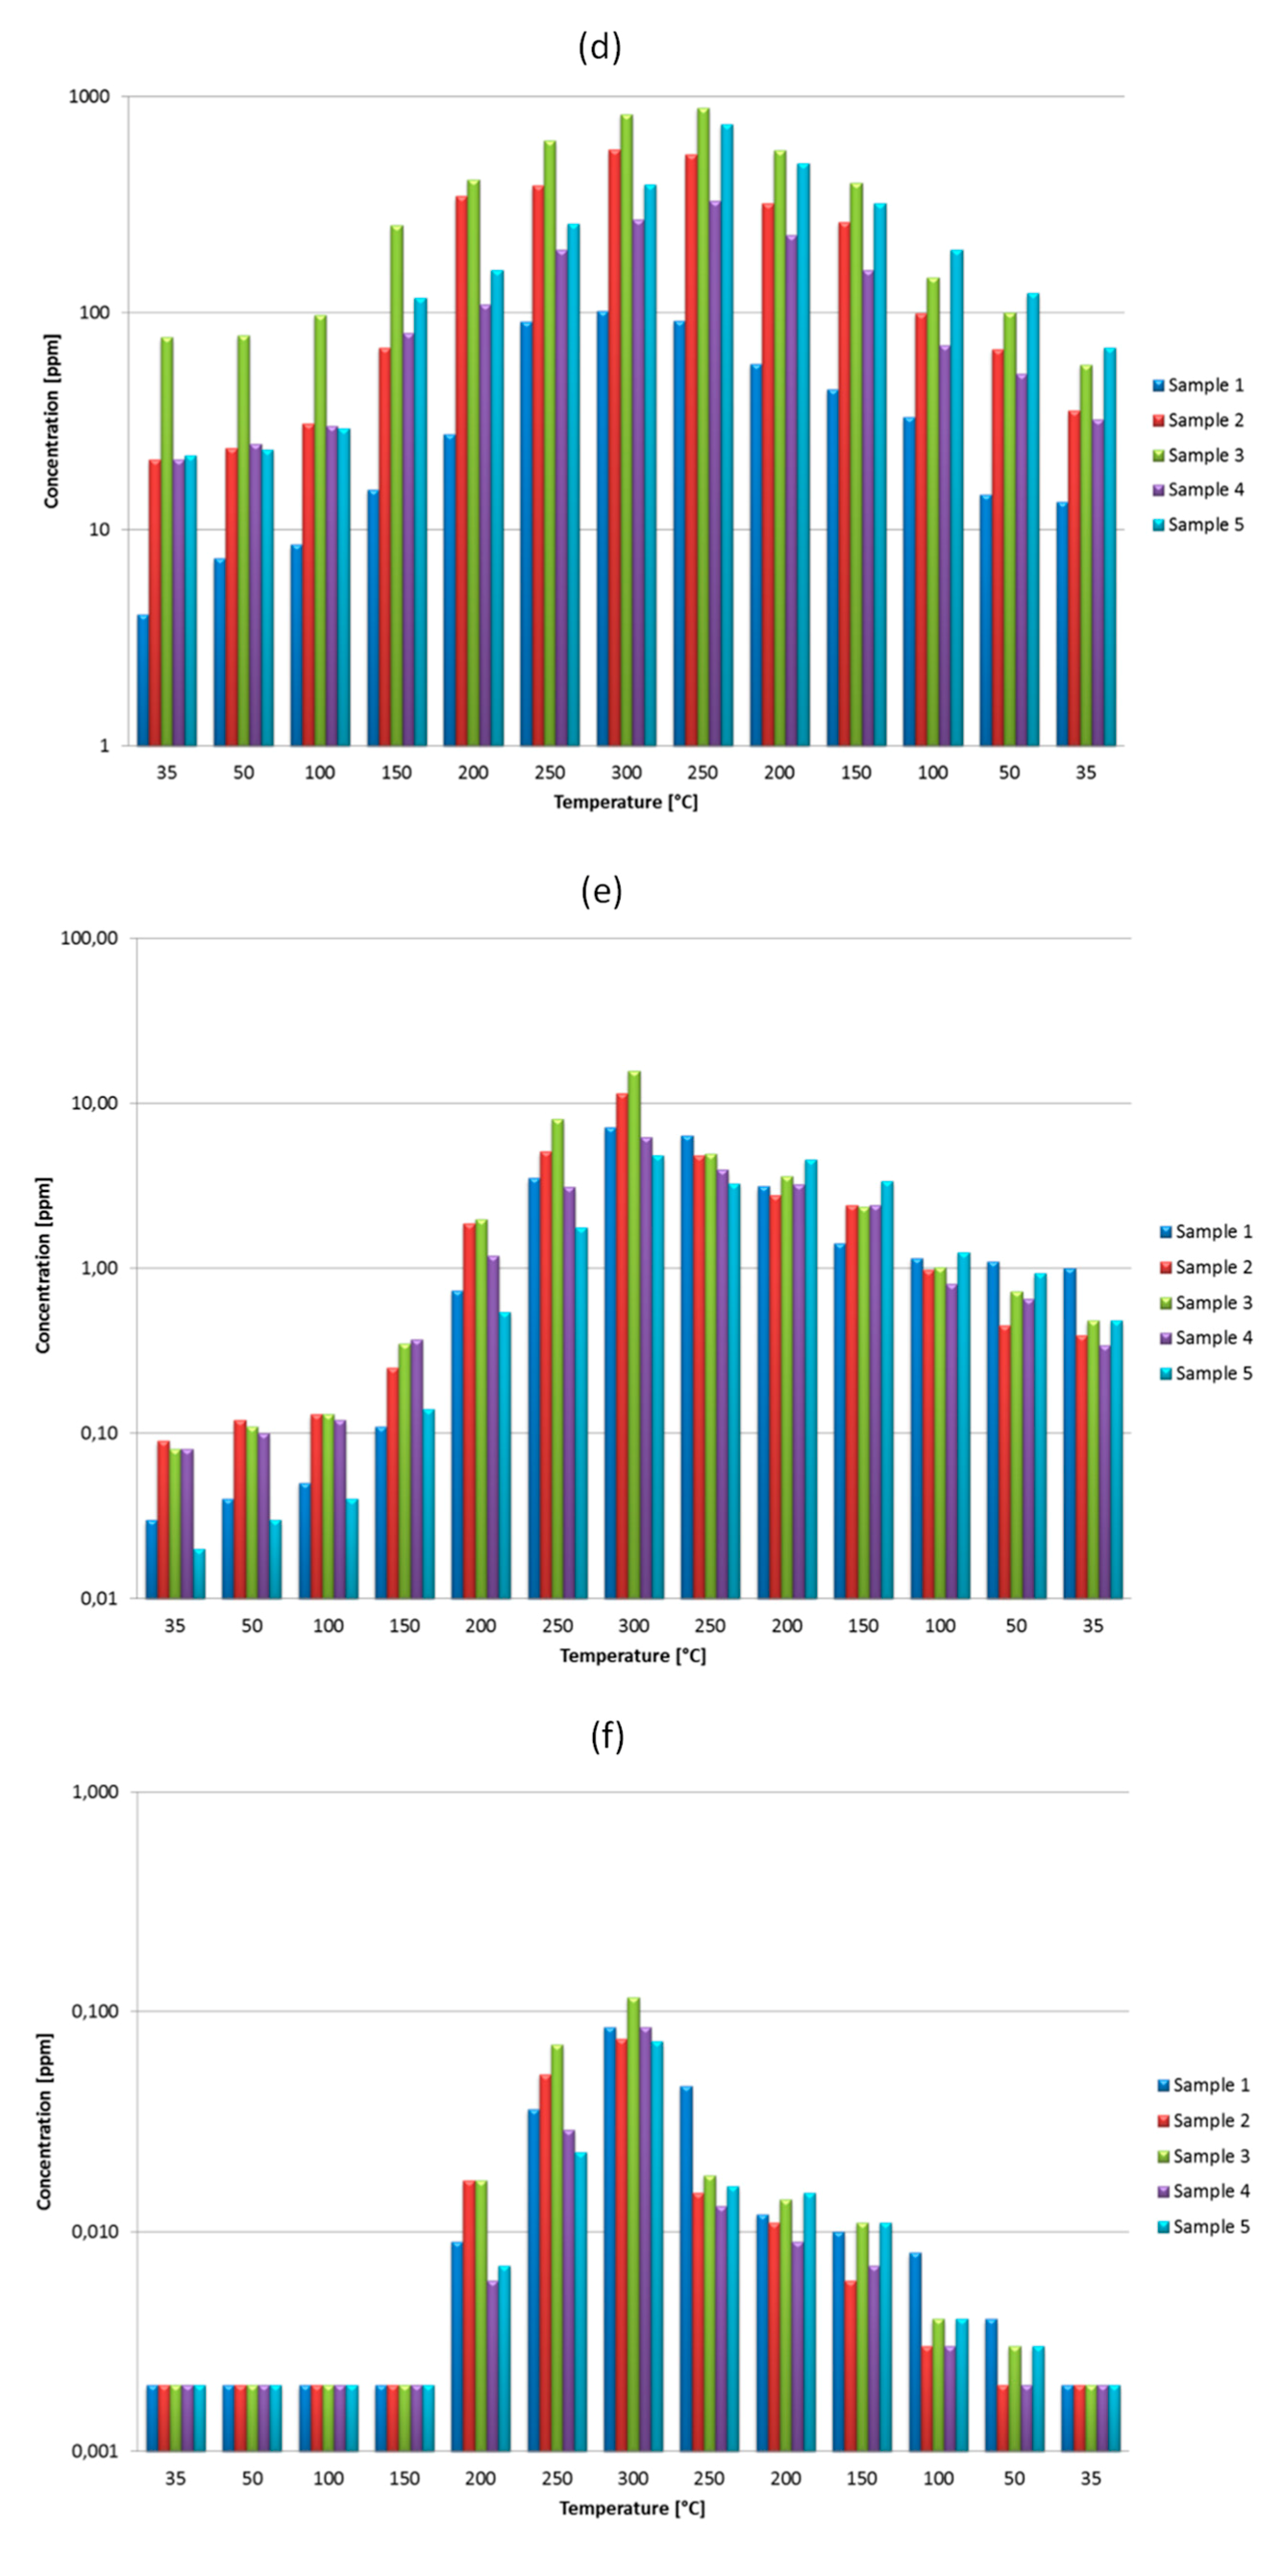
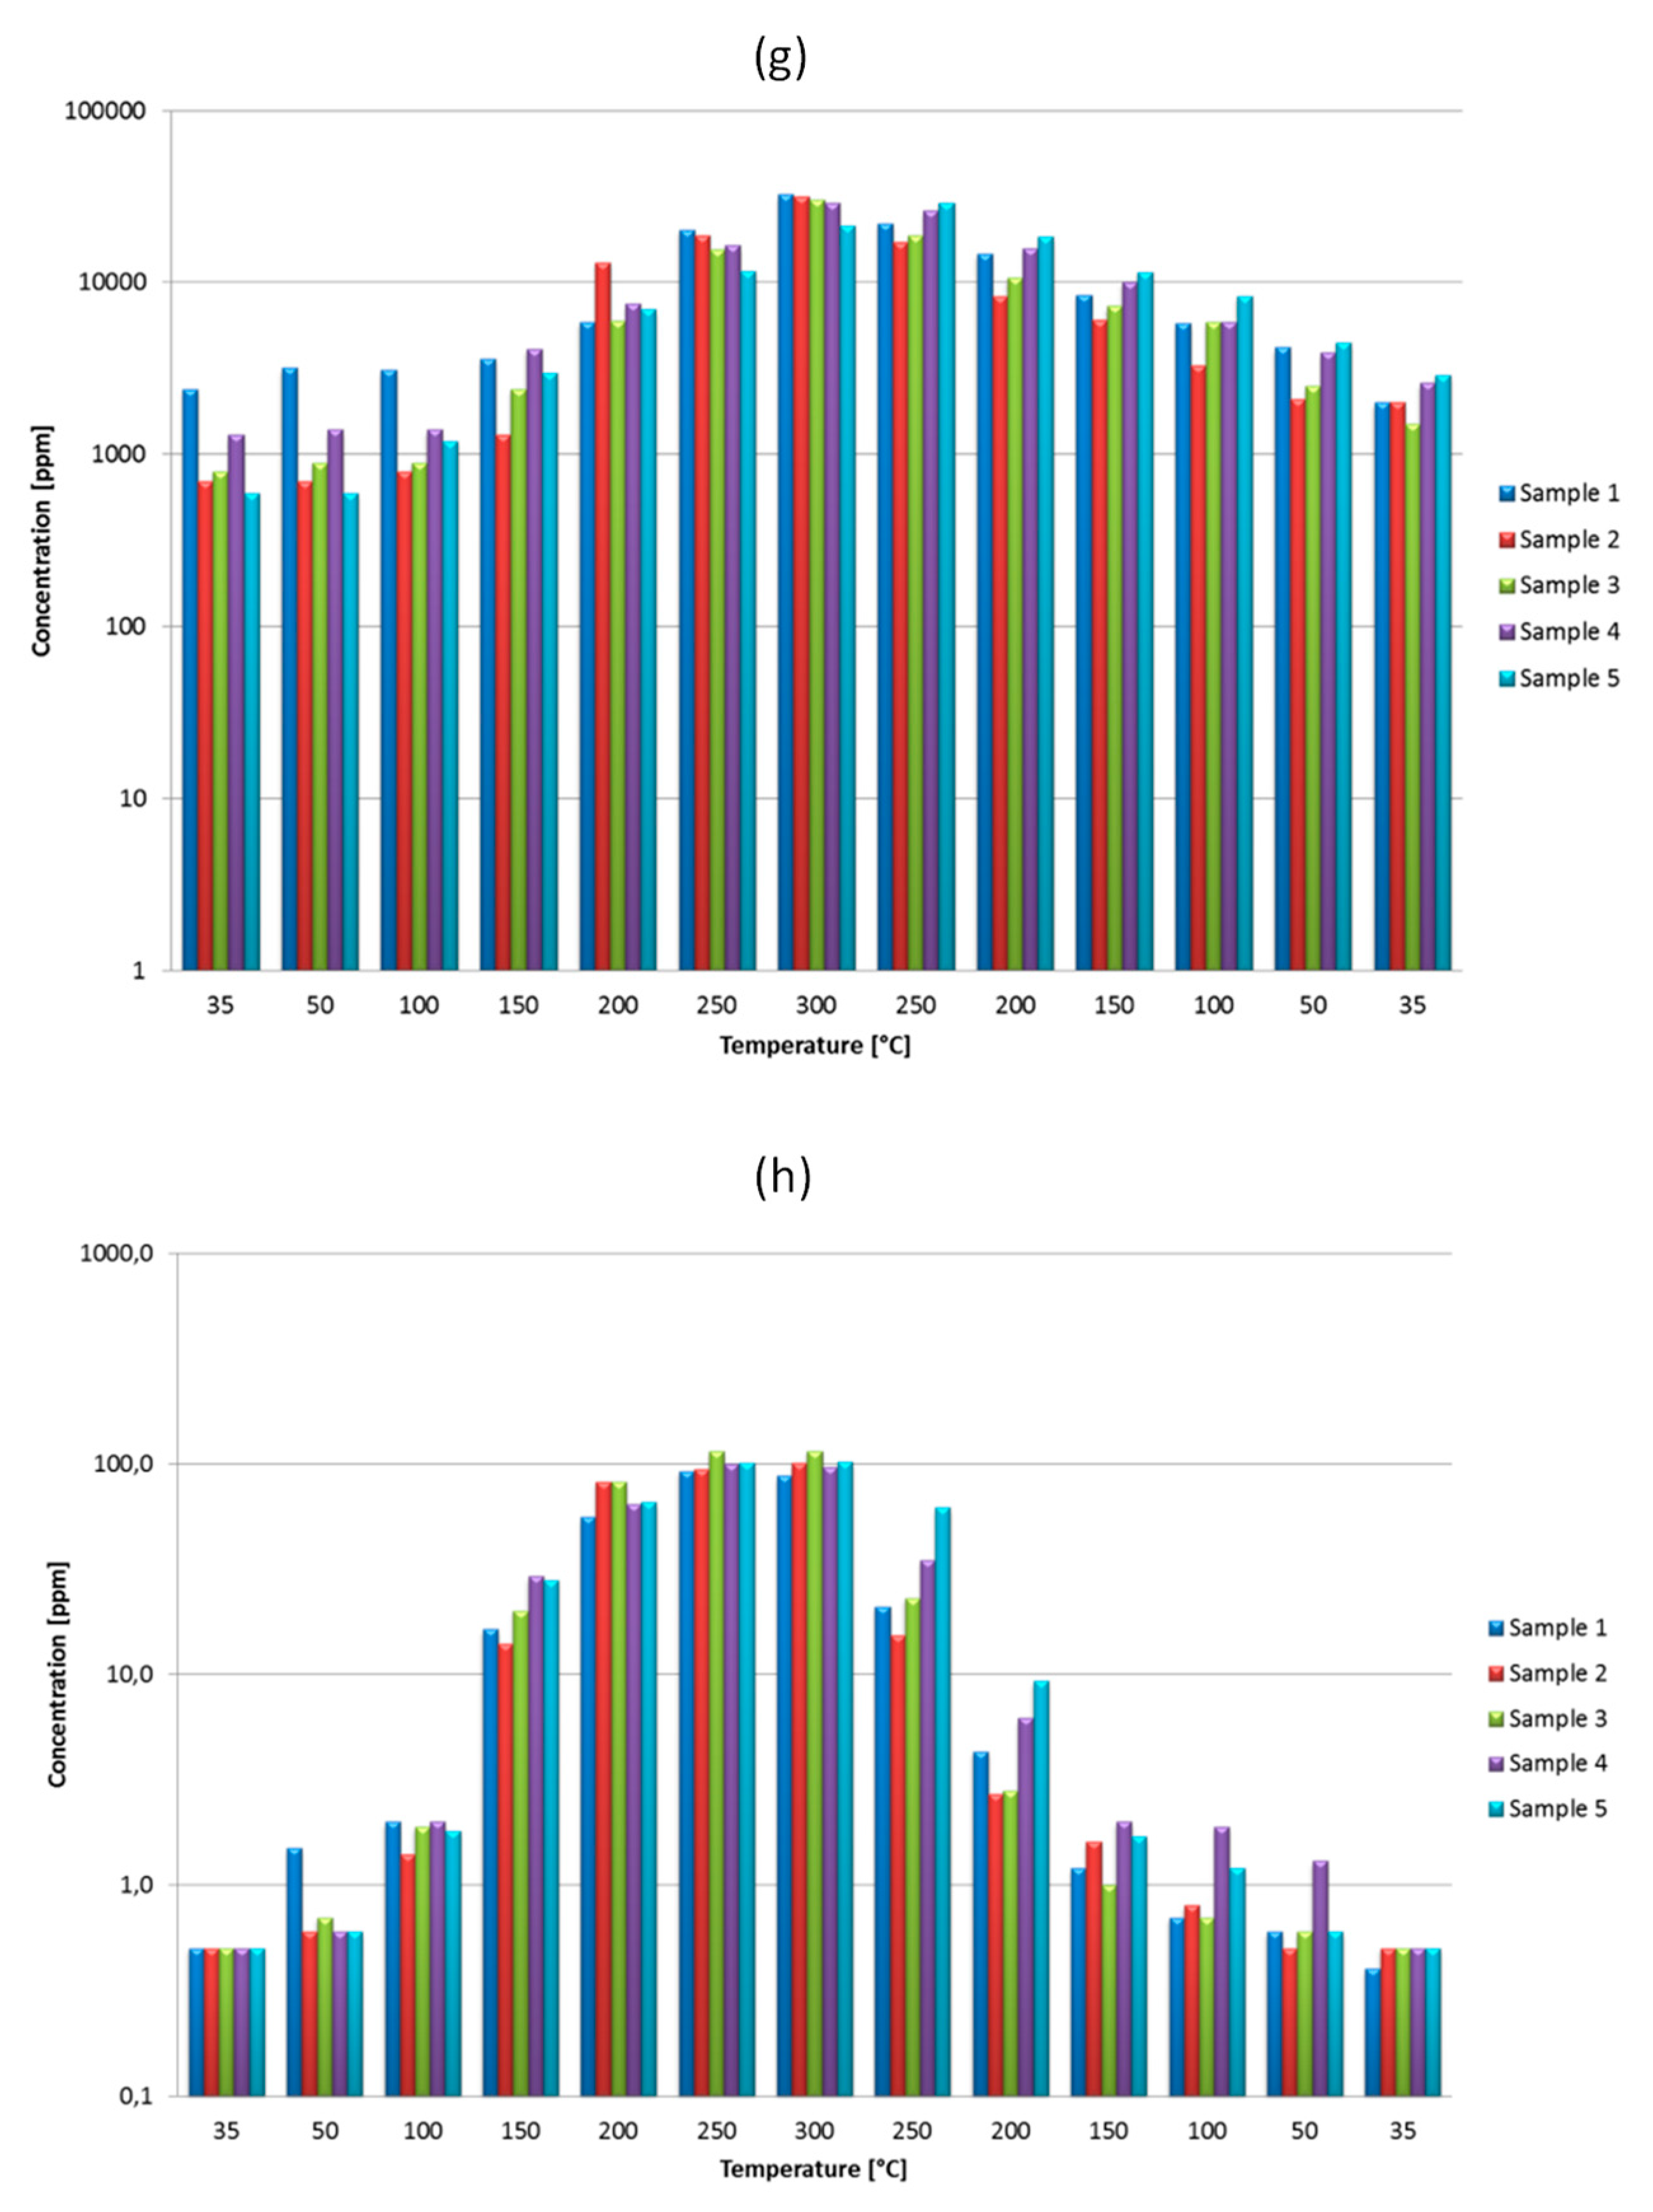
3.3. Gas Concentration Changes

In Polish hard coal mining, the level of fire hazard is obligatorily determined by the increase in carbon monoxide and the index of carbon monoxide volume (L/min). Results of the analyses are applied to determine the Graham index. Additionally, a calorimetric-chromatographic method is applied to expand fire hazard assessment [20]. Following an increase in the temperature in the hot spot of the heating coal, concentrations of carbon monoxide, ethane, ethylene, propane, propylene, hydrogen, acetylene, and carbon dioxide increase, while oxygen content decreases [3,14,16,17,22,23]. When the temperature in coal drops, concentrations of carbon monoxide, ethane, ethylene, propane, propylene, hydrogen, acetylene, and carbon dioxide demonstrate a decreasing tendency. It is significantly harder to assess heating during the initial and final stage, due to very low values of concentrations in comparison with the concentrations observed at high temperatures. Significant differences in concentrations between given gases do not make the observations any easier. Application of the logarithmic scale to assess fire hazard enabled the simultaneous observation of all the gases. Figure 5 presents changes in gas concentrations during the heating and cooling of coal sample 1.
Research conducted by Chamberlain et al. [24] on coal oxidation in laboratory conditions confirmed the order in which products of coal oxidation occur. The dependence of gas concentrations on temperature showed that the first to oxidize is carbon monoxide, followed by hydrogen, propylene, and ethylene. Based on the conducted research, it was concluded that virtually all of the gases, except acetylene, occurred at the temperature of 35 °C. The detection limit of acetylene is 0.002 ppm and most probably through increasing the accuracy of detection it will also be possible to observe changes in its concentration. Figure 6 and Figure 7 present the rate of changes in the concentrations of given gases.
The dynamics of gas concentration increase was the highest for the temperature ranges of 100–150 °C and 150–200 °C. Gases of the highest change dynamics facilitate the monitoring of the fire hazard. For coal samples 1 and 5, the lowest increases were measured for ethane, propane, and carbon dioxide, and the highest for ethylene, propylene, hydrogen, and carbon monoxide.
For coal samples 2, 3, and 4, the lowest increases were measured for ethane and propane, and the highest for ethylene, carbon monoxide, and hydrogen. Figure 8 presents the concentrations of gases for the five tested coal samples.
A temperature of 35 °C was assumed as the average temperature of the rock mass in hard coal mines. Through knowing the concentrations of given gases, it is possible to determine the characteristic background for each coal seam. For all the tested coals, the carbon monoxide concentration systematically increased, reaching similar values at the temperature of 300 °C, and then dropped to low values, e.g., for sample 3, it increased from 35 to 21,000 ppm and then fell to 15 ppm. While assessing the fire hazard, these are the changes in carbon monoxide concentration that are analyzed most often [17,20]. The conducted tests confirmed it to be one of the most characteristic gasses for the assessment of fire hazard.
There were considerable differences in the ethane concentration among the tested coals. The lowest value at 35 °C, i.e., the “background” was measured for sample 1 (36 ppm) and the highest was for sample 3 (970 ppm) (Figure 8b). Such big differences in concentrations were observed both for the heating and cooling of coals. There were only small increases in the ethane concentration for the coals tested. For sample 2, ethane increased from 970 to 5180 ppm. Such low dynamics of the increase and decrease in concentrations makes it harder to assess changes in temperature, i.e., the gas is much less useful for the assessment of fire hazard. For propane concentrations, like for ethane, there were big differences between coals. The lowest background was 4 ppm for sample 1, while the highest was determined for sample 3 (77 ppm). Yet, for a given coal sample, increase dynamics were low. For sample 3, concentrations of propane changed from 77 to 887 ppm. Other gases applied to assess fire hazard are ethylene and propylene. Concentrations and courses of these gases were similar; however, the course of ethylene concentrations was more representative. For all coals, concentrations of ethylene showed very high increases (Figure 8c), e.g., for sample 2, the ethylene concentration went from 0.10 ppm to 50 ppm. The range of change for propylene concentrations was also very wide; for sample 2, it increased from 0.09 to 11.4 ppm (Figure 8e). Through analysis of the concentrations of ethylene and propylene, it was observed that at the final stage of cooling, values of the concentrations were significantly higher than during heating. The phenomenon is also confirmed by many year-long observations of sealed-off areas in hard coal mines; for example, for sample 3, during heating, ethylene concentration for the background was 0.12 ppm, and during cooling, it was 0.91 ppm; propylene concentration was 0.09 ppm during heating and 0.48 ppm during cooling. It may be concluded that ethylene and propylene are gases that describe fire hazard best, especially during cooling. Acetylene concentration during heating to the temperature of approximately 150 °C remained low and was 0.002 ppm. During cooling, the value obtained was approximately 50 °C. Below this temperature, observations of changes in acetylene concentration were impossible. By analyzing changes in acetylene concentration, it may be concluded that the gas may be useful in assessing fire hazard during heating from 200 °C and above and during cooling from 100 °C and above. For all the tested coals, carbon dioxide concentration systematically grew and had average increases in relation to other gases. While cooling it also systematically, yet slowly, decreased. The gas can be used for assessing fire hazard, however, its low decrease dynamics during cooling can hinder fire hazard assessment. In all the coals, hydrogen concentrations dynamically increased and decreased throughout the whole range of the temperature. Hydrogen concentration at 35 °C was 0.5 ppm and systematically rose to approximately 100 ppm at 300 °C. During cooling it decreased to 0.5 ppm. Based on the tests, it may be concluded that hydrogen is also one of the most characteristic gases for assessing coal heating and cooling. In the cooling phase, the decrease in temperature on particular thermocouples proceeds slower than the temperature increase in the heating phase, and therefore the larger part of coal is under the influence of the higher temperature. These changes have an effect on the concentration of gases, in particular ethylene, propylene, and acetylene. Concentrations of these gases are higher in the cooling phase than in the heating phase at comparable temperatures.

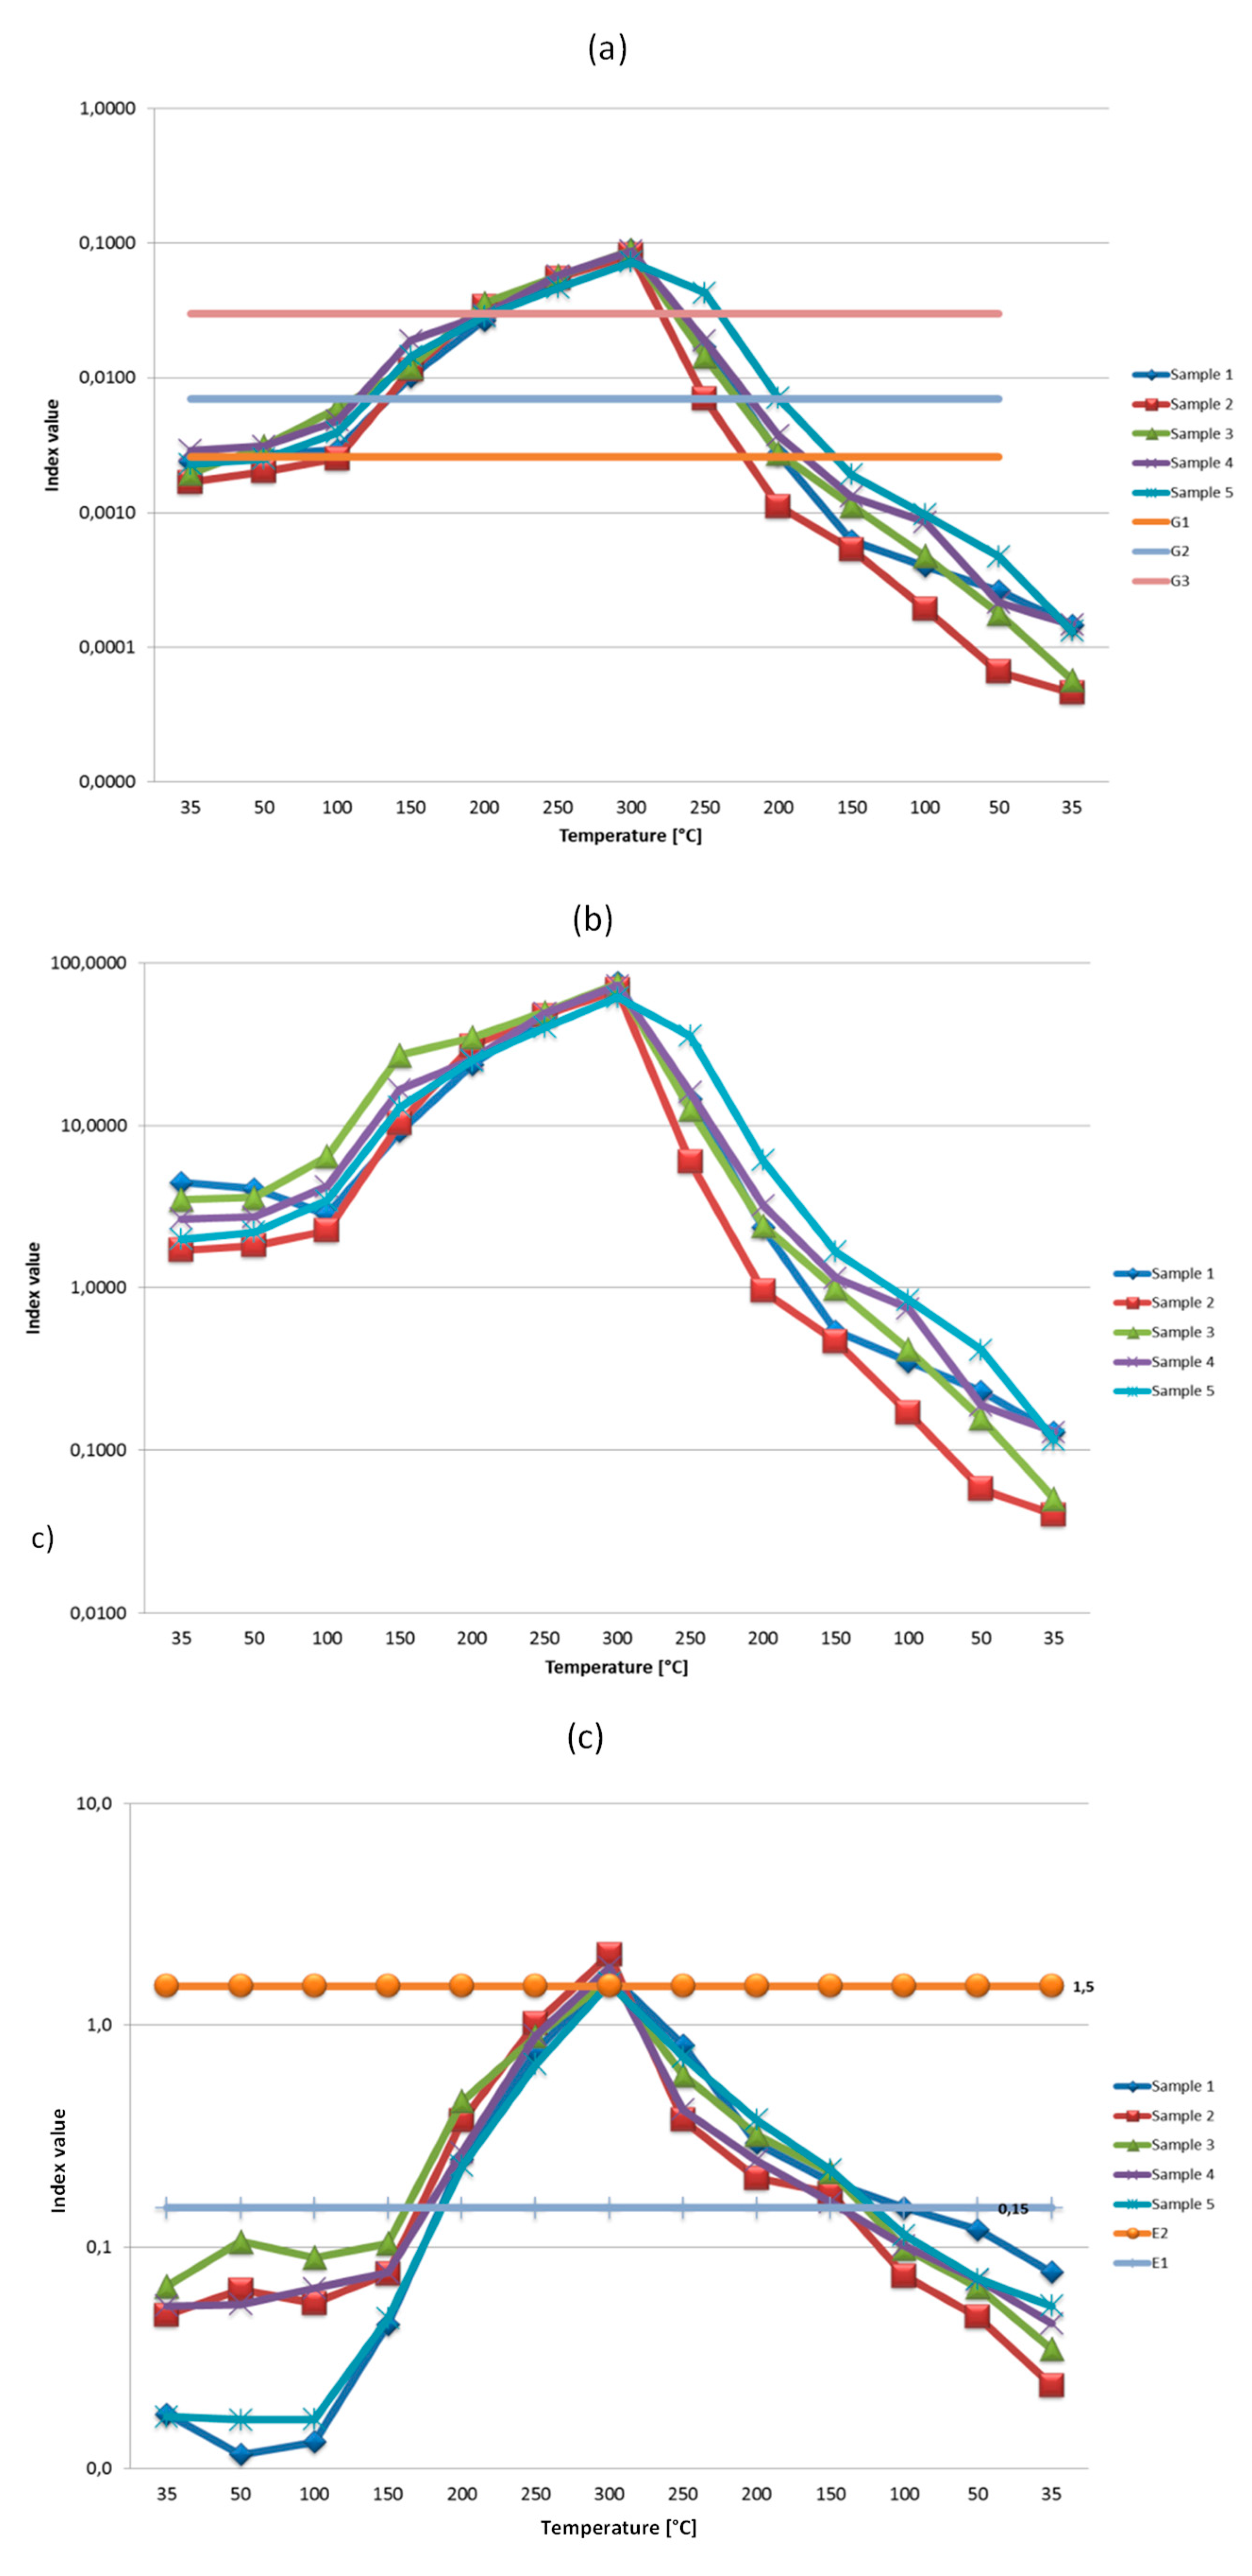
3.4. Analysis of Fire Indices

The criteria assumed in mining regulations work only for coal heating. Analyzing Figure 9, it can be concluded that for all the tested coals, the limit G3 of 0.0300 (the start of the fire) was approximately 200 °C.
The tested coals reached a limit G2 of 0.0070 (preventive measures) in the temperature range of 100–150 °C, and a limit G1 of 0.0026 in the temperature range of 35–50 °C. Hard coal mining operations are going deeper and deeper, which means higher virgin temperature of the rock mass. A virgin temperature of the rock mass above 40 °C is not uncommon in hard coal mines and it leads to the emission of significant amounts of carbon monoxide at the very opening of the longwall. As Figure 9 shows, the course of changes in the Graham index during heating was similar for all the coals, i.e., the temperatures determined by the Graham index limit were similar for all the coals. Hence, applying the criteria of the Graham index during heating is perfectly justified, while applying the criteria during cooling leads to the wrong conclusions. Values of the index quickly decrease and reach a limit G3 at the temperature of 200–150 °C, i.e., the value shows that the situation is normal. The Litton index reached the critical value of 1 at the temperature range of 200–100 °C, i.e., it may also lead to the wrong conclusions while assessing the temperature in a heated coal deposit (Figure 9b). Based on the tests performed, it was concluded that ethylene is one of the most characteristic gases, both during heating and cooling. Figure 9c presents a proposal of a new fire index, modelled on the Graham index:
E =   C 2 H 4 0.265 N 2 O 2
where C2H4, N2, and O2 denote the percentage concentrations of ethylene, nitrogen, and oxygen, respectively.

4. Conclusions

  • Changes in temperature in the vicinity of a heating and cooling hot spot were analyzed. The percentages of coal in the reactor for given temperatures were calculated. By comparing the percentages of coal for the same temperature in the hot spot, for the heating phase and cooling phase, significant differences in the distribution of given percentages of coal were observed. For all the coals, the average temperature during the cooling phase was higher at each of the sensors.
  • Changes in the concentrations of gases during heating and cooling were analyzed. The dynamics of changes in the concentrations of gases for the tested coals were determined. For samples 1 and 5, the lowest increases were measured for ethane, propane, and carbon dioxide, while the highest were measured for ethylene, propylene, hydrogen, and carbon monoxide. For samples 1, 2, and 4, the lowest increases were measured for ethane and propane and the highest were measured for ethylene, carbon monoxide, and hydrogen. Background values during heating and cooling, i.e., concentrations of gases at the virgin temperature of rocks, were determined. Ethylene was chosen as one of the most characteristic gases, especially for assessing the cooling of coal.
  • Changes in the values of fire indices were analyzed. The Graham index during heating was similar for all the tested coals. Hence, the use of the Graham index criteria during heating is perfectly justified. Yet, using the criteria during cooling leads to incorrect conclusions. During cooling, the Litton index assumes the value of 1 (cooling down to the ambient temperature) within the temperature range of 200–100 °C, i.e., it prematurely informs about cooling down. Use of the index based on the ethylene concentration was proposed. During the cooling phase, the index changes linearly.
  • It is impossible to assume common criteria to assess the fire hazard for the heating phase and cooling phase. Hence, for the accurate determination of the temperature in the cooling hot spot, it is necessary to conduct model tests for each of the coals and select proper limits.

Author Contributions

Conceptualization, M.W., A.S. and N.H.; methodology, M.W. and A.S.; software, E.B.P. and M.C.; investigation, M.W.; data curation, M.W., E.B.P. and M.C.; writing—original draft preparation, M.W., A.S. and N.H.; visualization, M.W.; supervision, A.S.

Funding

This research was funded by the Ministry of Science and Higher Education, Poland, grant number 14205037.

Conflicts of Interest

The authors declare no conflict of interest.

Appendix A

The program code for FlexPDE software used for simulations.
TITLE ‘Coal heating problem’
COORDINATES sphere1
SELECT
ngrid = 50
VARIABLES
 u       { temperature}
DEFINITIONS
 left = point(0)
  right = point(125)
  u0 = spline table(‘coal0.txt’,r)
  Tout = 22
  alpha = 12.2
  beta = 8.61
  q0 = 1.8e-3
  b = 0.25
INITIAL VALUES
  u = u0
EQUATIONS
  dt(u) = (alpha*div(grad(u)) + beta*exp(−r^2/(31)^2) − q0*(u − Tout))
BOUNDARIES
 REGION 1
   start  left  point value(u) = 300
   line to right point load(u) = b*(u − Tout)
TIME 0 TO 2000
PLOTS
for time = 0 by 10 to 2000
 elevation(u0,u) from left to right
HISTORIES {at the location of the temperature sensors}
 history(u) at (40) (60) (80) (100) (120) export
END
The file ‘coal0.txt’, which defines initial temperatures in spatial nodes for a spline interpolation, contains the plain text:
{Сoal temperature for t = 10}
r  6
0 40 60 80 100 120
data
298.5 48.3 26.1 25.3 25 25.2

References

  1. Adamus, A.; Sancer, J.; Guranova, P.; Zubicek, V. An investigation of the factors associated with interpretation of mine atmosphere for spontaneous combustion in coal mines. Fuel Process. Technol. 2011, 92, 663–670. [Google Scholar] [CrossRef]
  2. Dai, G.L. Study on the gaseous products in coal oxidation at low temperature. Coal Mine Saf. 2007, 1, 1–4. [Google Scholar]
  3. Beamish, B.B.; Arisoy, A. Effect of mineral matter on coal self-heating rate. Fuel 2008, 87, 125–130. [Google Scholar] [CrossRef]
  4. Kuchta, J.M.; Rowe, V.R.; Burgess, D.S. Spontaneous Combustion Susceptibility of U.S. Coals; Report of Investigation, RI-8474; U.S. Dept. of the Interior, Bureau of Mines: Washington, DC, USA, 1980.
  5. Cygankiewicz, J. About determination of susceptibility of coals to spontaneous combustion using an adiabatic test method. Arch. Min. Sci. 2000, 45, 247–273. [Google Scholar]
  6. Beamish, B.B.; Barakat, M.A.; George, J.D. Spontaneous-combustion propensity of New Zealand coals under adiabatic conditions. Int. J. Coal Geol. 2001, 45, 217–224. [Google Scholar] [CrossRef]
  7. Xia, T.; Zhou, F.; Liu, J.; Kang, J.; Gao, F. A fully coupled hydro-thermo-mechanical model for the spontaneous combustion of underground coal seams. Fuel 2014, 125, 106–115. [Google Scholar] [CrossRef]
  8. Kaji, R.; Hishinuma, Y.; Nakamura, Y. Low temperature oxidation of coals: Effects of pore structure and coal composition. Fuel 1985, 64, 297–302. [Google Scholar] [CrossRef]
  9. Wang, H.; Dlugogorski, B.Z.; Kennedy, E.M. Coal oxidation at low temperatures: Oxygen consumption, oxidation products, reaction mechanism and kinetic modelling. Prog. Energy Combust. 2003, 29, 487–513. [Google Scholar] [CrossRef]
  10. Ren, T.X.; Edwards, J.S.; Clarke, D. Adiabatic oxidation study on the propensity of pulverised coals to spontaneous combustion. Fuel 1999, 78, 1611–1620. [Google Scholar] [CrossRef]
  11. Nugroho, Y.S. Low-temperature oxidation of single and blended coals. Fuel 2000, 79, 1951–1961. [Google Scholar] [CrossRef]
  12. Beamish, B.B. Comparison of the R70 self-heating rate of New Zealand and Australian coals to Suggate rank parameter. Int. J. Coal Geol. 2005, 64, 139–144. [Google Scholar] [CrossRef]
  13. Taraba, B.; Pavelec, Z. Investigation of the spontaneous combustion susceptibility of coal using the pulse flow calorimetric method: 25 years of experience. Fuel 2014, 125, 101–105. [Google Scholar] [CrossRef]
  14. Dudzińska, A.; Cygankiewicz, J. Analysis of adsorption tests of gases emitted in the coal self-heating process. Fuel Process. Technol. 2015, 137, 109–116. [Google Scholar] [CrossRef]
  15. Zubicek, V.; Adamus, A. Susceptibility of coal to spontaneous combustion verified by modified adiabatic method under conditions of Ostrava–Karvina Coalfield, Czech Republic. Fuel Process. Technol. 2013, 113, 63–66. [Google Scholar] [CrossRef]
  16. Lu, P.; Liao, G.X.; Sun, J.H.; Li, P.D. Experimental research on index gas of the coal spontaneous at low-temperature stage. J. Loss Prev. Proc. 2004, 17, 243–247. [Google Scholar] [CrossRef]
  17. Bystroń, H. Fire, ignition and gas explosion during active and passive extinguishing. Arch. Min. Sci. 1997, 42, 3–44. [Google Scholar]
  18. Mitchell, D.W. Mine Fires, Prevention, Detection, Fighting; Maclean Hunter Pub Comp: Chicago, IL, USA, 1990. [Google Scholar]
  19. Litton, C.D. Gas Equilibrium in Sealed Coal Mines; R.I.90031; U.S. Dept. of the Interior, Bureau of Mines: Washington, DC, USA, 1986.
  20. Minister of Economy. Regulation of the Minister of Economy of 28 February 2002 on Work-Related Safety, Conducting Mining Operations and Specialist Fire Fighting Systems in Underground Coal Mines; Ministry of Economy: Warsaw, Poland, 2002.
  21. Singh, A.K.; Singh, R.V.K.; Singh, M.P.; Chandra, H.; Shukla, N.K. Mine fire gas indices and their application to Indian underground coal mine fires. Int. J. Coal Geol. 2007, 69, 192–204. [Google Scholar] [CrossRef]
  22. Roberts, A. The Ventilation of Mine Wastes, 5 Mine Ventilation; Cl.-H. Press: London, UK, 1960. [Google Scholar]
  23. Dudzińska, A.; Howaniec, N.; Smoliński, A. Experimental study on sorption and desorption of propylene on Polish hard coals. Energy Fuels 2015, 29, 4850–4854. [Google Scholar] [CrossRef]
  24. Chamberlain, E.A.C.; Hall, P.A.; Thilaway, J.T. The Ambient Temperature Oxidation of Coal in Relation to the Early Detection of Spontaneous Heating—Part 1. Min. Eng. 1970, 130, 1–6. [Google Scholar]
Figure 1. Test stand for experiments on self-heating of coal.
Sustainability 10 03587 g001
Figure 2. Changes in temperature for given measurements during heating and cooling of sample (a) 1, (b) 2, (c) 3, (d) 4, and (e) 5.
Sustainability 10 03587 g002aSustainability 10 03587 g002b
Figure 3. The distribution of temperature in the heating-up of sample 2 for a maximum temperature of: (a) 100, (b) 200, and (c) 300 °C; and in cooling coal for the maximum temperature in the hot spot of (d) 200 and (e) 100 °C.
Sustainability 10 03587 g003aSustainability 10 03587 g003b
Figure 4. Results of modeling in comparison with the experimental records, including the transient regime.
Sustainability 10 03587 g004
Figure 5. Changes in the concentration of gases in the heating and cooling of sample 1.
Sustainability 10 03587 g005
Figure 6. Rate of changes in the concentration of gases in heating of sample: (a) 1, (b) 2, (c) 3, (d) 4, and (e) 5.
Sustainability 10 03587 g006aSustainability 10 03587 g006b
Figure 7. Rate of changes in the concentration of gases in cooling of sample: (a) 1, (b) 2, (c) 3, (d) 4, and (e) 5.
Sustainability 10 03587 g007aSustainability 10 03587 g007b
Figure 8. Changes in concentrations of: (a) Carbon monoxide, (b) ethane, (c) ethylene, (d) propane, (e) propylene, (f) acetylene, (g) carbon dioxide, and (h) hydrogen in the heating and cooling phase.
Sustainability 10 03587 g008aSustainability 10 03587 g008bSustainability 10 03587 g008c
Figure 9. Changes in the value of: (a) The Graham index, (b) the Litton index, and (c) the Ethylene index.
Sustainability 10 03587 g009
Table 1. Results of the sieve analysis of tested coal samples.
Sample 1Sample 2Sample 3Sample 4Sample 5
g%g%g%g%g%
>2 mm31.162.020.78.52.87.52.3
2–1 mm100.536.5106.535.599.536.411036.3119.536.9
1–0.7 mm5720.755.518.560.522.25317.56018.5
0.7–0.5 mm40.514.746.515.53914.349.516.353.516.5
0.5–0.35 mm22.58.225.58.5207.330.510.13811.7
0.35–0.25 mm10.53.8186155.520.56.8206.2
0.25–0.125 mm186.5186176.2155.013.54.2
<0.125 mm238.4258207.3165.3123.7
Table 2. Selected physical and chemical parameters of tested coal samples.
Sample NoTransient Moisture Wex
PN-G-04511:1980 pt. 2.1
Moisture Content of Sample Wa
PN-G-04560:1998
Ash Content Aa
PN-G-04560:1998
Volatile Matter Content Va
PN-G-04516:1998
Total Carbon Content Ca
PN-G-04571:1998
Total Sulfur Content Sta
PN-G-04571:1998
Total Hydrogen Content Hta
PN-G-04584:2001
Nitrogen Content Na
PN-G-04571:1998
Oxygen Content Oa
PN-G-04571:1998
Activation Energy A
PN-93/G-04558
Coal Autoinfla-mmability Index Sza
PN-93/G-04558
Autoinfla-mmability Group PN-93/G-04558
% Weight% Weight% Weight% Weight% Weight% Weight% Weight% Weight% WeightkJ/mol°C/min
12.82.26.929.581.90.684.551.336.856177II
27.18.05.43469.50.754.81.111.4247125V
31.20.84.22387.80.483.21.138.36042II
43.84.45.633.774.50.883.981.219.756283III
58.89.24.934.170.61.104.720.7912.2847135V
Table 3. Changes in the percentage of coal sample 2 in temperature ranges while (a) heating for the temperature in the hot spot of 100, 200, and 300 °C, and (b) cooling for temperature in the hot spot of 200 and 100 °C.
Ranges of Temperature in ReactorTemperature in Hot Spot
Heating PhaseCooling Phase
100 °C200 °C300 °C200 °C100 °C
up to 50 °C96%66%55%62%89%
50–100 °C4%27%34%29%10%
100–150 °C-5%6%5%-
150–200 °C-2%3%2%-
200–250 °C--1%1%-
250–300 °C--1%--

