How Should National Museums Create Competitive Advantage Following Changes in the Global Economic Environment?


1
Department of Marketing and Logistics Management, National Penghu University of Science and Technology, No. 300, Liuhe Rd., Magong City, Penghu County 88046, Taiwan
2
Department of Business Administration, Ming Chuan University, 5F, No. 130, Jihe Rd., Taipei 11162, Taiwan
*
Author to whom correspondence should be addressed.
Sustainability 2018, 10(10), 3749; https://0-doi-org.brum.beds.ac.uk/10.3390/su10103749
Submission received: 19 September 2018
/
Revised: 12 October 2018
/
Accepted: 16 October 2018
/
Published: 17 October 2018
(This article belongs to the Section Economic and Business Aspects of Sustainability)
Abstract
:Management strategies play an important role in enhancing the competitive advantage and sustainable development of national museums. The purpose of this study is to focus on evaluating the management strategies of national museums to reduce the gaps in visitor satisfaction that are caused by the interdependence and feedback problems of the so-called BOCR dimensions (namely, benefits, opportunity, costs, and risks) and 24 criteria. This study creates a hybrid competitive advantage multiple-criteria decision-making model for national museums by integrating the decision-making trial and evaluation laboratory-based analytic network process and modified VIKOR (VlšeKriterijumska Optimizacija I Kompromisno Resenje) techniques to solve the problems. We consider five different types of national museums to illustrate how the proposed new evaluation model enhances the competitive advantage of national museums. Our results provide national museum curators with the knowledge and understanding to create promotional and marketing strategies that reduce the gaps in dimensions and criteria to satisfy visitors’ needs and to enhance their competitive advantage.
1. Introduction
A nonprofit is an organization incorporated for charitable or educational purposes and from which its shareholders or trustees gain no benefit. Any benefit that a nonprofit organization obtains must be retained for its own expenses, operations, and programmes [1]. The major financial and economic constraints that were induced by the greatest global economic crisis from the middle of 2007 into 2008 led to a significant decline in overall international economic activity. Thus, nonprofit organizations are increasingly compelled to develop strategies to improve their effectiveness, sustainability, and competitive advantage in order to accomplish their financial and performance goals [2].
Performance evaluation is defined as the potential of a firm to successfully implement its strategies to achieve its objectives and targets [3]. Profit-oriented firms generally evaluate their performance based on financial measures. However, in the nonprofit context, the goal of the organization is most likely non-financial. Previous studies have focused on the effectiveness [1,4], marketing strategies [5], earnings management [6], performance [7], and financial performance measures [8] of nonprofit organizations. In sum, issues of nonprofit performance measurement form an important topic in the literature. Nonprofit organizations need to know how to manage their business strategies, because the success of a nonprofit organization depends on its performance management and business strategies. This study focuses on nonprofit national museums and examines how they can implement their promotional and marketing strategies more effectively in order to enhance their competitive advantage [9].
National museums are usually nonprofit organizations, and their purposes of research, education, and entertainment have led them to the collection, preservation, research, dissemination, and exhibition of physical evidence of humans and their environments [10,11]. Thus, national museums provide not only historical and cultural education, but also a wide range of educational and recreational opportunities [12,13]. Their revenue sources include self-operated museum shops, membership fees, educational courses, equipment and outdoor venue rentals, image copyrights, and fund-raising activities. Previous studies show that the performance evaluation of museums involves four major dimensions—exhibitions, educational programmes, research, and collections [13,14,15]. In recent years, several researchers have added entertainment to this list [16,17]. Therefore, in this study, we assume that museums are a typical leisure entertainment industry. To achieve and sustain their performance targets, museums must adjust their operational strategies and create more added value.
Basso, Casarin, and Funari [18] propose a quantitative model to evaluate the performance of museums based on data envelopment analysis (DEA) and balanced scorecard (BSC). In this contribution, they propose a new two-stage DEA-BSC model for museums. Furthermore, the methods of previous studies do not consider the interrelationship between criteria or a decision model that could simplify the evaluation process. Recently, Tsai and Lin [19] used the (decision-making trial and evaluation laboratory (DEMATEL) technique to explore the cause–effect relationships between the indicators and create an influential network relations map (INRM). However, since different types of national museums exist (such as history and culture, natural history and natural science, synthetic exhibitions, science and technique, and arts and craft museums), the study does not include gap analysis. Important issues have not been considered, for example, how to enhance the competitive advantage of national museums following the risks of competition from non-museums. Therefore, we extend their research to a more complete approach towards competitive advantage evaluation of national museums by utilizing a hybrid multiple criteria decision-making (MCDM) model [20].
In this study, we adopt a more complete approach towards competitive advantage evaluation of national museums by applying the hybrid MCDM model. This model combines the DEMATEL-based analytic network process (DANP) that finds the influential weights, and the modified VIKOR (VlšeKriterijumska Optimizacija I Kompromisno Resenje) method. This combined model can assess the competitive advantage of national museums in evaluation and ranking, as well as in improving and creating management and marketing strategies that reduce the gaps in the dimensions and criteria, enhance their competitive advantage, and satisfy the needs of visitors to encourage their return visits [20,21,22].
The remainder of this study is organized as follows. Section 2 briefly introduces the literature pertaining to the link of benefits, opportunity, costs, and risks are reviewed and the new hybrid MCDM evaluation model (which includes the DANP and modified VIKOR methods) and its application to building an evaluation model that can solve the problems of interdependence and feedback. Section 3 presents an empirical study of five different types of national museums and demonstrates the proposed model. This is followed by Section 4, with a discussion of the results and practical implications, creating business strategies for each national museum. The final section presents our conclusions, limitations, and recommendations for future study.
2. Evaluation Attributions Development for National Museums
The model of BOCR (namely, benefits, opportunity, costs, and risks) was first presented by Saaty [23]. The four dimensions of the model can account for every aspect that needs to be considered in an evaluation. Thus, the model can identify the best solution by combining the value of each strategy and analysing the relevant decision-making issues [24]. The model has been widely used in various fields, such as tablet PCs (Tsai & Chang, 2013), sustainable forest management [25], R&D project evaluation [26], and energy security [27]. This study develops a conceptual model that is useful for evaluating the competitive advantage of national museums, which we discuss in the following sub-sections.
2.1. Benefits (B)
The dimension of benefits in this study contributes to enhancing the values and benefits of national museums. In devising the benefits criteria, the following possible measurements are considered for national museums. Reputation and attractiveness (B1): when the satisfaction of visitors increases from the quality of service provided by the museum’s guides and service personnel and interesting exhibits, they would share such information with their relatives and friends, who might in turn gain the willingness to visit the museum, thus building the museum’s reputation and attractiveness [28]; ticket sales (B2): revenue earned by the museum when visitors purchase tickets to tour the museum [18,29]; number of visitors (B3): number of visitors touring the museum [13,18,30]; sales revenue from cultural and creative products (B4): revenue arising from sales of cultural and creative products via the museum’s physical and online shops [5,13,18]; revenue from promotional and cooperative education (B5): revenue arising from collaborating with schools and private enterprises for promotional and cooperative education [13,18]; revenue from site rent expense (experts suggestion) (B6): revenue from renting out sites within the museum to organizations for events; and, revenue from visitors taking part in activities and using facilities (B7): revenue from sales of tickets to visitors for experiencing various activities and using facilities [13].
2.2. Opportunity (O)
The dimension of opportunity in this study helps national museums to generate more competitive and creative offerings. In devising the opportunity criteria, the following possible measurements are considered for national museums. Archive development and performance of research (O1): archives development involves digitization and licensing, while research performance consists of achievements in terms of academic research and publications [13,31]; museum marketing with social media and mobile apps (O2): the museum establishes a “mobile museum” using social media and apps, to thereby improve the museum’s visibility, promote its unique features, and enhance people’s awareness of the museum [32,33,34]; preferential ticketing measures (O3): preferential ticketing measures are implemented for different visitor groups—for example different ticket discounts are applied for student pass holders, student organizations, and labour groups [18]; placement diversity, features, fun exhibitions (O4): the museum often introduces various diverse, interesting, and lively exhibitions and activities to increase visit motivation among potential visitors [35,36,37]; creative innovation and activities and facilities (O5): the museum innovates to create interesting activities and facilities [13,35,37]; design and generation of cultural and creative products (O6): the museum induces visitors to purchase new cultural and creative products by concentrating on the design of such products [13,33,38,39,40]; and, promotional marketing cooperation (O7): the museum enhances its competitiveness and revenue by forming strategic alliances with industry players from the same or different fields [41].
2.3. Costs (C)
The dimension of costs in this study tries to reduce the national museums’ relative costs. In devising the costs criteria, the following possible measurements are considered for national museums. Operating costs (C1): these expenditures include human resource costs, labour costs (service costs), training costs (costs of cooperative education and continuing education), and general and administrative expense [18]; storehouse administration costs (C2): the costs for managing relic storage, safety, constant temperature, and humidity control, and establishment of a storehouse management system [13,18]; design costs of cultural and creative products (C3): the costs incurred for conceptualization, design, tooling, packaging, and sales of cultural and creative products [18,39]; planning new exhibitions and activities costs (C4): the costs arising from new themed exhibitions and activities that are hosted by the museum [18]; and, planning visitors’ experiences, activities, and facilities costs (C5): the costs arising from planning visitors’ experiences, activities, and use of facilities [42].
2.4. Risks (R)
The dimension of risks in this study relates to decreasing the national museums’ uncertainty and environmental risks. In devising the risks criteria, the following possible measurements are considered for national museums. Competitive risks from non-museums (R1): competition from industry players, like tour factories and themed amusement parks [43]; safety of exhibition environment (R2): risks associated with the safety of the exhibition environment, control of constant temperature and humidity, as well as accidental damage to exhibits caused by visitors [37]; safety of museum’s borrowed and loaned exhibition items (R3): safety of the museum’s collections when they are loaned into (out of) an exhibition [37]; lack of protective cover (R4): exhibition of artefacts without protective covers [37]; and, archive storage and preservation measures (R5): setup of standard operating procedures to prevent negative impacts to collections from disaster and theft, condition maintenance and monitoring, record management, and inspection of building conditions [44].
Following literature reviews and pre-testing by experts with practical experience, we select the dimensions and criteria for evaluating the competitive advantage of national museums and confirm these important dimensions and criteria through ten expert interviews with national museum curators and national museum research fellows. Finally, we propose specific aspects for evaluating the competitive advantage of national museums.
3. Creating an Competitive Advantage Evaluation Model for National Museums
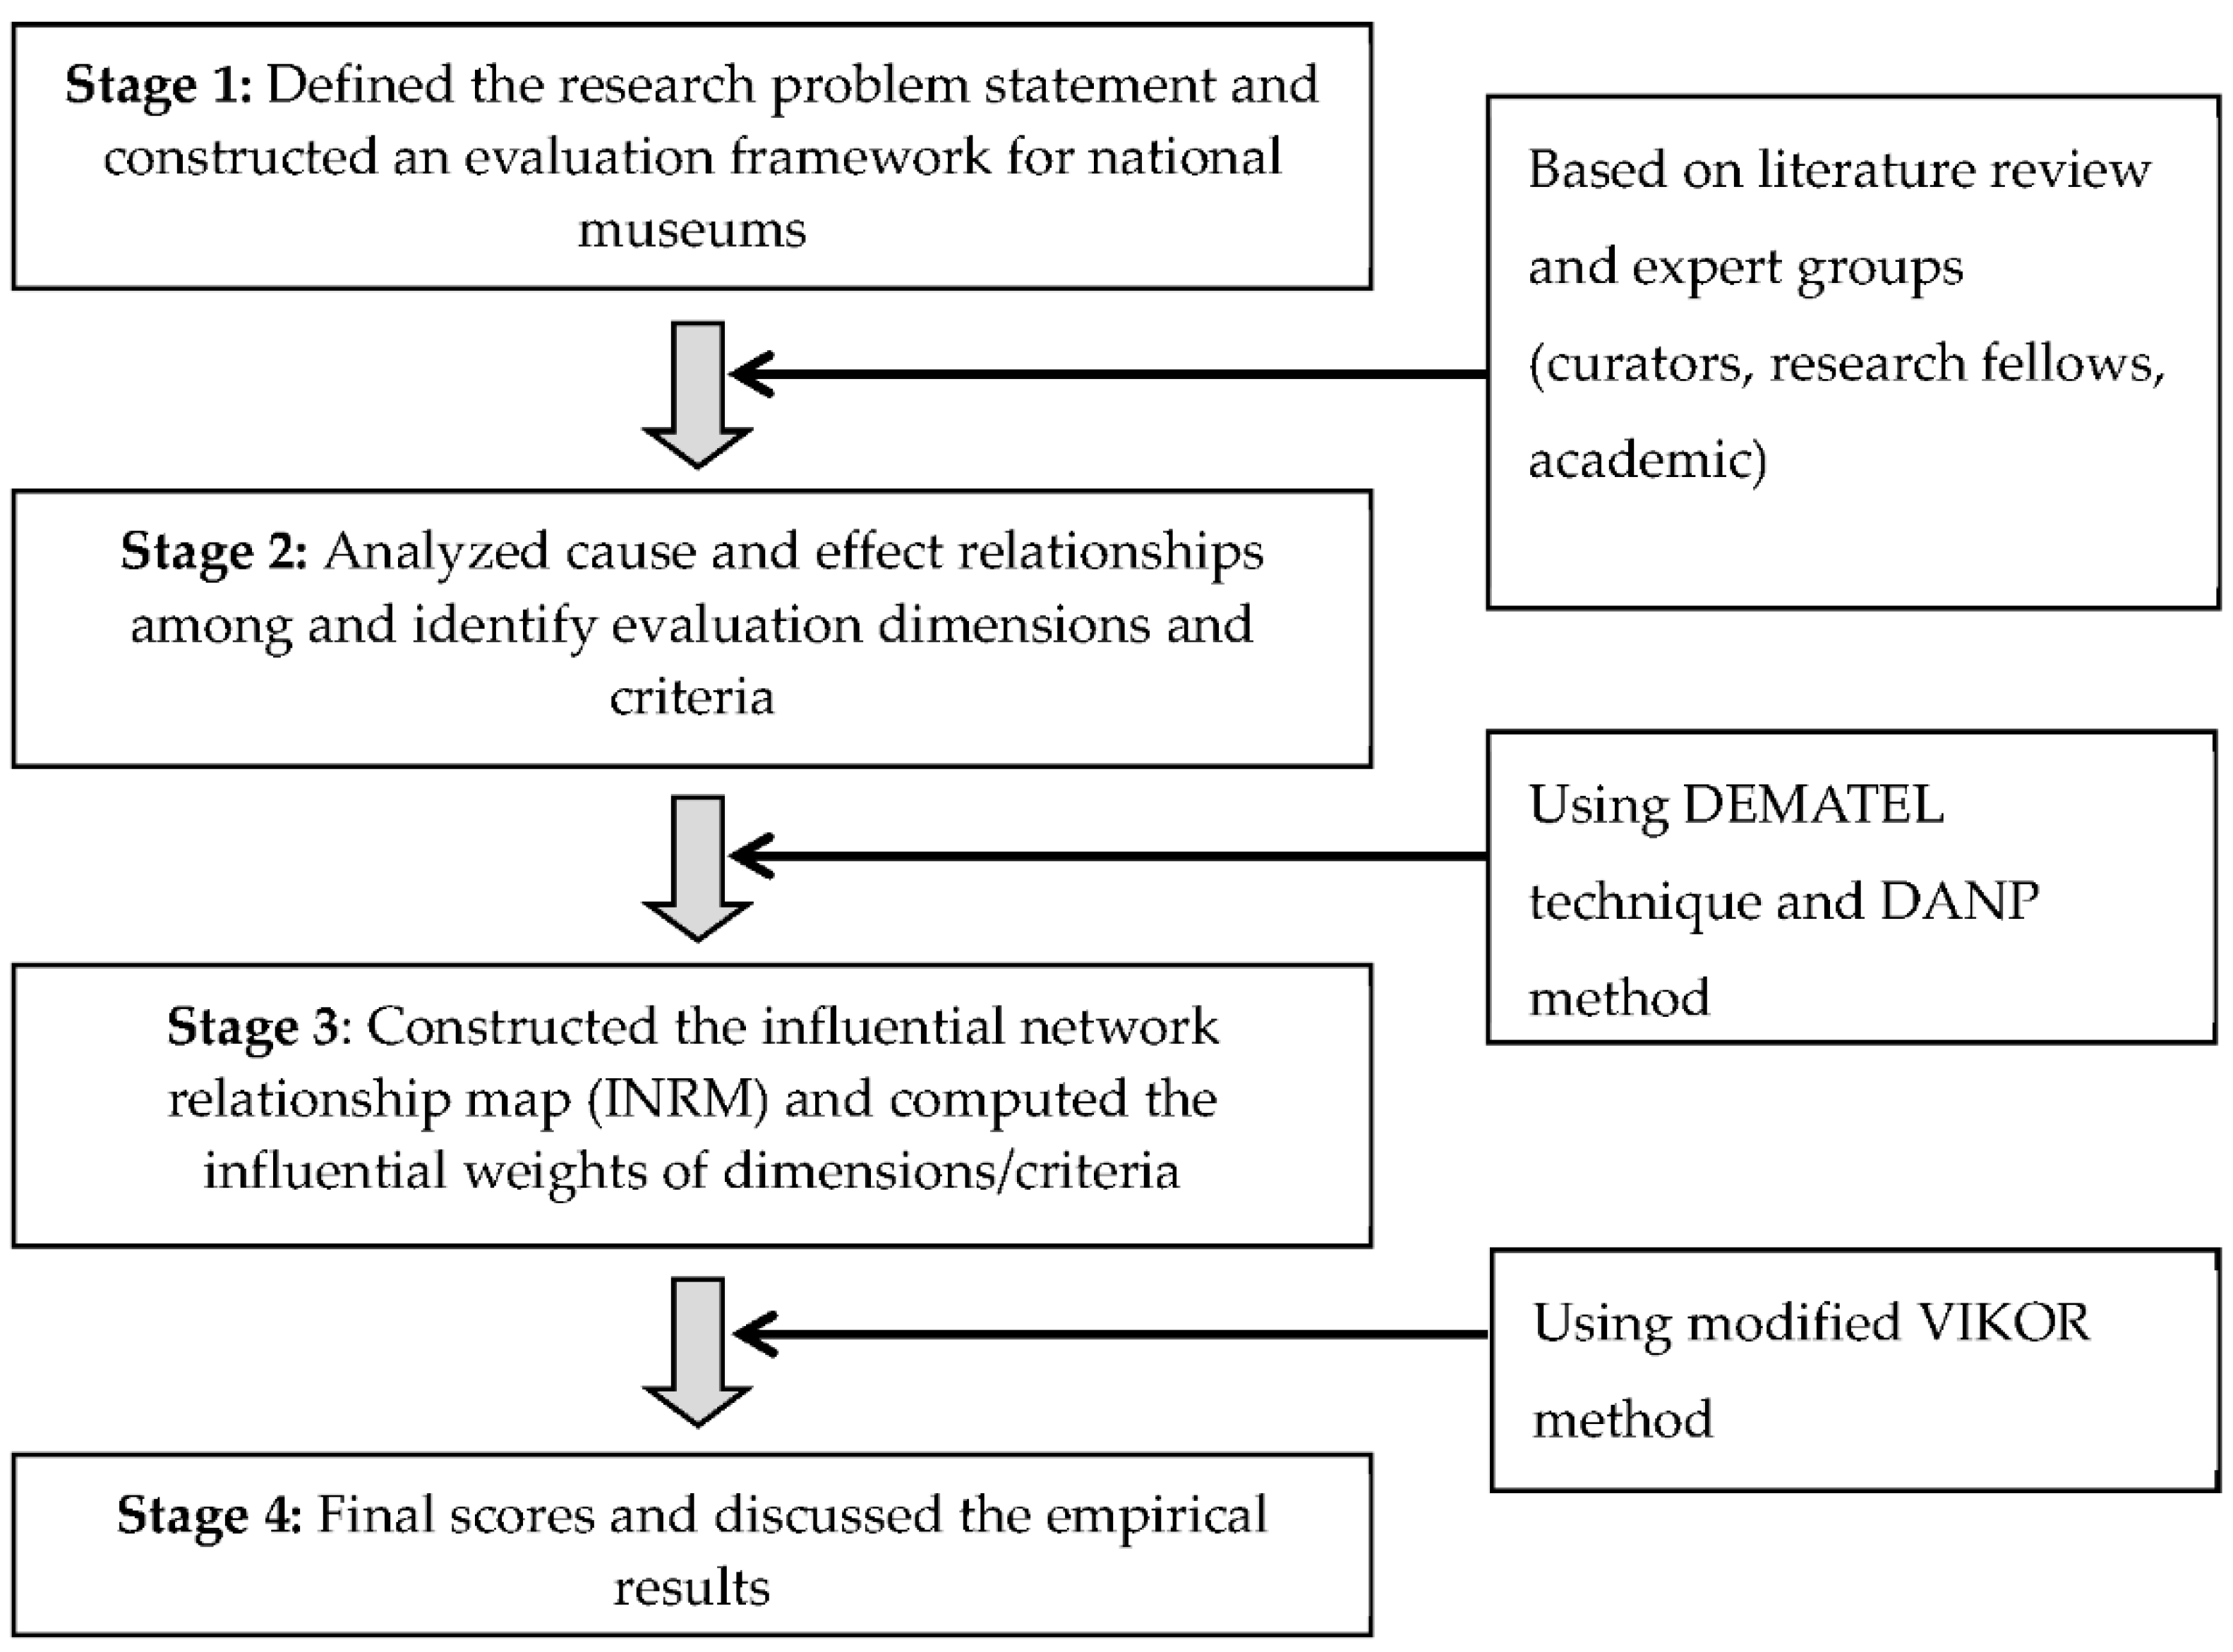
In this section, we use the hybrid MCDM model to create a hybrid evaluation method to address the interdependence and feedback problems of the dimensions/criteria and reduce the gap in each dimension and criterion [20,21]. Our evaluation procedure consists of four stages, as shown in Figure 1. The first stage presents the model’s concept and the problems of development through a review of the related theories and literature; the second stage builds an influential network relations map (INRM) using the decision-making trial and evaluation laboratory (DEMATEL) technique [19]; the third stage finds the influential weights using the DANP method; and, the final stage explains how to use the modified VIKOR (VlšeKriterijumska Optimizacija I Kompromisno Resenje) method and assess the competitive advantage of national museums in not only ranking and selection, but also in improving and creating management and marketing strategies that reduce the gap in each dimension and criterion, promote the competitive advantage of national museums, and satisfy the visitors’ needs and encourage their return visits. The sub-sections below provide detailed descriptions of each stage of the evaluation process.
3.1. Establishing Evaluation Indicators National Museums
Expert questionnaires based on the four principles of evaluation (i.e., benefits, opportunity, costs, and risks) are introduced to screen the dimension/criteria fit for the evaluation of national museums. A committee of experts comprising 15 professional experts from national museum fields, including those that were engaged as national museum curators, national museum research fellows, and academics, select 24 sub-criteria (Fifteen experts were selected. Since the important weights for both types of experts were considered equal, and to avoid bias, the study selected experts with both practical experience and academics who met the following conditions: (a) they held a managerial position at a national museum, and (b) they had a research background related to museum management). The descriptions of the dimension/criteria for the competitive advantage evaluation of national museums are listed in Section 2. In order to illustrate the subject approach, we analyse the following five different types of national museums, namely history and culture (i.e., National Museum of History, National Museum of Taiwan History, and National Museum of Prehistory), natural history and natural science (i.e., National Museum of Natural Science), synthesize exhibitions (i.e., National Taiwan Museum), science and technique (i.e., National Science and Technology Museum, National Science and Technology Museum), and arts and craft (i.e., National Taiwan Museum of Fine Arts).
3.2. Utilizing DANP to Find the Influential Weights of Indicators
This study uses the DEMATEL along with the DANP to establish a hybrid evaluation model that can address the interdependence and feedback problems of each of the dimensions and criteria. The DEMATEL technique is used to build an INRM, and DANP obtains the influential weights using the basic concept of analytic network process (ANP) [21]. The steps to find the influential weights of a DANP from a total-influential matrix are summarized in Appendix A [20,21,45].
3.3. Utilizing the Modified VIKOR and Improving Each National Museum
The VIKOR method was proposed by Opricovic [46]. The basic concept of the method is based on the compromised programming utilized in MCDM by comparing the measure of “closeness” to the “ideal” alternative [46,47]. The modified VIKOR uses the class distance function based on the concept of aspiration level and worst level solution, and orders the results [21,48]. Under the modified VIKOR method for the normalized class distance function, the preference is to be near the aspiration level and far from the worst level.
The modified VIKOR method consists of the following steps. Since this method is based on the concept of aspiration level and worst level, in order to check the best (aspiration level) and worst assessment criteria values, we need to shift from the ranking and selection when determining the most preferable approaches to performance improvement of the existing methods that are based on INRM. The second step is to calculate the mean group utility based on the sum of all individual criterion regrets (i.e., the average overall performance gap for each aspect and criterion, and strategies for reducing these gaps) and the maximal gap of an individual criterion for the priority of improvement, both overall and for each aspect. Thus, we use the basic concept of the modified VIKOR method as , representing the gap ratio by normalization scale (using the aspiration level and worst value ) from aspiration level to performance value , to find the minimal average gaps for reducing the gap to zero and the maximal individual regret (gap) for priority improvement based on INRM. The third step is to obtain the comprehensive/integrating indicators and sort the results so that decision makers can implement improvement strategies and reduce the competitiveness gaps in both overall performance and individual aspects of performance [21]. For the modified VIKOR procedures, see Appendix B.
4. Empirical Case Analysis for National Museums
In this section, we present an empirical study to illustrate the application of the proposed hybrid evaluation model to create management and marketing strategies that help national museum curators to understand how to improve museums and enhance their competitive advantage by reducing the gaps in visitor satisfaction and building effective museum management and marketing strategies. The four BOCR dimensions are taken as the framework to establish national museum evaluation indicators in this study. Using this research framework, we first extend Tsai and Lin [19] research to a more complete approach towards competitive advantage evaluation of national museums by utilizing a hybrid MCDM model. Then, utilizing the DANP, we obtain the influential weights of the dimensions/criteria using the basic concept of ANP, and utilizing the modified VIKOR method, we evaluate the performance of national museums and enhance their competitive advantage that is based on gap analysis. We illustrate our comprehensive analysis in the steps described below.
4.1. Find the Influential Weights (Dimensions/Criteria) of DANP Based on the DEMATEL
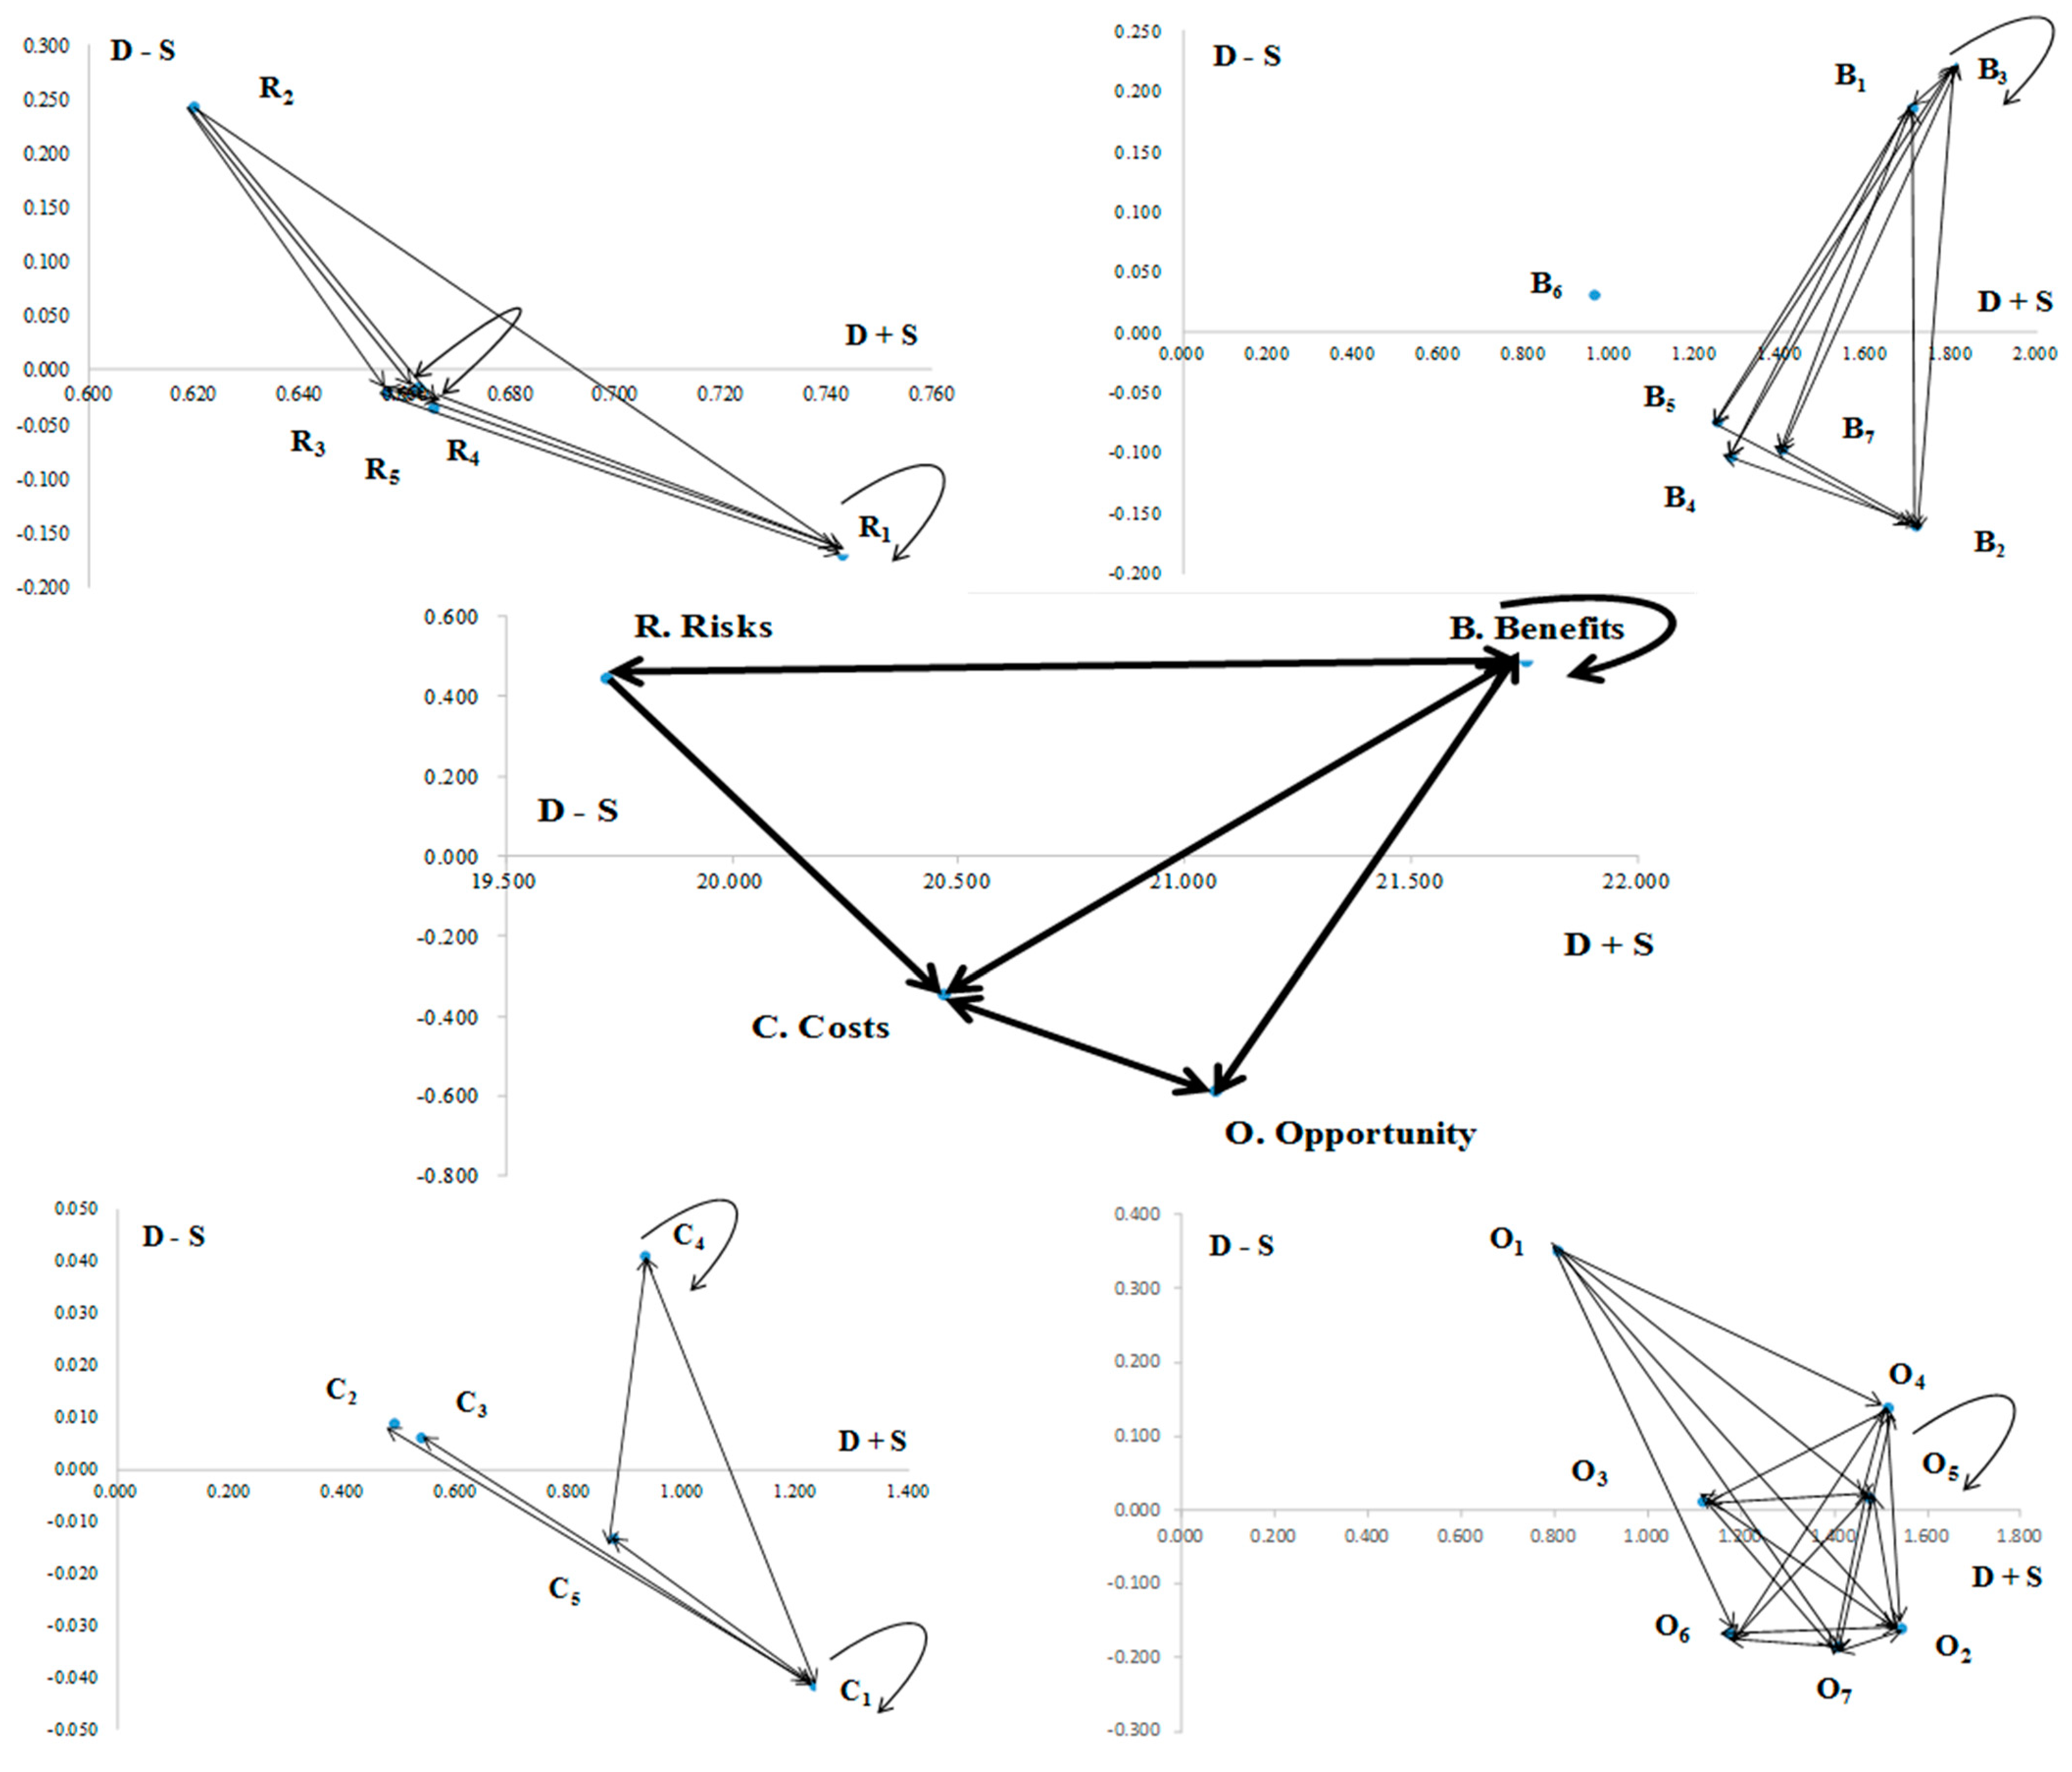
From Tsai and Lin [19] analysis results, they use the DEMATEL to confirm the influential relationships between the dimensions/criteria (see Figure 2) to obtain the most accurate influential weights. Because the DANP can solve the interdependence and feedback problems of each of the criteria [23], we structure the competitive advantage evaluation model using the DEMATEL technique, which is integrated with the DANP, to obtain the influential weights of the criteria. The DANP method allows for us to derive the local weights of the evaluation dimensions/criteria at their respective hierarchical level and global weights, thus helping us to understand the absolute weights of individual criteria across all the four dimensions.
We used the DANP method to determine the influential weights and calculate the dimension matrix (Table 1) and normalized dimension matrix (Table 2) from Equations (A1) and (A2). The unweighted supermatrix was obtained by transposing the normalized matrix , that is , as shown in Appendix C. The influential weights of the DANP based on Equations (A2) through (A5) are shown in Appendix D. We obtained the influential weights of the DANP by limiting the power of the weighted supermatrix () until it reached a steady state (see Appendix E).
From Appendix E, we identify the critical criteria of national museums for improving management and marketing strategies as the risks of competition from non-museums (R1) ( = 0.094); operating costs (C1) ( = 0.074); planning new exhibition and activities costs (C4) ( = 0.056); planning visitors’ experiences, activities, and facilities costs (C5) ( = 0.055); ticket sales (B2) ( = 0.046); museum marketing with social media and mobile apps (O2) ( = 0.045); and, creative innovation in activities and facilities (O5) ( = 0.045). This implies that national museums provide new and different exhibitions, visitor experiences, facilities, and strategic alliances to increase their competitive advantage and have the greatest relative influence on all the criteria. Thus, it is important to assist national museum curators to formulate ideal business and marketing strategies. The lowest priority weights were for revenue from site rent expense (B6) ( = 0.024) and archive development and research performance (O1) ( = 0.016), implying that revenue from site rent expense and from archive development and research performance are the least influential criteria.
4.2. Using the Modified VIKOR to Evaluate Gaps of National Museums
The modified VIKOR method evaluates the performance of five different types of national museums (i.e., history and culture, natural history and science, synthesize exhibitions, science and technique, and arts and craft) based on the national museums’ performance questionnaire. The questionnaires used an 11-point scale ranging from 0 (very poor performance) to 10 (excellent performance), which is very unimportant or very bad to very important or very good [20]. We believe that this study can help national museum curators to improve and manage their museums more effectively and satisfy visitors, such as to encourage return visits. The goal is to provide business and marketing strategies for curators to create effective business by reducing or eradicating the gaps in national museum service and achieving the aspiration levels.
Table 3 shows the performance matrix based on Equations (A6) and (A7), with the best value and worst value . The values of and obtained from Equations (B6) and (B7) are shown in Appendix D, while the value of (with ν = 0.5) computed from Equation (B8) and the preference order of national museums’ ranking are given in Table 4. From the analysis results of the modified VIKOR (which postulates that ν = 0.5), we find that museum D ()museum B ()museum A ()museum E ()museum C (), meaning that museum D (science and technique type) is superior to the other four museum types. Museum D is thus the most successful. From the empirical results, museum D should be the preferred choice because it has the best relative weights.
From Appendix F, the integration of performance index scores of museum A (type of history and culture) in DANP further demonstrates that the gap for the opportunity (O) dimension is 0.261 and that for the operating costs (C1) criteria is 0.074, constituting the largest gaps, which museum A should improve as a priority. The integration of performance index scores of museum B (natural history and natural science type) in DANP showed that the gap of the costs (C) dimension is 0.239 and that of the operating costs (C1) criteria is 0.067, constituting the largest gaps, which museum B should improve as a priority. The integration of performance index scores of museum C (synthesize exhibitions type) in DANP showed that the gap of the costs (C) dimension is 0.251 and that of the risks of competition from non-museums (R1) criteria is 0.094, constituting the largest gaps, where museum C should improve as a priority. The integration of performance index scores of museum D (science and technique type) in DANP showed that the gap of the benefits (B) dimension is 0.256 and that of the risks of competition from non-museums (R1) criteria is 0.064, constituting the largest gaps, which museum D should improve as a priority. The integration of performance index scores of museum E arts and craft type) in DANP showed that the gap of the opportunity (O) dimension is 0.199 and that of the risks of competition from non-museums (R1) criteria is 0.089, constituting the largest gaps, which museum E should improve as a priority. Thus, the priority for museums A, B, C, D, and E is to enhance their competitive advantage and increase their performance.
4.3. Discussions, Practical Implications, and Creating Improvement Strategies
We next define the indicators affecting the competitive advantage evaluation of national museums. The mutual relationships between the dimensions and criteria for the evaluation of national museum competitive advantage and their influential weights are also discussed to obtain a complete set of hybrid evaluation models for national museum curators to create competitive advantages. In the following, we discuss our empirical results. First, we extend Tsai and Lin [19] research to a more complete approach towards competitive advantage evaluation of national museums by utilizing a hybrid multiple criteria decision-making model.
Second, we use the DANP method to calculate the influential weights for each of the 24 criteria. As shown in Appendix F, the highest relative weights are the risks of competition from non-museums (R1); operating costs (C1); planning new exhibition and activities costs (C4); and, planning visitors’ experiences, activities, and facilities costs (C5), assessed at 0.094, 0.074, 0.056, and 0.055, respectively. This indicates that for national museums, more and different exhibitions, visitor experiences, facilities, and strategic alliances to increase competitive advantage have the greatest relative influence of all the criteria. The lowest priority weights are for revenue from site rent expense (B6) (0.024) and archive development and research performance (O1) (0.016). This indicates that revenue from site rent expense and from archive development and research performance are the least influential criteria. Opportunity (O) is the most influential dimension for national museum performance evaluation. Appendix F illustrates the priority of criterion improvement from top to bottom, where the improvement of the most influential criteria has the best effect. The priority of dimensions and criteria for improvement should be considered along with the INRM to reduce the gaps and meet visitors’ needs. Improving the different criteria can strongly influence the results directly and indirectly.
Third, as for competitive advantage evaluation of national museums, we use the modified VIKOR method to evaluate the competitive advantage of five different types of national museums. From the results, museum D (science and technique type) has the best scores from value (see Table 4). This has advantages in ticket sales (7.400); revenue from visitors taking part in activities and using facilities (7.933); placement diversity, features, and fun exhibitions (7.933); and, creative innovation in activities and facilities (7.933) (see Appendix F).
Finally, from the gap analysis results (see Appendix F), we can create management and marketing strategies for all the national museums to enhance their competitive advantage, as summarized below.
Museum A (history and culture type). The priority index for improving the dimensions includes opportunity (O) and risks (R), and that for improving the criteria includes C1, O5, B7, R5, R3, C3, B2, R4, R2, C2, B5, C4, B6, O3, O4, and C5. Thus, museum A can reduce its operational costs and maintain operational management; it can also reduce the risk of accidental damage to exhibition items and thus enhance its overall safety precautions and provide more exhibitions, visitor experiences, and features to increase its competitive advantage and have the greatest relative influence of all the criteria.
Museum B (natural history and natural science type). The priority index for improving the dimensions includes costs (C) and opportunity (O), and that for improving the criteria includes C1, O5, O7, O6, B2, B4, C5, R3, B7, C2, B1, O3, R1, R5, R4, O4, and O2. Thus, museum B can reduce its operational costs and maintain operational management; it can also provide more and different exhibitions, visitor experiences, facilities, and strategic alliances, and enhance its exhibitions, activities, and facilities to attract more visitors; furthermore, it can create more fun features and mementoes of cultural and creative products to attract visitor purchases or improve the sales revenue from cultural and creative products and increase their competitive advantage and have the greatest relative influence of all the criteria.
Museum C (synthesize exhibitions type). The priority index for improving the dimensions includes costs (C), benefits (B), opportunity (O), and risks (R), and that for improving the criteria includes R1, B2, O2, O4, B1, B3, O6, B5, B7, B4, O7, O1, and O5. Thus, museum C must provide more and different exhibitions, visitor experiences, facilities, and strategic alliances; it could also enhance its exhibitions, activities, and facilities to attract more visitors; museum C could establish a “mobile museum” while using social media (e.g., Facebook, Twitter, LinkedIn, Google+, and YouTube) and apps, and thereby improve its visibility, promote its unique features, and enhance visitor awareness of the museum; museum C could increase its collaboration with schools and private enterprises for promotional and cooperative education and expend more effort in updating experiences and facilities for revenue growth and maintain visitor loyalty and increase revenue from promotional and cooperative education; museum C could create more fun features and cultural and creative product mementoes and attract visitor purchases or improve sales revenue from cultural and creative products and increase their competitive advantage and have the greatest relative influence of all the criteria.
Museum D (science and technique type). The priority index for improving the dimensions includes costs (C), benefits (B), and risks (R), and that for improving the criteria includes R1, C4, C5, C1, O3, B7, O6, B1, and O7. Thus, museum D could be facilitated by increasing revenue from new themed exhibitions, visitor experiences, and facilities that are hosted by the museum to attract visitors and strategic alliances to increase its competitive advantage; museum D could reduce operational costs and maintain operational management to improve its operating costs; museum D could motivate visitors to purchase new cultural and creative products by concentrating on the design of such products and create preferential ticketing measures for different visitor groups and attract most visitors; museum D curators could establish business and marketing strategies through fun activities and facilities, interesting exhibitions, and museum guides and service personnel to persuade visitors to purchase tickets and thus increase the museum’s reputation and attractiveness and their competitive advantage and have the greatest relative influence of all the criteria.
Museum E (arts and craft type). The priority index for improving the dimensions includes opportunity (O), risks (R), costs (C), and benefits (B), and that for improving the criteria includes R1, O7, C1, B5, O5, C3, R5, R3, B1, C5, O2, R4, C4, C2, O4, B6, B2, B7, O6, B3, O1, and R2. Thus, museum E could motivate visitors to purchase new cultural and creative products by concentrating on the design of such products and enhancing its competitiveness and revenue by forming strategic alliances with industry players from the same or different fields; museum E could be facilitated by increasing revenue from new themed exhibitions and activities that are hosted by the museum to attract visitors and managing relic storage costs, safety, and constant temperature and humidity control via a storehouse management system, as well as by creating cultural and creative products with unique features to increase visitor purchases and planning visitors’ experiences, activities, and use of facilities; museum E could rent out sites within the museum to organizations for events and improve revenue from site rent; museum E could increase collaboration with schools and private enterprises for promotional and cooperative education and expend more effort in updating experience activities and facilities for revenue growth and maintain visitor loyalty and increase revenue from promotional and cooperative education and from visitors taking part in activities and using facilities; museum E could create more fun features and mementoes of cultural and creative products to attract visitor purchases and improve sales revenue from cultural and creative products to increase their competitive advantage and they have the greatest relative influence of all the criteria.
In summary, the study develops and creates a hybrid evaluation model for national museums. This is a good reference for the five different types of national museums’ curators to form competitive strategies.
5. Conclusions
The purpose of this study is to define the indicators affecting the evaluation of competitive advantage of national museums to help curators create their management and marketing strategies. We also discuss the mutual relationships between the evaluation dimensions and criteria and their relative weights in order to provide curators with a complete set of hybrid evaluation models to create competitive advantages. This study has presented a hybrid evaluation model that can use the criteria of influential weights ANP and integrate them with the DEMATEL technique (DANP) to solve the interdependence and feedback problems of national museum criteria and to create the INRM. The modified VIKOR method sets the best values as the aspiration level and the worst values as the tolerable level for all dimensions, thus enabling museum curators to reduce the gaps in reaching their aspiration levels.
The main contributions of this study are fourfold. First, the evaluation of improvement in the national museums’ business and marketing strategies is a decision-making problem involving dependence and interaction dimensions/criteria. This study reviewed the literature and used face-to-face interviews with national museum curators to create four BOCR dimensions and 24 criteria with which to evaluate the performance of national museums for curators to create their own competitive strategies. Second, we used the DEMATEL technique in conjunction with the DANP to create an INRM and influential weights of criteria with the modified VIKOR and ascertain the gaps in five different types of national museums and discover how to improve them. The hybrid evaluation model not only handles the interaction and dependence problems within a set of dimensions and criteria, but also produces more valuable information with which to create a visual cause-and-effect diagram for decision making. Third, the findings indicate that the evaluation results are valid. An analysis of the evaluation results can provide guidance to national museum curators on the critical dimensions/criteria to create and improve their business and marketing strategies. Finally, national museum curators can use the gap analysis results to create new business and marketing strategies for all types of national museums and to enhance their competitive advantage.
This study has some limitations. The evaluation dimensions/criteria were selected from a review of the literature on museum performance evaluation and expert opinions. Other approaches, such as longitudinal studies, should have been used to identify other possible dimensions/criteria. Future studies could use complex proportional assessment with the Grey relations (COPRAS-G) method [49] to evaluate and compare the performance of national museums and private museums. We believe that this study can enhance the efficiency of national museums’ business and marketing strategies. Our findings should help curators decide on how to implement their museum business and marketing strategies more effectively and to enhance their museum’s competitive advantage.
Author Contributions
P.-H.T. conceived the research. P.-H.T. collected and analysed data, and performed the experiments; P.-H.T. wrote the paper; C.-T.L. revised the paper. All authors have read and approved the final version.
Funding
This research received no external funding.
Acknowledgments
The authors would like to thank the anonymous referees and the editors for their valuable comments and suggestions which helped in improving the quality of this paper.
Conflicts of Interest
The authors declare no conflict of interest.
Appendix A. DANP Method
DANP method can be described into following steps:
Step 1. Finding the normalized total-influential matrix
The total-influential matrix is normalized by dividing it by the following equations:
Thus, the total-influential matrix can be normalized and presented as . Now, the sum of each row can be defined as , where and can be normalized by the sum of the rows by dividing the elements in each row by the sum of the row, as in Equation (A1). Thus, the total-influential matrix can be normalized and represented as . Note that , as in Equation (A2). Then, each row of the normalized can be summed to equal 1, so that .
Step 2. Finding the normalized matrix by dimensions and clusters
By normalizing with the total degree of effect and influence of the dimensions and clusters, we obtain , as shown in Equation (A3):
Step 3. Building an unweighted supermatrix,
By normalizing the total-influential matrix into a supermatrix based on the interdependence between the relationship of the dimensions and clusters, we obtain an unweighted supermatrix, , as shown in Equation (A4):
The unweighted supermatrix is the matrix transposed from , which is the basic concept of Saaty’s (1996) ANP, and differs from the traditional ANP. If a blank or 0 is seen in the matrix, the dimensions and criteria are independent.
Step 4. Finding the influential weights of the DANP
The total-influential matrix can be normalized by dividing the dimensions and clusters (Equation (A3)). Thus, can be normalized by summarizing the row by dimension and cluster to obtain . The unweighted supermatrix can be obtained by transposing , that is . From Equation (A5), the weighted supermatrix , which improves the traditional ANP by using equal weight to make it appropriate for the real world, can be obtained as the product of and , that is (Equation (A5)). This demonstrates that influential level values form the basis of normalization to determine a weighted supermatrix.
Step 5. Obtaining the DANP
A weighted supermatrix can be limited by raising it to a sufficiently large power until it converges and becomes a long-term stable supermatrix, to obtain a global priority vector, which defines the influential weights from for the criteria.
Appendix B. Modified VIKOR Method
The compromise ranking algorithm is summarized, as follows (Chen et al., 2015; Lu et al., 2015):
Step 1: Determine the positive- and negative-ideal solutions. Determine the best value and worst value of the assessment criteria for the quality factors. Here, represents the positive-ideal point, meaning that experts score this as the best value (aspired level) for each criterion; in contrast, represents the negative-ideal point, implying that experts assign this as the worst value for each criterion. These results are obtained using Equations (A6) and (A7).
where is a positive-ideal point, representing the best values (aspiration level), and is a negative-ideal point, representing the worst values, for each criterion. We set the aspired level as and the worst value as (from very unimportant or very bad to very important or very good), in contrast to the traditional approach, which sets and . This allows us to avoid “choosing the best among inferior options/alternatives (i.e., avoid picking the best apple from among a barrel of rotten apples)”.
Step 2: Calculate the mean group utility for the gap and maximal gap for prioritizing improvement. We begin development of the modified VIKOR method with the following form of the metric:
where ; we then derive the influential weight wj from the DANP. The VIKOR uses and to formulate the ranking and gap measure.
We define as the gap ratio of alternative k for criterion j. While compromise solution shows the synthesized/aggregated gap ratio that can be minimized while using Equation (B5), indicates which alternative will be the improvement priority, that is which one has the maximum gap ratio of the criteria in each dimension or criterion. Here, represents the influential weights of the criteria obtained from DANP and represents the ratios of distance to the aspired/worst value. For calculating the means of group utility and maximal regret, we compute these gap values using Equations (A11) and (A12).
Step 3: Obtain the comprehensive indicator . To obtain the comprehensive indicator and the sorting results, compute the values using Equation (A13).
These values are derived from , or by setting (the aspired level); , or by setting (the worst situation); , or by setting (the aspired level); and, , or by setting (the worst situation). Therefore, when and , or and , we can re-write Equation (A13) as . If indicates the consideration of the average gap weight, then represents the consideration of the maximum gap for improvement priority. Generally, we can set , but this can be adjusted on the basis of expert opinion.
Appendix C

Table A1.
The unweighted supermatrix .
| Criteria | Benefits (B) | Opportunity (O) | Costs (C) | Risks (R) | ||||||||||||||||||||
|---|---|---|---|---|---|---|---|---|---|---|---|---|---|---|---|---|---|---|---|---|---|---|---|---|
| B1 | B2 | B3 | B4 | B5 | B6 | B7 | O1 | O2 | O3 | O4 | O5 | O6 | O7 | C1 | C2 | C3 | C4 | C5 | R1 | R2 | R3 | R4 | R5 | |
| B1 | 0.109 | 0.162 | 0.160 | 0.166 | 0.158 | 0.145 | 0.164 | 0.199 | 0.157 | 0.148 | 0.162 | 0.161 | 0.165 | 0.150 | 0.150 | 0.193 | 0.146 | 0.150 | 0.148 | 0.154 | 0.177 | 0.192 | 0.194 | 0.236 |
| B2 | 0.184 | 0.128 | 0.190 | 0.196 | 0.207 | 0.209 | 0.199 | 0.173 | 0.171 | 0.178 | 0.174 | 0.175 | 0.167 | 0.173 | 0.191 | 0.217 | 0.176 | 0.181 | 0.174 | 0.169 | 0.171 | 0.171 | 0.183 | 0.176 |
| B3 | 0.180 | 0.184 | 0.114 | 0.167 | 0.164 | 0.149 | 0.151 | 0.165 | 0.160 | 0.169 | 0.164 | 0.168 | 0.148 | 0.164 | 0.163 | 0.166 | 0.154 | 0.163 | 0.156 | 0.159 | 0.160 | 0.165 | 0.160 | 0.160 |
| B4 | 0.132 | 0.149 | 0.153 | 0.102 | 0.136 | 0.146 | 0.131 | 0.117 | 0.136 | 0.124 | 0.125 | 0.114 | 0.189 | 0.124 | 0.122 | 0.114 | 0.195 | 0.117 | 0.107 | 0.131 | 0.109 | 0.123 | 0.116 | 0.113 |
| B5 | 0.140 | 0.129 | 0.129 | 0.136 | 0.090 | 0.137 | 0.149 | 0.140 | 0.131 | 0.126 | 0.127 | 0.121 | 0.115 | 0.132 | 0.125 | 0.117 | 0.115 | 0.138 | 0.138 | 0.131 | 0.133 | 0.124 | 0.126 | 0.117 |
| B6 | 0.097 | 0.097 | 0.095 | 0.090 | 0.093 | 0.064 | 0.094 | 0.083 | 0.097 | 0.096 | 0.093 | 0.091 | 0.083 | 0.113 | 0.105 | 0.076 | 0.085 | 0.092 | 0.092 | 0.113 | 0.103 | 0.083 | 0.086 | 0.078 |
| B7 | 0.158 | 0.150 | 0.159 | 0.144 | 0.152 | 0.150 | 0.112 | 0.123 | 0.147 | 0.159 | 0.154 | 0.171 | 0.134 | 0.143 | 0.143 | 0.117 | 0.130 | 0.158 | 0.185 | 0.143 | 0.146 | 0.142 | 0.135 | 0.120 |
| O1 | 0.061 | 0.057 | 0.058 | 0.063 | 0.063 | 0.059 | 0.056 | 0.042 | 0.050 | 0.050 | 0.061 | 0.047 | 0.052 | 0.049 | 0.081 | 0.157 | 0.051 | 0.057 | 0.041 | 0.039 | 0.063 | 0.062 | 0.058 | 0.108 |
| O2 | 0.159 | 0.151 | 0.160 | 0.159 | 0.159 | 0.149 | 0.159 | 0.175 | 0.119 | 0.198 | 0.192 | 0.206 | 0.239 | 0.205 | 0.173 | 0.147 | 0.159 | 0.171 | 0.177 | 0.177 | 0.166 | 0.175 | 0.167 | 0.155 |
| O3 | 0.128 | 0.132 | 0.133 | 0.109 | 0.119 | 0.123 | 0.114 | 0.094 | 0.151 | 0.101 | 0.122 | 0.131 | 0.111 | 0.137 | 0.132 | 0.102 | 0.091 | 0.145 | 0.149 | 0.141 | 0.119 | 0.107 | 0.117 | 0.095 |
| O4 | 0.160 | 0.161 | 0.159 | 0.138 | 0.163 | 0.151 | 0.160 | 0.173 | 0.169 | 0.149 | 0.112 | 0.164 | 0.141 | 0.164 | 0.162 | 0.152 | 0.142 | 0.170 | 0.161 | 0.151 | 0.182 | 0.173 | 0.190 | 0.186 |
| O5 | 0.167 | 0.169 | 0.169 | 0.158 | 0.163 | 0.161 | 0.214 | 0.163 | 0.171 | 0.150 | 0.184 | 0.129 | 0.169 | 0.164 | 0.174 | 0.153 | 0.154 | 0.186 | 0.205 | 0.170 | 0.197 | 0.181 | 0.192 | 0.191 |
| O6 | 0.157 | 0.158 | 0.154 | 0.221 | 0.145 | 0.154 | 0.142 | 0.162 | 0.150 | 0.132 | 0.152 | 0.149 | 0.124 | 0.164 | 0.156 | 0.154 | 0.266 | 0.142 | 0.141 | 0.156 | 0.135 | 0.142 | 0.118 | 0.127 |
| O7 | 0.168 | 0.173 | 0.165 | 0.152 | 0.189 | 0.204 | 0.155 | 0.192 | 0.189 | 0.220 | 0.178 | 0.174 | 0.164 | 0.116 | 0.122 | 0.134 | 0.138 | 0.129 | 0.125 | 0.166 | 0.139 | 0.160 | 0.158 | 0.137 |
| C1 | 0.267 | 0.288 | 0.269 | 0.281 | 0.308 | 0.331 | 0.292 | 0.276 | 0.284 | 0.322 | 0.316 | 0.299 | 0.290 | 0.263 | 0.199 | 0.387 | 0.391 | 0.336 | 0.349 | 0.296 | 0.286 | 0.259 | 0.272 | 0.305 |
| C2 | 0.126 | 0.150 | 0.130 | 0.116 | 0.131 | 0.130 | 0.100 | 0.141 | 0.097 | 0.100 | 0.091 | 0.082 | 0.109 | 0.083 | 0.177 | 0.090 | 0.091 | 0.094 | 0.097 | 0.082 | 0.150 | 0.202 | 0.173 | 0.283 |
| C3 | 0.157 | 0.147 | 0.157 | 0.253 | 0.153 | 0.139 | 0.122 | 0.165 | 0.157 | 0.125 | 0.142 | 0.118 | 0.260 | 0.177 | 0.142 | 0.092 | 0.120 | 0.139 | 0.135 | 0.143 | 0.088 | 0.085 | 0.084 | 0.077 |
| C4 | 0.229 | 0.208 | 0.222 | 0.187 | 0.204 | 0.194 | 0.204 | 0.230 | 0.246 | 0.238 | 0.244 | 0.220 | 0.179 | 0.247 | 0.243 | 0.238 | 0.204 | 0.169 | 0.243 | 0.240 | 0.238 | 0.232 | 0.248 | 0.172 |
| C5 | 0.221 | 0.207 | 0.221 | 0.163 | 0.204 | 0.206 | 0.282 | 0.187 | 0.216 | 0.215 | 0.206 | 0.282 | 0.161 | 0.231 | 0.239 | 0.193 | 0.194 | 0.261 | 0.175 | 0.239 | 0.238 | 0.223 | 0.223 | 0.162 |
| R1 | 0.363 | 0.433 | 0.343 | 0.512 | 0.493 | 0.503 | 0.460 | 0.415 | 0.489 | 0.525 | 0.460 | 0.502 | 0.569 | 0.572 | 0.319 | 0.220 | 0.515 | 0.357 | 0.348 | 0.354 | 0.241 | 0.270 | 0.275 | 0.244 |
| R2 | 0.120 | 0.141 | 0.156 | 0.118 | 0.128 | 0.126 | 0.137 | 0.108 | 0.127 | 0.130 | 0.148 | 0.133 | 0.104 | 0.120 | 0.173 | 0.113 | 0.117 | 0.164 | 0.170 | 0.163 | 0.073 | 0.121 | 0.103 | 0.123 |
| R3 | 0.169 | 0.135 | 0.160 | 0.126 | 0.129 | 0.125 | 0.139 | 0.151 | 0.132 | 0.117 | 0.113 | 0.123 | 0.111 | 0.105 | 0.176 | 0.226 | 0.131 | 0.193 | 0.185 | 0.164 | 0.221 | 0.091 | 0.269 | 0.255 |
| R4 | 0.175 | 0.134 | 0.170 | 0.116 | 0.119 | 0.117 | 0.127 | 0.128 | 0.129 | 0.114 | 0.151 | 0.120 | 0.104 | 0.100 | 0.141 | 0.150 | 0.113 | 0.145 | 0.147 | 0.157 | 0.234 | 0.263 | 0.088 | 0.288 |
| R5 | 0.172 | 0.157 | 0.171 | 0.128 | 0.132 | 0.129 | 0.137 | 0.197 | 0.123 | 0.113 | 0.127 | 0.122 | 0.113 | 0.103 | 0.190 | 0.291 | 0.125 | 0.141 | 0.150 | 0.162 | 0.231 | 0.255 | 0.264 | 0.091 |
Appendix D
Table A2.
The weighted supermatrix .
| Criteria | Benefits (B) | Opportunity (O) | Costs (C) | Risks (R) | ||||||||||||||||||||
|---|---|---|---|---|---|---|---|---|---|---|---|---|---|---|---|---|---|---|---|---|---|---|---|---|
| B1 | B2 | B3 | B4 | B5 | B6 | B7 | O1 | O2 | O3 | O4 | O5 | O6 | O7 | C1 | C2 | C3 | C4 | C5 | R1 | R2 | R3 | R4 | R5 | |
| B1 | 0.026 | 0.039 | 0.038 | 0.040 | 0.038 | 0.035 | 0.039 | 0.053 | 0.042 | 0.040 | 0.043 | 0.043 | 0.044 | 0.040 | 0.039 | 0.050 | 0.038 | 0.039 | 0.038 | 0.040 | 0.046 | 0.050 | 0.051 | 0.062 |
| B2 | 0.044 | 0.031 | 0.045 | 0.047 | 0.049 | 0.050 | 0.047 | 0.046 | 0.046 | 0.048 | 0.047 | 0.047 | 0.045 | 0.046 | 0.050 | 0.056 | 0.046 | 0.047 | 0.045 | 0.044 | 0.045 | 0.045 | 0.048 | 0.046 |
| B3 | 0.043 | 0.044 | 0.027 | 0.040 | 0.039 | 0.036 | 0.036 | 0.044 | 0.043 | 0.045 | 0.044 | 0.045 | 0.040 | 0.044 | 0.042 | 0.043 | 0.040 | 0.042 | 0.041 | 0.042 | 0.042 | 0.043 | 0.042 | 0.042 |
| B4 | 0.031 | 0.035 | 0.037 | 0.024 | 0.032 | 0.035 | 0.031 | 0.031 | 0.036 | 0.033 | 0.033 | 0.030 | 0.051 | 0.033 | 0.032 | 0.030 | 0.050 | 0.030 | 0.028 | 0.034 | 0.029 | 0.032 | 0.030 | 0.029 |
| B5 | 0.033 | 0.031 | 0.031 | 0.032 | 0.022 | 0.033 | 0.036 | 0.037 | 0.035 | 0.034 | 0.034 | 0.032 | 0.031 | 0.035 | 0.032 | 0.030 | 0.030 | 0.036 | 0.036 | 0.034 | 0.035 | 0.032 | 0.033 | 0.030 |
| B6 | 0.023 | 0.023 | 0.023 | 0.022 | 0.022 | 0.015 | 0.023 | 0.022 | 0.026 | 0.026 | 0.025 | 0.024 | 0.022 | 0.030 | 0.027 | 0.020 | 0.022 | 0.024 | 0.024 | 0.029 | 0.027 | 0.022 | 0.023 | 0.020 |
| B7 | 0.038 | 0.036 | 0.038 | 0.034 | 0.036 | 0.036 | 0.027 | 0.033 | 0.039 | 0.043 | 0.041 | 0.046 | 0.036 | 0.038 | 0.037 | 0.030 | 0.034 | 0.041 | 0.048 | 0.037 | 0.038 | 0.037 | 0.035 | 0.031 |
| O1 | 0.016 | 0.015 | 0.015 | 0.017 | 0.017 | 0.016 | 0.015 | 0.010 | 0.012 | 0.012 | 0.015 | 0.011 | 0.013 | 0.012 | 0.022 | 0.042 | 0.014 | 0.015 | 0.011 | 0.010 | 0.017 | 0.017 | 0.016 | 0.029 |
| O2 | 0.042 | 0.040 | 0.042 | 0.042 | 0.042 | 0.039 | 0.042 | 0.042 | 0.029 | 0.048 | 0.047 | 0.050 | 0.058 | 0.050 | 0.047 | 0.040 | 0.043 | 0.046 | 0.048 | 0.047 | 0.044 | 0.047 | 0.045 | 0.041 |
| O3 | 0.034 | 0.035 | 0.035 | 0.029 | 0.031 | 0.032 | 0.030 | 0.023 | 0.037 | 0.025 | 0.030 | 0.032 | 0.027 | 0.033 | 0.036 | 0.028 | 0.025 | 0.039 | 0.040 | 0.038 | 0.032 | 0.029 | 0.031 | 0.025 |
| O4 | 0.042 | 0.042 | 0.042 | 0.036 | 0.043 | 0.040 | 0.042 | 0.042 | 0.041 | 0.036 | 0.027 | 0.040 | 0.034 | 0.040 | 0.044 | 0.041 | 0.038 | 0.046 | 0.044 | 0.040 | 0.049 | 0.046 | 0.051 | 0.050 |
| O5 | 0.044 | 0.045 | 0.045 | 0.042 | 0.043 | 0.042 | 0.056 | 0.040 | 0.042 | 0.037 | 0.045 | 0.031 | 0.041 | 0.040 | 0.047 | 0.041 | 0.041 | 0.050 | 0.055 | 0.045 | 0.053 | 0.048 | 0.051 | 0.051 |
| O6 | 0.041 | 0.042 | 0.041 | 0.058 | 0.038 | 0.041 | 0.037 | 0.039 | 0.036 | 0.032 | 0.037 | 0.036 | 0.030 | 0.040 | 0.042 | 0.042 | 0.072 | 0.038 | 0.038 | 0.042 | 0.036 | 0.038 | 0.031 | 0.034 |
| O7 | 0.044 | 0.046 | 0.044 | 0.040 | 0.050 | 0.054 | 0.041 | 0.047 | 0.046 | 0.053 | 0.043 | 0.042 | 0.040 | 0.028 | 0.033 | 0.036 | 0.037 | 0.035 | 0.034 | 0.044 | 0.037 | 0.043 | 0.042 | 0.036 |
| C1 | 0.069 | 0.075 | 0.070 | 0.073 | 0.080 | 0.086 | 0.076 | 0.070 | 0.072 | 0.082 | 0.080 | 0.076 | 0.074 | 0.067 | 0.047 | 0.090 | 0.091 | 0.079 | 0.082 | 0.076 | 0.073 | 0.066 | 0.070 | 0.078 |
| C2 | 0.033 | 0.039 | 0.034 | 0.030 | 0.034 | 0.034 | 0.026 | 0.036 | 0.025 | 0.025 | 0.023 | 0.021 | 0.028 | 0.021 | 0.041 | 0.021 | 0.021 | 0.022 | 0.023 | 0.021 | 0.038 | 0.052 | 0.044 | 0.072 |
| C3 | 0.041 | 0.038 | 0.041 | 0.066 | 0.040 | 0.036 | 0.031 | 0.042 | 0.040 | 0.032 | 0.036 | 0.030 | 0.066 | 0.045 | 0.033 | 0.022 | 0.028 | 0.032 | 0.032 | 0.037 | 0.022 | 0.022 | 0.021 | 0.020 |
| C4 | 0.059 | 0.054 | 0.058 | 0.048 | 0.053 | 0.050 | 0.053 | 0.058 | 0.062 | 0.060 | 0.062 | 0.056 | 0.046 | 0.063 | 0.057 | 0.056 | 0.048 | 0.039 | 0.057 | 0.061 | 0.061 | 0.059 | 0.063 | 0.044 |
| C5 | 0.057 | 0.054 | 0.057 | 0.042 | 0.053 | 0.053 | 0.073 | 0.047 | 0.055 | 0.055 | 0.052 | 0.071 | 0.041 | 0.059 | 0.056 | 0.045 | 0.045 | 0.061 | 0.041 | 0.061 | 0.061 | 0.057 | 0.057 | 0.041 |
| R1 | 0.087 | 0.103 | 0.082 | 0.122 | 0.118 | 0.120 | 0.110 | 0.098 | 0.115 | 0.124 | 0.108 | 0.118 | 0.134 | 0.135 | 0.076 | 0.052 | 0.122 | 0.085 | 0.083 | 0.077 | 0.052 | 0.058 | 0.060 | 0.053 |
| R2 | 0.029 | 0.034 | 0.037 | 0.028 | 0.031 | 0.030 | 0.033 | 0.025 | 0.030 | 0.031 | 0.035 | 0.031 | 0.024 | 0.028 | 0.041 | 0.027 | 0.028 | 0.039 | 0.040 | 0.035 | 0.016 | 0.026 | 0.022 | 0.027 |
| R3 | 0.040 | 0.032 | 0.038 | 0.030 | 0.031 | 0.030 | 0.033 | 0.036 | 0.031 | 0.028 | 0.027 | 0.029 | 0.026 | 0.025 | 0.042 | 0.054 | 0.031 | 0.046 | 0.044 | 0.036 | 0.048 | 0.020 | 0.058 | 0.055 |
| R4 | 0.042 | 0.032 | 0.041 | 0.028 | 0.028 | 0.028 | 0.030 | 0.030 | 0.030 | 0.027 | 0.036 | 0.028 | 0.024 | 0.024 | 0.034 | 0.036 | 0.027 | 0.034 | 0.035 | 0.034 | 0.051 | 0.057 | 0.019 | 0.062 |
| R5 | 0.041 | 0.038 | 0.041 | 0.031 | 0.031 | 0.031 | 0.033 | 0.046 | 0.029 | 0.027 | 0.030 | 0.029 | 0.027 | 0.024 | 0.045 | 0.069 | 0.030 | 0.034 | 0.036 | 0.035 | 0.050 | 0.055 | 0.057 | 0.020 |
Appendix E
Table A3.
Influential weights by stable matrix of DANP when power .
| Criteria | Benefits (B) | Opportunity (O) | Costs (C) | Risks (R) | ||||||||||||||||||||
|---|---|---|---|---|---|---|---|---|---|---|---|---|---|---|---|---|---|---|---|---|---|---|---|---|
| B1 | B2 | B3 | B4 | B5 | B6 | B7 | O1 | O2 | O3 | O4 | O5 | O6 | O7 | C1 | C2 | C3 | C4 | C5 | R1 | R2 | R3 | R4 | R5 | |
| B1 | 0.041 | 0.041 | 0.041 | 0.041 | 0.041 | 0.041 | 0.041 | 0.041 | 0.041 | 0.041 | 0.041 | 0.041 | 0.041 | 0.041 | 0.041 | 0.041 | 0.041 | 0.041 | 0.041 | 0.041 | 0.041 | 0.041 | 0.041 | 0.041 |
| B2 | 0.046 | 0.046 | 0.046 | 0.046 | 0.046 | 0.046 | 0.046 | 0.046 | 0.046 | 0.046 | 0.046 | 0.046 | 0.046 | 0.046 | 0.046 | 0.046 | 0.046 | 0.046 | 0.046 | 0.046 | 0.046 | 0.046 | 0.046 | 0.046 |
| B3 | 0.041 | 0.041 | 0.041 | 0.041 | 0.041 | 0.041 | 0.041 | 0.041 | 0.041 | 0.041 | 0.041 | 0.041 | 0.041 | 0.041 | 0.041 | 0.041 | 0.041 | 0.041 | 0.041 | 0.041 | 0.041 | 0.041 | 0.041 | 0.041 |
| B4 | 0.033 | 0.033 | 0.033 | 0.033 | 0.033 | 0.033 | 0.033 | 0.033 | 0.033 | 0.033 | 0.033 | 0.033 | 0.033 | 0.033 | 0.033 | 0.033 | 0.033 | 0.033 | 0.033 | 0.033 | 0.033 | 0.033 | 0.033 | 0.033 |
| B5 | 0.033 | 0.033 | 0.033 | 0.033 | 0.033 | 0.033 | 0.033 | 0.033 | 0.033 | 0.033 | 0.033 | 0.033 | 0.033 | 0.033 | 0.033 | 0.033 | 0.033 | 0.033 | 0.033 | 0.033 | 0.033 | 0.033 | 0.033 | 0.033 |
| B6 | 0.024 | 0.024 | 0.024 | 0.024 | 0.024 | 0.024 | 0.024 | 0.024 | 0.024 | 0.024 | 0.024 | 0.024 | 0.024 | 0.024 | 0.024 | 0.024 | 0.024 | 0.024 | 0.024 | 0.024 | 0.024 | 0.024 | 0.024 | 0.024 |
| B7 | 0.038 | 0.038 | 0.038 | 0.038 | 0.038 | 0.038 | 0.038 | 0.038 | 0.038 | 0.038 | 0.038 | 0.038 | 0.038 | 0.038 | 0.038 | 0.038 | 0.038 | 0.038 | 0.038 | 0.038 | 0.038 | 0.038 | 0.038 | 0.038 |
| O1 | 0.016 | 0.016 | 0.016 | 0.016 | 0.016 | 0.016 | 0.016 | 0.016 | 0.016 | 0.016 | 0.016 | 0.016 | 0.016 | 0.016 | 0.016 | 0.016 | 0.016 | 0.016 | 0.016 | 0.016 | 0.016 | 0.016 | 0.016 | 0.016 |
| O2 | 0.045 | 0.045 | 0.045 | 0.045 | 0.045 | 0.045 | 0.045 | 0.045 | 0.045 | 0.045 | 0.045 | 0.045 | 0.045 | 0.045 | 0.045 | 0.045 | 0.045 | 0.045 | 0.045 | 0.045 | 0.045 | 0.045 | 0.045 | 0.045 |
| O3 | 0.033 | 0.033 | 0.033 | 0.033 | 0.033 | 0.033 | 0.033 | 0.033 | 0.033 | 0.033 | 0.033 | 0.033 | 0.033 | 0.033 | 0.033 | 0.033 | 0.033 | 0.033 | 0.033 | 0.033 | 0.033 | 0.033 | 0.033 | 0.033 |
| O4 | 0.042 | 0.042 | 0.042 | 0.042 | 0.042 | 0.042 | 0.042 | 0.042 | 0.042 | 0.042 | 0.042 | 0.042 | 0.042 | 0.042 | 0.042 | 0.042 | 0.042 | 0.042 | 0.042 | 0.042 | 0.042 | 0.042 | 0.042 | 0.042 |
| O5 | 0.045 | 0.045 | 0.045 | 0.045 | 0.045 | 0.045 | 0.045 | 0.045 | 0.045 | 0.045 | 0.045 | 0.045 | 0.045 | 0.045 | 0.045 | 0.045 | 0.045 | 0.045 | 0.045 | 0.045 | 0.045 | 0.045 | 0.045 | 0.045 |
| O6 | 0.040 | 0.040 | 0.040 | 0.040 | 0.040 | 0.040 | 0.040 | 0.040 | 0.040 | 0.040 | 0.040 | 0.040 | 0.040 | 0.040 | 0.040 | 0.040 | 0.040 | 0.040 | 0.040 | 0.040 | 0.040 | 0.040 | 0.040 | 0.040 |
| O7 | 0.041 | 0.041 | 0.041 | 0.041 | 0.041 | 0.041 | 0.041 | 0.041 | 0.041 | 0.041 | 0.041 | 0.041 | 0.041 | 0.041 | 0.041 | 0.041 | 0.041 | 0.041 | 0.041 | 0.041 | 0.041 | 0.041 | 0.041 | 0.041 |
| C1 | 0.074 | 0.074 | 0.074 | 0.074 | 0.074 | 0.074 | 0.074 | 0.074 | 0.074 | 0.074 | 0.074 | 0.074 | 0.074 | 0.074 | 0.074 | 0.074 | 0.074 | 0.074 | 0.074 | 0.074 | 0.074 | 0.074 | 0.074 | 0.074 |
| C2 | 0.031 | 0.031 | 0.031 | 0.031 | 0.031 | 0.031 | 0.031 | 0.031 | 0.031 | 0.031 | 0.031 | 0.031 | 0.031 | 0.031 | 0.031 | 0.031 | 0.031 | 0.031 | 0.031 | 0.031 | 0.031 | 0.031 | 0.031 | 0.031 |
| C3 | 0.035 | 0.035 | 0.035 | 0.035 | 0.035 | 0.035 | 0.035 | 0.035 | 0.035 | 0.035 | 0.035 | 0.035 | 0.035 | 0.035 | 0.035 | 0.035 | 0.035 | 0.035 | 0.035 | 0.035 | 0.035 | 0.035 | 0.035 | 0.035 |
| C4 | 0.056 | 0.056 | 0.056 | 0.056 | 0.056 | 0.056 | 0.056 | 0.056 | 0.056 | 0.056 | 0.056 | 0.056 | 0.056 | 0.056 | 0.056 | 0.056 | 0.056 | 0.056 | 0.056 | 0.056 | 0.056 | 0.056 | 0.056 | 0.056 |
| C5 | 0.055 | 0.055 | 0.055 | 0.055 | 0.055 | 0.055 | 0.055 | 0.055 | 0.055 | 0.055 | 0.055 | 0.055 | 0.055 | 0.055 | 0.055 | 0.055 | 0.055 | 0.055 | 0.055 | 0.055 | 0.055 | 0.055 | 0.055 | 0.055 |
| R1 | 0.094 | 0.094 | 0.094 | 0.094 | 0.094 | 0.094 | 0.094 | 0.094 | 0.094 | 0.094 | 0.094 | 0.094 | 0.094 | 0.094 | 0.094 | 0.094 | 0.094 | 0.094 | 0.094 | 0.094 | 0.094 | 0.094 | 0.094 | 0.094 |
| R2 | 0.032 | 0.032 | 0.032 | 0.032 | 0.032 | 0.032 | 0.032 | 0.032 | 0.032 | 0.032 | 0.032 | 0.032 | 0.032 | 0.032 | 0.032 | 0.032 | 0.032 | 0.032 | 0.032 | 0.032 | 0.032 | 0.032 | 0.032 | 0.032 |
| R3 | 0.036 | 0.036 | 0.036 | 0.036 | 0.036 | 0.036 | 0.036 | 0.036 | 0.036 | 0.036 | 0.036 | 0.036 | 0.036 | 0.036 | 0.036 | 0.036 | 0.036 | 0.036 | 0.036 | 0.036 | 0.036 | 0.036 | 0.036 | 0.036 |
| R4 | 0.034 | 0.034 | 0.034 | 0.034 | 0.034 | 0.034 | 0.034 | 0.034 | 0.034 | 0.034 | 0.034 | 0.034 | 0.034 | 0.034 | 0.034 | 0.034 | 0.034 | 0.034 | 0.034 | 0.034 | 0.034 | 0.034 | 0.034 | 0.034 |
| R5 | 0.037 | 0.037 | 0.037 | 0.037 | 0.037 | 0.037 | 0.037 | 0.037 | 0.037 | 0.037 | 0.037 | 0.037 | 0.037 | 0.037 | 0.037 | 0.037 | 0.037 | 0.037 | 0.037 | 0.037 | 0.037 | 0.037 | 0.037 | 0.037 |
Appendix F
Table A4.
The gaps evaluation of the national museums by modified VIKOR.
| Dimensions/Criteria | Original Weights | Overall Weights (by DANP) | Museum A | Museum B | Museum C | Museum D | Museum E | |||||
|---|---|---|---|---|---|---|---|---|---|---|---|---|
| Scores (Museum A) | Gap (VIKOR) | Scores (Museum B) | Gap (VIKOR) | Scores (Museum C) | Gap (VIKOR) | Scores (Museum D) | Gap (VIKOR) | Scores (Museum E) | Gap (VIKOR) | |||
| Benefits | 0.256 | 7.600 | 0.000 | 7.600 | 0.000 | 7.267 | 0.160 | 7.067 | 0.256 | 7.467 | 0.064 | |
| B1 | 0.152 | 0.041 | 8.400 | 0.000 | 8.000 | 0.016 | 7.333 | 0.041 | 8.067 | 0.013 | 7.867 | 0.021 |
| B2 | 0.184 | 0.046 | 7.000 | 0.034 | 7.000 | 0.034 | 6.867 | 0.046 | 7.400 | 0.000 | 7.267 | 0.011 |
| B3 | 0.159 | 0.041 | 7.600 | 0.000 | 7.533 | 0.005 | 7.000 | 0.041 | 7.467 | 0.009 | 7.467 | 0.009 |
| B4 | 0.136 | 0.033 | 7.400 | 0.000 | 6.200 | 0.032 | 6.600 | 0.021 | 6.133 | 0.033 | 7.400 | 0.000 |
| B5 | 0.130 | 0.033 | 6.600 | 0.028 | 7.333 | 0.000 | 6.467 | 0.033 | 7.267 | 0.003 | 6.600 | 0.028 |
| B6 | 0.092 | 0.024 | 5.267 | 0.024 | 5.933 | 0.000 | 5.933 | 0.000 | 5.933 | 0.000 | 5.600 | 0.012 |
| B7 | 0.146 | 0.038 | 6.400 | 0.038 | 7.000 | 0.023 | 6.867 | 0.026 | 7.933 | 0.000 | 7.467 | 0.011 |
| Opportunity | 0.261 | 6.600 | 0.261 | 7.333 | 0.124 | 7.600 | 0.074 | 8.000 | 0.000 | 6.933 | 0.199 | |
| O1 | 0.051 | 0.016 | 8.533 | 0.000 | 7.600 | 0.007 | 6.267 | 0.016 | 7.600 | 0.007 | 7.400 | 0.008 |
| O2 | 0.189 | 0.045 | 7.333 | 0.000 | 7.200 | 0.010 | 6.733 | 0.045 | 7.267 | 0.005 | 7.067 | 0.020 |
| O3 | 0.126 | 0.033 | 5.733 | 0.024 | 5.867 | 0.016 | 6.133 | 0.000 | 5.600 | 0.033 | 6.133 | 0.000 |
| O4 | 0.152 | 0.042 | 7.867 | 0.014 | 7.867 | 0.014 | 7.733 | 0.042 | 7.933 | 0.000 | 7.867 | 0.014 |
| O5 | 0.162 | 0.045 | 7.333 | 0.045 | 7.333 | 0.045 | 7.733 | 0.015 | 7.933 | 0.000 | 7.600 | 0.025 |
| O6 | 0.147 | 0.040 | 7.600 | 0.000 | 6.200 | 0.040 | 6.400 | 0.034 | 6.733 | 0.025 | 7.267 | 0.010 |
| O7 | 0.173 | 0.041 | 7.200 | 0.000 | 6.467 | 0.041 | 6.867 | 0.019 | 7.000 | 0.011 | 6.533 | 0.037 |
| Costs | 0.251 | 8.200 | 0.000 | 6.867 | 0.239 | 6.800 | 0.251 | 7.267 | 0.167 | 7.800 | 0.072 | |
| C1 | 0.310 | 0.074 | 7.467 | 0.074 | 7.400 | 0.067 | 6.800 | 0.000 | 7.200 | 0.044 | 7.133 | 0.037 |
| C2 | 0.120 | 0.031 | 8.133 | 0.031 | 7.533 | 0.020 | 6.400 | 0.000 | 6.800 | 0.007 | 7.267 | 0.015 |
| C3 | 0.131 | 0.035 | 6.600 | 0.035 | 5.267 | 0.002 | 5.933 | 0.019 | 5.200 | 0.000 | 6.200 | 0.025 |
| C4 | 0.221 | 0.056 | 7.000 | 0.028 | 6.533 | 0.003 | 6.467 | 0.000 | 7.533 | 0.056 | 6.800 | 0.017 |
| C5 | 0.219 | 0.055 | 6.533 | 0.008 | 6.867 | 0.029 | 6.400 | 0.000 | 7.267 | 0.055 | 6.733 | 0.021 |
| Risks | 0.232 | 8.400 | 0.232 | 6.333 | 0.000 | 6.667 | 0.037 | 6.933 | 0.067 | 7.600 | 0.142 | |
| R1 | 0.286 | 0.094 | 5.467 | 0.000 | 5.267 | 0.015 | 6.333 | 0.094 | 5.933 | 0.064 | 6.267 | 0.089 |
| R2 | 0.124 | 0.032 | 8.133 | 0.032 | 7.800 | 0.000 | 7.867 | 0.006 | 7.867 | 0.006 | 7.867 | 0.006 |
| R3 | 0.196 | 0.036 | 8.467 | 0.036 | 7.867 | 0.024 | 6.667 | 0.000 | 6.733 | 0.001 | 7.733 | 0.022 |
| R4 | 0.199 | 0.034 | 8.467 | 0.034 | 6.533 | 0.011 | 5.667 | 0.000 | 5.667 | 0.000 | 7.333 | 0.020 |
| R5 | 0.195 | 0.037 | 9.067 | 0.037 | 8.133 | 0.013 | 7.600 | 0.000 | 7.667 | 0.002 | 8.533 | 0.023 |
References
- Liket, K.C.; Maas, K. Nonprofit organizational effectiveness analysis of best practices. Nonprofit Volunt. Sect. Q. 2015, 44, 268–296. [Google Scholar] [CrossRef]
- Macedo, I.M.; Pinho, J.C.; Silva, A.M. Revisiting the link between mission statements and organizational performance in the non-profit sector: The medicating effect of organizational commitment. Eur. Manag. J. 2016, 34, 36–46. [Google Scholar] [CrossRef]
- Chang, S.C.; Tsai, P.H. A hybrid financial performance evaluation model for wealth management banks following the global financial crisis. Technol. Econ. Dev. Econ. 2016, 22, 21–46. [Google Scholar] [CrossRef]
- Taheri, H.; Ansari, S. Measuring the relative efficiency of cultural-historical museums in Tehran: DEA approach. J. Cult. Herit. 2013, 14, 431–438. [Google Scholar] [CrossRef]
- Mottner, S.; Ford, J.B. Measuring nonprofit marketing strategy performance: The case of museum stores. J. Bus. Res. 2005, 58, 829–840. [Google Scholar] [CrossRef]
- Neely, D.G.; Tinkelman, D. The whip cancer walk: A case of real earnings management in the nonprofit sector. J. Account. Educ. 2013, 31, 294–309. [Google Scholar] [CrossRef]
- Felício, J.A.; Gonçalves, H.M.; Gonçalves, V.D.C. Social value and organizational performance in non-profit social organizations: Social entrepreneurship, leadership, and socioeconomic context effects. J. Bus. Res. 2013, 66, 2139–2146. [Google Scholar] [CrossRef]
- Newton, A.N. Executive compensation, organizational performance, and governance quality in the absence of owners. J. Corp. Financ. 2015, 30, 195–222. [Google Scholar] [CrossRef]
- Zorloni, A. Designing a strategic framework to assess museum activities. Int. J. Arts Manag. 2012, 14, 31–47. [Google Scholar]
- Alcaraz, C.; Hume, M.; Mort, G.S. Creating sustainable practice in a museum context: Adopting service-centricity in non-profit museums. Australas. Mark. J. 2009, 17, 219–225. [Google Scholar] [CrossRef]
- International Council of Museums (ICOM). Available online: https://icom.museum (accessed on 10 August 2018).
- Mclntyre, D. The national museum of Australia and public discourse: The role of public policies in the nation’s cultural debates. Mus. Int. 2006, 58, 12–20. [Google Scholar]
- Pop, I.L.; Borza, A. Factors influencing museum sustainability and indicators for museum sustainability measurement. Sustainability 2016, 8, 101. [Google Scholar] [CrossRef]
- Dimache, A.; Wondirad, A.; Agyeiwaah, E. One museum, two stories: Place identity at the Hong Kong Museum of History. Tour. Manag. 2017, 63, 287–301. [Google Scholar] [CrossRef]
- Paulus, O. Measuring museum performance: A study of museums in France and the United States. Int. J. Arts Manag. 2003, 6, 50–63. [Google Scholar]
- Bollen, J. Don’t give up the strip!: Erotic performance as live entertainment in mid-twentieth century Australia. J. Aust. Stud. 2010, 34, 125–140. [Google Scholar] [CrossRef]
- Hanquinet, L.; Savage, M. Educative leisure and the art museum. Mus. Soc. 2012, 10, 42–59. [Google Scholar]
- Basso, A.; Casarin, F.; Funari, S. How well is the museum performing? A joint use of DEA and BSC to measure the performance of museums. Omega 2018, 81, 67–84. [Google Scholar] [CrossRef]
- Tsai, P.H.; Lin, C.T. Creating a business strategy evaluation model for national museums based on the views of curators. Curator Mus. J. 2016, 59, 287–303. [Google Scholar] [CrossRef]
- Chiu, W.Y.; Tzeng, G.H.; Li, H.L. A new hybrid MCDM model combining DANP with VIKOR to improve e-store business. Knowl.-Based Syst. 2013, 37, 48–61. [Google Scholar] [CrossRef]
- Chen, F.H.; Tzeng, G.H.; Chang, C.C. Evaluating the enhancement of corporate social responsibility websites quality based on a new hybrid MADM model. Int. J. Inf. Technol. Decis. Mak. 2015, 14, 697–724. [Google Scholar] [CrossRef]
- Lim, Y.J.; Kim, H.K.; Lee, T.J. Visitor motivational factors and level of satisfaction in wellness tourism: Comparison between first-time visitors and repeat visitors. Asia Pac. J. Tour. Res. 2016, 21, 137–156. [Google Scholar] [CrossRef]
- Saaty, T.L. Decision Making with Dependence and Feedback: The Analytic Network Process: The Organization and Prioritization of Complexity; RWS Publications: Pittsburgh, PA, USA, 1996; pp. 362–370. [Google Scholar]
- Saaty, T.L.; Özdemir, M. Negative priorities in the analytic hierarchy process. Math. Comput. Model. 2003, 37, 1063–1075. [Google Scholar] [CrossRef]
- Ghajar, I.; Najafi, A. Evaluation of harvesting methods for sustainable forest management (SFM) using the analytical network process (ANP). For. Policy Econ. 2012, 21, 81–91. [Google Scholar] [CrossRef]
- Jung, U.; Seo, D.W. An ANP approach for R&D project evaluation based on interdependencies between research objectives and evaluation criteria. Decis. Support Syst. 2010, 49, 335–342. [Google Scholar]
- Adamus, W.; Florkowski, W.J. The evolution of shale gas development and energy security in Poland: Presenting a hierarchical choice of priorities. Energy Res. Soc. Sci. 2016, 20, 168–178. [Google Scholar] [CrossRef]
- Cuomo, S.; Michele, P.D.; Piccialli, F.; Galletti, A.; Jung, J.E. IoT-based collaborative reputation system for associating visitors and artworks in a cultural scenario. Expert Syst. Appl. 2017, 79, 101–111. [Google Scholar] [CrossRef]
- Kamakura, W.A.; Schimmel, C.W. Uncovering audience preferences for concert features from single-ticket sales with a factor-analytic random-coefficients model. Int. J. Res. Mark. 2013, 30, 129–142. [Google Scholar] [CrossRef]
- Pignataro, G. Measuring the efficiency of museums: A case study in sicily. In The Economics of Heritage: A Study in the Political Economy of Culture in Sicily; Rizzo, I., Towse, R., Eds.; Edward Elgar Publishing Ltd.: Cheltenham, UK, 2002; pp. 65–78. [Google Scholar]
- Mairesse, F.; Vanden Eeckaut, P. Museum assessment and FDH technology: Towards a global approach. J. Cult. Econ. 2002, 26, 261–286. [Google Scholar] [CrossRef]
- Kidd, J. Enacting engagement online: Framing social media use for the museum. Inf. Technol. People 2011, 24, 64–77. [Google Scholar] [CrossRef]
- Magno, F. The influence of cultural blogs on their readers’ cultural product choices. Int. J. Inf. Manag. 2017, 37, 142–149. [Google Scholar] [CrossRef]
- Pérez-Sanagustín, M.; Parra, D.; Verdugo, R.; García-Galleguillos, G.; Nussbaum, M. Using QR codes to increase user engagement in museum-like spaces. Comput. Hum. Behav. 2016, 60, 73–85. [Google Scholar] [CrossRef]
- Basso, A.; Funari, S. A quantitative approach to evaluate the relative efficiency of museums. J. Cult. Econ. 2004, 28, 195–216. [Google Scholar] [CrossRef]
- Baker, S.; Istvandity, L.; Nowak, R. The sound of music heritage: Curating popular music in music museums and exhibitions. Int. J. Herit. Stud. 2016, 22, 70–81. [Google Scholar] [CrossRef]
- Gómez-Zapata, J.D.; Espinal-Monsalve, N.E.; Herrero-Prieto, L.C. Economic valuation of museums as public club goods: Why build loyalty in cultural heritage consumption? J. Cult. Herit. 2018, 30, 190–198. [Google Scholar] [CrossRef]
- Craig, C.S. Creating cultural products: Cities, context and technology. City Cult. Soc. 2013, 4, 195–202. [Google Scholar] [CrossRef]
- Lee, Y.J. Exploration of local culture elements and design of cultural creativity products. J. Stat. Manag. Syst. 2010, 13, 823–834. [Google Scholar] [CrossRef]
- Shubik, M. Culture and commerce. J. Cult. Econ. 1999, 23, 13–30. [Google Scholar] [CrossRef]
- Geldes, C.; Felzensztein, C.; Turkina, E.; Durand, A. How does proximity affect interfirm marketing cooperation? A study of an agribusiness cluster. J. Bus. Res. 2015, 68, 263–272. [Google Scholar] [CrossRef]
- Antón, C.; Camarero, C.; Garrido, M.J. Exploring the experience value of museum visitors as a co-creation process. Curr. Issues Tour. 2018, 21, 1406–1425. [Google Scholar] [CrossRef]
- Tsai, P.H.; Chang, S.C. Comparing the apple ipad and non-apple camp tablet PCs: A multicriteria decision analysis. Technol. Econ. Dev. Econ. 2013, 19, S256–S284. [Google Scholar] [CrossRef]
- Lucchi, E. Review of preventive conservation in museum buildings. J. Cult. Herit. 2018, 29, 180–193. [Google Scholar] [CrossRef]
- Lu, M.T.; Hu, S.K.; Huang, L.H.; Tzeng, G.H. Evaluating the implementation of business-to-business m-commerce by SMEs based on a new hybrid MCDM model. Manag. Decis. 2015, 53, 290–317. [Google Scholar] [CrossRef]
- Opricovic, S. Multicriteria Optimization of Civil Engineering Systems. Ph.D. Thesis, Faculty of Civil Engineering, Belgrade, Serbia, 1998. (In Serbian). [Google Scholar]
- Opricovic, S.; Tzeng, G.H. Compromise solution by MCDM methods: A comparative analysis of VIKOR and TOPSIS. Eur. J. Oper. Res. 2004, 156, 445–455. [Google Scholar] [CrossRef]
- Shen, K.Y.; Tzeng, G.H. Combining DRSA decision-rules with FCA-based DANP evaluation for financial performance improvements. Technol. Econ. Dev. Econ. 2016, 22, 685–714. [Google Scholar] [CrossRef]
- Liou, J.J.H.; Tamošaitiené, J.; Zavadskas, E.K.; Tzeng, G.H. New hybrid COPRAS-G MADM Model for improving and selecting suppliers in green supply chain management. Int. J. Prod. Res. 2016, 54, 114–134. [Google Scholar] [CrossRef]
Figure 1.
The steps of the national museums hybrid evaluation model.

Figure 2.
The influential network relationship map (INRM) of each dimension and criteria for national museums. Source: From Tsai and Lin [19].
Figure 2.
The influential network relationship map (INRM) of each dimension and criteria for national museums. Source: From Tsai and Lin [19].

Table 1.
Total-influential evaluation dimensions matrix .
| Dimension | B | O | C | R | Di |
|---|---|---|---|---|---|
| B | 2.653 | 2.932 | 2.880 | 2.654 | 11.120 |
| O | 2.740 | 2.489 | 2.599 | 2.411 | 10.239 |
| C | 2.607 | 2.715 | 2.350 | 2.389 | 10.061 |
| R | 2.631 | 2.691 | 2.578 | 2.183 | 10.083 |
| Sj | 10.631 | 10.827 | 10.408 | 9.637 |
Note. Any value greater than threshold value (2.594) is presented in bold. The threshold value is setting up by computing the average of the elements in matrix.
Table 2.
The Normalized evaluation dimensions matrix .
| Dimensions | B | O | C | R | Sum |
|---|---|---|---|---|---|
| B | 0.239 | 0.264 | 0.259 | 0.239 | 1.000 |
| O | 0.268 | 0.243 | 0.254 | 0.235 | 1.000 |
| C | 0.259 | 0.270 | 0.234 | 0.237 | 1.000 |
| R | 0.261 | 0.267 | 0.256 | 0.216 | 1.000 |
Table 3.
Performance matrix with the best value and the worst value by modified VlšeKriterijumska Optimizacija I Kompromisno Resenje (VIKOR).
Table 3.
Performance matrix with the best value and the worst value by modified VlšeKriterijumska Optimizacija I Kompromisno Resenje (VIKOR).
| Criteria | Museum A | Museum B | Museum C | Museum D | Museum F | ||
|---|---|---|---|---|---|---|---|
| B1 | 8.400 | 8.000 | 7.333 | 8.067 | 7.867 | 8.400 | 7.333 |
| B2 | 7.000 | 7.000 | 6.867 | 7.400 | 7.267 | 7.400 | 6.867 |
| B3 | 7.600 | 7.533 | 7.000 | 7.467 | 7.467 | 7.600 | 7.000 |
| B4 | 7.400 | 6.200 | 6.600 | 6.133 | 7.400 | 7.400 | 6.133 |
| B5 | 6.600 | 7.333 | 6.467 | 7.267 | 6.600 | 7.333 | 6.467 |
| B6 | 5.267 | 5.933 | 5.933 | 5.933 | 5.600 | 5.933 | 5.267 |
| B7 | 6.400 | 7.000 | 6.867 | 7.933 | 7.467 | 7.933 | 6.400 |
| O1 | 8.533 | 7.600 | 6.267 | 7.600 | 7.400 | 8.533 | 6.267 |
| O2 | 7.333 | 7.200 | 6.733 | 7.267 | 7.067 | 7.333 | 6.733 |
| O3 | 5.733 | 5.867 | 6.133 | 5.600 | 6.133 | 6.133 | 5.600 |
| O4 | 7.867 | 7.867 | 7.733 | 7.933 | 7.867 | 7.933 | 7.733 |
| O5 | 7.333 | 7.333 | 7.733 | 7.933 | 7.600 | 7.933 | 7.333 |
| O6 | 7.600 | 6.200 | 6.400 | 6.733 | 7.267 | 7.600 | 6.200 |
| O7 | 7.200 | 6.467 | 6.867 | 7.000 | 6.533 | 7.200 | 6.467 |
| C1 | 7.467 | 7.400 | 6.800 | 7.200 | 7.133 | 6.800 | 7.467 |
| C2 | 8.133 | 7.533 | 6.400 | 6.800 | 7.267 | 6.400 | 8.133 |
| C3 | 6.600 | 5.267 | 5.933 | 5.200 | 6.200 | 5.200 | 6.600 |
| C4 | 7.000 | 6.533 | 6.467 | 7.533 | 6.800 | 6.467 | 7.533 |
| C5 | 6.533 | 6.867 | 6.400 | 7.267 | 6.733 | 6.400 | 7.267 |
| R1 | 5.467 | 5.267 | 6.333 | 5.933 | 6.267 | 5.267 | 6.333 |
| R2 | 8.133 | 7.800 | 7.867 | 7.867 | 7.867 | 7.800 | 8.133 |
| R3 | 8.467 | 7.867 | 6.667 | 6.733 | 7.733 | 6.667 | 8.467 |
| R4 | 8.467 | 6.533 | 5.667 | 5.667 | 7.333 | 5.667 | 8.467 |
| R5 | 9.067 | 8.133 | 7.600 | 7.667 | 8.533 | 7.600 | 9.067 |
Table 4.
The values , and final scores () by modified VIKOR.
| National Museums Evaluation | |||
|---|---|---|---|
| Museum A | 0.500 (5) | 0.217 (3) | 0.717 (3) |
| Museum B | 0.242 (2) | 0.112 (2) | 0.354 (2) |
| Museum C | 0.376 (4) | 0.500 (5) | 0.876 (5) |
| Museum D | 0.000 (1) | 0.000 (1) | 0.000 (1) |
| Museum E | 0.330 (3) | 0.417 (4) | 0.747 (4) |
Note: () denotes ranking order.
© 2018 by the authors. Licensee MDPI, Basel, Switzerland. This article is an open access article distributed under the terms and conditions of the Creative Commons Attribution (CC BY) license (http://creativecommons.org/licenses/by/4.0/).
Share and Cite
MDPI and ACS Style
Tsai, P.-H.; Lin, C.-T. How Should National Museums Create Competitive Advantage Following Changes in the Global Economic Environment? Sustainability 2018, 10, 3749. https://0-doi-org.brum.beds.ac.uk/10.3390/su10103749
AMA Style
Tsai P-H, Lin C-T. How Should National Museums Create Competitive Advantage Following Changes in the Global Economic Environment? Sustainability. 2018; 10(10):3749. https://0-doi-org.brum.beds.ac.uk/10.3390/su10103749
Chicago/Turabian StyleTsai, Pei-Hsuan, and Chin-Tsai Lin. 2018. "How Should National Museums Create Competitive Advantage Following Changes in the Global Economic Environment?" Sustainability 10, no. 10: 3749. https://0-doi-org.brum.beds.ac.uk/10.3390/su10103749
Note that from the first issue of 2016, this journal uses article numbers instead of page numbers. See further details here.