Article

A Predictive Environmental Assessment Method for Construction Operations: Application to a Northeast China Case Study

1
Department of Construction Management, Harbin Institute of Technology, Harbin 150001, China
2
Department of Civil, Environmental, and Natural Resources Engineering, Luleå University of Technology, 97187 Luleå, Sweden
3
School of Civil Engineering and Transportation, South China University of Technology, Guangzhou 510641, China
4
Department of Construction Management, Key Lab of Structures Dynamic Behavior and Control of the Ministry of Education, Key Lab of Smart Prevention and Mitigation of Civil Engineering Disasters of the Ministry of Industry and Information Technology, Harbin Institute of Technology, Harbin 150090, China
*
Author to whom correspondence should be addressed.
Sustainability 2018, 10(11), 3868; https://0-doi-org.brum.beds.ac.uk/10.3390/su10113868
Submission received: 12 September 2018 / Revised: 15 October 2018 / Accepted: 19 October 2018 / Published: 24 October 2018
(This article belongs to the Special Issue Sustainable Construction and Building Materials)

Abstract

:
Construction accounts for a considerable number of environmental impacts, especially in countries with rapid urbanization. A predictive environmental assessment method enables a comparison of alternatives in construction operations to mitigate these environmental impacts. Process-based life cycle assessment (pLCA), which is the most widely applied environmental assessment method, requires lots of detailed process information to evaluate. However, a construction project usually operates in uncertain and dynamic project environments, and capturing such process information represents a critical challenge for pLCA. Discrete event simulation (DES) provides an opportunity to include uncertainty and capture the dynamic environments of construction operations. This study proposes a predictive assessment method that integrates DES and pLCA (DES-pLCA) to evaluate the environmental impact of on-site construction operations and supply chains. The DES feeds pLCA with process information that considers the uncertain and dynamic environments of construction, while pLCA guides the comprehensive procedure of environmental assessment. A DES-pLCA prototype was developed and implemented in a case study of an 18-storey building in Northeast China. The results showed that the biggest impact variations on the global warming potential (GWP), acidification potential (AP), eutrophication (EP), photochemical ozone creation potential (POCP), abiotic depletion potential (ADP), and human toxicity potential (HTP) were 5.1%, 4.1%, 4.1%, 4.7%, 0.3%, and 5.9%, respectively, due to uncertain and dynamic factors. Based on the proposed method, an average impact reduction can be achieved for these six indictors of 2.5%, 21.7%, 8.2%, 4.8%, 32.5%, and 0.9%, respectively. The method also revealed that the material wastage rate of formwork installation was the most crucial managing factor that influences global warming performance. The method can support contractors in the development and management of environmentally friendly construction operations that consider the effects of uncertainty and dynamics.

1. Introduction

Construction causes intensive environmental pollution in short periods and at concentrated locations [1]. The environmental impact can be severe at aggregated levels [2], especially in countries with rapid urbanization [3]. The environmental impacts that construction causes have motivated project clients, such as the Swedish Transport Administration (STA), to set the goal of an emissions reduction in infrastructure and building projects [4]. These demands will turn into criteria for contractor selection and motivate project contractors to perform environmentally friendly construction.
Construction operations are performed in operational environments that change quickly (i.e., dynamic environments) [5], such as altered on-site conditions, increasing equipment downtime, and growing labour experience [6]. In addition, external factors, such as rush-hour or idle traffic conditions, influence the transportation of material supplies to the site [7]. Construction operations are also affected by high levels of uncertainty. Uncertainties can lead to process duration overruns [8], task rework, and emissions fluctuations [9]. All of these uncertain and dynamic factors influence construction productivity, energy use, and emissions, and thus need to be included in the assessment of the environmental impact.
Process-based life cycle assessment (pLCA) is a commonly used method to assess the environmental impact of construction [10]. However, Langston and Langston [11] claimed that pLCA has some limitations in supporting environmental assessment in a construction context. Construction uncertainty will affect the reliability of LCA methods [12]. A process-based LCA method that relies on static inventory data cannot represent the influence of process uncertainty [13]. Additionally, dynamic construction environments require a pLCA to analyse the related effects on environmental performance momentarily and precisely. For these reasons, we need to complement pLCA with the ability to capture uncertain and dynamic environments in the assessment of the environmental performance of construction operations. Discrete event simulation (DES) is a promising technique with the ability to capture the variability of events [14], and dynamic environments and uncertainty factors can be simulated. Hence, DES could provide process data for pLCA that is influenced by the uncertainty and dynamics of the environment in order to produce a construction-case-specific environmental assessment. Nevertheless, a method that integrates DES and pLCA to conduct a comprehensive environmental assessment of a construction operation and systematically considers uncertainty and dynamics is still lacking.
This study aims to fill that gap by proposing an innovative method to integrate DES and pLCA to make environmental performance assessments of construction operations in uncertain and dynamic environments. The proposed method provides a predictive tool for contractors to evaluate and compare the environmental performance of supply chains and on-site construction in the planning of operations. The method can also reveal crucial managing factors that influence the environmental performance. A prototype is developed and implemented in a case study of an 18-storey reinforced concrete building to test the applicability of the integrated DES-pLCA method.
The remainder of the paper is structured as follows. Section 2 contains a literature review that discusses construction uncertainty and dynamics as well as previous LCA and DES research. In Section 3, the design of the integrated DES and pLCA method is described. In Section 4, the development and application of the prototype in the case study building is presented. The discussion of the contribution, possible applications, and future work on the proposed method is presented in Section 5 and Section 6.

2. Literature Review

2.1. Uncertainty and Dynamics in Construction

Construction projects are performed under uncertain and dynamic conditions [8,15,16]. Love et al. [17] divided these conditions into intended and unintended dynamics. Intended dynamics are initiated from planned activities that are designed to support the progress of the construction works, while unintended dynamics come from internal and external uncertainties. Thus, intended dynamics are defined as dynamic factors in this study, which are variables with known relations with changing conditions. Unintended dynamics are defined as uncertain factors in this study, which are variables that have fluctuations within reasonable ranges.
Factors of uncertainty can originate from the task, the environment—such as unknown site conditions—or in resource and material supply [15,18,19]. In a high-speed rail line project, Moret and Einstein [8] found that uncertain factors, such as variability in the construction process, can cause large increases in project cost and duration. Therefore, it is a challenge for contractors to make a realistic project estimation without quantifying the effects of uncertainty. A method based on the Monte Carlo simulation and construction model was proposed [8], and the results showed that the project cost and duration overruns could reach 30–35% due to uncertain factors. In underground infrastructure projects, the construction process is inherently affected by various sources of uncertainty, such as not-fully-known geological conditions. To take account of uncertain factors in construction planning, a probabilistic alignment optimization method based on a construction simulation and a simulated annealing algorithm was proposed by Costa et al. [20]. In the implementation of an underground tunnel project, the results showed that the average and variation in project cost could be reduced by using the optimised construction planning provided by the method. Uncertainty within supply chains also affects on-site operation [21]. Using a two-phase scheduling optimization method based on a constraint programming and optimization model, in an example project, Liu and Lu [22] found that the uncertainty in off-site material logistics led to 25% and 23% increases in project duration and budget, respectively. Therefore, the previous studies show the significant effects of uncertain factors on a construction operation.
Construction operations are also dynamic and evolve over time [23]. Examples of dynamic factors that influence construction progress include a change in the number of available crew, variations in site layout, and off-site traffic conditions, depending on the time of day and day of the week. In a prefabricated building construction case, Alvanchi et al. [24] found that labour productivity is a crucial on-site dynamic factor that will vary over time, time of day, work length, or in prolonged conditions. A working-hour arrangement should consider this dynamic factor in order to ensure high productivity during construction. An integrated system dynamics (SD) and DES method for estimating the labour productivity of different working-hour arrangements was proposed [24]. The case study showed that productivity could be improved by 6% when adjusting the original work schedule. Using a similar integrated SD and DES method, Alzraiee et al. [25] proposed an approach for realistically estimating the duration, productivity, and cost by considering the effects of dynamic environments in relation to schedule pressure, work fatigue, overtime, and rework. It was verified in an industrial building expansion case that a 32% longer duration would be caused by considering dynamic factors. The actual duration, which contained a 40% delay, also validated the result. For a high-rise building construction case in Singapore, Park [26] found that the entire construction’s progress was influenced by variations in available resources, dynamic predecessor completeness, and labour productivity. However, it is a challenge for contractors to determine the optimal resource coverage in a construction system without fully understanding the influence of these dynamic factors. A model-based dynamic method based on SD was applied in a case study to make a trade-off between acceptable resource coverage and construction progress.
Previous studies have shown the significant influence of uncertain and dynamic factors on construction operations. In addition, Zhang [9] found that both the uncertain and dynamic factors caused fluctuating equipment emissions during construction operations. The construction uncertainty factors follow a probability distribution during construction [27], while the dynamic factors change with off-/on-site conditions throughout the construction process [24]. They should be taken into account in order to develop a realistic environmental assessment method for construction operations.

2.2. LCA and DES in Construction Applications

LCA has been widely adopted to assess the environmental impact that arises from building-related activities in full or different phases of the life cycle. A full LCA method analyses a product from materials extraction to final end-of-life (cradle-to-grave). On the other hand, a partial LCA analyses certain parts of the life cycle, such as from materials extraction to manufacturing/operations (cradle-to-gate), or one specific stage (gate-to-gate). A partial LCA method focuses especially on a certain stage and has advantages for process assessment and optimization [28]. Examples of such applications are the environmentally friendly selection of materials in the design phase [29], environmental impact reduction in the construction phase [30], and quantitative evaluation of the environmental performance of heating and ventilation systems during the building operation [31]. Therefore, an LCA with a gate-to-gate boundary that focuses on process comparison should be a suitable assessment method for construction operations.
Many constructive suggestions and pathways for improving the environmental performances of construction operations have been revealed by previous research using LCA methods [30,32,33]. Ortiz et al. [34] classified this LCA research into two different orientations. Building material and component research focuses on the environmental performance of construction materials and components; thus, it provides sustainable suggestions on materials and component production and selection. On the other hand, whole building life cycle research focuses on assessing the full life cycle of a building, thereby providing environmentally friendly suggestions for a building from building design to final demolition. The study by Gámez-García et al. [35] can be regarded as belonging to the building material and component research orientation, as it assesses and compares 20 external wall systems in terms of environmental performance. The results showed that external walls with large-format pieces and a controlled increase in the thickness of the thermal insulation is the environmentally optimal selection. Similarly, De Lassio et al. [36] performed a study in which they assessed the environmental impacts of building materials in a residential building, finding that ceramic materials account for a high percentage of environmental impacts in a building. The research of Reza et al. [37] belongs to the whole building life cycle research orientation, and proposed emergy as a unified and quantitative environmental basis for the full life cycle of buildings. The results showed that the environmental impact of multi-unit residential buildings was 2 to 3 times greater than that of single-family houses.
In all previous LCA studies, process-based and input/output-based LCA have been the most frequently used inventory methods for LCA assessment [10]. Process-based LCA is the most widely used assessment method [38], and is considered the most accurate within the defined system boundaries [39]. However, process-based LCA requires significant efforts to identify and analyse every impact source in the studied process [10]. Input/output-based LCA, by contrast, is easier to apply, since the environmental data are linked to monetary input-output tables on an industry sector level that have been produced by statistical agencies. The drawbacks include the assumptions of homogeneity, proportionality, errors, and uncertainty in the economic data, and the aggregation and grouping of sectors, which makes an assessment’s results less reliable for specific cases [10,40]. The process-based LCA, which has advantages with respect to specific process assessment, could be improved when efforts towards process analysis are reduced.
Discrete event simulation was developed in the late 1970s, and has become a common method for the evaluation and prediction of system performance [14]. Ahmed and Nassar [41] used DES to predict occupants’ movements in a building and to optimise the building’s design. Wang and Abourizk [42] utilised DES to assess the duration of different material delivery strategies in industrial construction projects. Chunna et al. [43] used DES to evaluate the cost and environmental performance of dam construction, and Nassar and Al-Kaisy [44] evaluated sign occlusion in architectural spaces. Aziz et al. [45] combined a DES and a value stream mapping method to explore different road construction scenarios in order to achieve high construction productivity and minimum road closure times.
DES can capture the variability of events in complex systems, thereby increasing the reliability of the evaluation [46]. For construction and environmental applications, several studies, including Zhang [9,47], Li, Zhu, and Zhang [32], González and Echaveguren [48], and Golzarpoor et al. [49], have demonstrated that DES produces a more reliable, accurate, and case-specific estimation of construction-related pollutant emissions and energy consumption. The ability to analyse construction activities at a micro level makes DES suitable for modelling the uncertainties and the dynamics of construction operations in order to overcome the limitations of using industry-average input-output data [9,14]. The advantages of DES and the challenges of using process-based LCA for construction applications make the combination of DES and pLCA attractive to investigate. This study, thus, investigates whether an integrated DES-pLCA method is a suitable environmental assessment method in a construction context.

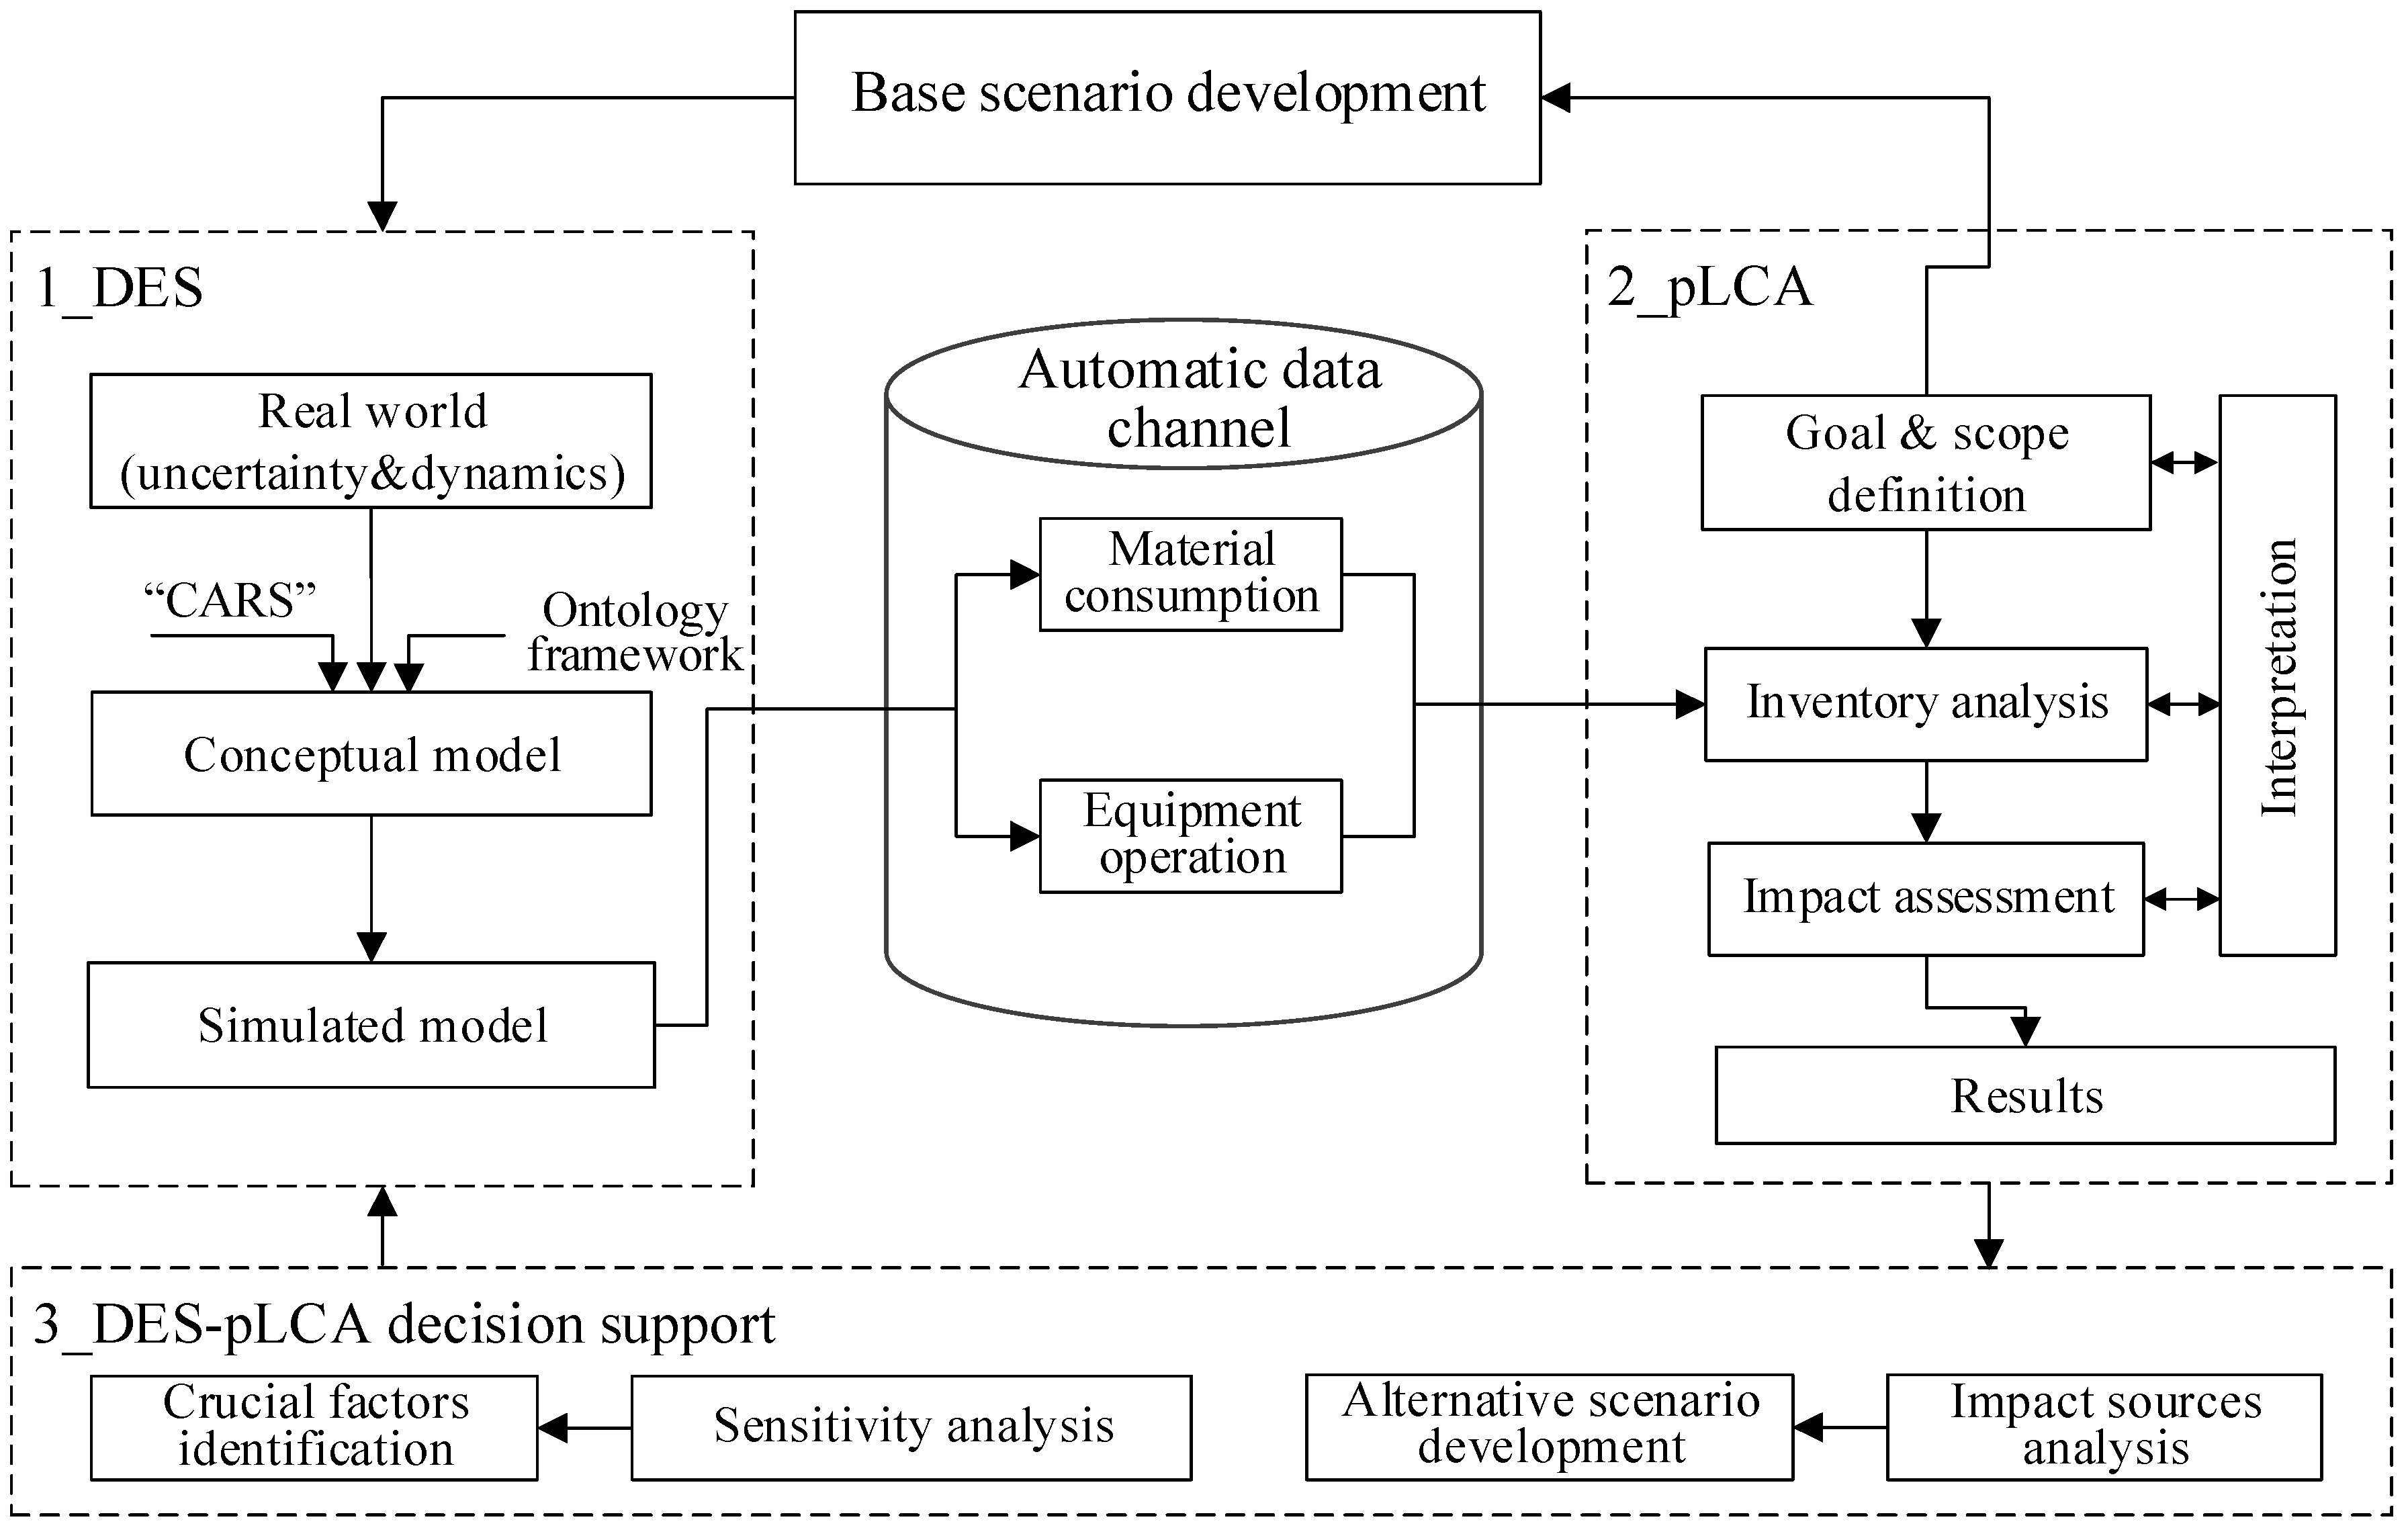
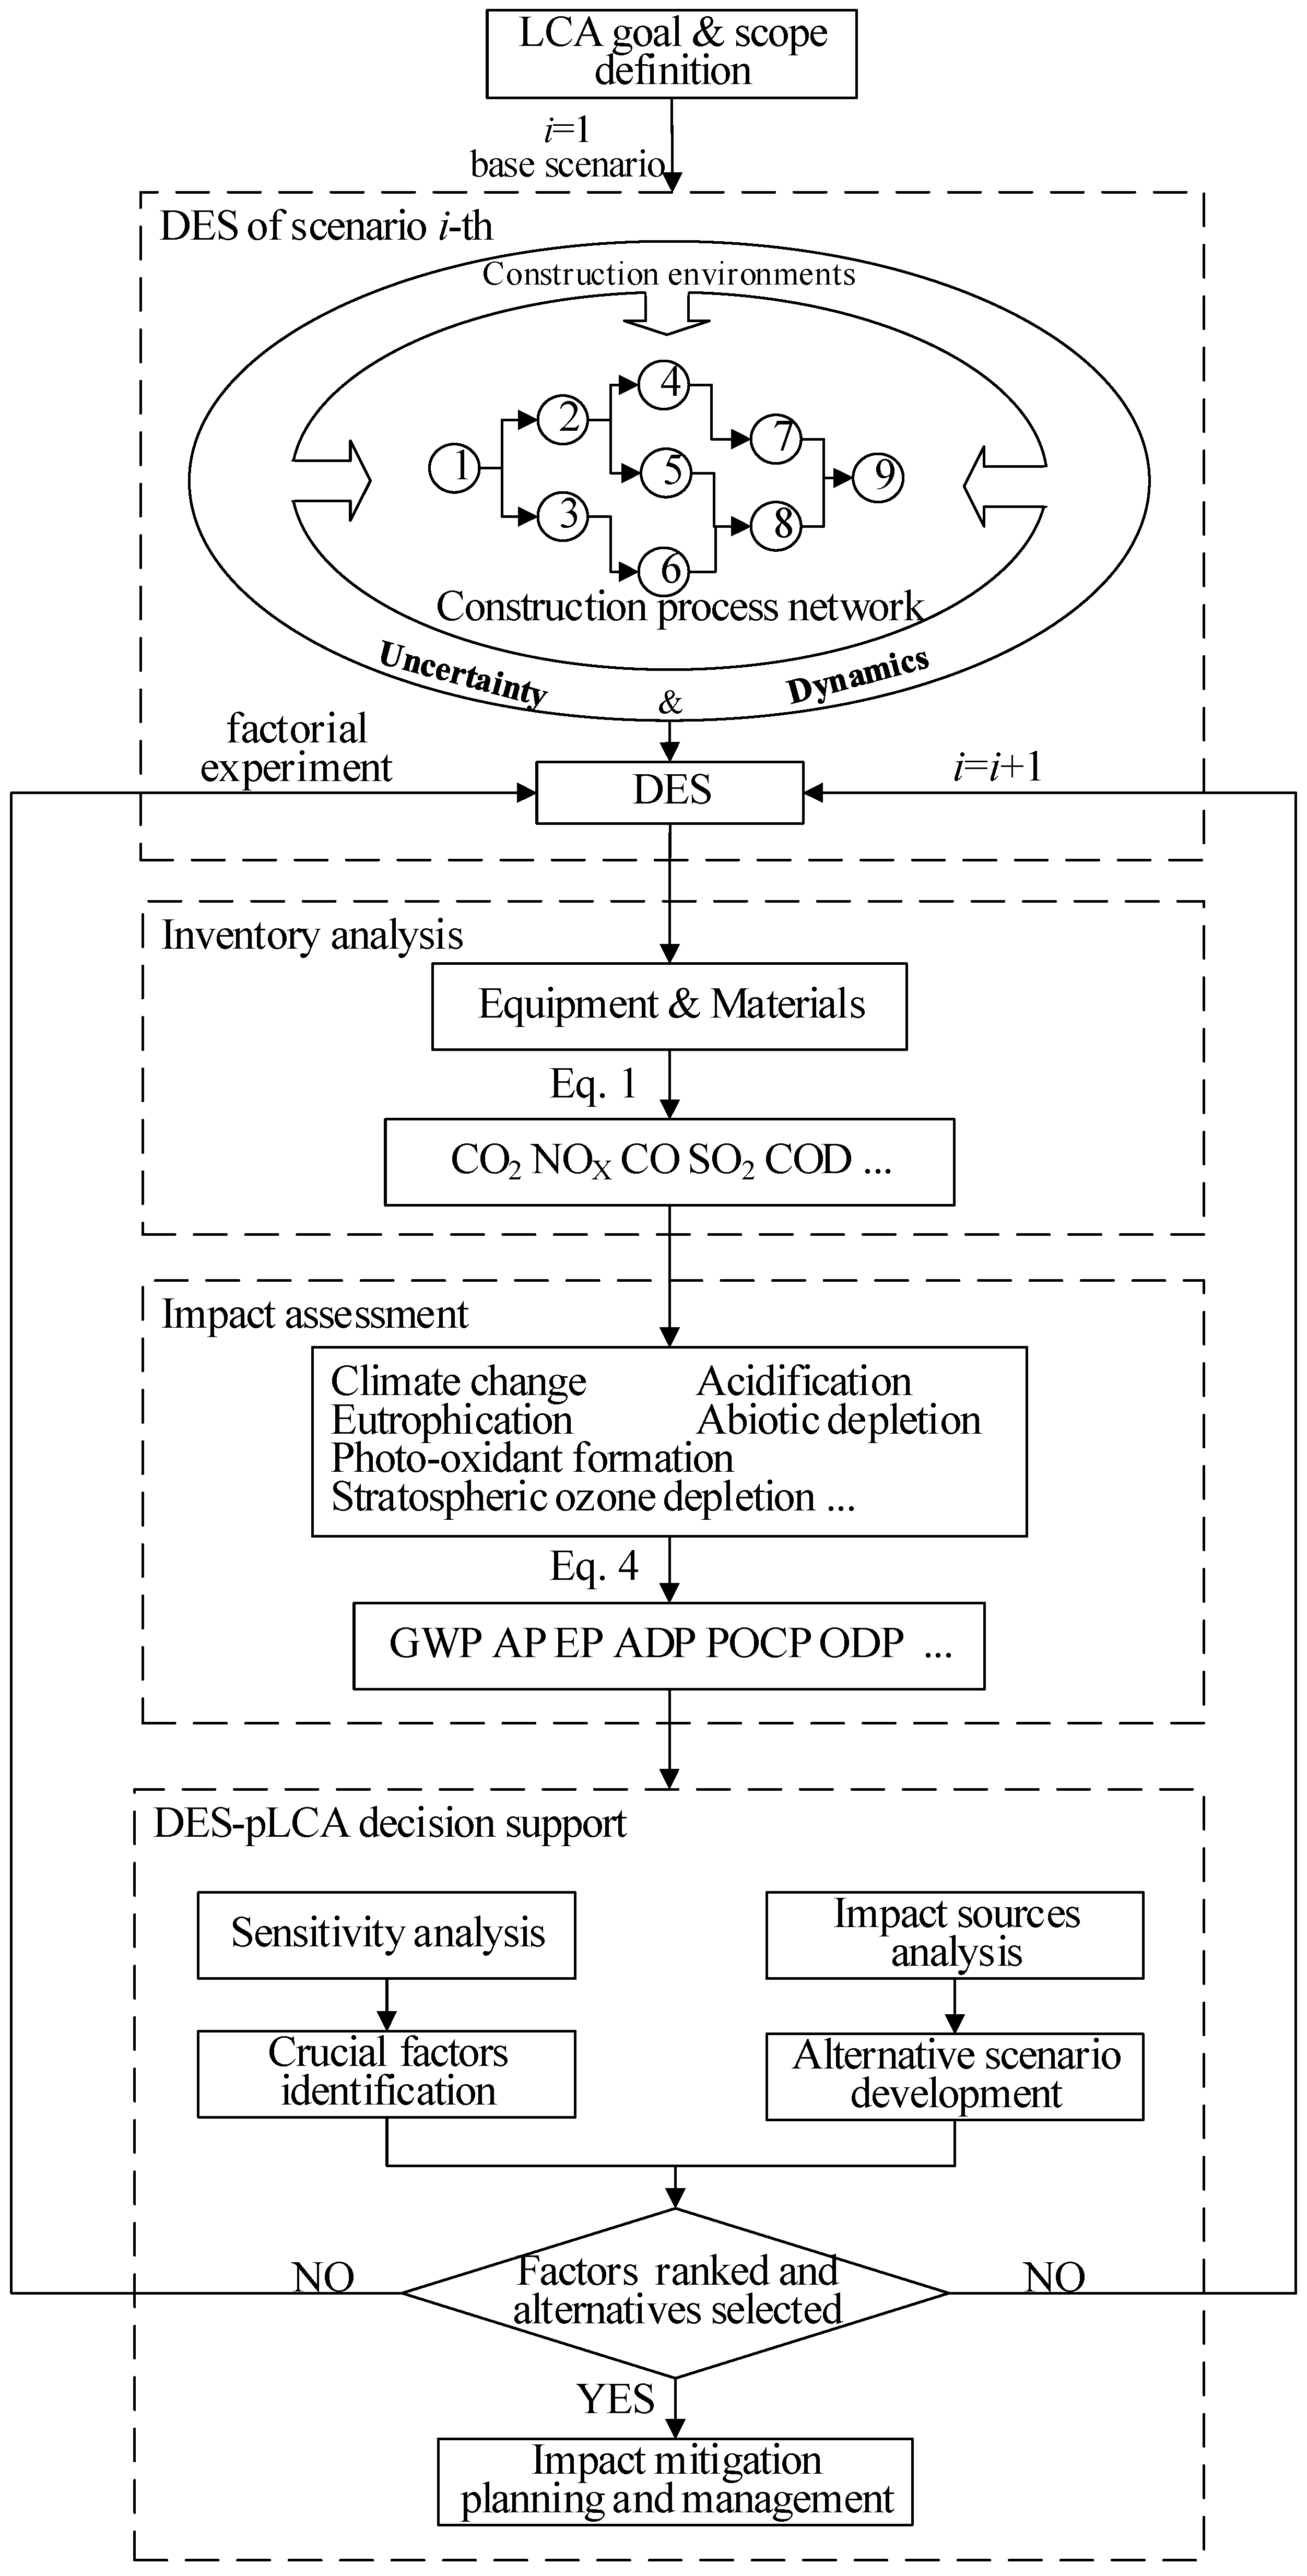
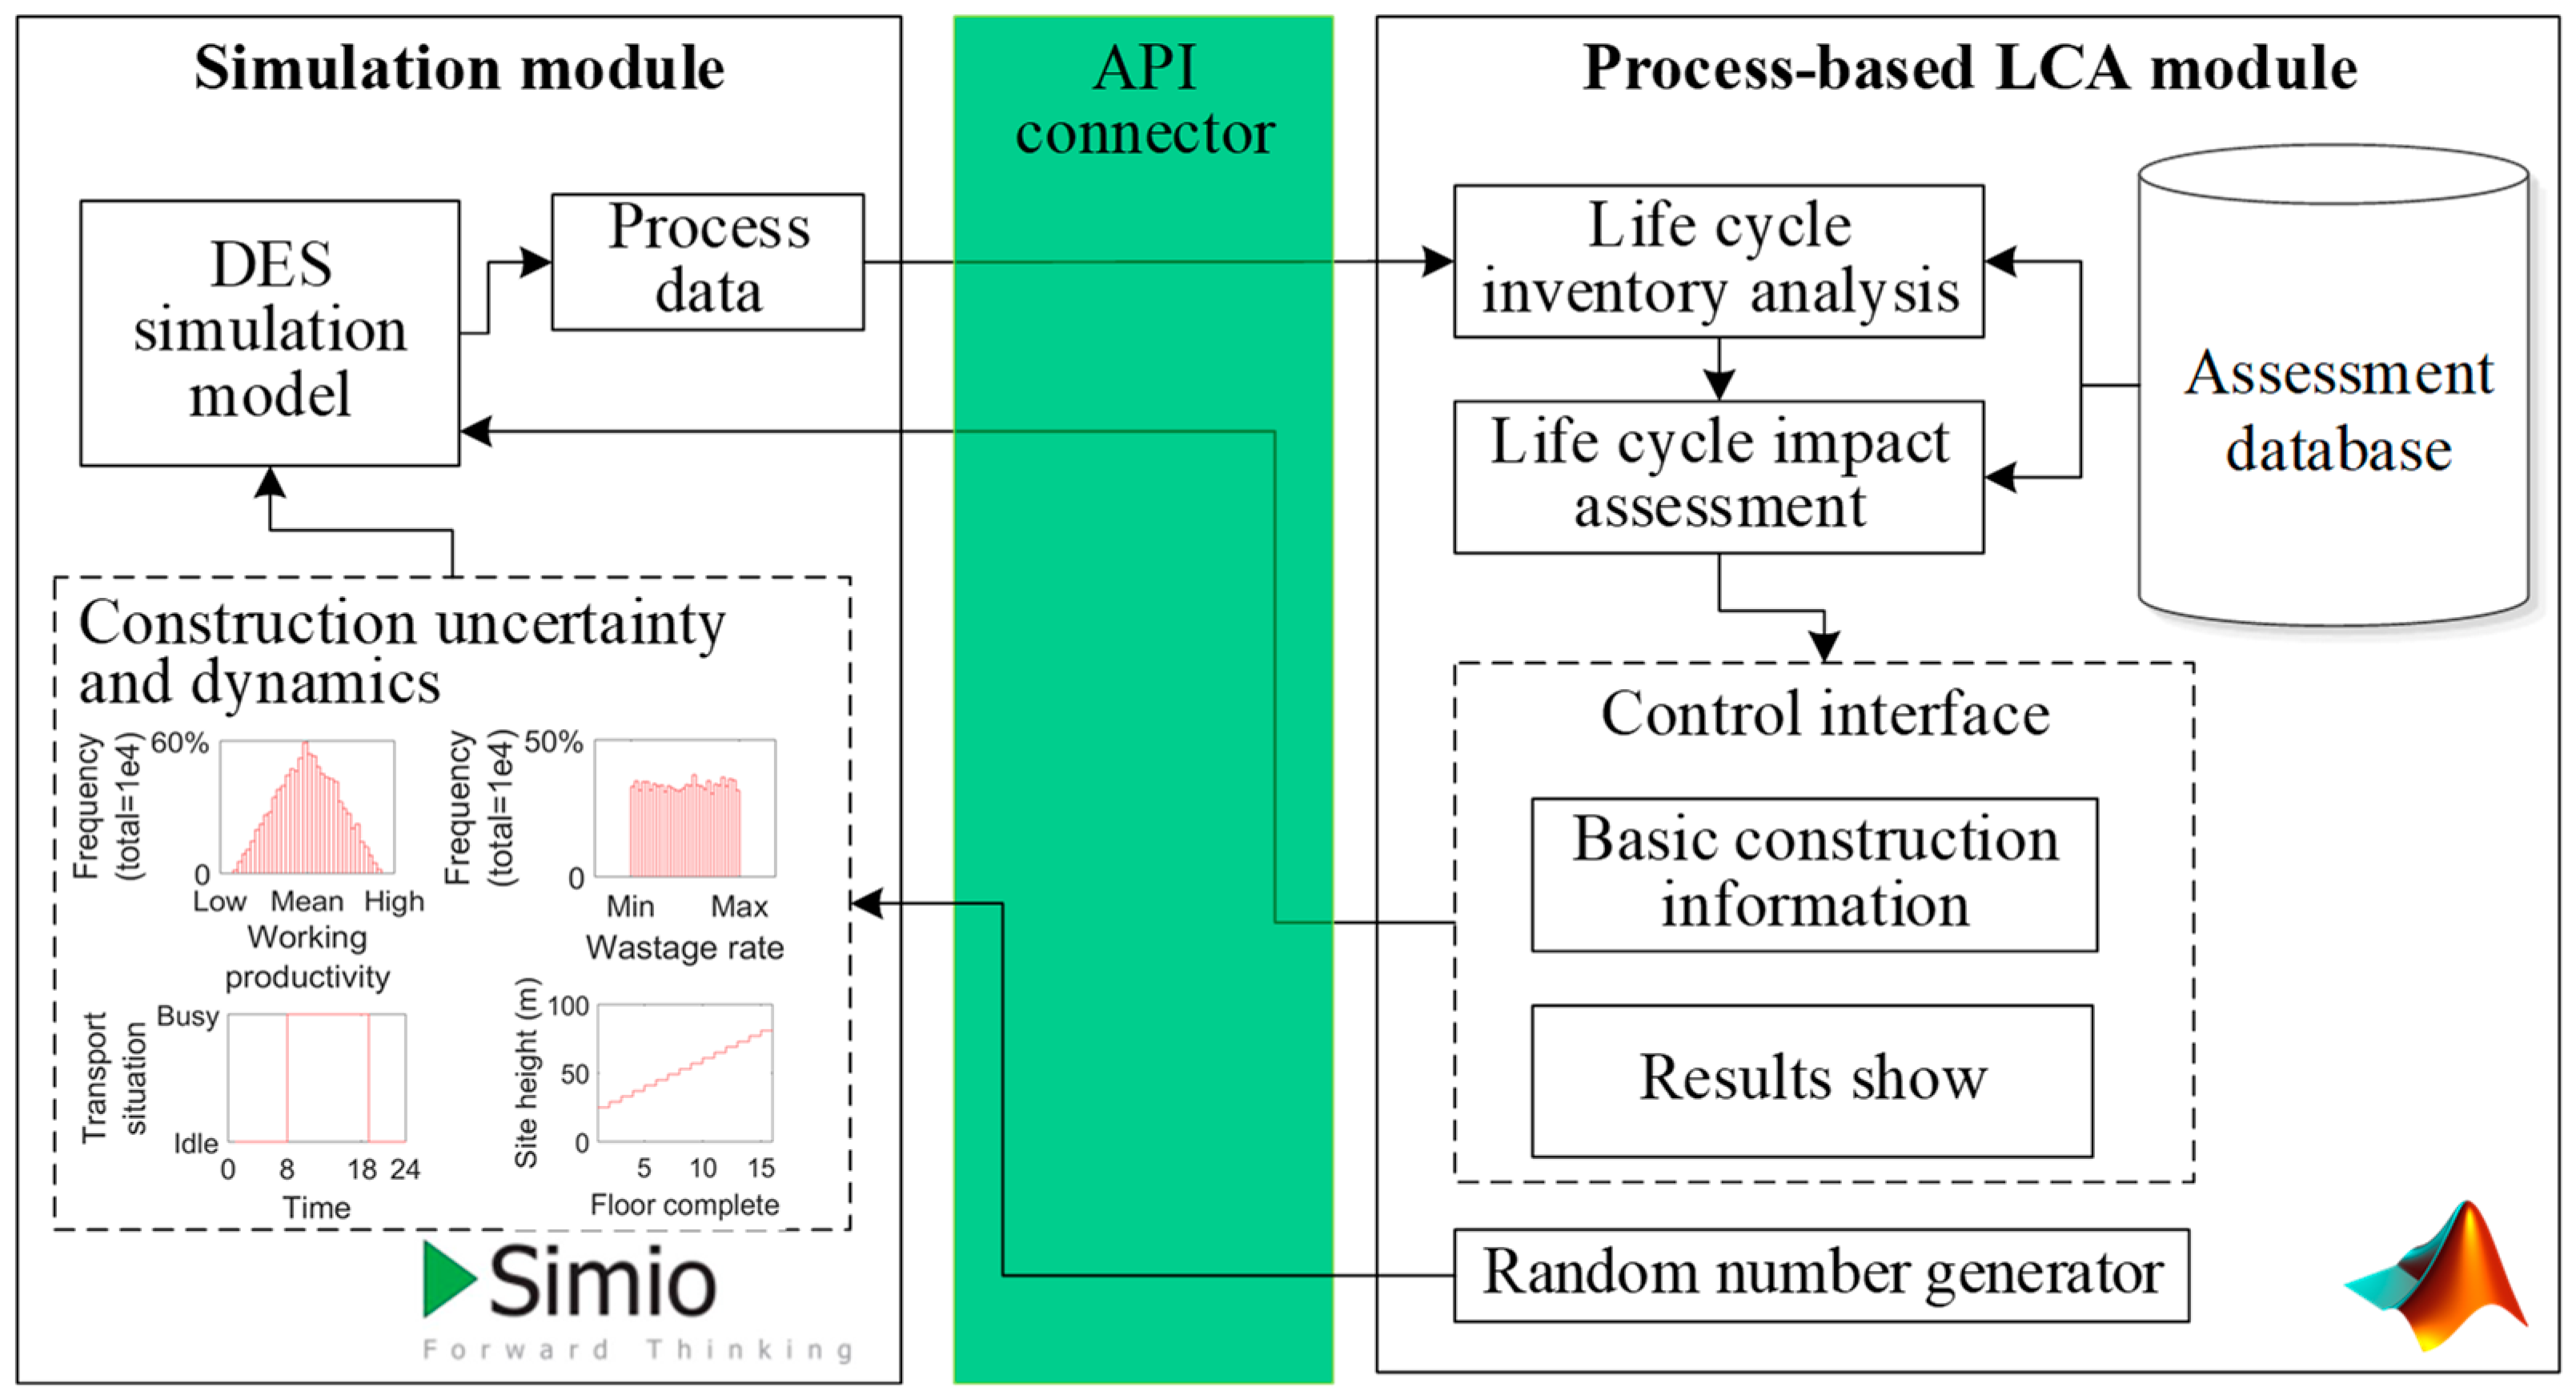
3. The DES-pLCA Framework

The overall DES-pLCA framework follows the procedure shown in Figure 1. Firstly, the goal and scope of the environmental impact assessment should be defined. Based on the scope assessment, process information, including supply chains, on-site construction, dynamic conditions, and uncertainties in the construction operation, can be surveyed. Then, the DES model is produced based on the scope assessment and the surveyed information, which is able to simulate the operation from construction supply to on-site construction. The connection between DES and pLCA is reached using an automatic data channel that can automatically extract and link the materials and equipment data from the simulation to pLCA. The procedure for inventory analysis and life cycle impact assessment using a connected simulation is shown in Algorithm 1. For each time period of inventory analysis, the simulation will be repetitively run to return impact sources data with distributions. Then, an impact assessment is performed to provide both average impacts and their variations.
After establishing connections, the impact sources are analysed to identify the significant environmental contributors, which help to develop alternative scenarios on the significant contributors. In addition, crucial factors can be identified from the sensitivity analysis by running DES-pLCA factorial experiments. The proposed DES-pLCA integrated method utilises DES to provide pLCA with case-specific data for the environmental impact assessment, which considers uncertain and dynamic construction environments. The results from pLCA provide indications to be simulated for further mitigation and management of environmental impacts.
Algorithm 1. Pseudocode for DES-pLCA automatic calculation procedure.
  procedure DES-pLCA
    while assessed scenario m < total feasible scenario M, do
    LCI
      while simulation replication n < minimum times N, do
        run DES-based simulation
        n<--n+1
      return impact sources and quantities Qn of each replication with data channel
      end
    LCIA
      pollutant emissions: En<--Qn×e (e is emission factor, automatically identifies related Q)
      environmental indicator value: EIn<-- En×c (c is characterization factor)
      m<--m+1
      return environmental indicator average value EIm<--∑EIn / m and variation
      end

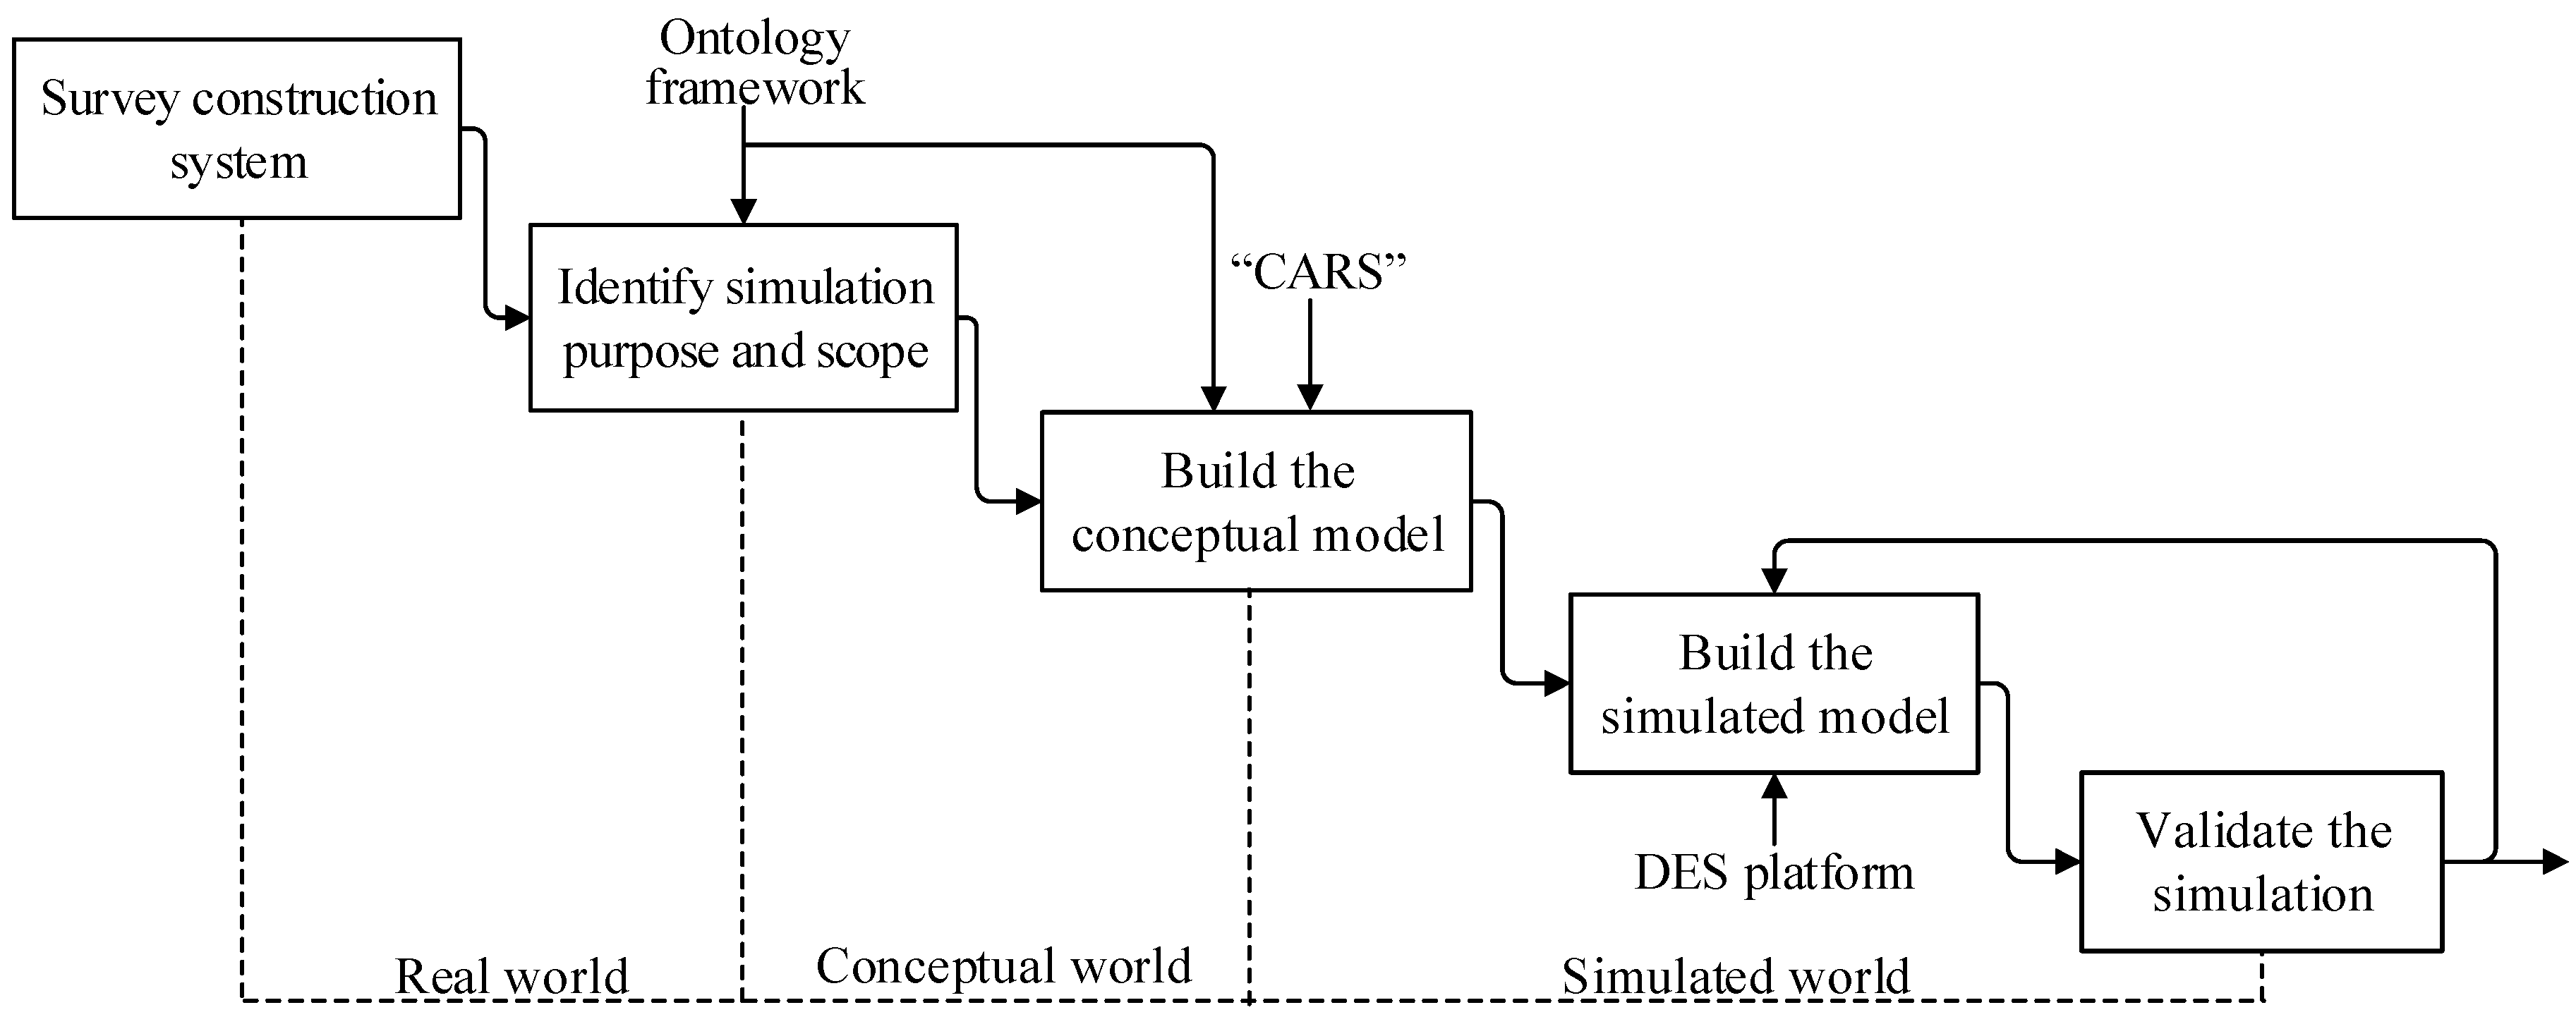
3.1. DES Model of Construction

DES is designed to work interactively with pLCA to take advantage of the simulation technique. The off-site supply chains and on-site construction operations will be influenced by dynamic environments [6], such as an increasing working height at the construction site and the traffic conditions of a day. On the other hand, uncertainty also affects the construction operation according to Construction Engineering Quotas (CEQs). Uncertainty, for example, in working productivity and the materials wastage rate, varies according to associated probability distributions. The dynamics and uncertainty in the construction operation will influence the environmental performances [9]. As DES can include the dynamics of on-site operations and process uncertainty [48], it is utilised to provide more realistic inventory data for the construction operation’s environmental assessment.
A specific procedure was established, as shown in Figure 2, in the development of the DES model for the pLCA assessment. The concepts used in the development originate from the real world, the conceptual world, and the simulated world [50]. An ontology-driven method was used to establish the conceptual model that reflects the relationship between a process, a product, and a resource in the real and the conceptual world. After that, the DES technique was employed to build the simulated model based on the established conceptual model.

3.1.1. Identify the Simulation’s Purpose and Scope

The purpose is to simulate the construction operation correctly while providing usable and realistic process data for the environmental impact assessment. A normal construction operation is to transport construction materials from suppliers to the construction site, and assemble building components onsite by in-situ cast or prefabrication. The perspective of the contractor defines the simulation scope. In the most popular project delivery method, i.e., design/bid/build, the contractor can only influence decisions regarding the selection of the offsite supplier and the onsite construction scenario. Therefore, the scope of the simulation in this study includes related processes from materials supply chains to onsite construction operations.

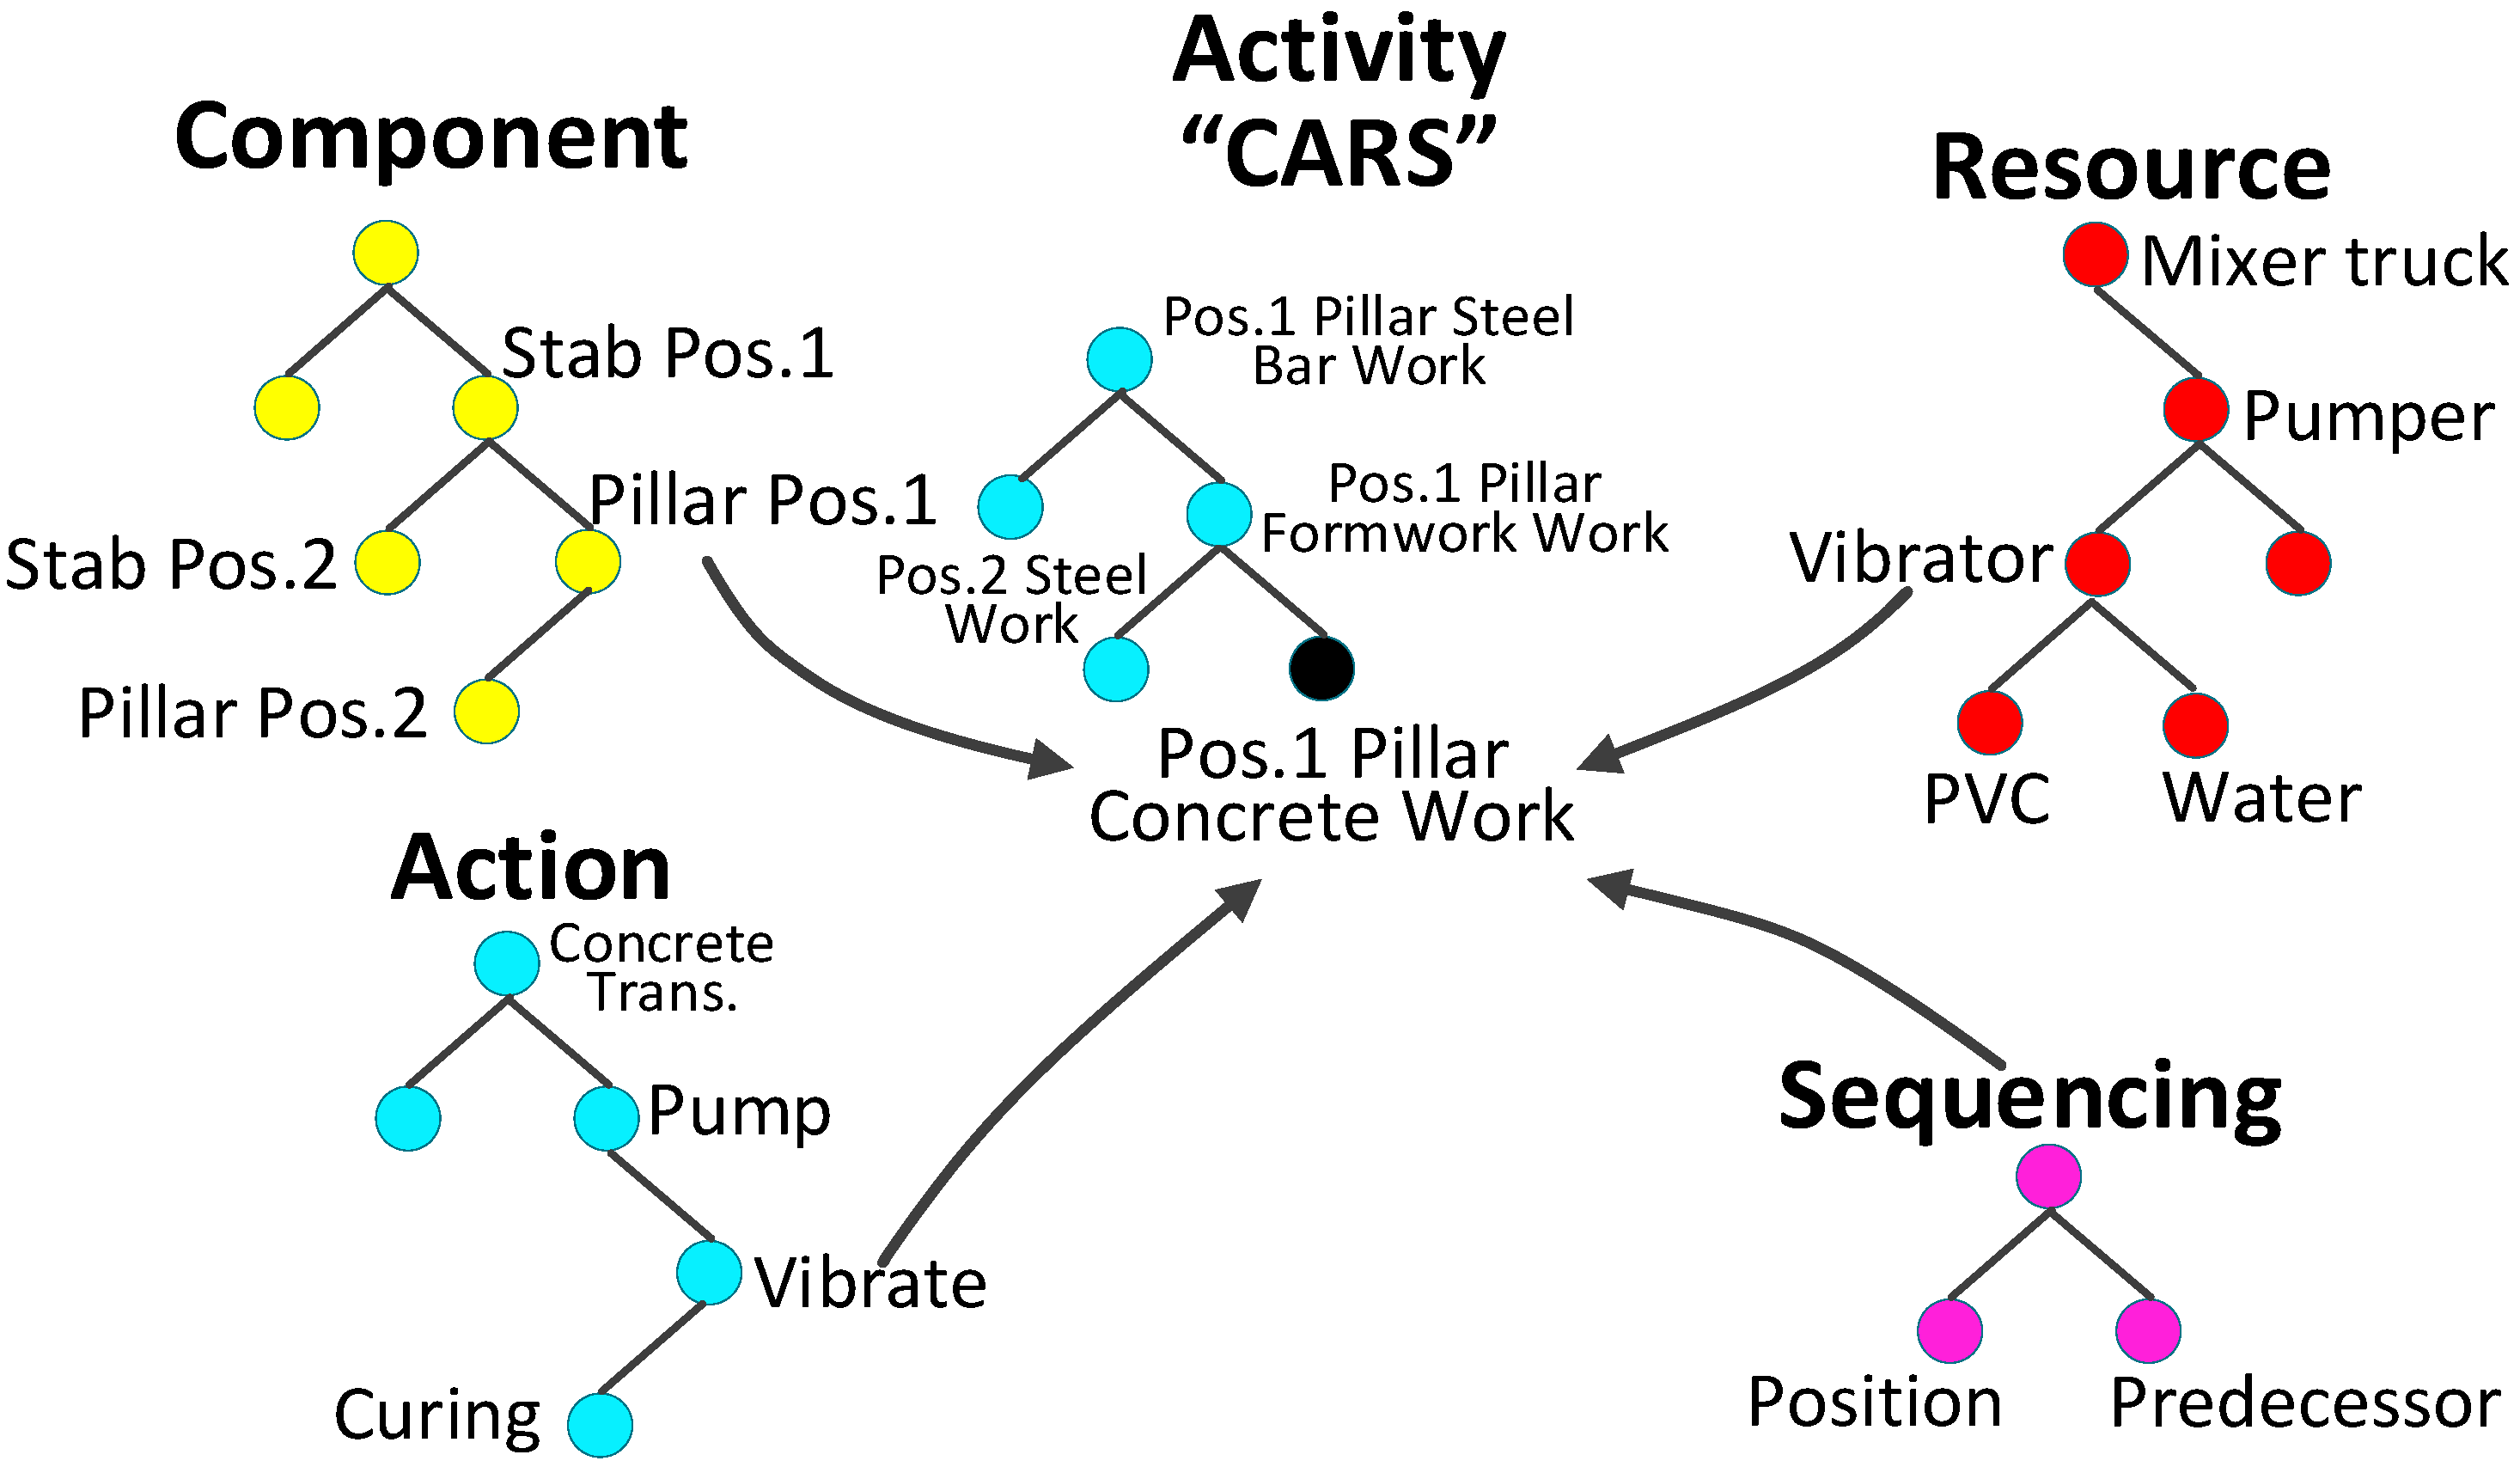
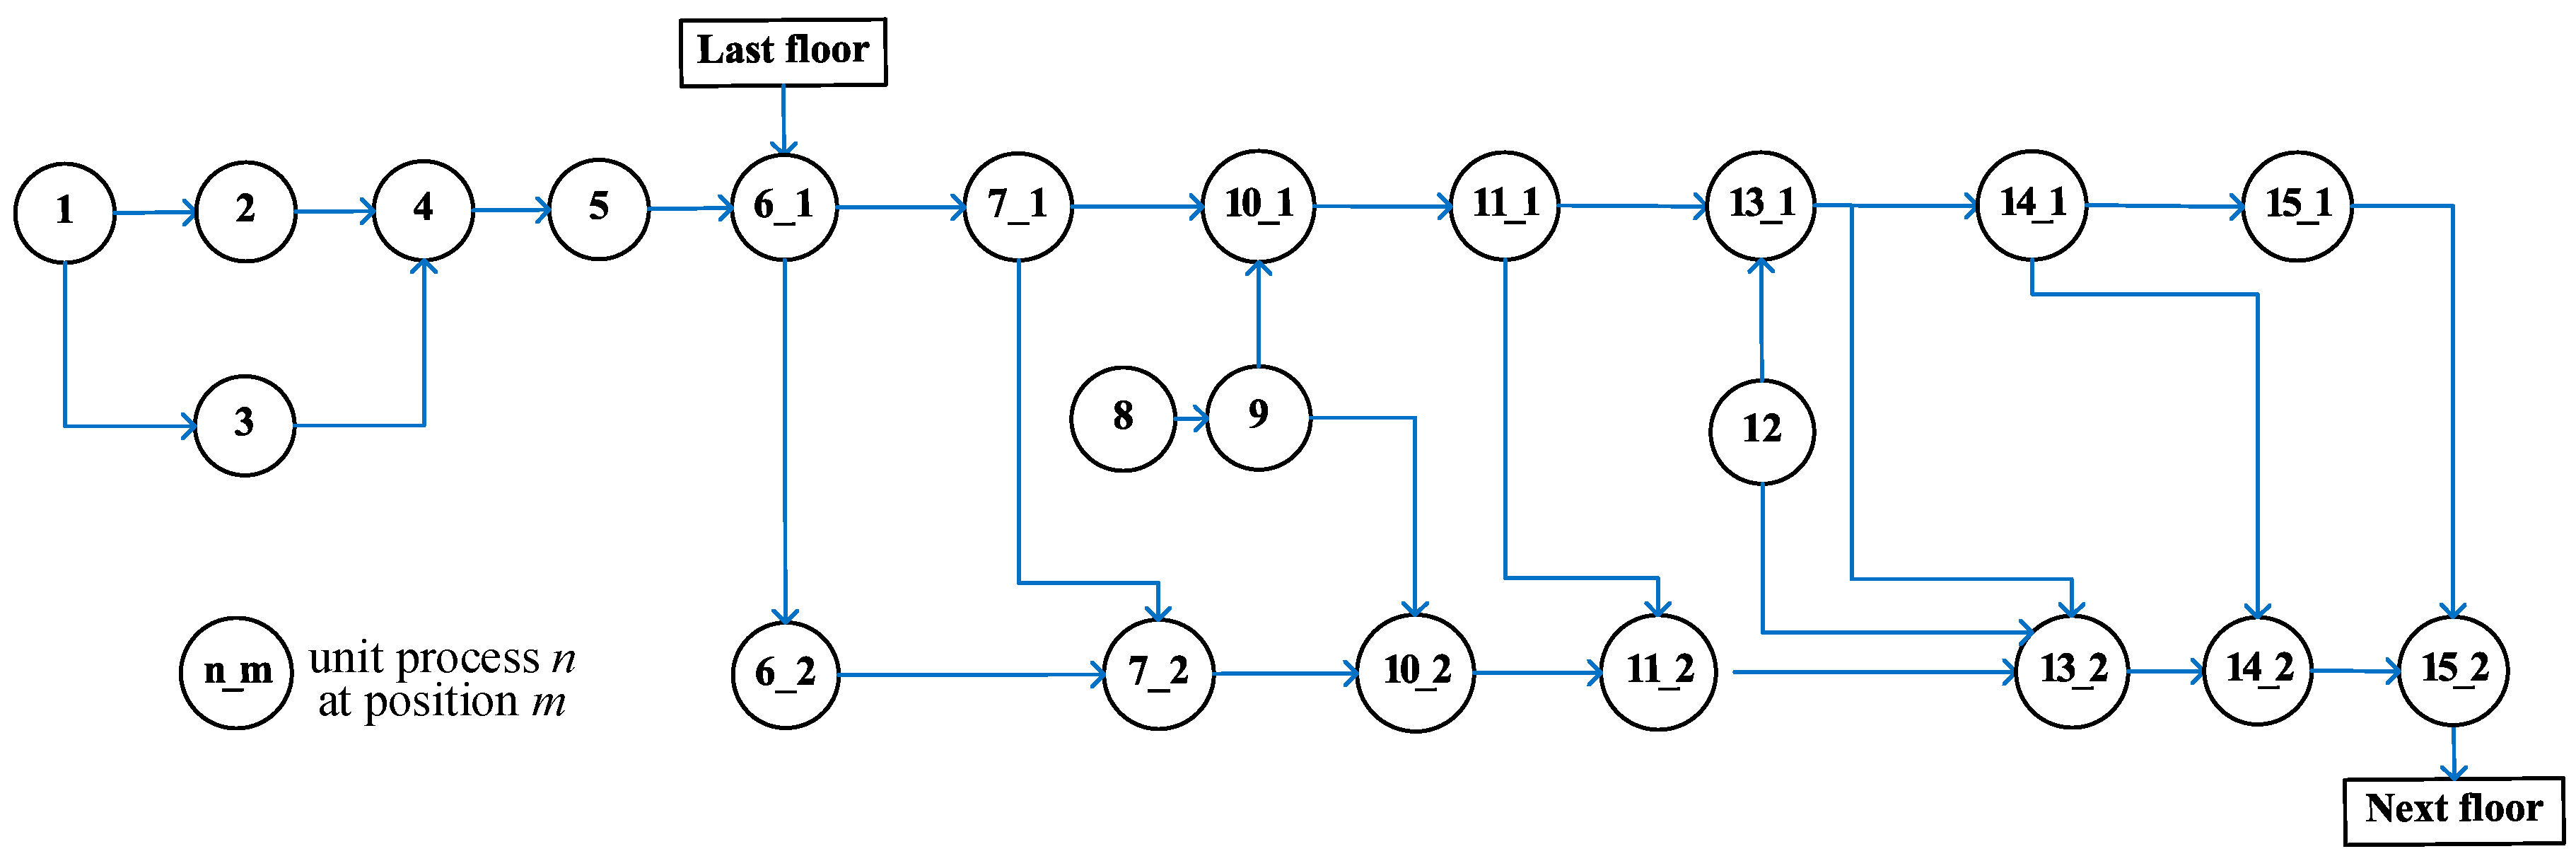
3.1.2. Build the Conceptual Model

The conceptual model in this study was built using an ontology-driven method [52,53,54] where the domain concepts process, product, and resource were adapted for the integration with pLCA.
Construction activities need to be broken down into unit processes before pLCA can be performed [14]. A unit process can be defined as a process that is carried out by one type of professional worker or one type of equipment [30]. Building components that are processed by unit processes are defined as products. Construction-related equipment and construction materials that generate environmental impacts directly or indirectly are defined as resources. The relationships between the real world and the conceptual world are shown in Table 1.
The conceptual model should also include the process logic of how construction activities are organised. To reduce the possibility of making errors and omissions, the Component, Action, Resource, and Sequencing model (“CARS”), proposed by Fischer et al. [55] and applied in simulation by Lu and Olofsson [16], was adopted to detail the logics of construction in a systematic way for DES model development (see Figure 3). The CARS model can collect all of the decentralized construction information into a uniform conceptual model. As can be seen in Figure 3, Component represents the constructed building components, such as stab, pillar, and wall; Action is the series of work actions that is required to construct the components; Resource stands for the necessary materials, equipment, and labour to construct the components; and Sequencing rules the construction activities by the available working space and inherent working sequence.

3.1.3. Build the Simulation Model

DES is utilised to transform the conceptual model into the simulated world. Entity, server, path, process, resource, table, properties, and states are several elements used in DES to build the simulation model. As can be seen in Table 1, an entity represents a construction product in the conceptual model, server and process represent different types of construction operations, and resource evaluates the availability and usage of a construction resource.

3.1.4. Validation

The developed DES model should be validated. Sample data from onsite observations can be useful for validation purposes [56]. However, the construction project for predictive assessment is still at the planning stage. Therefore, an input-output validation [57] is used to validate the established DES model. As the purpose of the simulation is to correctly capture process data (equipment and material) for an environmental assessment, the equipment and material output from the simulation model are compared with a real Quantity Survey of the original project. The result of the simulation model, considering the uncertainty of the input parameters, is considered valid if each simulation item is in agreement with the real project. The testing method is a paired-sample t-test for a normally distributed sample or the Wilcoxon signed-rank test for a non-normally distributed sample.

3.2. Process-Based LCA for Construction

Process-based LCA (pLCA) is used as the assessment framework for DES-pLCA. This section describes how the environmental impact of the construction operation is assessed. The pLCA follows a procedure that has four-stages, including goal and scope definition, life cycle inventory analysis, life cycle impact assessment, and interpretation, which are standardized by the International Organization for Standardization (ISO) [58].
The goal of assessment in this study is to evaluate the construction-related environmental impacts. According to a previous study by Wang et al. [30], construction operations cause environmental impacts by equipment and auxiliary materials usage alongside the offsite materials supply chains and onsite construction. These impact sources are within contractors’ area of decision-making, while other major building materials are determined by the upstream design stage. Thus, a boundary for construction that is, for the major part, based on construction products standard rules EN 15804:2012 + A1:2013 [59] is applied, including (1) upstream auxiliary materials extraction, processing, and production; (2) offsite construction materials transportation (major and auxiliary materials); and (3) the onsite construction operation process.
The developed DES model is used to estimate the quantity of emissions of different impact sources (Q). The i-th emission (Ei) is evaluated from Equation (1):
Ei = Em + Ee = Qm emi + Qeeei,
where Qm and Qe denote the quantity of impact sources from materials and equipment, respectively; and emi and eei represent the emissions per unit quantity of impact sources (emission factor), which can be obtained from public access and commercial LCA databases or previous local LCA studies. The engines of construction transport and onsite equipment run on fossil fuel or electricity. According to the U.S. Environmental Protection Agency (EPA) [60], the energy consumption using fossil fuel can be calculated according to:
Qef = BSFC·EP·PD·LF
where BSFC (lb·hp−1·h−1) is the brake-specific fuel consumption, which gives a measure of an engine’s efficiency from the EPA database [60], EP is the engine power (hp), PD is the process duration simulated by the simulation, and LF is the load factor that reflects the level of equipment use for a specific operational scenario from the EPA database [61]. For electrically driven equipment on a construction site, the use of electricity can be calculated using Equation (3):
Qee = Pe∙PD,
where Pe is the power rating of the electrical equipment. Different types of emissions will lead to various global or regional environmental impacts. After emissions quantification, they are classified using associated impact indicators. CML 2002 is a widely applied impact assessment method at the midpoint level, which groups impacts into 11 types of indicator [62].
Finally, the different categories of environmental impacts are assessed using:
EIj = Ii=1(Eicij),
where EIj is the j-th environmental indicator of the environmental emissions from the construction operation; and cij is the characterization factors from the i-th emission to the j-th environmental indicator, which can be obtained from a characterization database, e.g., CML 2002 [62] or the IPCC’s fifth assessment report [63].

3.3. DES and pLCA Integration for Decision Support

After establishing the DES model and the principles for the pLCA assessment of the construction operations, the simulation and environmental assessment are integrated (see Figure 4). The customized DES model will simulate the entire construction operation of a base scenario under the surveyed dynamic environments and process uncertainties. The developed DES contains information on the equipment operation and materials consumption in each unit process. Based on the simulated data, the simulated total operational time of the equipment and related materials consumption in construction operations are automatically extracted and connected with the inventory analysis and the impact assessment of the pLCA. Specifically, all equipment operations and materials consumption data are automatically collected from the simulation. They will work as impact sources for the inventory analysis. The corresponding emission factors can identify the corresponding impact sources. The emissions as well as the impacts are then assessed. The dynamics can include the daily variations in traffic conditions and onsite working conditions. Process uncertainty can come from variations in working productivity and material wastage rate.
At the DES-pLCA decision support stage, the contribution of each impact source is simulated on the base construction scenario. Then, alternative scenarios are developed based on the most significant impact contributors and evaluated by a DES-pLCA run. Meanwhile, a sensitivity analysis based on the factorial experiment proposed by Morris [57] is performed in order to identify the crucial environmental performance factors. Each factor is attributed a small variation Δ that can be chosen using a fixed value—its confidence interval length—according to Wit and Augenbroe [64]. The difference between the scenarios in average performance with and without Δ is a measure of the importance of the factors. In this way, the proposed DES-pLCA runs a factorial experiment to identify crucial factors to support environmentally conscious onsite management.

4. Prototype and Application

A prototype of the proposed DES-pLCA integrated method was developed and applied in a case study. Simio™ (Version 10) was used as the DES simulation platform due to its great ability for external data exchange during discrete event simulation. Matlab(R) (Version R2017a) was used as an assessment calculation and database management tool. Assessment-related data, e.g., emission factors, characterization values, and equipment parameters, were stored in the database. An Application Program Interface (API) framework, originally created by Dehghanimohammadabadi and Keyser [65], was extended to automate the data exchange between the pLCA assessment and the simulation platforms. An overview of the DES-pLCA prototype is shown in Figure 5.
A hotel building that is located in Heilongjiang province (Northeast China) was selected as a case study to validate the developed method. The collected data from the case study consisted of design and construction documents and an interview with the project manager. The building is a reinforced concrete frame structure with a 14-storey typical floor part, a 2-storey podium floor part, and a 2-storey basement. The total floorage is approximately 36,000 m2, and the height of the building was 80.95 m. The construction of the frame structure of the 14-storey typical floor part was selected to test the developed DES-pLCA integrated method. The planned construction duration for the 14-storey typical floor part was 93 days. This project is chosen as the case study because its reinforced concrete frame structure is widely applied in buildings; so, this project could test the general applicability of proposed method.

4.1. DES Model Production

The production of the simulation model follows the proposed procedure shown in Figure 2. An interview with the project manager and a review of the design/construction documents were carried out to meticulously collect information on the studied case. The conceptual model’s real world representation is shown in Table 2, and the construction logic is shown in Figure 6.
Table 3 shows the uncertainties and dynamic factors in the construction operations. The distributions of work productivity for the construction operations were based on interviews. According to the manger’s experience, a typical floor of the case study building will take 6 (±1) days to complete, depending on, e.g., the workers’ learning curve and the requirement to meet the deadline of the contract at the end of the project. Thus, this study uses a triangular distribution of (0.83, 1, 1.17) to represent the minimum, most likely, and maximum work productivity probability according to the variations in the construction time for a typical floor. Tam et al. [66] estimated the wastage rates for steel and formwork-related materials to be 7.7% and 20%, respectively. Therefore, a Gaussian (normal) distribution (7.7%, 0.0385) was applied for steel works, and a Gaussian (normal) distribution (20%, 0.10) was applied for formwork-related materials.
Premixed concrete and other construction materials are transported to the site to be further processed and assembled. Thus, traffic conditions will influence the duration and fuel usage of material transportation. For the studied case, premixed concrete was supplied from a ready-mixed concrete supplier that was approximately 30 km away from the construction site. Since transportation to the site can occur at any time of day or whenever construction progress requires it, the following assumptions have been made. The average transportation speed is 25 km/h during busy traffic conditions, i.e., between 08:00 and 18:00. During idle traffic conditions (00:00~8:00, 18:00~24:00) the average transportation speed is 30 km/h. The working height is also increased as construction progresses, which will influence the duration and energy use of vertical transports and concrete pumping (see Table 3).
The developed DES model was to simulate the construction process and provide detailed process data for environmental assessment. Therefore, the DES model can be validated by comparing the simulated impact sources with the Quantity Survey of the real planned construction. After validating the simulation model of the original planned scenario (base scenario), a DES-pLCA environmental assessment can be performed and alternative scenarios can be analysed. In the construction simulation model, some of the parameters follow a non-normal distribution. Thus, the nonparametric Wilcoxon signed-rank test was used to compare the difference between the simulation and the real system. The developed DES model was validated, and more details can be found in Appendix A. The number of simulation replications, 50, was based on a trial-and-error method, proposed by Lorscheid et al. [67], that determines the minimum number of replications that is required for a case project.

4.2. LCA Assessment

The process-based LCA assessment used Equations (1)–(4) to quantify the environmental impact. Emission factors, collected from previous LCA research (see Table 4) and characterized by the CML 2002 method [62], were stored in a Matlab database to support the pLCA. Table 4 shows the calculated environmental impact equivalents and data sources that were used in the case study.

4.3. Application Results

4.3.1. The Base Scenario and Impact Sources Analysis

The base scenario—the original supply chain and construction scenario—was firstly evaluated using 500 DES-pLCA runs. The environmental impact values are distributed rather than deterministic (see Figure 7) due to the uncertainty in the working productivity and the materials wastage rates. The variations in the environmental indicators were GWP = 312,003 + 14,895/−15,992, AP = 4977 + 188/−202, EP = 301 + 11/−12, POCP = 344 + 15/−16, ADP = 60,828 + 212/−208 and HTP = 5271 + 285/−310 under the 500 DES-pLCA runs. According to Figure 8, the equipment with the greatest impact on GWP includes the steel trailer, the concrete mixer truck, the crane tower, the concrete pump, and the concrete vibrator. With regard to auxiliary materials, the use of iron wire had the largest impact on GWP followed by plywood and steel-made joints. Besides this, in the base scenario, Figure 8 also shows that the crane tower and vibrator operations contribute the highest lower and upper variation among the equipment, respectively. Iron wire usage contributes both the highest lower and upper variation among the materials. The DES-pLCA assessment also provides environmental impacts as construction progresses. Figure 9a shows the GWP impact per unit of transport work (kg-CO2-eq./tonne or m3 materials transport) and completed work per unit of time (tonne or m3 materials transport/hour) for the crane, lift, and concrete pump in a DES-pLCA run. While the unit of work’s GWP impact is increasing, the unit of time’s complete transport work (productivity) decreases as construction progresses. The accumulated GWP as a function of construction progress is shown in Figure 9b for the crane, lift, and concrete pump. After an almost constant rate of increase, the GWP growth rate of the crane and the lift decreases after approximately 83% of construction progress (576 working hours), while the growth rate of the pump stays steady during this time.

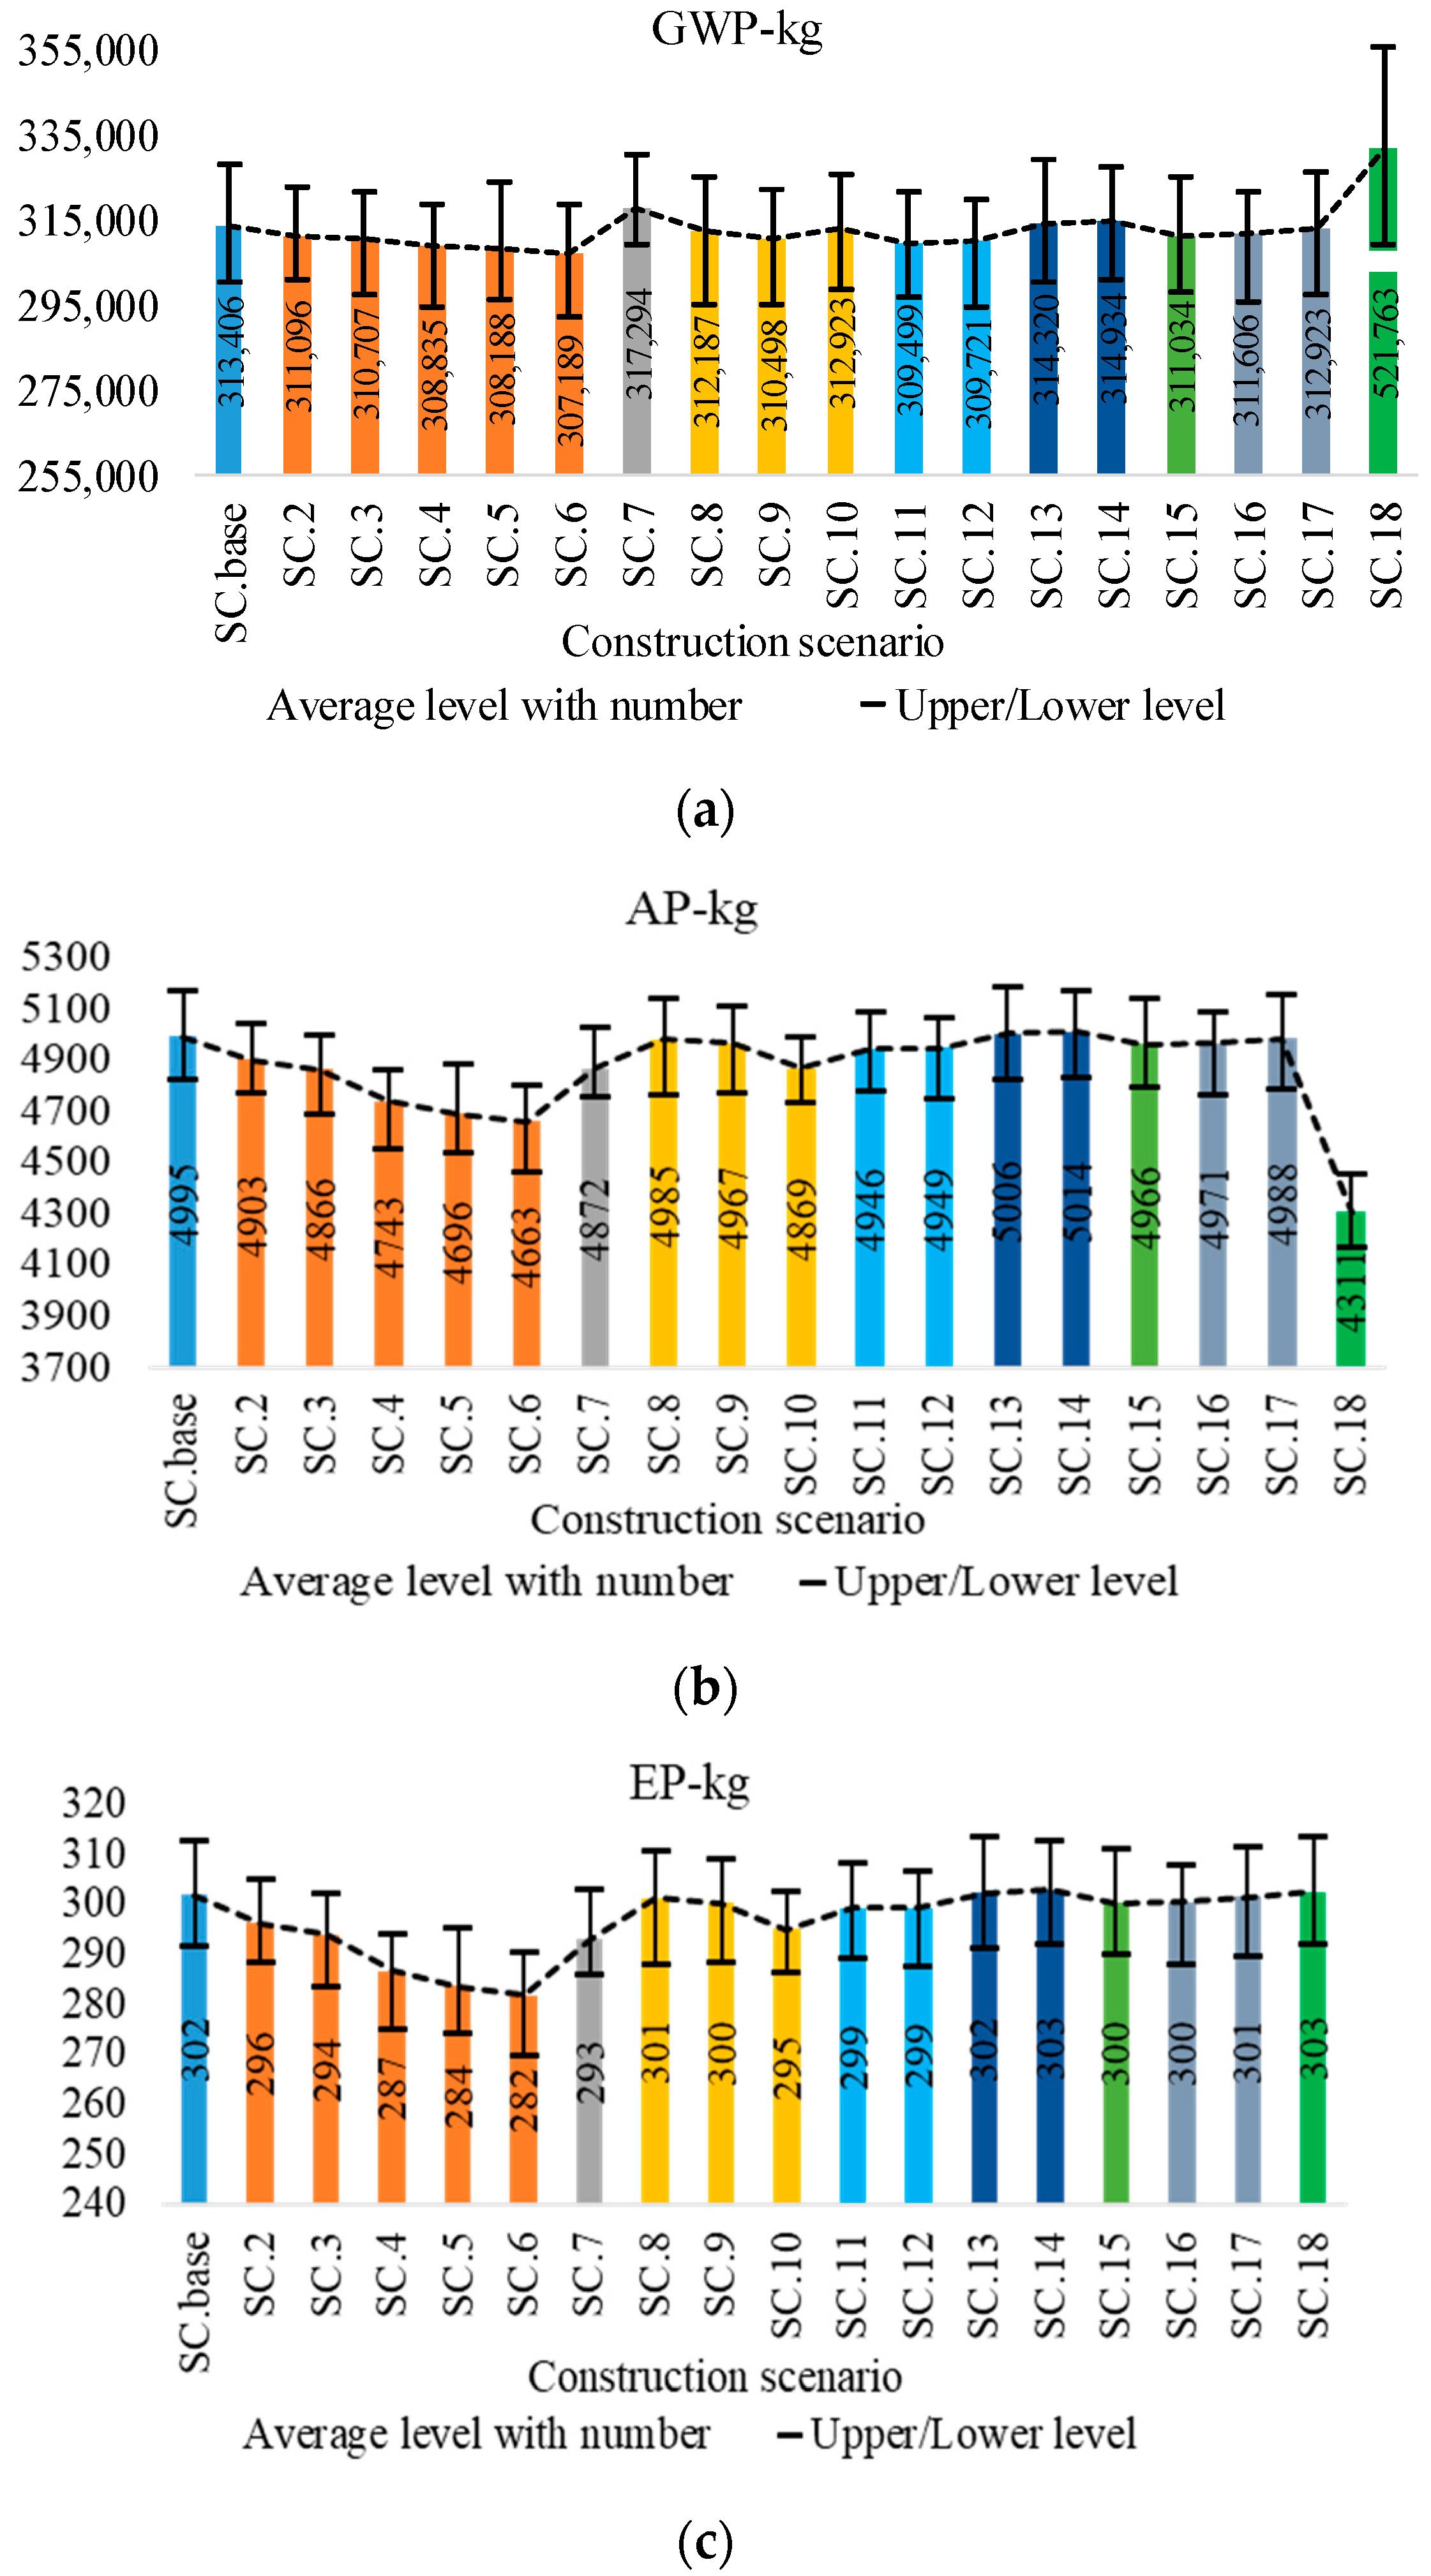
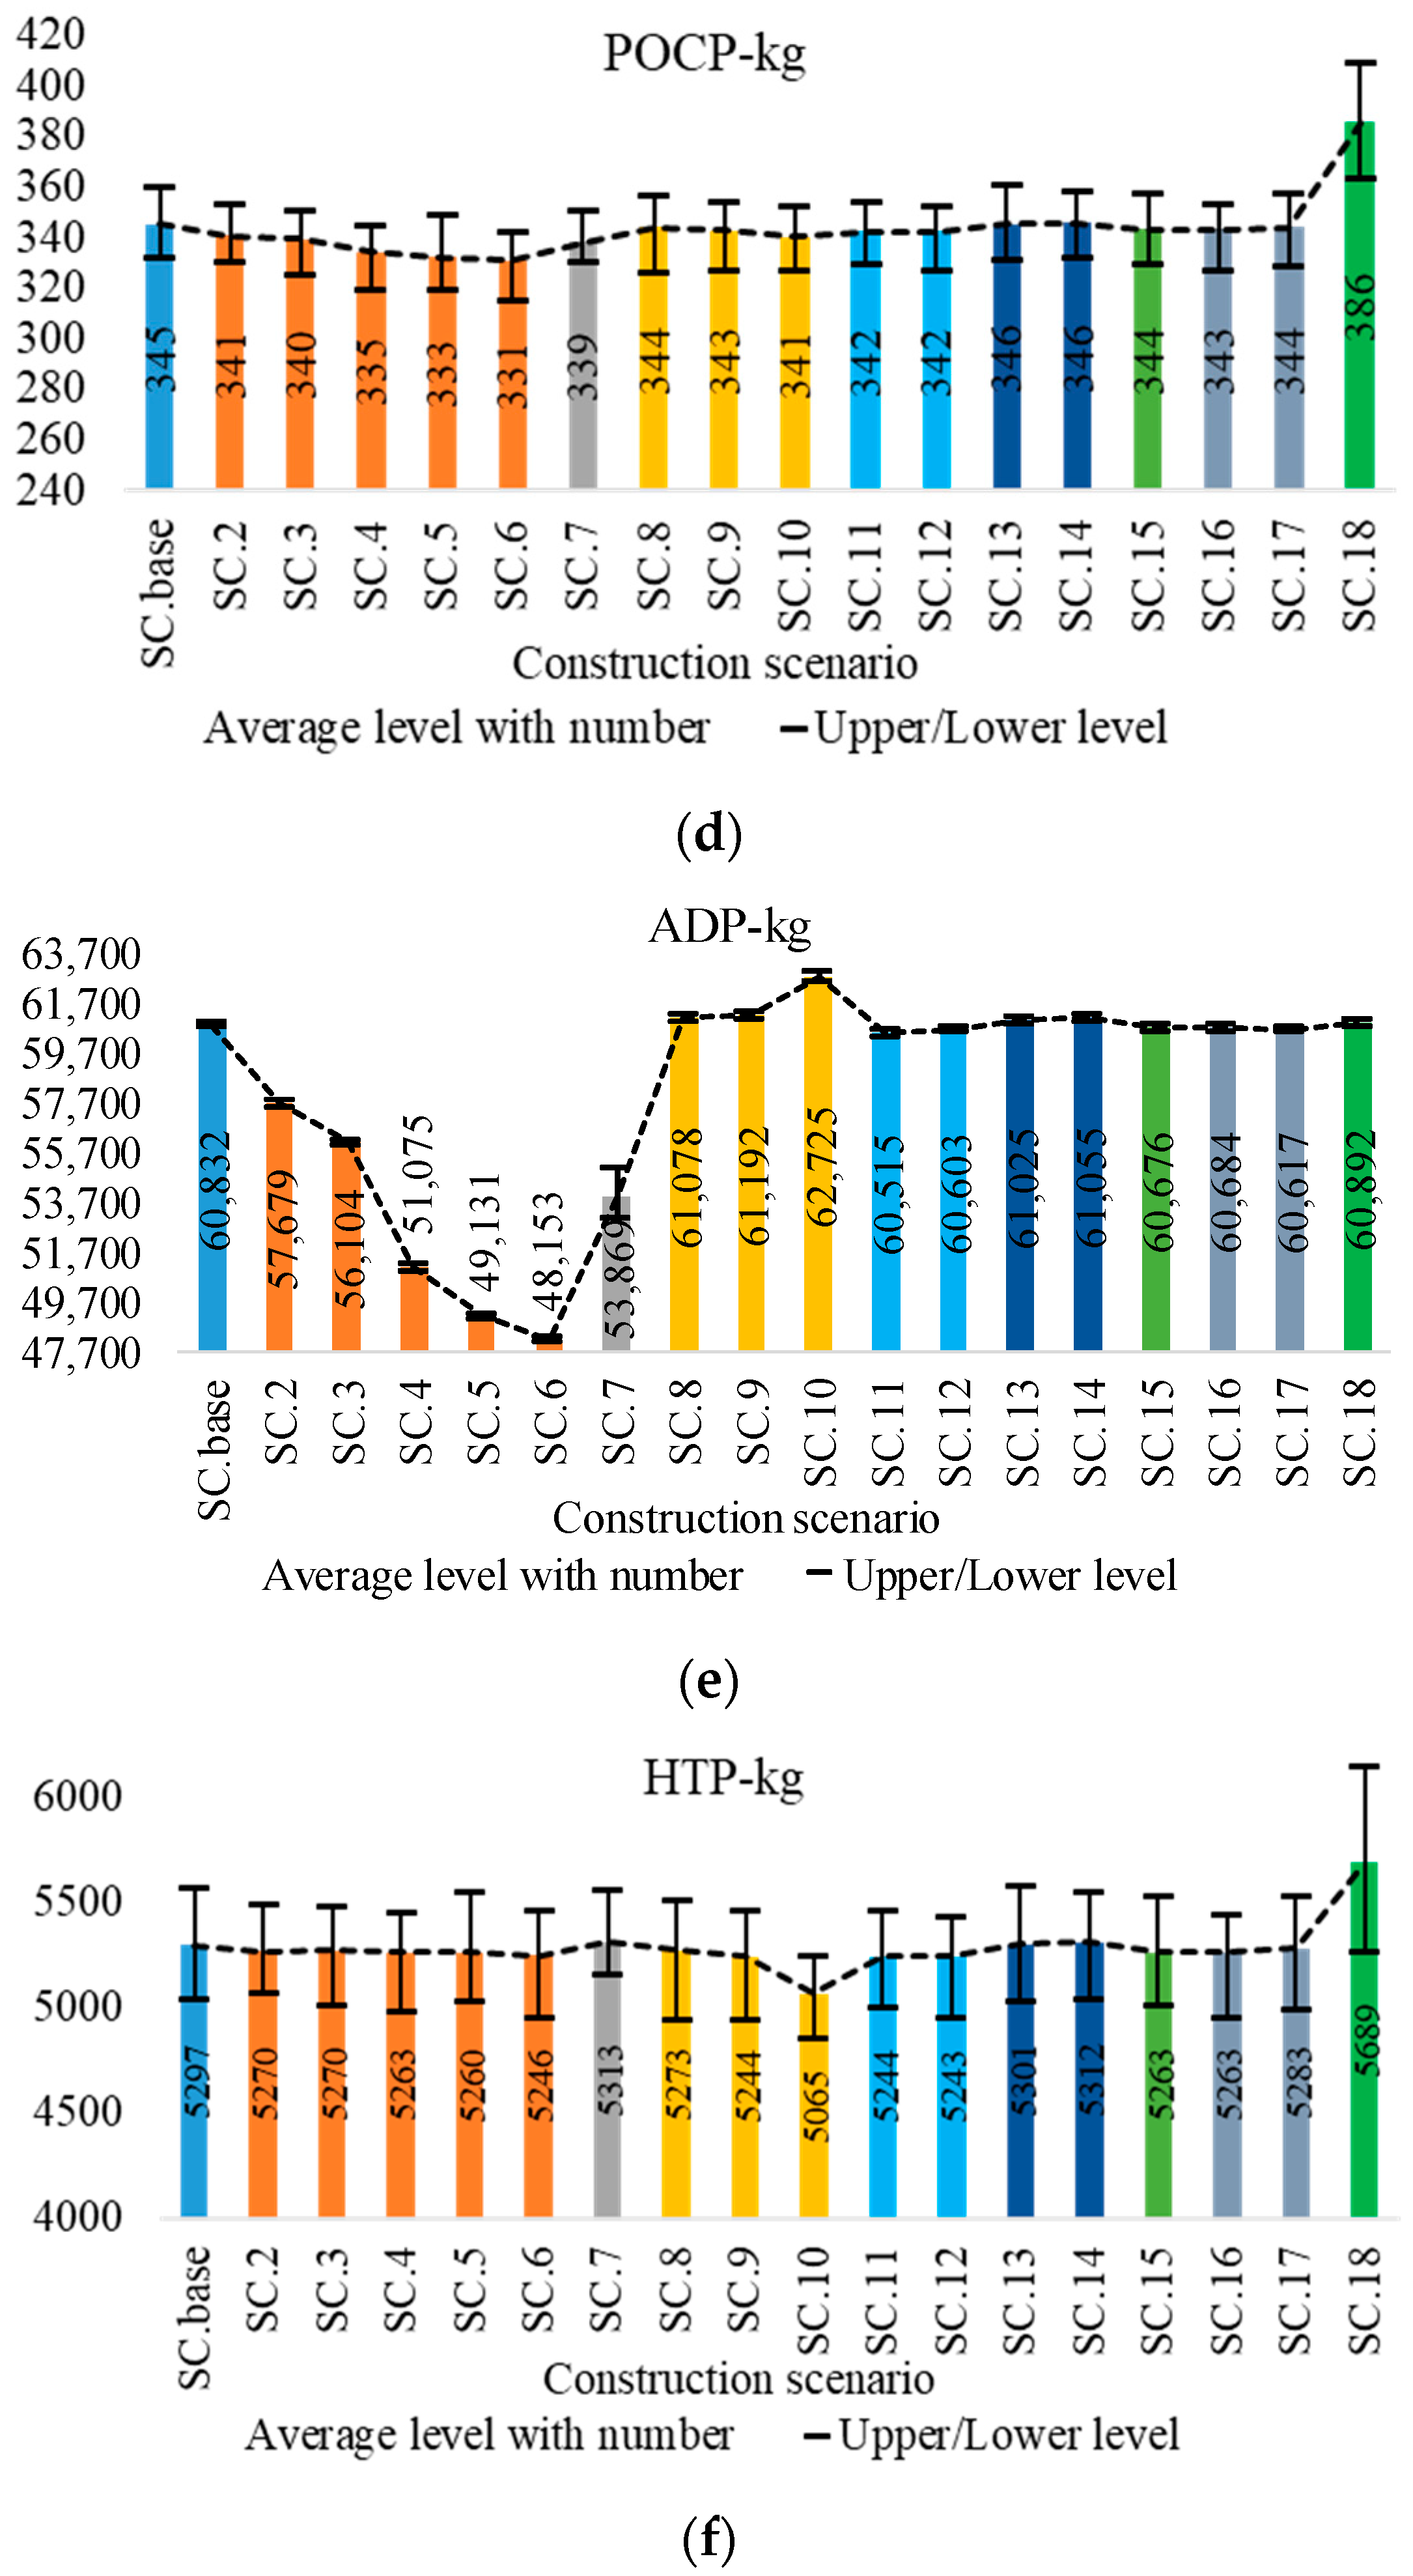
4.3.2. Alternative Scenarios

The alternative scenarios are developed based on the significant contributors of the base scenario. The feasibility and data regarding alternative scenarios in the supply chain and construction were obtained from construction documents and discussions with the construction manager (see Table 5). The different scenarios in Table 5 were then evaluated by the DES-pLCA prototype using 50 replications to ensure that the output variance was stable [67,76]. The result of the different individual scenarios (changing one at a time) is compared in terms of the impact categories (see Figure 10).
Based on the individual scenario comparison, the performance of a combination of the best scenarios was simulated by DES-pLCA (see Table 6). The results show that the optimal construction scenarios are different in terms of different indictors. For instance, the performance of the combination of scenario 6 (concrete supplier), scenario base (type of steel transport vehicle), scenario 9 (type of concrete pump), scenario 12 (type of crane tower), scenario base (type of construction lift), scenario 15 (lift priority strategy), scenario 16 (type of vibrator), and scenario base (type of iron wire) is better for mitigating the GWP impact at the average level. However, in terms of AP impact, the 6-t steel truck, 30 kW concrete pump, XGT8039-25 crane, and annealed iron wire combination is better. Therefore, the best option is dependent on the assessed environmental indicator.
The tower crane and construction lift are two vertical transporters onsite. The strategy should decide which transporter has priority to transport construction materials during the vertical transport’s rush period. In this study, two possible strategies were compared (the base scenario and scenario 15). The result indicates that giving priority to the construction lift (scenario 15) for the main materials will improve all impact indicators.

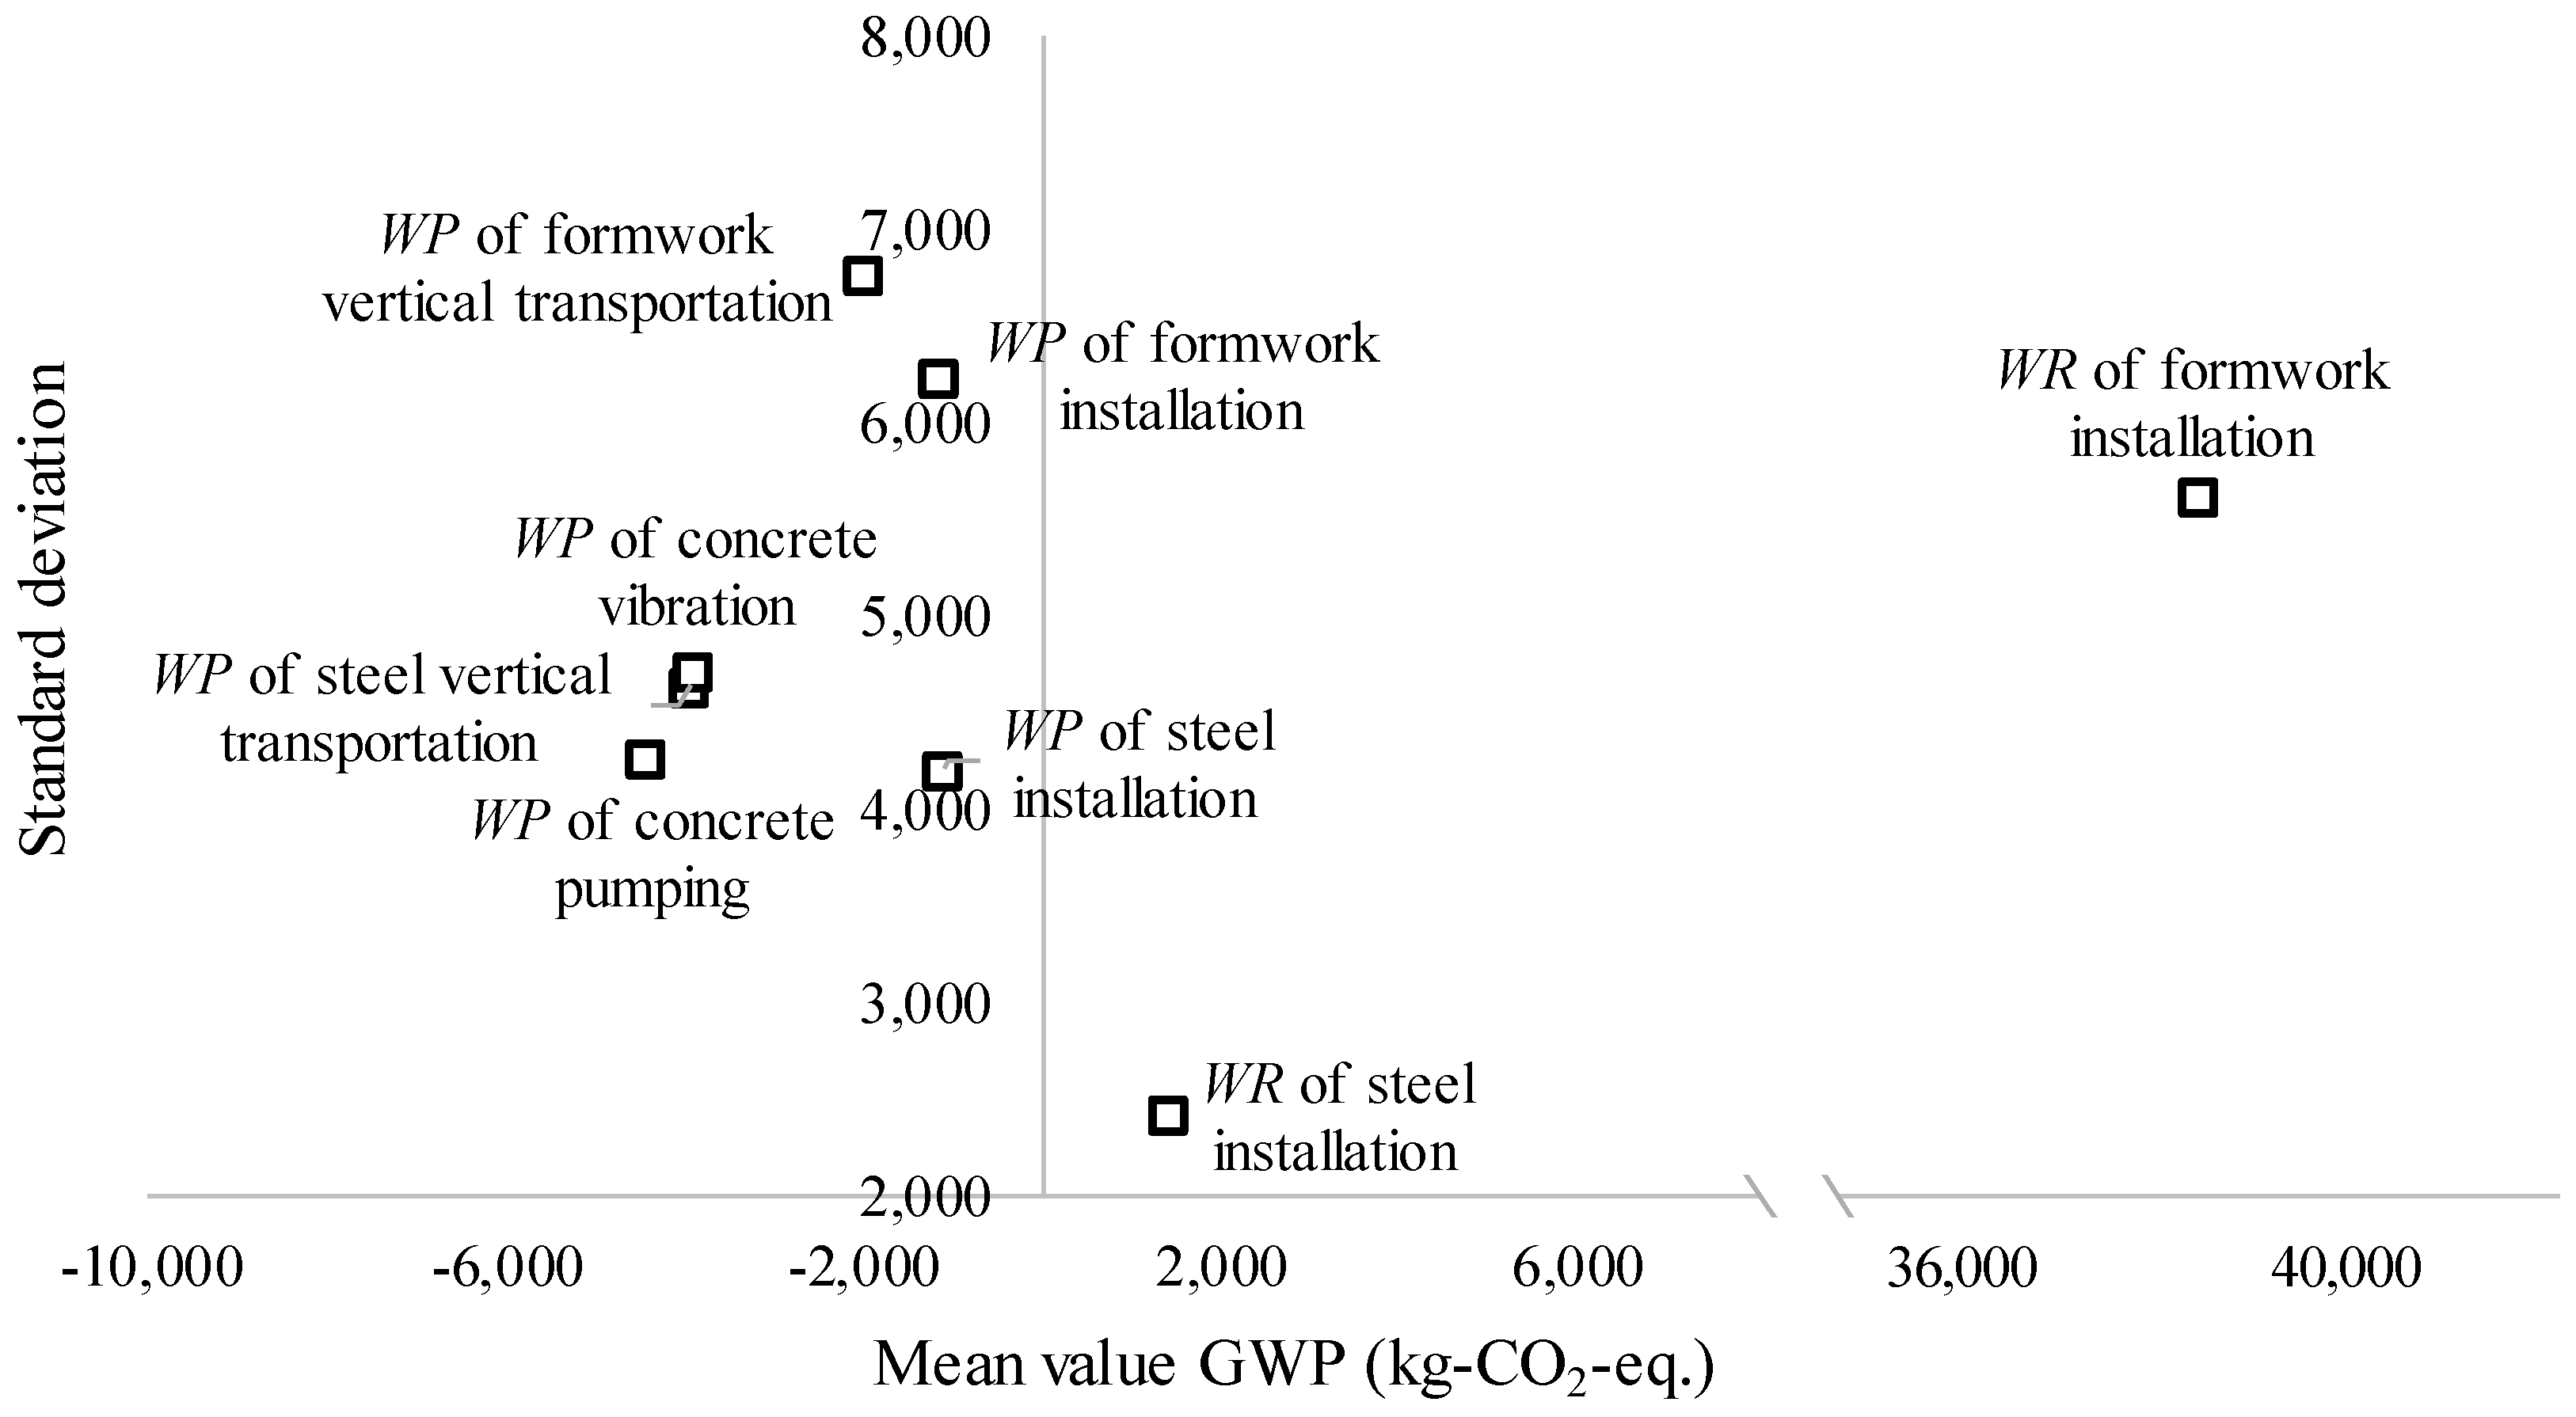
4.3.3. Sensitivity Analysis

A sensitivity analysis based on the DES-pLCA factorial experiment was conducted to identify the environmentally crucial uncertainty factors that had the highest influence on the environmental variation. In this case study, the importance of eight uncertainty factors in terms of GWP was analysed and ranked. The Δ was determined as the confidence interval length of each factor. For each factor, 10 independent samples (r = 10) were run on the GWP indicator. The average GWP value was 313,406 kg. In total, 80 DES-pLCA runs were performed to simulate the value difference with and without Δ. The mean value differences are shown in Figure 11, and the importance ranking of the uncertainty factors is shown in Table 7. According to the results, the material wastage rate of formwork installation is the most important factor that influences the GWP performance. The productivity of the steel and formwork installations that are labour intensive has a very limited influence on the GWP performance.

5. Discussion

The proposed DES-pLCA method has two interactive modules: a construction simulation module using DES and an environmental impact assessment module using process-based LCA. The developed prototype, based on the proposed integration method, was used to study the environmental impact of a hotel building’s construction. In the case study, the iron wire, plywood, and steel-related components (Joint, Bolt, Steel tube) contributed the most to GWP among the auxiliary materials. Offsite transports by trailers and trucks and the use of a crane tower for onsite transports have the highest GWP impacts among the equipment. These results are consistent with findings from previous research by Wang et al. [30], where iron wire, plywood, and steel components were found to contribute 81% of GWP impacts; and by Bilec et al. [1], where transportation equipment was found to be a major emission source both offsite and onsite. These results indicate that, among all of the construction-related materials, iron wire, plywood, and steel components should attract the most attention due to their high influence. Among all of the construction equipment, the offsite and onsite transport equipment should attract the most consideration when choosing environmentally friendly equipment.
The effect of uncertainties in the construction operation is captured by the proposed DES-pLCA method as shown in Figure 7. Due to the uncertainty, the greatest variation for the base scenario in GWP, AP, EP, POCP, ADP, and HTP was 5.1%, 4.1%, 4.1%, 4.7%, 0.3%, and 5.9%, respectively. The variations are lower than the result of a 16.0% increase in GWP by Krantz et al. [77]. It could be that previous research has overestimated all construction processes to have a 20% different triangular distribution. In addition, it is also lower than the results in previous study by Lasvaux et al. [78] that uncertainty comes from different LCA databases, Häfliger et al. [79] that uncertainty comes from the LCA calculation method, and Hoxha et al. [80] that uncertainty comes, for the major part, from building materials. Nevertheless, this study found that the uncertain factors that derive from the construction processes also have non-negligible variations (highest for HTP, 5.9%) in environmental impacts. Quantifying the effects of uncertainty provides information that is more comprehensive for construction decision-making. On the contrary, it is challenging to represent fluctuations in the environmental impacts with LCA, which is usually based on static inventory data.
Construction operations are performed in dynamic environments that will influence process performances. This dynamic characteristic requires process analysis to capture the influence of changing conditions on performance as construction progresses. The developed DES-pLCA method can model dynamic operational environments. In this case, the dynamic effect of traffic conditions (24-h a day) on the supply of materials to the site and the increased working height at the construction operations site were modelled in DES. Figure 9a shows that the GWP impact per task by the crane tower, the construction lift, and the concrete pump increases, and the working productivity decreases, with the increase in height as construction progresses. Thus, the rate of accumulated GWP impact is affected by the dynamic onsite conditions as shown in Figure 9b. The DES-pLCA method can describe more precisely the effect of energy efficiency and working productivity on vertical transportation. In theory, the DES-pLCA method can model construction operations more realistically for the assessment of the environmental performance.
The DES-pLCA integrated method can also be applied for impact mitigation planning. Based on the results of the impact sources, the significant impact contributors have been identified (see Figure 8). Mitigation construction scenarios can be developed that focus on those environmentally crucial aspects that have a higher potential to be optimized. Furthermore, the sensitivity analysis can identify the most important factors from the DES-pLCA factorial experiments, which provides construction management key factors to follow-up with and manage in order to mitigate the environmental impact during a construction operation. Among the eight studied uncertainty factors, the material wastage rate of formwork installation and the work productivity of concrete pumping are the most crucial factors that influence the GWP impact. Thus, the control and improvement of these factors should be the most important construction management issues from a global warming perspective.
In addition, the integration method also makes environmental assessment and the comparison of scenarios easier to perform. The specialized knowledge and time that are required to make a traditional process-based LCA assessment in order to compare all construction scenarios are too time-consuming to support contractors’ decision-making [30]. Based on the integrated simulation and assessment framework, the effort of analysing the environmental performance of different scenarios is greatly reduced. A new scenario can be assessed simply by changing the simulation parameters. The required process data for the LCA assessment is automatically simulated, extracted, and imported. The case study consisted of eight variables to represent eight decision aspects, which were assessed and compared in terms of six environmental impact indicators. When taking GWP as an environmental indicator, the highest reduction in GWP was 2.5% (313,406 − 305,604 = 7802), which was achieved by concrete supplier 2 with a 5 m3 mixer truck (concrete supplier), a 25-t steel trailer (type of steel transport vehicle), a 45-kW concrete pump (type of concrete pump), an XGT8040-25 crane (type of crane tower), an SCD200/200 V lift (type of construction lift) where the lift has priority (vertical transport strategy), a 50-mm concrete vibrator (type of vibrator), and ϕ 0.7-mm iron wire (type of iron wire).

6. Conclusions

The demands of environmentally friendly construction projects motivate contractors to plan and manage environmentally friendly construction operations. Construction operations are inherently performed under dynamic and uncertain conditions [16,23]. This research proposed an innovative method that integrates DES with LCA in order to make predictive environmental assessments under the uncertain and dynamic conditions that characterize construction projects.
The construction of a hotel building’s reinforced concrete frame was studied to test the proposed method. Based on the results from the case study, the developed method was able to:
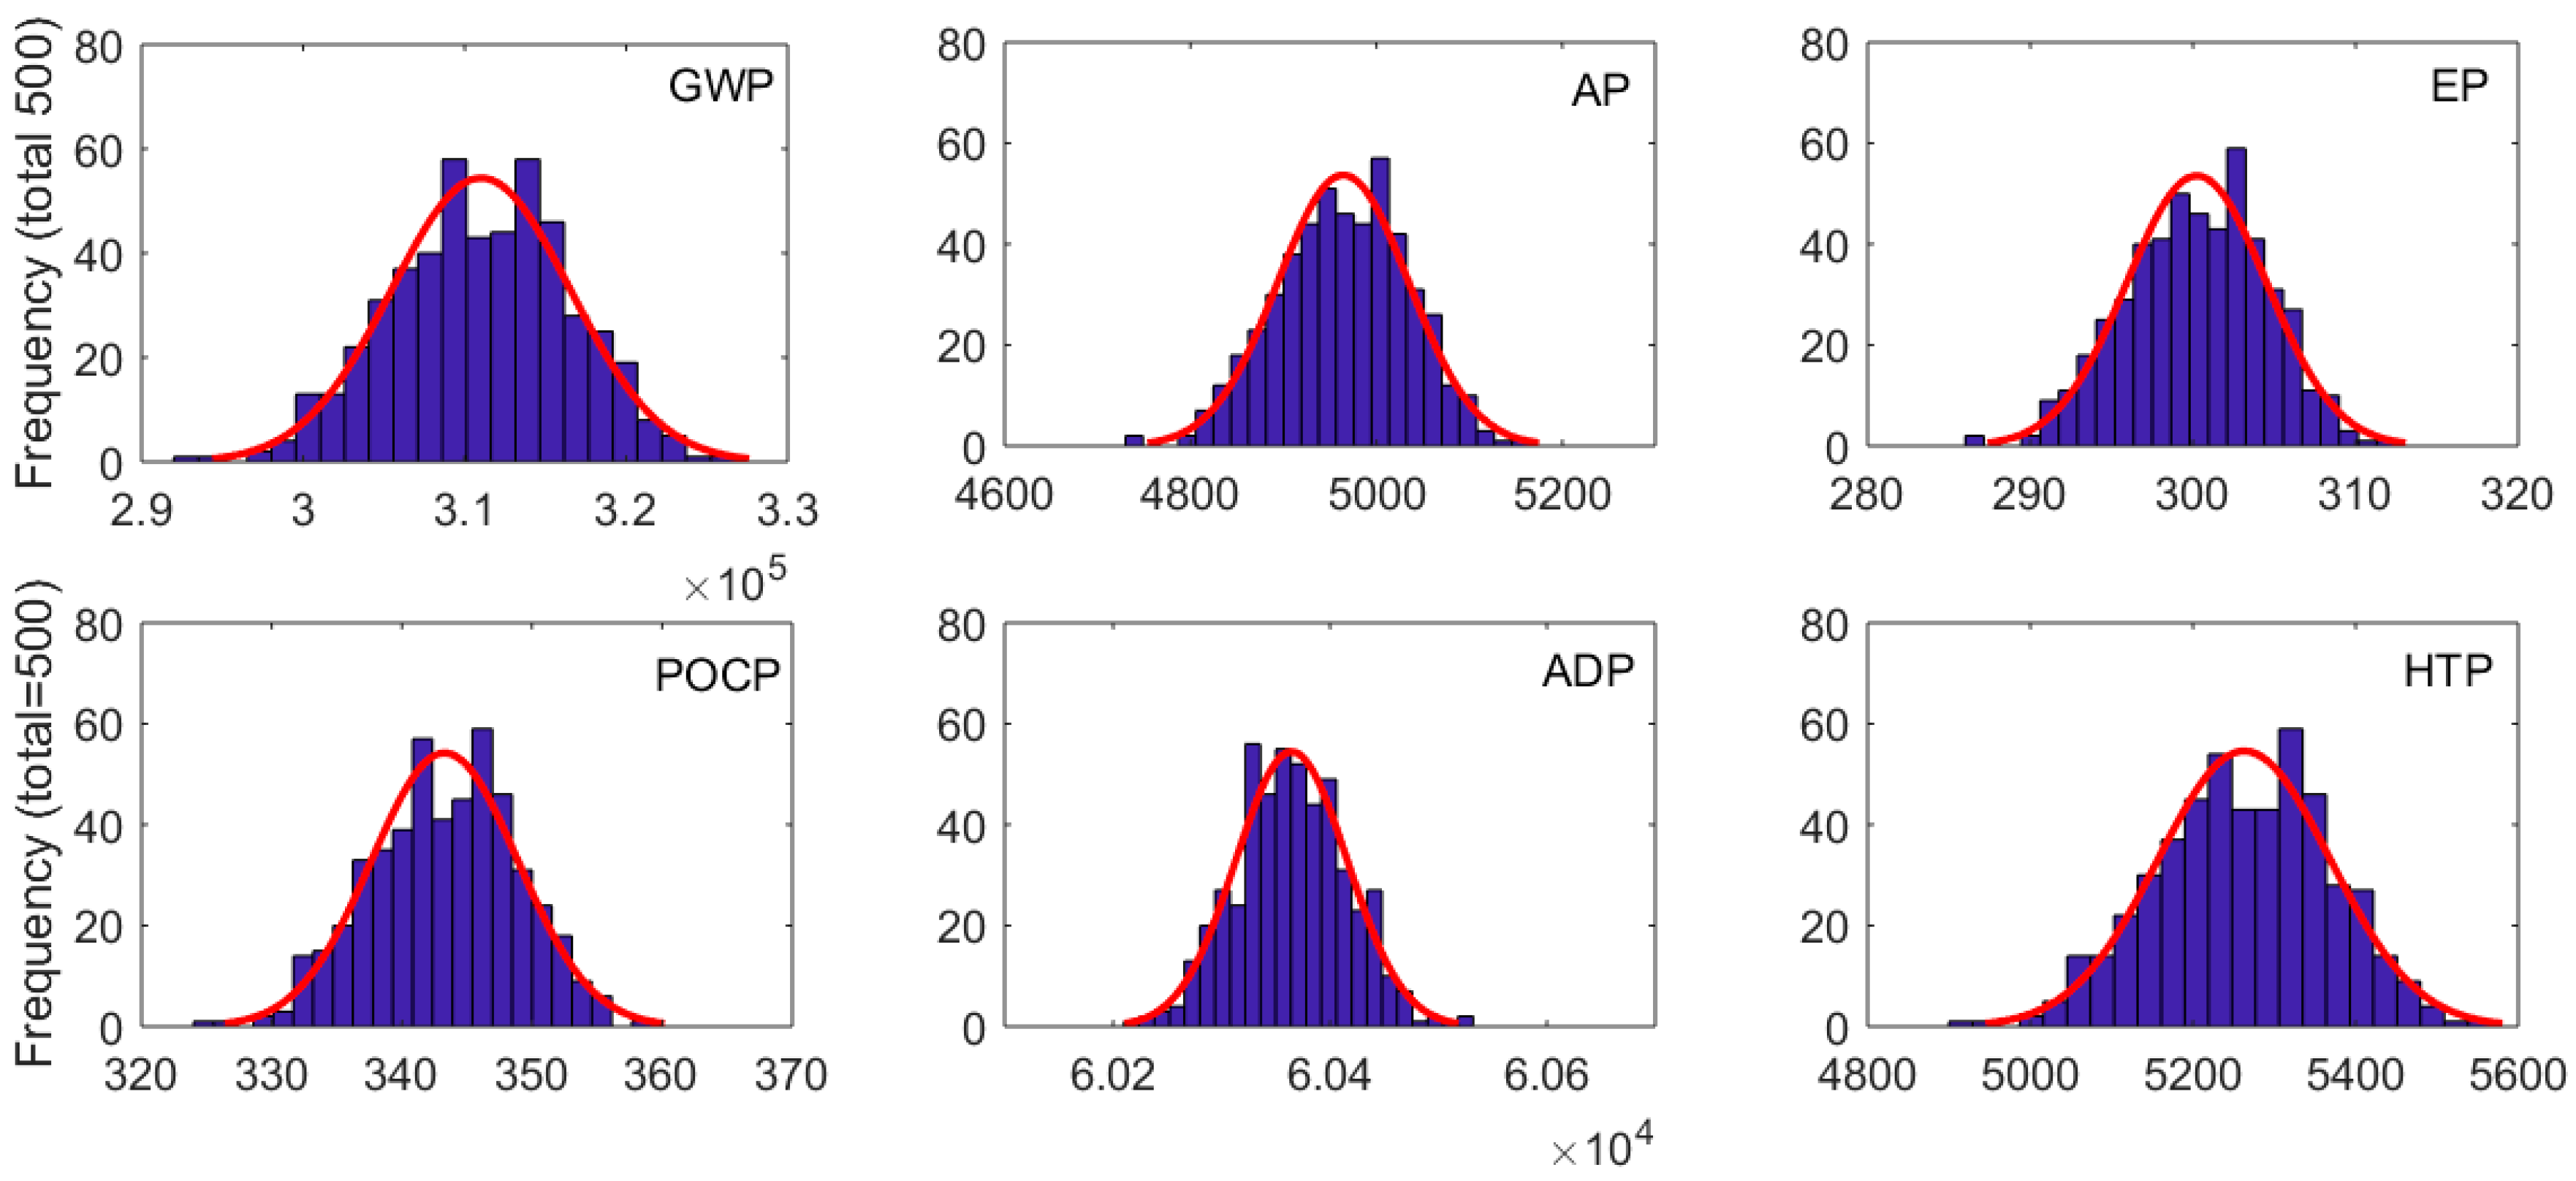
  • Quantify variations in environmental indicators due to uncertain factors and dynamic effects.
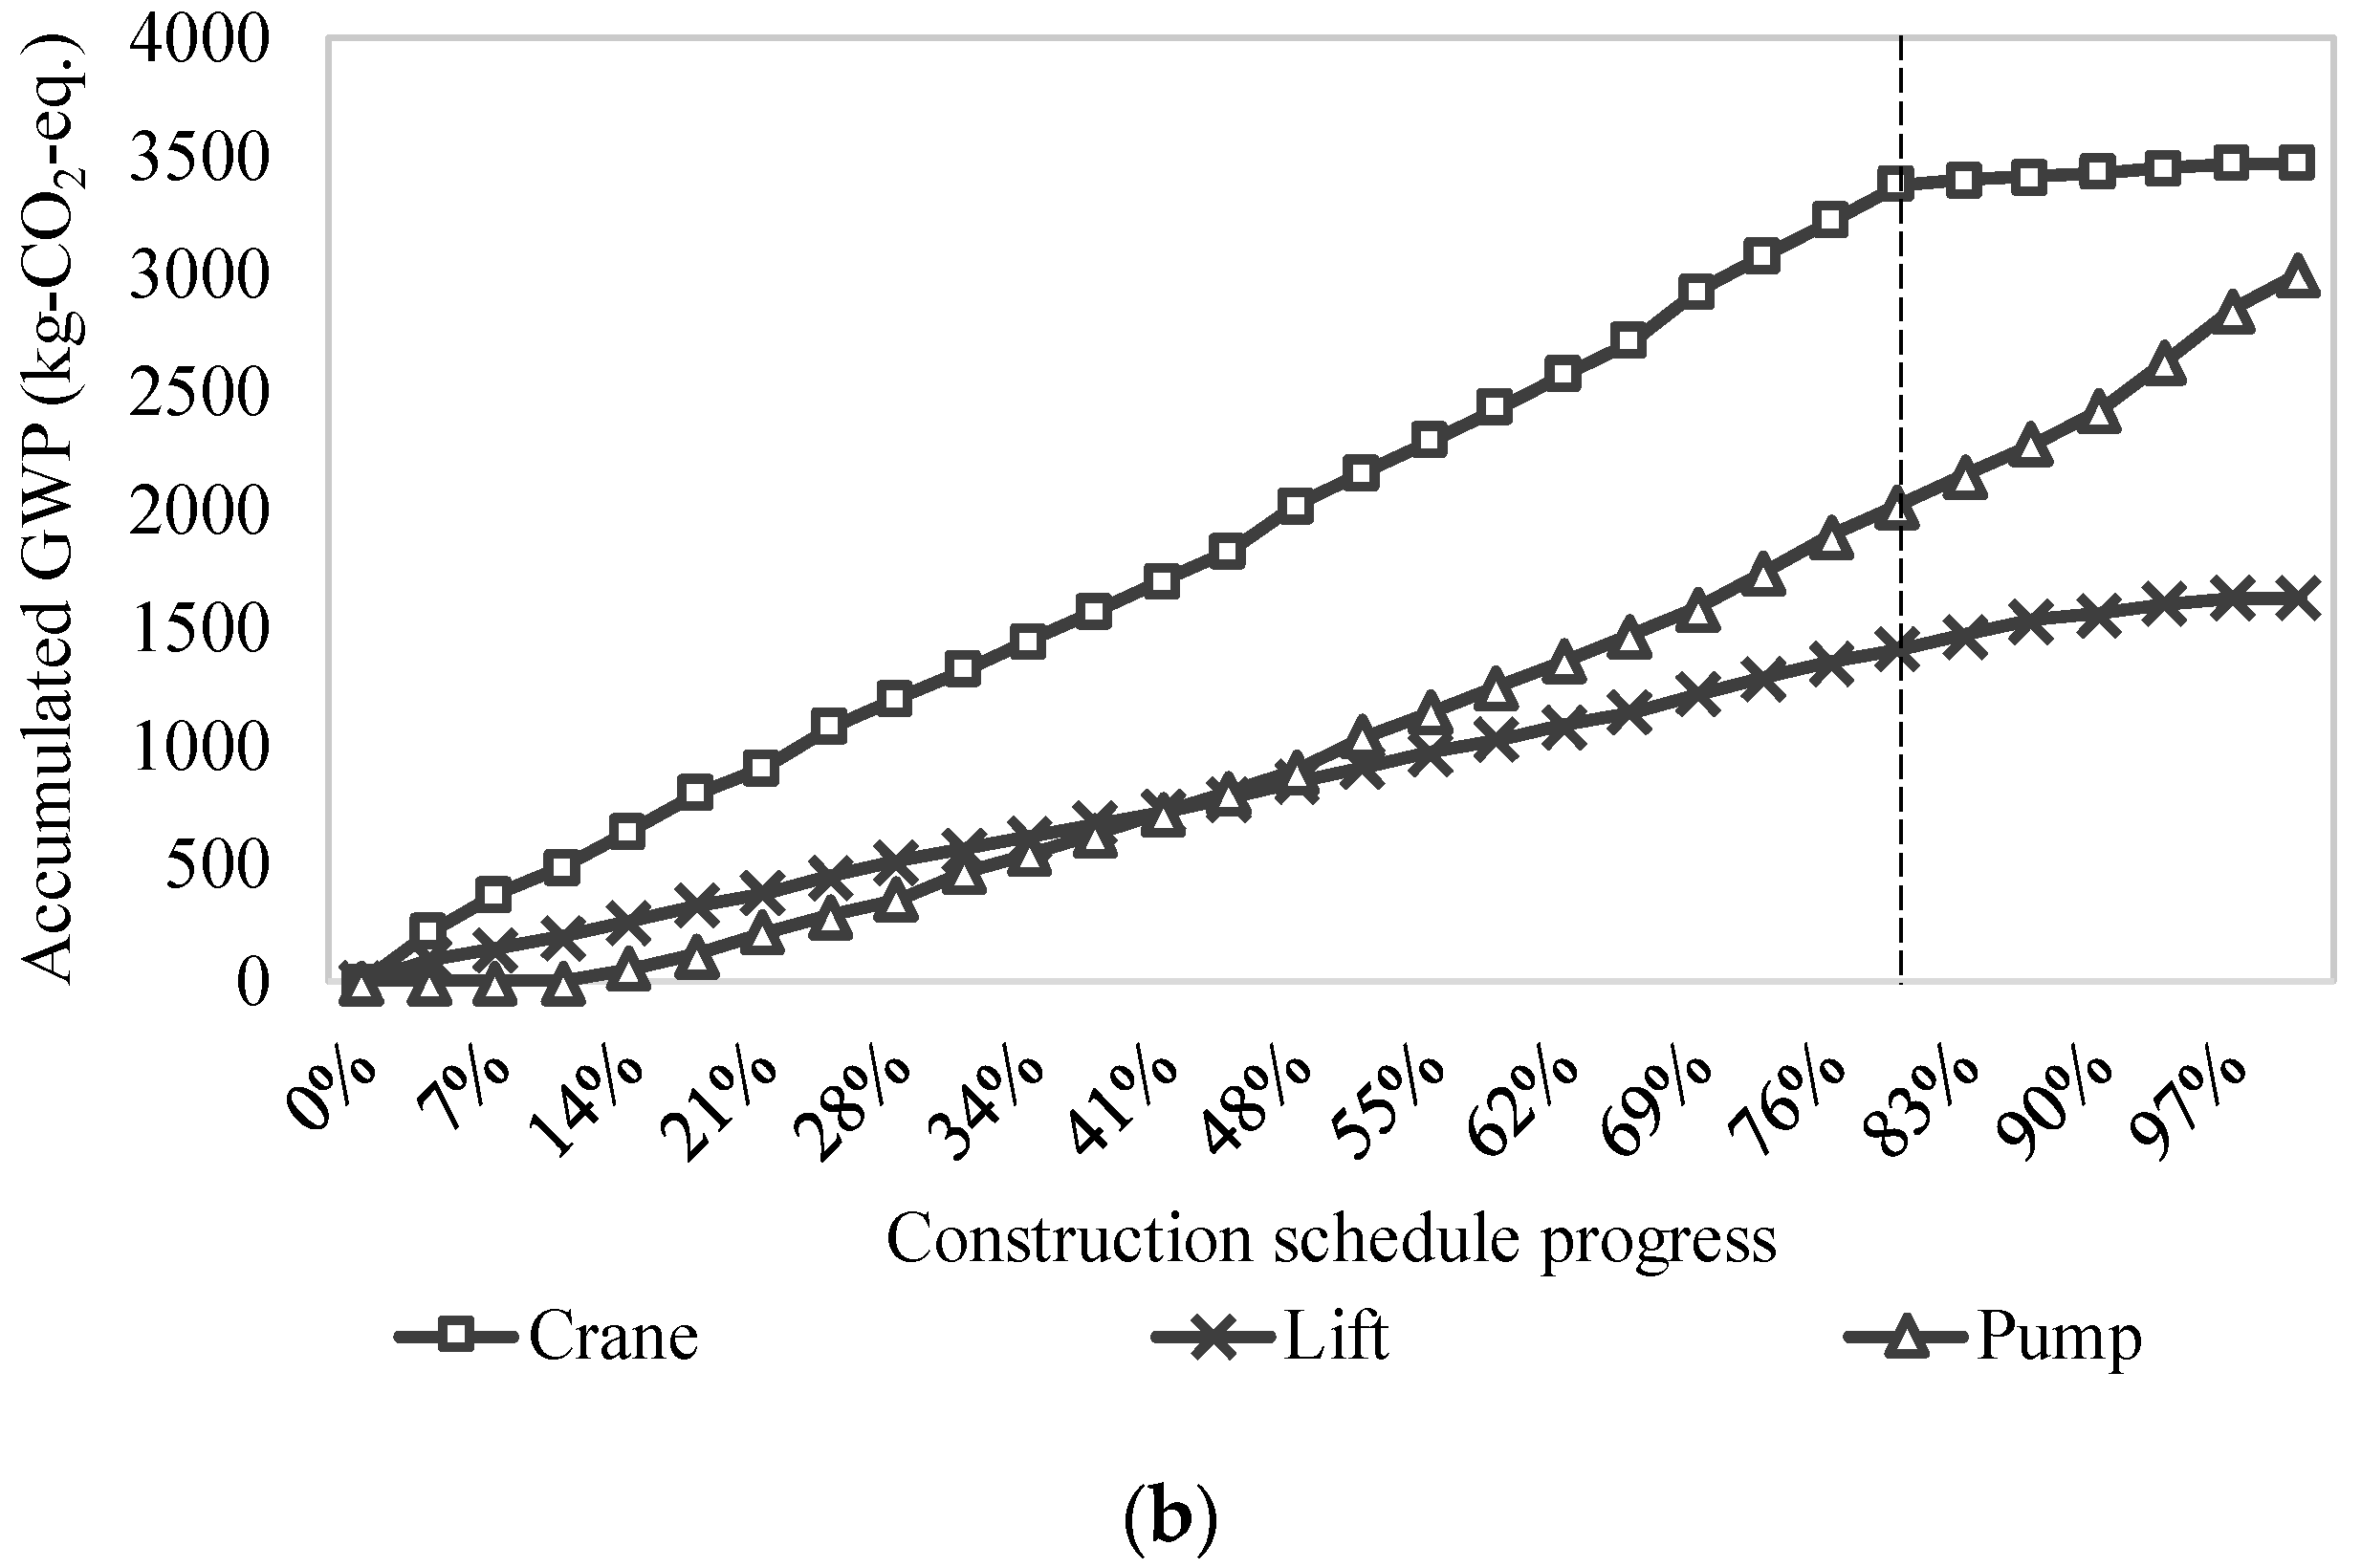
  • Assess the environmental impact of a base scenario for the identification of important impact sources.
  • Compare construction scenarios for the selection of the best options for impact reduction.
  • Identify the most crucial factors for construction management from a sensitivity analysis.
A promising industry use for the DES-pLCA method is the assessment of construction plans before the actual construction commences. Many feasible alternatives can be compared by DES-pLCA. The impacts assessed can be considered as environmental performance predictions for construction planning. The suggestions provided by DES-pLCA work as a pathway that supports the contractor in the development of more environmentally friendly construction operations. The DES-pLCA can also support the follow-up and control of a construction operation’s progress. The importance of different management aspects of the environmental impacts can be ranked by DES-pLCA. In this application, the identified key aspects are valuable for environmentally conscious project management.
Even though the proposed DES-pLCA was able to provide an environmental assessment that considered process uncertainties and dynamic environments, there are limitations that will be addressed in the future. The probability distributions of uncertainty and the information on dynamic environments that were used in this study are based on data from experience and assumptions. A sensor-based offsite and onsite information collection mechanism for construction operations, e.g., Kanan et al. [81], will provide a source of input data for the proposed DES-pLCA method. Hence, environmental predictions of construction operations based on real-time information can be provided for informed environmentally friendly decisions. On the other side, the impact variations might also have a relationship with other factors, such as the planned construction duration and the building price. The proposed DES-pLCA method could quantify these influences when their relationships to the construction process are properly defined. In the environment of fast-developing building information modelling technology that contains building material quantities and schedules, we may expand the ability of the proposed DES-pLCA method if we connect it to a building model. Thus, the optimal decision could be made during the building’s design phase and based on the performance of the construction operation.

Author Contributions

Conceptualization, K.F., W.L., and S.C.; methodology, K.F.; validation, W.L. and H.Y.; experiments, K.F. and S.C.; writing (original draft preparation), K.F.; writing (review and editing), T.O.; supervision, Y.W. and T.O.

Funding

This research was funded by the National Key Research and Development Program of China, grant number 2016YFC0701904, the Swedish Research Council for Environment, Agricultural Sciences, and Spatial Planning (Formas) and the Modern Green Construction Technology and Management Research Center of the Harbin Institute of Technology-China Construction Fourth Engineering Division Corp. Ltd.

Conflicts of Interest

The authors declare no conflict of interest.

Appendix A. Simulation Model Validation

The DES model was validated by comparing the results of the base scenario between the simulation and the real construction. All environmentally related items of the real construction (base scenario) are based on Quantity Survey documents (see Table A1). It should be noted that the simulation data consider uncertainty and dynamic factors, and the Quantity Survey material quantities consider the static wastage rate.
Table A1. Impact sources quantities from the simulation and the real construction.
Impact SourcesReal Construction Quantity Survey (Full Working Hours or Tonnes)Simulation (Full Working Hours or Tonnes)
Crane tower1413.04
Lift10.46
Concrete pump3435.64
Vibrating screen7787.16
Trailer for steel HPB2351826.01
Trailer for steel HRB335/HRB400805827.38
Steel straightener4040.00
Steel bender7069.85
Steel cutter106105.66
Threading machine6464.24
Concrete mixer truck15421672.00
Formwork cutter6666.15
Formwork truck2017.92
Plywood7775.45
Steel tube2.0351.976
Joint8.1107.876
Bolt5.9515.779
Iron wire16.92518.022
Batten0.1790.174
Water8.2116.590
PVC0.6170.827
According to a Wilcoxon signed-rank test, the Sig. value is 0.959 > 0.050 (see Table A2), which means that the simulation and real data pairs have no statistical difference at the 95% confidence level. This indicates that the raw data for assessment are statistically the same between the simulation and the real construction. It thus validates the produced DES model.
Table A2. The difference test between the simulation and the real construction.
Null HypothesisTestSig.Decision
The median of differences between the real construction and the simulation equals 0.Related-samples Wilcoxon signed-rank test0.959Retain the null hypothesis.
Note: the significance level is 0.05.

References

  1. Bilec, M.; Ries, R.; Matthews, H.S.; Sharrard, A.L. Example of a hybrid life-cycle assessment of construction processes. J. Infrastruct. Syst. 2006, 12, 207–215. [Google Scholar] [CrossRef]
  2. Devi, L.P.; Palaniappan, S. A study on energy use for excavation and transport of soil during building construction. J. Clean. Prod. 2017, 164, 543–556. [Google Scholar] [CrossRef]
  3. Hiwase, P.; Raman, N.; Hajare, H. Critical factor of large township building and its relevance in environmental audit: A critical evaluation. Environ. Dev. Sustain. 2018, 20, 433–449. [Google Scholar] [CrossRef]
  4. Trafikverket Klimatkrav. Available online: https://www.trafikverket.se/for-dig-i-branschen/miljo---for-dig-i-branschen/energi-och-klimat/klimatkrav/ (accessed on 24 October 2018).
  5. Collyer, S.; Warren, C.M. Project management approaches for dynamic environments. Int. J. Proj. Manag. 2009, 27, 355–364. [Google Scholar] [CrossRef] [Green Version]
  6. Nguyen, L.D.; Ogunlana, S.O. Modeling the dynamics of an infrastructure project. Comput. Aided Civ. Infrastruct. Eng. 2005, 20, 265–279. [Google Scholar] [CrossRef]
  7. Ghasri, M.; Maghrebi, M.; Rashidi, T.H.; Waller, S.T. Hazard-based model for concrete pouring duration using construction site and supply chain parameters. Autom. Constr. 2016, 71, 283–293. [Google Scholar] [CrossRef]
  8. Moret, Y.; Einstein, H.H. Construction cost and duration uncertainty model: Application to high-speed rail line project. J. Constr. Eng. Manag. 2016, 142, 05016010. [Google Scholar] [CrossRef]
  9. Zhang, H. Discrete-Event Simulation for Estimating Emissions from Construction Processes. J. Manag. Eng. 2015, 31, 04014034. [Google Scholar] [CrossRef]
  10. Dixit, M.K.; Fernández-Solís, J.L.; Lavy, S.; Culp, C.H. Identification of parameters for embodied energy measurement: A literature review. Energy Build. 2010, 42, 1238–1247. [Google Scholar] [CrossRef]
  11. Langston, Y.L.; Langston, C.A. Reliability of building embodied energy modelling: An analysis of 30 Melbourne case studies. Constr. Manag. Econ. 2008, 26, 147–160. [Google Scholar] [CrossRef]
  12. Hong, J.; Shen, G.Q.; Feng, Y.; Lau, W.S.-T.; Mao, C. Greenhouse gas emissions during the construction phase of a building: A case study in China. J. Clean. Prod. 2015, 103, 249–259. [Google Scholar] [CrossRef]
  13. Asbjornsen, O.A. Quality assurance and control (QAC) of uncertainty models and simulations of life cycle assessment (LCA). In Proceedings of the 3rd International Symposium on Uncertainty Modeling and Analysis and Annual Conference of the North American Fuzzy Information Processing Society, College Park, MD, USA, 17–20 September 1995; pp. 252–257. [Google Scholar]
  14. Löfgren, B.; Tillman, A.M. Relating manufacturing system configuration to life-cycle environmental performance: Discrete-event simulation supplemented with LCA. J. Clean. Prod. 2011, 19, 2015–2024. [Google Scholar] [CrossRef]
  15. Gidado, K. Project complexity: The focal point of construction production planning. Constr. Manag. Econ. 1996, 14, 213–225. [Google Scholar] [CrossRef]
  16. Lu, W.; Olofsson, T. Building information modeling and discrete event simulation: Towards an integrated framework. Autom. Constr. 2014, 44, 73–83. [Google Scholar] [CrossRef]
  17. Love, P.E.; Holt, G.D.; Shen, L.Y.; Li, H.; Irani, Z. Using systems dynamics to better understand change and rework in construction project management systems. Int. J. Proj. Manag. 2002, 20, 425–436. [Google Scholar] [CrossRef]
  18. Segerstedt, A.; Olofsson, T. Supply chains in the construction industry. Supply Chain Manag. Int. J. 2010, 15, 347–353. [Google Scholar] [CrossRef]
  19. Wang, C.; Zhang, S.; Du, C.; Pan, F.; Xue, L. A Real-Time Online Structure-Safety Analysis Approach Consistent with Dynamic Construction Schedule of Underground Caverns. J. Constr. Eng. Manag. 2016, 142, 04016042. [Google Scholar] [CrossRef]
  20. Costa, A.L.; Sousa, R.L.; Einstein, H.H. Probabilistic 3D alignment optimization of underground transport infrastructure integrating GIS-based subsurface characterization. Tunn. Undergr. Space Technol. 2018, 72, 233–241. [Google Scholar] [CrossRef]
  21. Gosling, J.; Naim, M.; Towill, D. Identifying and categorizing the sources of uncertainty in construction supply chains. J. Constr. Eng. Manag. 2012, 139, 102–110. [Google Scholar] [CrossRef]
  22. Liu, J.; Lu, M. Constraint Programming Approach to Optimizing Project Schedules under Material Logistics and Crew Availability Constraints. J. Constr. Eng. Manag. 2018, 144, 04018049. [Google Scholar] [CrossRef]
  23. Pena-mora, F.; Park, M. Dynamic Planning for Fast—Tracking Building Construction Porject. J. Constr. Eng. Manag. 2001, 127, 445–457. [Google Scholar] [CrossRef]
  24. Alvanchi, A.; Lee, S.; AbouRizk, S. Dynamics of working hours in construction. J. Constr. Eng. Manag. 2011, 138, 66–77. [Google Scholar] [CrossRef]
  25. Alzraiee, H.; Zayed, T.; Moselhi, O. Dynamic planning of construction activities using hybrid simulation. Autom. Constr. 2015, 49, 176–192. [Google Scholar] [CrossRef]
  26. Park, M. Model-based dynamic resource management for construction projects. Autom. Constr. 2005, 14, 585–598. [Google Scholar] [CrossRef]
  27. Liu, C.; An, X.; Ahn, C.R.; Lee, S. Integrated evaluation of cost, schedule and emission performance on rock-filled concrete dam construction operation using discrete event simulation. In Proceedings of the 2013 Winter Simulation Conference: Simulation: Making Decisions in a Complex World, Washington, DC, USA, 8–11 December 2013; pp. 3109–3120. [Google Scholar]
  28. Pasquet, V.; Behary, N.; Perwuelz, A. Environmental impacts of chemical/ecotechnological/biotechnological hydrophilisation of polyester fabrics. J. Clean. Prod. 2014, 65, 551–560. [Google Scholar] [CrossRef]
  29. Shadram, F.; Johansson, T.D.; Lu, W.; Schade, J.; Olofsson, T. An integrated BIM-based framework for minimizing embodied energy during building design. Energy Build. 2016, 128, 592–604. [Google Scholar] [CrossRef]
  30. Wang, Y.; Feng, K.; Lu, W. An environmental assessment and optimization method for contractors. J. Clean. Prod. 2017, 142 Pt 4, 1877–1891. [Google Scholar] [CrossRef]
  31. Blom, I.; Itard, L.; Meijer, A. LCA-based environmental assessment of the use and maintenance of heating and ventilation systems in Dutch dwellings. Build. Environ. 2010, 45, 2362–2372. [Google Scholar] [CrossRef]
  32. Li, X.; Zhu, Y.; Zhang, Z. An LCA-based environmental impact assessment model for construction processes. Build. Environ. 2010, 45, 766–775. [Google Scholar] [CrossRef]
  33. Fu, F.; Sun, J.; Pasquire, C. Carbon emission assessment for steel structure based on lean construction process. J. Intell. Robot. Syst. 2015, 79, 401–416. [Google Scholar] [CrossRef]
  34. Ortiz, O.; Castells, F.; Sonnemann, G. Sustainability in the construction industry: A review of recent developments based on LCA. Constr. Build. Mater. 2009, 23, 28–39. [Google Scholar] [CrossRef]
  35. Gámez-García, D.; Gómez-Soberón, J.; Corral-Higuera, R.; Saldaña-Márquez, H.; Gómez-Soberón, M.; Arredondo-Rea, S. A Cradle to Handover Life Cycle Assessment of External Walls: Choice of Materials and Prognosis of Elements. Sustainability 2018, 10, 2748. [Google Scholar] [CrossRef]
  36. De Lassio, J.; França, J.; Espirito Santo, K.; Haddad, A. Case Study: LCA Methodology Applied to Materials Management in a Brazilian Residential Construction Site. J. Eng. 2016, 2016, 8513293. [Google Scholar] [CrossRef]
  37. Reza, B.; Sadiq, R.; Hewage, K. Emergy-based life cycle assessment (Em-LCA) of multi-unit and single-family residential buildings in Canada. Int. J. Sustain. Built Environ. 2014, 3, 207–224. [Google Scholar] [CrossRef]
  38. Feng, K.; Wang, Y.; Lu, W. Weakness of Embodied Energy Assessment on Construction: A Literature Review. In Proceedings of the International Conference on Construction and Real Estate Management, Edmonton, AB, Canada, 29 September–1 October 2016. [Google Scholar]
  39. Ding, G.K.C. The Development of a Multi-Criteria Approach for the Measurement of Sustainable Performance for Built Projects and Facilities. Ph.D. Thesis, University of Technology Sydney, Ultimo, Australia, 2004. [Google Scholar]
  40. Crawford, R.H.; Treloar, G.J. Validation of the use of Australian input-output data for building embodied energy simulation. In Proceedings of the Eighth International Building Performance Simulation Association Conference on Building Simulation: For better Building Design, Eindhoven, The Netherlands, 1–14 August 2003; pp. 235–242. [Google Scholar]
  41. Ahmed, B.M.A.; Nassar, K. Discrete-Event Activity Simulation for Predicting Occupants’ Movements in Buildings. In Proceedings of the Fourth Joint International Symposium on Information Technology in Civil Engineering, Nashville, TN, USA, 15–16 November 2003; pp. 1–10. [Google Scholar]
  42. Wang, P.W.; Abourizk, A.R.M. Large-scale simulation modeling system for industrial construction. Can. J. Civ. Eng. 2009, 36, 1517–1529. [Google Scholar] [CrossRef]
  43. Chunna, L.; Ahn, C.R.; Xuehui, A.; Sanghyun, L. Integrated evaluation of cost, schedule and emission performance on rock-filled concrete dam construction operation using discrete event simulation. In Proceedings of the 2013 Winter Simulation Conference, Washington, DC, USA, 8–11 December 2013; pp. 3109–3120. [Google Scholar]
  44. Nassar, K.; Al-Kaisy, A. Assessing sign occlusion in buildings using discrete event simulation. Autom. Constr. 2008, 17, 799–808. [Google Scholar] [CrossRef]
  45. Aziz, Z.; Qasim, R.M.; Wajdi, S. Improving productivity of road surfacing operations using value stream mapping and discrete event simulation. Constr. Innov. 2017, 17, 294–323. [Google Scholar] [CrossRef]
  46. Larsson, J.; Lu, W.; Krantz, J.; Olofsson, T. Discrete Event Simulation Analysis of Product and Process Platforms: A Bridge Construction Case Study. J. Constr. Eng. Manag. 2016, 142, 04015097. [Google Scholar] [CrossRef]
  47. Zhang, H. Simulation-based estimation of fuel consumption and emissions of asphalt paving operations. J. Comput. Civ. Eng. 2014, 29, 04014039. [Google Scholar] [CrossRef]
  48. González, V.; Echaveguren, T. Exploring the environmental modeling of road construction operations using discrete-event simulation. Autom. Constr. 2012, 24, 100–110. [Google Scholar] [CrossRef]
  49. Golzarpoor, H.; González, V.; Shahbazpour, M.; O’Sullivan, M. An input-output simulation model for assessing production and environmental waste in construction. J. Clean. Prod. 2017, 143, 1094–1104. [Google Scholar] [CrossRef]
  50. Tolk, A.; Turnitsa, C.D. Conceptual modeling of information exchange requirements based on ontological means. In Proceedings of the Conference on Winter Simulation: 40 Years! the Best Is Yet to Come, Washington, DC, USA, 9–12 December 2007; pp. 1100–1107. [Google Scholar]
  51. Mohamed, Y.; AbouRizk, S.M. A hybrid approach for developing special purpose simulation tools. Can. J. Civ. Eng. 2011, 33, 1505–1515. [Google Scholar] [CrossRef]
  52. Farzaneh, S.; Yasser, M. An ontology-driven framework for enhancing reusability of distributed simulation modeling of industrial construction processes. Can. J. Civ. Eng. 2013, 40, 917–926. [Google Scholar]
  53. El-Diraby, T.; Lima, C.; Feis, B. Domain taxonomy for construction concepts: Toward a formal ontology for construction knowledge. J. Comput. Civ. Eng. 2005, 19, 394–406. [Google Scholar] [CrossRef]
  54. El-Diraby, T.E.; Osman, H. A domain ontology for construction concepts in urban infrastructure products. Autom. Constr. 2011, 20, 1120–1132. [Google Scholar] [CrossRef]
  55. Fischer, M.; Lacasse, M.A.; Vanier, D.J.; Aalami, F.; Kuhne, C.; Ripberger, A. Cost-loaded production model for planning and control cost-loaded production model. In Durability of Building Materials and Components 8; Lacasse, M.A., Vanier, D.J., Eds.; NRC Press: Ottawa, ON, Canada, 1999. [Google Scholar]
  56. Cheng, M.Y.; Tran, D.H. Integrating Chaotic Initialized Opposition Multiple-Objective Differential Evolution and Stochastic Simulation to Optimize Ready-Mixed Concrete Truck Dispatch Schedule. J. Manag. Eng. 2015, 32, 04015034. [Google Scholar] [CrossRef]
  57. Banks, J. Handbook of Simulation: Principles, Methodology, Advances, Applications, and Practice; John Wiley & Sons: Hoboken, NJ, USA, 1998. [Google Scholar]
  58. International Organization for Standardization. Environmental Management: Life Cycle Assessment: Principles and Framework; ISO: Geneva, Switzerland, 1997; Volume 14040. [Google Scholar]
  59. Sustainability of Construction Works–Environmental Product Declarations–Core Rules for the Product Category of Construction Products; EN 15804:2012+A1:2013; European Committee for Standardization: Brussels, Belgium, 2013.
  60. U.S. Environmental Protection Agency. Evaluation of Power Systems Research (PSR) Nonroad Population Data Base. Available online: https://www3.epa.gov/otaq/models/nonrdmdl/nrtask1a.pdf (accessed on 30 December 2017).
  61. U.S. Environmental Protection Agency. Median Life, Annual Activity, and Load Factor Values for Nonroad Engine Emissions Modeling; U.S. Environmental Protection Agency: Washington, DC, USA, 2010.
  62. Guinée, J.B. Handbook on life cycle assessment operational guide to the ISO standards. Int. J. Life Cycle Assess. 2002, 7, 311. [Google Scholar] [CrossRef]
  63. IPCC. IPCC Fifth Assessment Report; IPCC: Geneva, Switzerland, 2013. [Google Scholar]
  64. De Wit, S.; Augenbroe, G. Analysis of uncertainty in building design evaluations and its implications. Energy Build. 2002, 34, 951–958. [Google Scholar] [CrossRef]
  65. Dehghanimohammadabadi, M.; Keyser, T.K. Intelligent simulation: Integration of SIMIO and MATLAB to deploy decision support systems to simulation environment. Simul. Model. Pract. Theory 2017, 71, 45–60. [Google Scholar] [CrossRef]
  66. Tam, V.W.; Shen, L.; Tam, C.M. Assessing the levels of material wastage affected by sub-contracting relationships and projects types with their correlations. Build. Environ. 2007, 42, 1471–1477. [Google Scholar] [CrossRef]
  67. Lorscheid, I.; Heine, B.-O.; Meyer, M. Opening the ‘black box’ of simulations: Increased transparency and effective communication through the systematic design of experiments. Comput. Math. Organ. Theory 2012, 18, 22–62. [Google Scholar] [CrossRef]
  68. NDRC. Provincial Greenhouse Gas Inventory Guidelines; NDRC: Beijing, China, 2011. (In Chinese)
  69. Yang, J. Life Cycle Assessment and Application; China Meteorological Press: Beijing, China, 2002. (In Chinese)
  70. Yang, X. Quantitative Assessment of Environmental Impact on Construction during Planning and Designing Phases. Master’s Thesis, Tsinghua University, Beijing, China, 2003. [Google Scholar]
  71. Zhou, Y.X.; Su, Y. Assessment of building energy consumption and environmental impact based on life cycle theory. Constr. Manag. Mod. 2009, 23, 109–112. (In Chinese) [Google Scholar]
  72. Gong, Z. A Quantitative Method to the Assessment of the Life Cycle Embodied Environmental Profile of Building Materials; Tsinghua University: Beijing, China, 2004. (In Chinese) [Google Scholar]
  73. Gong, Z.; Zhang, Z.H. Quantitative assessment of the embodied environmental profile of building materials. J. Tsinghua Univ. (Sci. Technol.) 2004, 44, 1209–1213. (In Chinese) [Google Scholar]
  74. Seppälä, J.; Koskela, S.; Melanen, M.; Palperi, M. The Finnish metals industry and the environment. Resour. Conserv. Recycl. 2002, 35, 61–76. [Google Scholar] [CrossRef]
  75. Yan, P.; Yang, J. Quantitative assessment of the embodied environmental impact of wood products. J. Tsinghua Univ. (Sci. Technol.) 2008, 48, 15–18. (In Chinese) [Google Scholar]
  76. Lee, J.-S.; Filatova, T.; Ligmann-Zielinska, A.; Hassani-Mahmooei, B.; Stonedahl, F.; Lorscheid, I.; Voinov, A.; Polhill, J.G.; Sun, Z.; Parker, D.C. The complexities of agent-based modeling output analysis. J. Artif. Soc. Soc. Simul. 2015, 18, 4. [Google Scholar] [CrossRef]
  77. Krantz, J.; Larsson, J.; Lu, W.; Olofsson, T. Assessing embodied energy and greenhouse gas emissions in infrastructure projects. Buildings 2015, 5, 1156–1170. [Google Scholar] [CrossRef]
  78. Lasvaux, S.; Habert, G.; Peuportier, B.; Chevalier, J. Comparison of generic and product-specific Life Cycle Assessment databases: Application to construction materials used in building LCA studies. Int. J. Life Cycle Assess. 2015, 20, 1473–1490. [Google Scholar] [CrossRef]
  79. Häfliger, I.-F.; John, V.; Passer, A.; Lasvaux, S.; Hoxha, E.; Saade, M.R.M.; Habert, G. Buildings environmental impacts’ sensitivity related to LCA modelling choices of construction materials. J. Clean. Prod. 2017, 156, 805–816. [Google Scholar] [CrossRef]
  80. Hoxha, E.; Habert, G.; Lasvaux, S.; Chevalier, J.; Le Roy, R. Influence of construction material uncertainties on residential building LCA reliability. J. Clean. Prod. 2017, 144, 33–47. [Google Scholar] [CrossRef]
  81. Kanan, R.; Elhassan, O.; Bensalem, R. An IoT-based autonomous system for workers’ safety in construction sites with real-time alarming, monitoring, and positioning strategies. Autom. Constr. 2018, 88, 73–86. [Google Scholar] [CrossRef]
Figure 1. The overall framework of the discrete event simulation and process-based life cycle assessment (DES-pLCA) method. LCI, life cycle impact; LCIA, life cycle impact assessment; CARS, Component, Action, Resource, and Sequencing.
Sustainability 10 03868 g001
Figure 2. The DES model’s production for the DES-pLCA method. (Modified from Tolk and Turnitsa [50] and Mohamed and AbouRizk [51]).
Sustainability 10 03868 g002
Figure 3. The CARS method for construction logic description in the conceptual model.
Sustainability 10 03868 g003
Figure 4. DES-pLCA function integration and decision support.
Sustainability 10 03868 g004
Figure 5. Overview of the DES-pLCA prototype. API, application program interface.
Sustainability 10 03868 g005
Figure 6. The construction process network of a typical floor (process ID refers to Table 2).
Sustainability 10 03868 g006
Figure 7. The environmental impact frequency distribution of the base scenario (500 runs).
Sustainability 10 03868 g007
Figure 8. The contribution of environmental impact sources and variations to construction: (a) equipment and (b) materials.
Sustainability 10 03868 g008
Figure 9. The real-time environmental impacts of equipment (a) per work unit’s impacts and per time unit’s work; (b) accumulated GWP impacts.
Sustainability 10 03868 g009aSustainability 10 03868 g009b
Figure 10. A comparison of the individual scenarios on (a) GWP (global warming potential); (b) AP (acidification potential); (c) EP (eutrophication); (d) POCP (photochemical ozone creation potential); (e) ADP (abiotic depletion potential); (f) HTP (human toxicity potential).
Sustainability 10 03868 g010aSustainability 10 03868 g010b
Figure 11. The performance fluctuation in factors with the DES-pLCA factorial experiment.
Sustainability 10 03868 g011
Table 1. Relationships among concepts in the DES-pLCA simulation modelling.
Real WorldConceptual WorldSimulated World
Material processing, offsite transportation, onsite constructionUnit processServer, process
Building componentsProductEntity
Auxiliary materials, construction equipmentResource Resource
Table 2. The conceptual model’s real world representation.
IDUnit ProcessProductResourcesQuantity
1S-offsite transportationUnprocessed steel barDiesel trailer-25 t3
2S-straightening (HPB235)Processing steel barElectric bar straightener3
3S-bending (HRB335/HRB400)Processing steel barElectric steel bar bender8
4S-cuttingProcessing steel barElectric steel bar cutter9
5S-threadingProcessing steel barElectric die head threading machine5
6S-onsite transportationProcessed steel barElectric crane tower/lift1/1
7S-installationSteel bar in componentIron wire3852.34 kg
8F-offsite transportationUnprocessed plywoodPlywood, 12 mm;
Diesel truck, 15 t
64.4 t
1
9F-cuttingProcessing plywoodElectric cutting machine4
10F-onsite transportationProcessed plywoodElectric crane tower/lift1/1
11F-installationAssemble formwork systemSteel tube
Joint
Bolt
Iron wire
Batten
1695.57 kg
6758.46 kg
4959.22 kg
10,646.57 kg
149.46 m3
12C-offsite transportationPremixed concrete Mixer truck, 7 m35
13C-pumpingOnsite concreteElectric concrete pump, 80 kW4
14C-vibrationOnsite concreteElectric vibrator, 1.5 kW20
15C-curingConcrete componentWater
PVC
6842.79 m3
514.32 kg
Note: C-, S-, and F- stand for concrete, steel, and formwork, respectively.
Table 3. Uncertainties and dynamic environment factors.
IndexNameInfluenced ProcessDetails
D1Traffic conditionsC-offsite transportationTraffic busy: truck speed = 25 km/h, 0.2961 L/km
Traffic idle: truck speed = 30 km/h, 0.2468 L/km
D2Height of working siteS- and F-onsite transportationHeight = 4 × (complete floor) + 25
U1WP of steel vertical transportationS-onsite transportationCrane: 1.5/(2 × Height/45 + 1.5 + 1 + 2.5) × Triangular (0.83, 1, 1.17); Lift: 4/(2 × Height/60 + 6) × Triangular (0.83, 1, 1.17)
U2WP of steel installationS-installation0.045 × Triangular (0.83, 1, 1.17)
U3WP of formwork vertical transportationF-onsite transportation1.5/(2 × Height/45 + 1.5 + 1 + 2.5) × Triangular (0.83, 1, 1.17); Lift: 4/(2 × Height/60 + 6) × Triangular (0.83, 1, 1.17)
U4WP of formwork installationF-installation0.36 × Triangular (0.83, 1, 1.17)
U5WP of concrete pumpingC-pumpingTriangular (0.83, 1, 1.17) × 104/(7.5 + Height)
U6WP of concrete vibrationC-vibration5 × Triangular (0.83, 1, 1.17)
U7WR of steel installationS-installationGaussian (7.7%, 0.0385) [66]
U8WR of formwork installationF-installationGaussian (20%, 0.1) [66]
Note: D and U denotes whether the factor is Dynamic or Uncertain; WP and WR stands for Working Productivity and material Wastage Rate, respectively.
Table 4. The data sources for the assessment.
Impact SourcesUnitImpact Equivalents a by CML 2002Reference
ElectricitykWhGWP: 1.096; AP: 0.0135; EP: 6.51 × 10⁻⁴;
POCP: 4.86 × 10⁻⁴; ADP: 0.176; HTP: 8.79 × 10⁻³
[68] b; [69,70] c
DieselkgGWP: 0.818; AP: 0.0542; EP: 3.27 × 10⁻³;
POCP: 2.21 × 10⁻³; ADP: 2.195; HTP: 3.71 × 10⁻³
[69,71] c
Waterm3GWP: 0.213; AP: 2.70 × 10⁻³; EP: 1.30 × 10⁻⁴;
POCP: 8.20 × 10⁻⁵; ADP: 0; HTP: 1.92 × 10⁻⁴
[70] c
PVCkgGWP: 0.247; AP: 5.13 × 10⁻³; EP: 3.28 × 10⁻⁴;
POCP: 1.91 × 10⁻⁴; ADP: 1.08 × 10⁻⁵; HTP: 4.74 × 10⁻³
[72] c
Iron wirekgGWP: 7.442; AP: 0.0661; EP: 4.23 × 10⁻³;
POCP: 7.43 × 10⁻³; ADP: 1.56 × 10⁻³; HTP: 0.1056
[73] c
Annealed iron wire kgGWP: 6.362; AP: 9.9 × 10⁻³; EP: 1.45 × 10⁻³
POCP: 6.03 × 10⁻³; ADP: 1.64 × 10⁻³; HTP: 0.1075
[73] c; [74]
PlywoodkgGWP: 1.049; AP: 0.0128; EP: 7.14 × 10⁻⁴;
POCP: 4.73 × 10⁻⁴; ADP: 1.80 × 10⁻⁵; HTP: 0.0174
[75] c
Steel tubekgGWP: 3.589; AP: 0.0668; EP: 4.27 × 10⁻³;
POCP: 6.39 × 10⁻³; ADP: 1.57 × 10⁻³; HTP: 0.107
[73] c
JointkgGWP: 3.589; AP: 0.0668; EP: 4.27 × 10⁻³;
POCP: 6.39 × 10⁻³; ADP: 1.57 × 10⁻³; HTP: 0.107
[73] c
BoltkgGWP: 3.589; AP: 0.0668; EP: 4.27 × 10⁻³;
POCP: 6.39 × 10⁻³; ADP: 1.57 × 10⁻³; HTP: 0.107
[73] c
BattenkgGWP: 1.049; AP: 0.0128; EP: 7.14 × 10⁻⁴;
POCP: 4.73 × 10⁻⁴; ADP: 1.80 × 10⁻⁵; HTP: 0.0174
[75] c
Note: a all values are calculated by emissions multiplied by the characterization factors as in Equation (4); b represents the Northeast China level; c represents the average level for China. GWP, global warming potential; AP, acidification potential; EP, eutrophication; POCP, photochemical ozone creation potential; ADP, abiotic depletion potential; HTP, human toxicity potential.
Table 5. The feasible scenarios for the case study.
Scenario (SC.)Base and Feasible ScenariosDetail
baseC-supplier1 (30 km) with Mixer truck (7 m3)180 hp
Steel trailer (25 t)400 hp
Concrete pump (80 kW)1 × 10⁴/(7.5 + Height) m3/h
Crane ST60/1541/4/8 kW, 45 m/min, 1.5 tonnes
Lift SCD200/200V56 kW, 60 m/min, 4 tonnes
Crane has priority
Concrete vibrator (30 mm) 1.5 kW, 5 m3/h
Iron wire ϕ 0.7 mm3.02 kg/km
Concrete supplier
2C-supplier1 (30 km) with Mixer truck (6 m3)130 hp
3C-supplier1 (30 km) with Mixer truck (5 m3)103 hp
4C-supplier2 (18.5 km) with Mixer truck (7 m3)180 hp
5C-supplier2 (18.5 km) with Mixer truck (6 m3)130 hp
6C-supplier2 (18.5 km) with Mixer truck (5 m3)103 hp
Steel transport vehicle
7Steel truck (6 t)160 hp
Type of concrete pump
8Concrete pump (60 kW)0.8 × 10⁴/(10 + Height) m3/h
9Concrete pump (45 kW)0.8 × 10⁴/(20 + Height) m3/h
10Concrete pump (30 kW)0.4 × 10⁴/(20 + Height) m3/h
Type of crane tower
11Crane XGT8039-2590/26.1/15 kW, 37.6 m/min, 8 tonnes
12Crane XGT8040-25110/27/15 kW, 48.4 m/min, 7.6 tonnes
Type of construction lift
13Lift SC200-200E66 kW, 36 m/min, 4 tonnes
14Lift SC200-200P60 kW, 23 m/min, 4 tonnes
Vertical transport strategy
15Lift has priority
Type of vibrator
16Vibrator 50 mm2.2 kW, 14 m3/h
17Vibrator 80 mm3.0 kW, 35 m3/h
Type of iron wire
18Annealed iron wire ϕ 1.2 mm8.88 kg/km
Table 6. The best scenario for different environmental indicators.
IndicatorBest Individual Scenario on IndictorCombined Scenarios’ Performance on Indicator
Concrete SupplierSteel Transport VehicleConcrete Pump TypeCrane Tower TypeLift TypeVertical Transport StrategyVibrator TypeIron Wire Type
GWP6base912base1516base305,604 + 14,258/−17,118 (−2.5%)
AP671011base1516183910 + 121/−135 (−21.7%)
EP671011, 12base, 131516base277 + 10/−10 (−8.2%)
POCP671011, 12base1516base329 + 14/−14 (−4.8%)
ADP67base11base1517base41,045 + 1056/−811 (−32.5%)
HTP6base1012base1516base5249 + 233/−221 (−0.9%)
Note: The scenario no. represents the supply chain and feasible onsite scenario in Table 5; the value in “()” is the reduction in impacts compared with the base scenario at the average level for 50 runs.
Table 7. The importance ranking of the uncertainty factors.
RankIndexUncertainty Factor
1U8material wastage rate of formwork installation
2U5work productivity of concrete pumping
3U1work productivity of steel vertical transportation
4U6work productivity of concrete vibration
5U3work productivity of formwork vertical transportation
6U7material wastage rate of steel installation
7U4work productivity of formwork installation
8U2work productivity of steel installation

