Analyzing the Level of Accessibility of Public Urban Green Spaces to Different Socially Vulnerable Groups of People

School of Sociology and Political Science, Shanghai University, 99, Shangda Road, Shanghai 200444, China
*
Author to whom correspondence should be addressed.
Sustainability 2018, 10(11), 3917; https://0-doi-org.brum.beds.ac.uk/10.3390/su10113917
Submission received: 26 August 2018
/
Revised: 24 October 2018
/
Accepted: 25 October 2018
/
Published: 28 October 2018
(This article belongs to the Special Issue Sustainable Smart Cities and Smart Villages Research: Rethinking Security, Safety, Well-being and Happiness)
Abstract
:This study estimates the factors affecting socially vulnerable groups’ demand for and accessibility levels to green public spaces in Dhaka City, Bangladesh. Dhaka is a high-density city with one of the lowest levels of green space per capita in the world. Dhaka has just 8.5% of tree-covered lands, while an ideal city requires at least 20% of green space. Urban public green space provides a healthy environment to city dwellers as well as ecological soundness. This study aims to examine the effects of population density and size of a community area (Thana) on the social demand for and accessibility to green parks. To determine the socially vulnerable group demand index, this study used demographic data from the National Population and Housing Census 2011 conducted by the Bangladesh Bureau of Statistics. This study used geographical data extracted from Google Earth Pro to measure accessibility levels, and additionally analyzed geographical data with ArcGIS 10.0 and Google Earth Pro. We drew radius circles using Free Map Tools to measure time-distance weighted scores from community areas to urban green spaces. The results show that the large population size of socially vulnerable groups creates very high demand at the score of 0.61 for urban green public parks and small-sized, high-density community areas generate very good accessibility at 2.01% to green public spaces. These findings are highly useful to policymakers, urban planners, landscape engineers, and city governments to make a compact city sustainable, inclusive, and resilient. Moreover, the notion of a “smart city” might be a smart solution in order to manage Dhaka Megacity sustainably in this modern technological age.
1. Introduction
Urbanization is now one of the global development agendas. Based on the United Nations Sustainable Development Goal 11 (SDG 11), which aims to make urban communities and human settlements comprehensive, protected, strong, and sustainable, the United Nations extended the SDG Agenda by adopting the New Urban Agenda in 2016 [1]. Urban sustainability and inclusiveness depend on different criteria, such as planning, equitable spatial distribution, ecological services, urban management, green space quality, and socioeconomic facilities. The societal advantages provided by urban green spaces (UGS) to city inhabitants are indispensable to maintain and increment urban residents’ personal satisfaction [2,3,4]. Public urban green spaces (PUGS) are essential for mitigating high surface temperatures in summer [2,5,6] and are also indispensable for air pollution removal and noise reduction [7,8]. The temperature contrast between urban and green regions is large in summer and small in winter. Furthermore, in summer, the contrast is bigger during the day than during the night, while in winter the reverse is true [9]. There have been the current economic value of 17 ecosystem services for 16 biomes, which are contributing to human welfare, both directly and indirectly [10].
Open UGS frame diverse sorts of green spaces, in particular in degrees of naturalness, kinds of vegetation, recreational foundations or social uses they can offer [11,12]. Public urban green space (PUGS), e.g., urban open parks, are typically the most important components of urban green frameworks [11,13]. They are basically overseen by government organizations and accommodated open utilize, and are focal components to advance living quality in urban areas attributable to their commitment to a decent urban condition, the experience of nature [11,14] and to expanding the interest for nature-based recreation facilities [11,15]. This study deals with city green public parks as green spaces but not city forested areas in cities and agriculture. We here state the characteristics of public parks. Previous research has expressed the various contributions of open UGS, which is a type of land cover that incorporates open parks and other (open or private) vegetated territories, to human wellbeing and prosperity [4,16,17,18,19,20,21,22]. These green spaces give biological community benefits that help human welfare in numerous ways [23,24,25,26].
Introduction to green spaces facilitates physical exercise and upgrades emotional wellness and the mental condition of elderly individuals [27,28,29]. The financial status of different groups has been examined to investigate the social value of green spaces; it was discovered that the high-income, white, and highly educated bunches living in the top networks had more access to green spaces [30,31], while socially vulnerable groups, such as working class, ethnic minority, and low-income groups [30] had less access to green space. The earlier literature has discussed the spatial equity layout of urban green public parks. More consideration is given to the value of parks’ openness and free market activity [31] coordinating between various networks for vulnerable groups, e.g., the elderly in China. A few studies have asserted that the objective is to have a similar openness of minority groups and non-minority bunches in the network and even to offer a larger amount of availability [31] for low-income inhabitants in spatial dispersion in Western nations [32].
Green public spaces foster a sense of freedom and provide opportunities for leisure, political and social activities [33]. Additionally, green spaces reduce morbidity and improve physical health [4,34,35,36], increase social cohesion [4,37,38] and maintain biodiversity [39]. Human wellbeing could certainly be correlated to the measure, quality, and equity of green spaces. Likewise, wellbeing requires the sustainable and fair accessibility of these public spaces to different social classes. The accessibility approach has been broadly recorded within the planning literature and incorporates a long verifiable record [40,41,42,43,44]. Accessibility is characterized as the degree to which land-use and transport frameworks empower bunches of individuals to exercise or reach goals from transport modes [45].
Land use requires connecting green spaces (parks) among built-up systems in urban planning. The accessibility approach recognizes that the nonattendance or disappointment of any accessibility component is sufficient to square what individuals require [40,46]. For example, public services will be open for all, but if a person has restricted access for cultural or religious reasons, they will not be able to access those public services [46]. The same can also apply to the context of green public space accessibility measurement. This study measures the accessibility of urban green public parks to socially vulnerable groups in terms of visit frequency and quality. Furthermore, this work assesses the accessibility level of city parks in Dhaka, Bangladesh. Accessibility can be assessed in terms of the quality of the park, total community and park area size, population density, and park management.
A previous study investigated the social benefits of UGS, and incorporated recreational opportunities, stylish satisfactions, changes in mental wellbeing and physical health, enhancing social ties, and giving instructive openings [47]. Urban trees emphatically influence quality of life. However, the spatially unjust dispersion of urban trees in connection to race and ethnicity is another example of urban natural disparity that deserves more prominent thought in light of modern and energetic property relations inside capitalist social orders [48].
There are 54 green public parks and open spaces in Dhaka, 46 of which are owned by Dhaka City Corporation (DCC) [49,50]. On average, just 14.5% is open space (including playgrounds, parks, footpaths, water bodies, forestry, etc.), while 25% of open green space is a sustainable portion of the quality life of urban dwellers [50]. Usually considered the least are the numbers of play areas, parks, other open spaces and swimming pools per capita [50]. A great number of green parks are inhabited by destitute individuals, vendors, and a few have been changed over into brief markets, transport stops, ghettos, etc. [49]. According to a DCC study conducted in 2006, Dhaka has 8.5% tree coverage, while an ideal city needs at least 20% green space [45]. Additionally, local governments do not have sufficient logistics to manage public green spaces efficiently [48].
The criteria of accessibility of a good public open space include [51]: (1) Linkages; (2) walkability; (3) connectedness; and (4) convenience. Park quality is related with more elevated amounts of and by large physical exercises [52]. A previous study recognized that 45% of members spent around 2.5 h every week on park-based exercises. Moreover, more prominent park accessibility was related with a 2.97-fold increase in the chance of utilizing parks [53]. The large-scale open spaces used by the middle class for recreational purposes are often found to be associated with antisocial occupancy, thereby resulting in dehumanized areas [54,55]. The lack of open spaces and fair spatial distribution of Dhaka City parks are making them less accessible [54].
The study measured the demand and accessibility level of five selected socially vulnerable groups (women, illiterate, and ethnic-religious minority, unemployed people). Vulnerability is usually treated similarly to notions of need, risk, susceptibility to harm or neglect, or lacking durability or capability [56]. Relative vulnerability among people (by age, sex, and race/ethnicity), within interpersonal relationships (by family structure, marital status, and social networks), and by access to neighborhood resources (such as schools, jobs, income, and housing) [57]. We administered here the definition and reasons behind the selection of the target groups. Ethnographically different and non-Bengali people are defined as the ethnic minority in Bangladesh and their portion is very small compared to the majority (Muslims) [55]. They particularly live in Hilly Chittagong and a very few numbers of them live in Dhaka and other cities. In Bangladesh, literally government, constitution, and laws support the freedom of religion; however, attacks, discrimination against religious and ethnic minorities continued forever [55] Religious minorities (Hindu, Christian, and Buddhist) are, sometimes, at the bottom line and marginalized both in urban and rural society. Urban green space can promote them to inclusivity and resilient social cohesion. Dhaka ranked the seventh worst megacity in world for women [58] as air and water pollution, and water scarcity affect women’s health and income status. The World Bank recommended to put Bangladesh on a greener growth trajectory to get rid of these challenges. Both employed and non-employed women who have been suffering from obesity and diabetes selected to study. Dhaka is Asia’s most stressful city. Dhaka’s regretful performance includes density, traffic congestion, perception of security, family purchase power, underemployment, and physical and mental health. Unemployed workers in the study refer to the workers who are working part-time, but intend to work full-time jobs [59]. Green space activities can mitigate the stresses.
Socially vulnerable groups (women, children, elderly and low-income people, the disabled, ethnic minorities, and mental patients) have less access to green public spaces in Dhaka due to the lack of public consciousness, adequate initiatives, and most of all, insensitivity of green space and wetland design to their needs [54,60]. Socially defenseless groups include youngsters, women, elderly individuals, ethnic minorities, the impaired, patients suffering from mental illness, the unemployed, laid-off specialists, dislodged populaces, asylum seekers, laborers and casual laborers, and hindered people as for work relations, for example, off-staff individuals and prior resigned on-staff individuals [31,52,61,62,63]. Helpless individuals in the public eye have more requirements, including better activity and all the more monetarily, and more advantageous-to-use facilities [28]. Most of the public parks in Dhaka (except a few large-scale parks) face enormous socioeconomic, environmental and management obstacles, let alone special arrangements for vulnerable groups.
This study predominantly aims to measure the factors and level of accessibility of public UGS (parks) to different vulnerable social groups. Earlier research proposed that, in light of an investigation of various examinations contrasting diverse sorts of green space indicators, aggregate beneficial indicators are more reliably connected to human wellbeing than community area closeness ones [64]. Based on previously identified problems, we developed the following research questions:
- How does the socially vulnerable group population size affect the demand for urban green public parks?
- What is the effect of community area size on the accessibility of green public parks?
- Does community area population density influence accessibility?
In this study, we investigated whether the size and density of the population of a certain community area affected the accessibility of public green spaces. A “community area” denotes a sub-district (Thana, local term) in the Dhaka City Corporation, while “Dhaka City” or “Dhaka” indicates the Dhaka City Corporation area in Bangladesh.
2. Methods and Materials
2.1. Methodological Design Flow
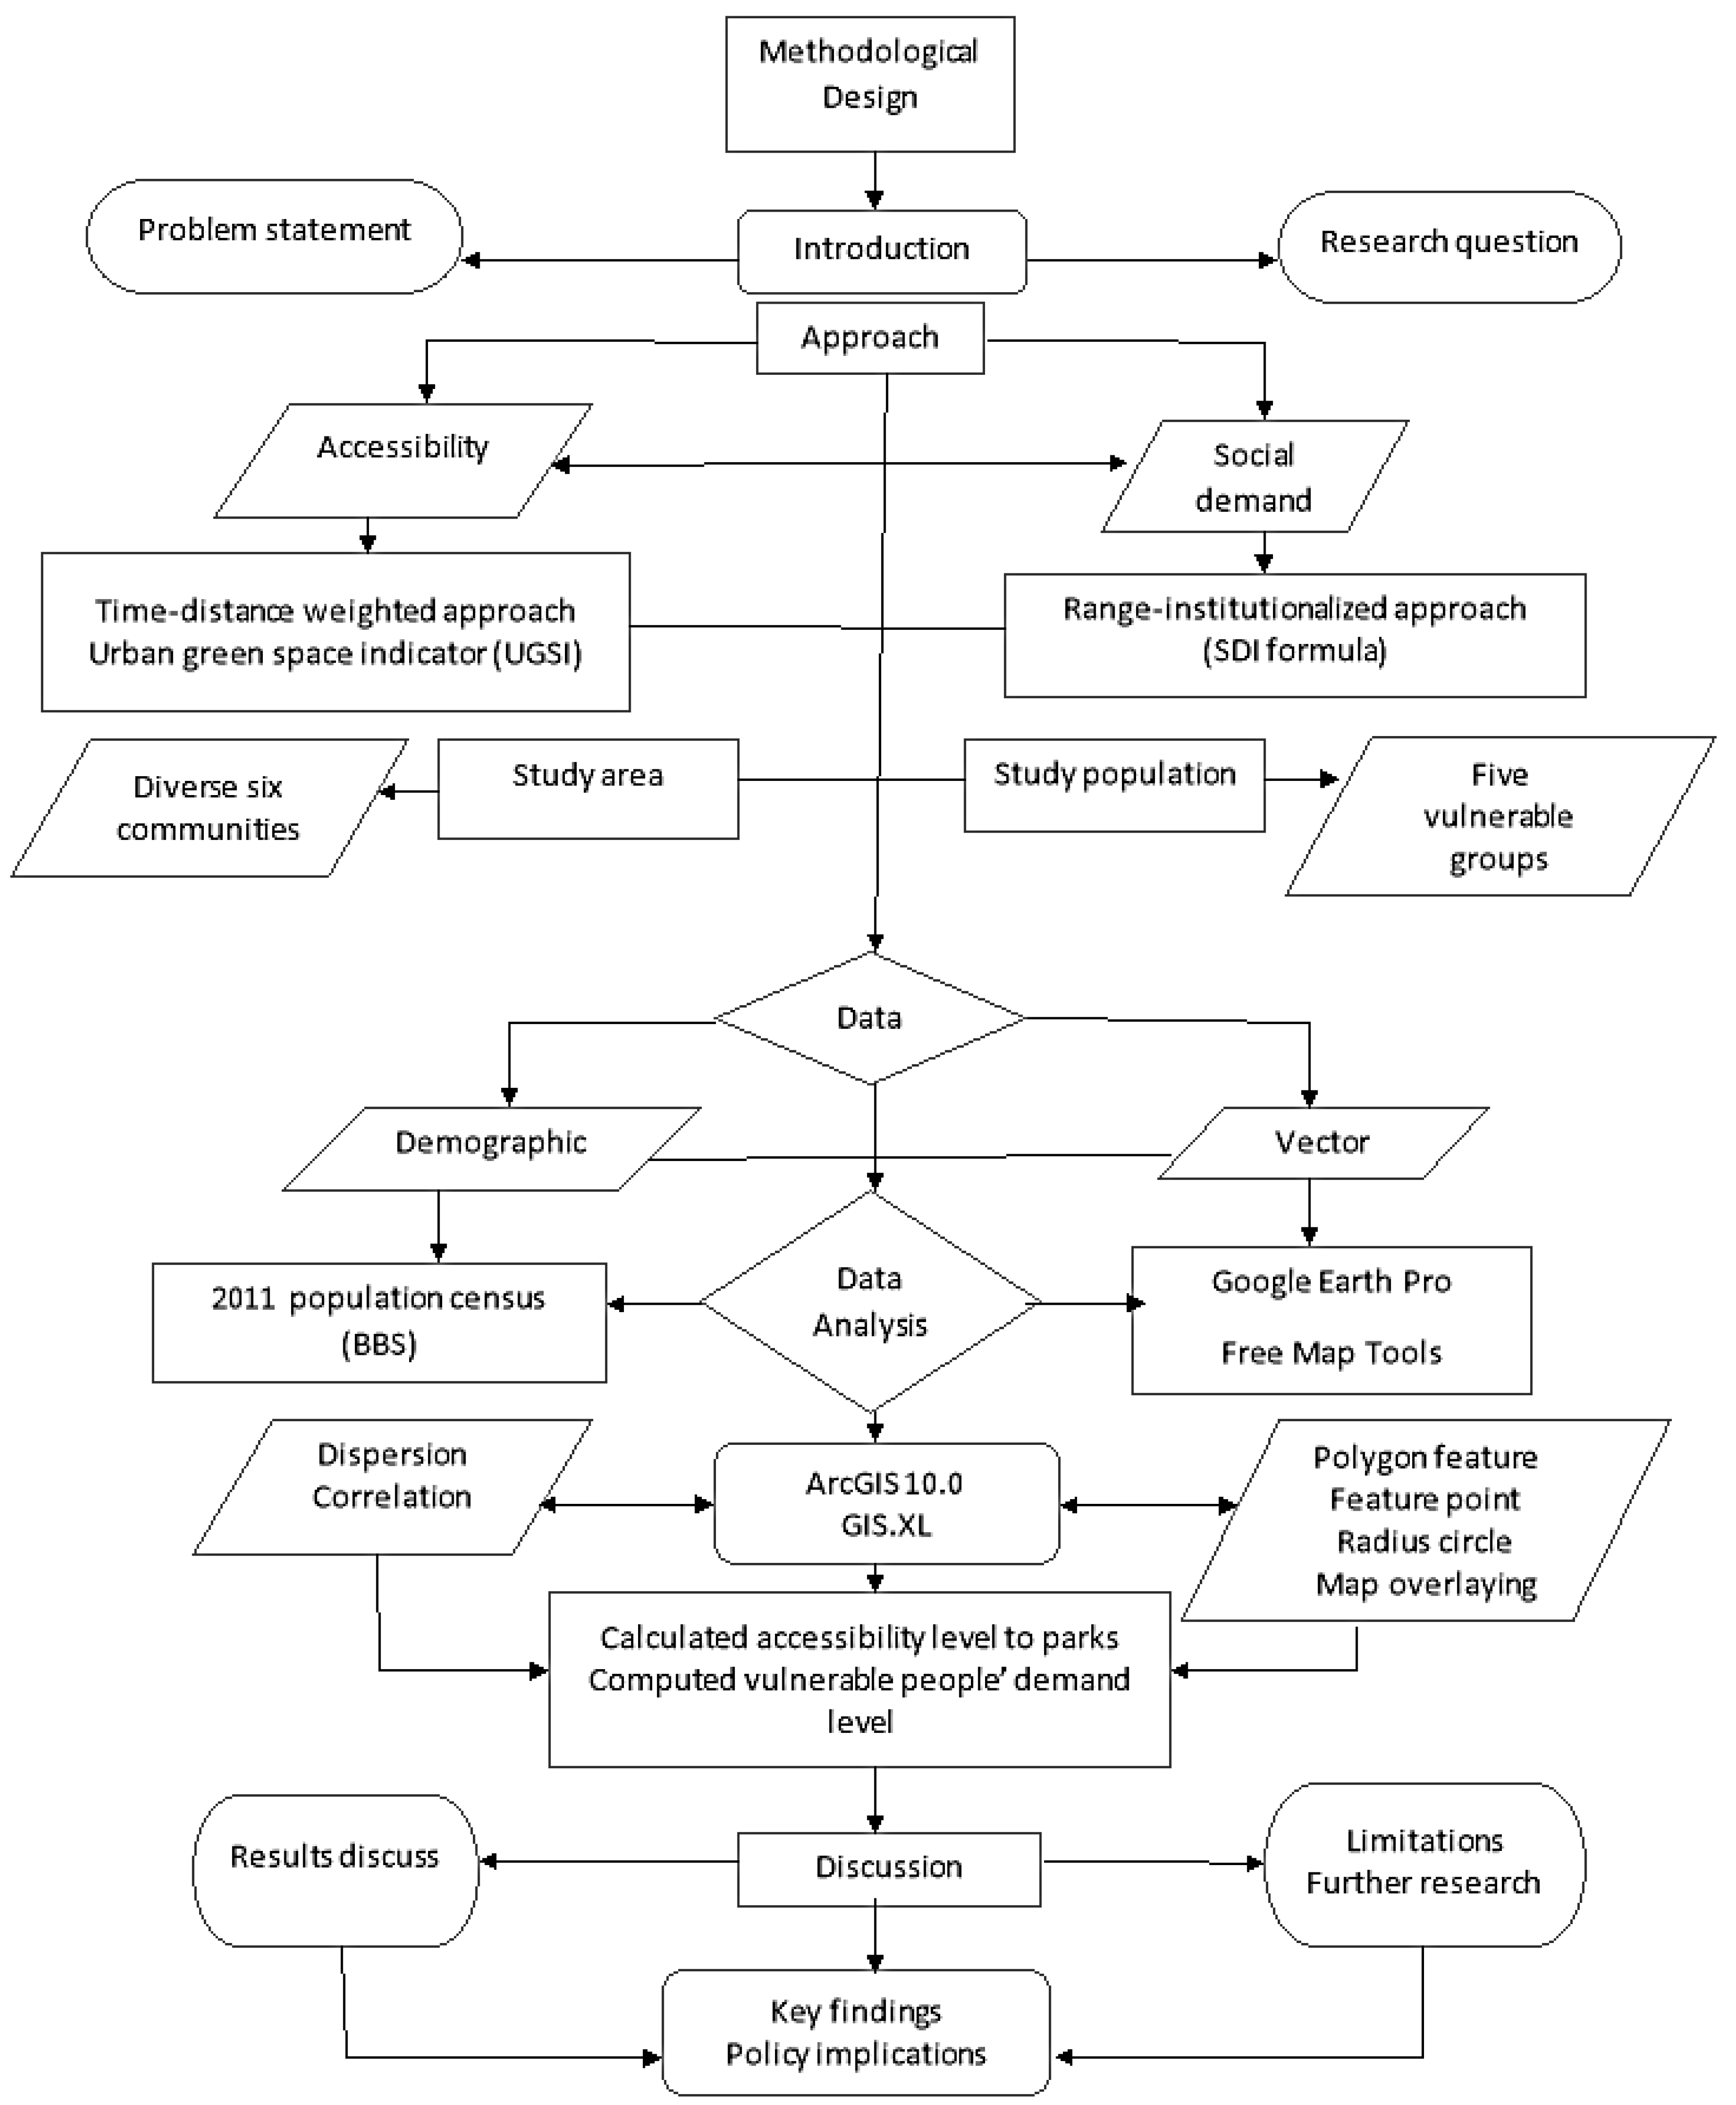
Figure 1 shows the methodological design flow of the study. Firstly, the chart displays the methodological approaches which include: (1) Time–distance weighted technique; (2) urban green space indicator (UGSI); and (3) range-institutionalized approach (social demand index (SDI) formula). These three techniques express accessibility level and SDI measurement methods. Secondly, Figure 1 displays the profile of study area and population including six diverse communities and five vulnerable people’s group. Data is categorized by two types: Demographic and vector data shown on the chart at third steps. Data collected from 2011 population census conducted by Bangladesh Bureau of Statistics (BBS) and vector data from Google Earth pro. Finally, data analysis techniques and tools are shown on the flow chart and it has concluded in the findings steps.
2.2. Methodological Approach
This study employed a multi-approach strategy to quantify the accessibility of green parks. The time-distance weighted technique portrays accessibility by estimating the time or distance that is required for dwellers to walk to open parks [28]. It is typically directed to dissect accessibility [65], the radiation impact and administration extent of urban open parks [23,66]. The study used the time-weighted distance method to assess the accessibility of the nearest parks by walking from specific circled residential areas in the central urban zones of Dhaka. The method is based on raster data converted into vector data by the ArcGIS 10.0 Software Package. The accessibility of urban green open parks, which is a critical subject related to urban natural space, is characterized as the relative or extreme level of trouble that people encounter when utilizing a specific transportation device to defeat space resistance from urban open parks from a given place [24].
Accessibility is considered to be most favorable when the travel time required to reach a park is less than three minutes on foot (walking speed between 1.1 and 1.3 m/s) [28]. When the time spent traveling to a park was more than 30 min, the park was regarded as having poor accessibility (Figure 1) [31].
This study applied a socially vulnerable group demand index (hereinafter SDI) to calculate the accessibility level of various green parks in Dhaka to vulnerable social classes. Vulnerable groups were defined as social groups that possess minimal assets and thus experience high relative dangers of hardship and untimely mortality [67]. Vulnerability also refers to a person’s social status and living standard other than physical conditions. This study deals with particular social groups such as women, the illiterate, and unemployed religious and ethnic minorities. We measured the accessibility of public parks to these vulnerable groups and which community areas provided accessibility and to what extent. The idea of a socially vulnerable groups’ demand index [25] was considered and mirrors the distinctions in the spatial appropriation of defenseless groups and impartially shows the potential prerequisites of helpless groups for sharing urban ecological space. The index measures the potential demand of socially helpless groups that enjoy parks at the community level [30], and indicates how much green space is available in this community unit.
2.3. Accessibility Level Measurement 1
According to the survey, accessibility was characterized as being the most ideal when the time required to reach a green park was less than three minutes by walking (walking speed was approximated at between 1.1 and 1.3 m/s), while a travel time of between three and eight minutes was viewed as being comparatively ideal (“Raster Calculator”) [31]. Normative data indicates that non-patient community-dwelling men aged 60 to 69 years walk at an average of 1.34 m/s; women walk 1.24 m/s. By the time individuals reach 80 to 99 years, average gait speed has slowed to 0.97 m/s for men and to 0.94 m/s for women [68]. The author also showed that men aged 30–49 years walk at 143 m/s and women walk at 134–139 m/s. The vulnerable people of this study could not be limited within age frame. In addition, walking speed depends on age, height, road, load, terrain, etc., and we apply an average walking speed in the study, as a different walk speed could conveniently not be calculated. It is suggested that it can be further researched to get specific outcomes. This study analyzed the accessibility level of Dhaka based on road connectivity and open green space patches by applying two unique measurements: (1) In terms of distance, by expanding the radius of the surrounding region around green spaces from 0 to 800 m, including four categories (0–100, 100–200, 200–500, and 500–800 m); and (2) in terms of walking time, by accepting a normal walking speed between 1.1 and 1.3 m/s. Dhaka is a compact city, and accordingly the distance of 0–100 m with a two minute walking time was regarded to represent very good accessibility.
2.4. Accessibility Level Measurement 2
Different indicators have been developed for measuring the level of accessibility of UGS patches. The UGSI was developed to assess green space accessibility in the context of improving health ailment, fortify approach intercession and help evaluate general wellbeing impacts [18,69,70,71]. In this study, we used an accessibility indicator (UGSI) of urban green space proposed by the WHO [21,71,72,73]. UGSI is an approach to measure the accessibility of green spaces based on the total population of a city and the accessible population numbers. The indicator esteem is computed by utilizing the number of inhabitants with open urban green zones (NACC), the total number of residents across the city (NTOTAL), and the score of inhabitants living around the chosen distance to urban green regions (UGSI). It is calculated as follows [73]:
UGSI = NACC/NTOTAL × 100%
The straightest distance to the boundary limit of UGS at least 1 ha in area was set as 300 m. The investigation results showed that the indicator value reduced [74] with the expansion of green spaces and the reduction of distance to green spaces.
2.5. Socially Vulnerable Groups Demand Index (SDI) Assessment
Only based on the spatial distribution characters of vulnerable groups, the accessibility study can really reveal the spatial equity of green space resources. Therefore, the concept of a socially vulnerable groups’ demand index [75] is adopted, and it reflects the differences in the spatial distribution of the vulnerable groups and also objectively manifests the potential requirements of the vulnerable groups for sharing urban ecological space [31]. Through the spatial equity of public green space, it is attainable to social inclusivity and equity. Thus, vulnerable groups can avail the public ecological property and meet up with their own requirements. This index measures the different demand levels for green space of five vulnerable groups (females, the illiterate, religious minorities, the unemployed and ethnic people) at the community Thana level. For computational simplicity, each of the indicators recorded above was standardized with the range-institutionalized technique [32]. This task included a range-change approach. The formula used is as follows:
where Ci represents a community indicator or name, Fi is the average value of all groups’ demographic values of a certain community area and Fmax and Fmin denote the maximum and minimum values among the groups’ value of a certain community, respectively. According to the calculations, the six Thanas were partitioned into three grades according to the SDI outcomes: Very high demand (SDI > 0.6), high demand (SDI 0.5–0.6), and low demand (SDI 0.4–0.5).
Ci = (Fi − Fmin)/ (Fmax − Fmin)
2.6. Study Sites Overview
The city of Dhaka was used as the study area in the present study. A total of six out of 40 Thanas (subdistricts) were chosen for investigation. Dhaka is a densely populated city inhabited by different classes of people. The Accessibility of public green parks to city dwellers is not healthy; people in socially vulnerable groups are in critical condition as well. Compared to population density, the availability of green parks and their distribution is not the same for the whole population. We investigate which community areas have the highest or lowest accessibility to socially vulnerable people.
Dhaka’s urban development has not kept up with the city’s fast growth; its urbanization process has been untidy and uneven. The need for satisfactory arrangement has led to congestion, destitute livability and vulnerability to surges and earthquakes. Dhaka’s numerous inhabitants include 3.5 million slum tenants [76]. Between 1995 and 2005, the area of street surface in Dhaka grew by around five percent, while the city’s population grew by 50% and its activity by 134%. Congestion in Dhaka wastes 3.2 million working hours per day [76]. Moreover, spatial distribution is also seriously unfair; for example, open green space patches are associated with unplanned and uneven construction. Dhaka City has two parts: Dhaka City Corporation (North) (DNCC) and Dhaka City Corporation (South) (DSCC). The DNCC does not accommodate green parks in two out of five zones (zone 2 and 4). It has been developed as a “New Dhaka” and is largely inhabited by middle- and upper-middle class people. Likewise, zone four of the DSCC contains no green patches or playgrounds, even though its population density is around 97,560/km2 [77].
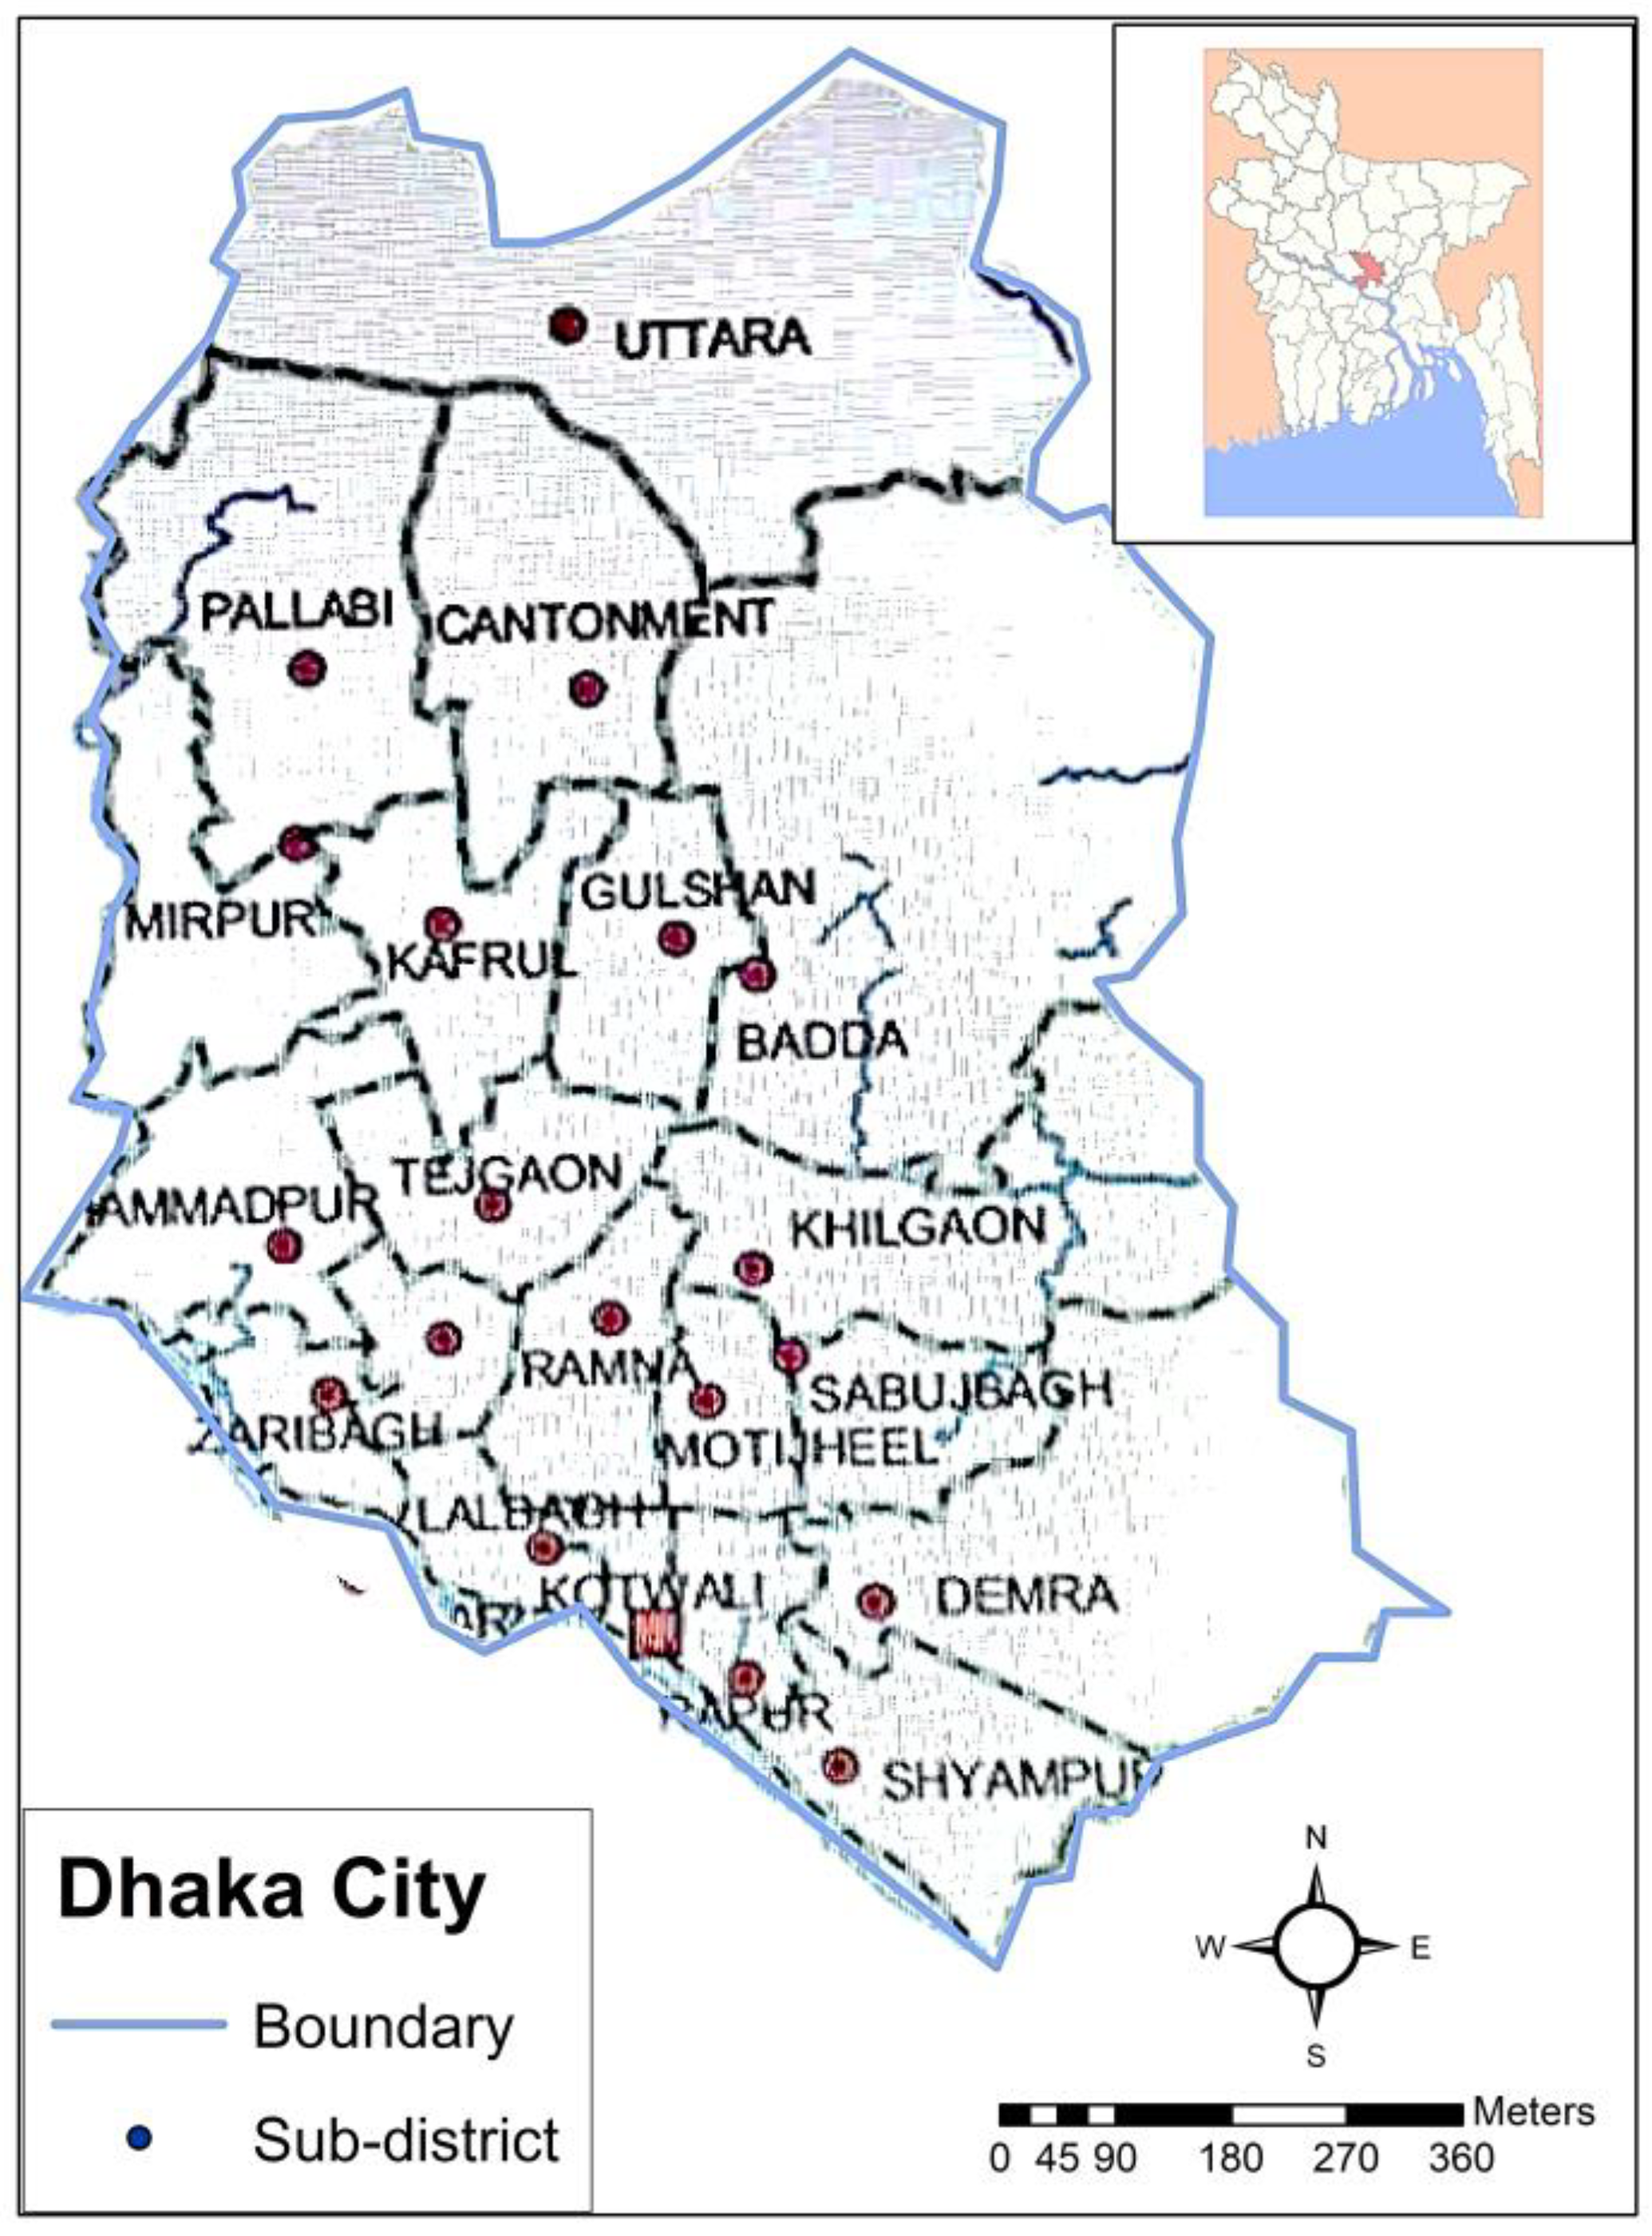
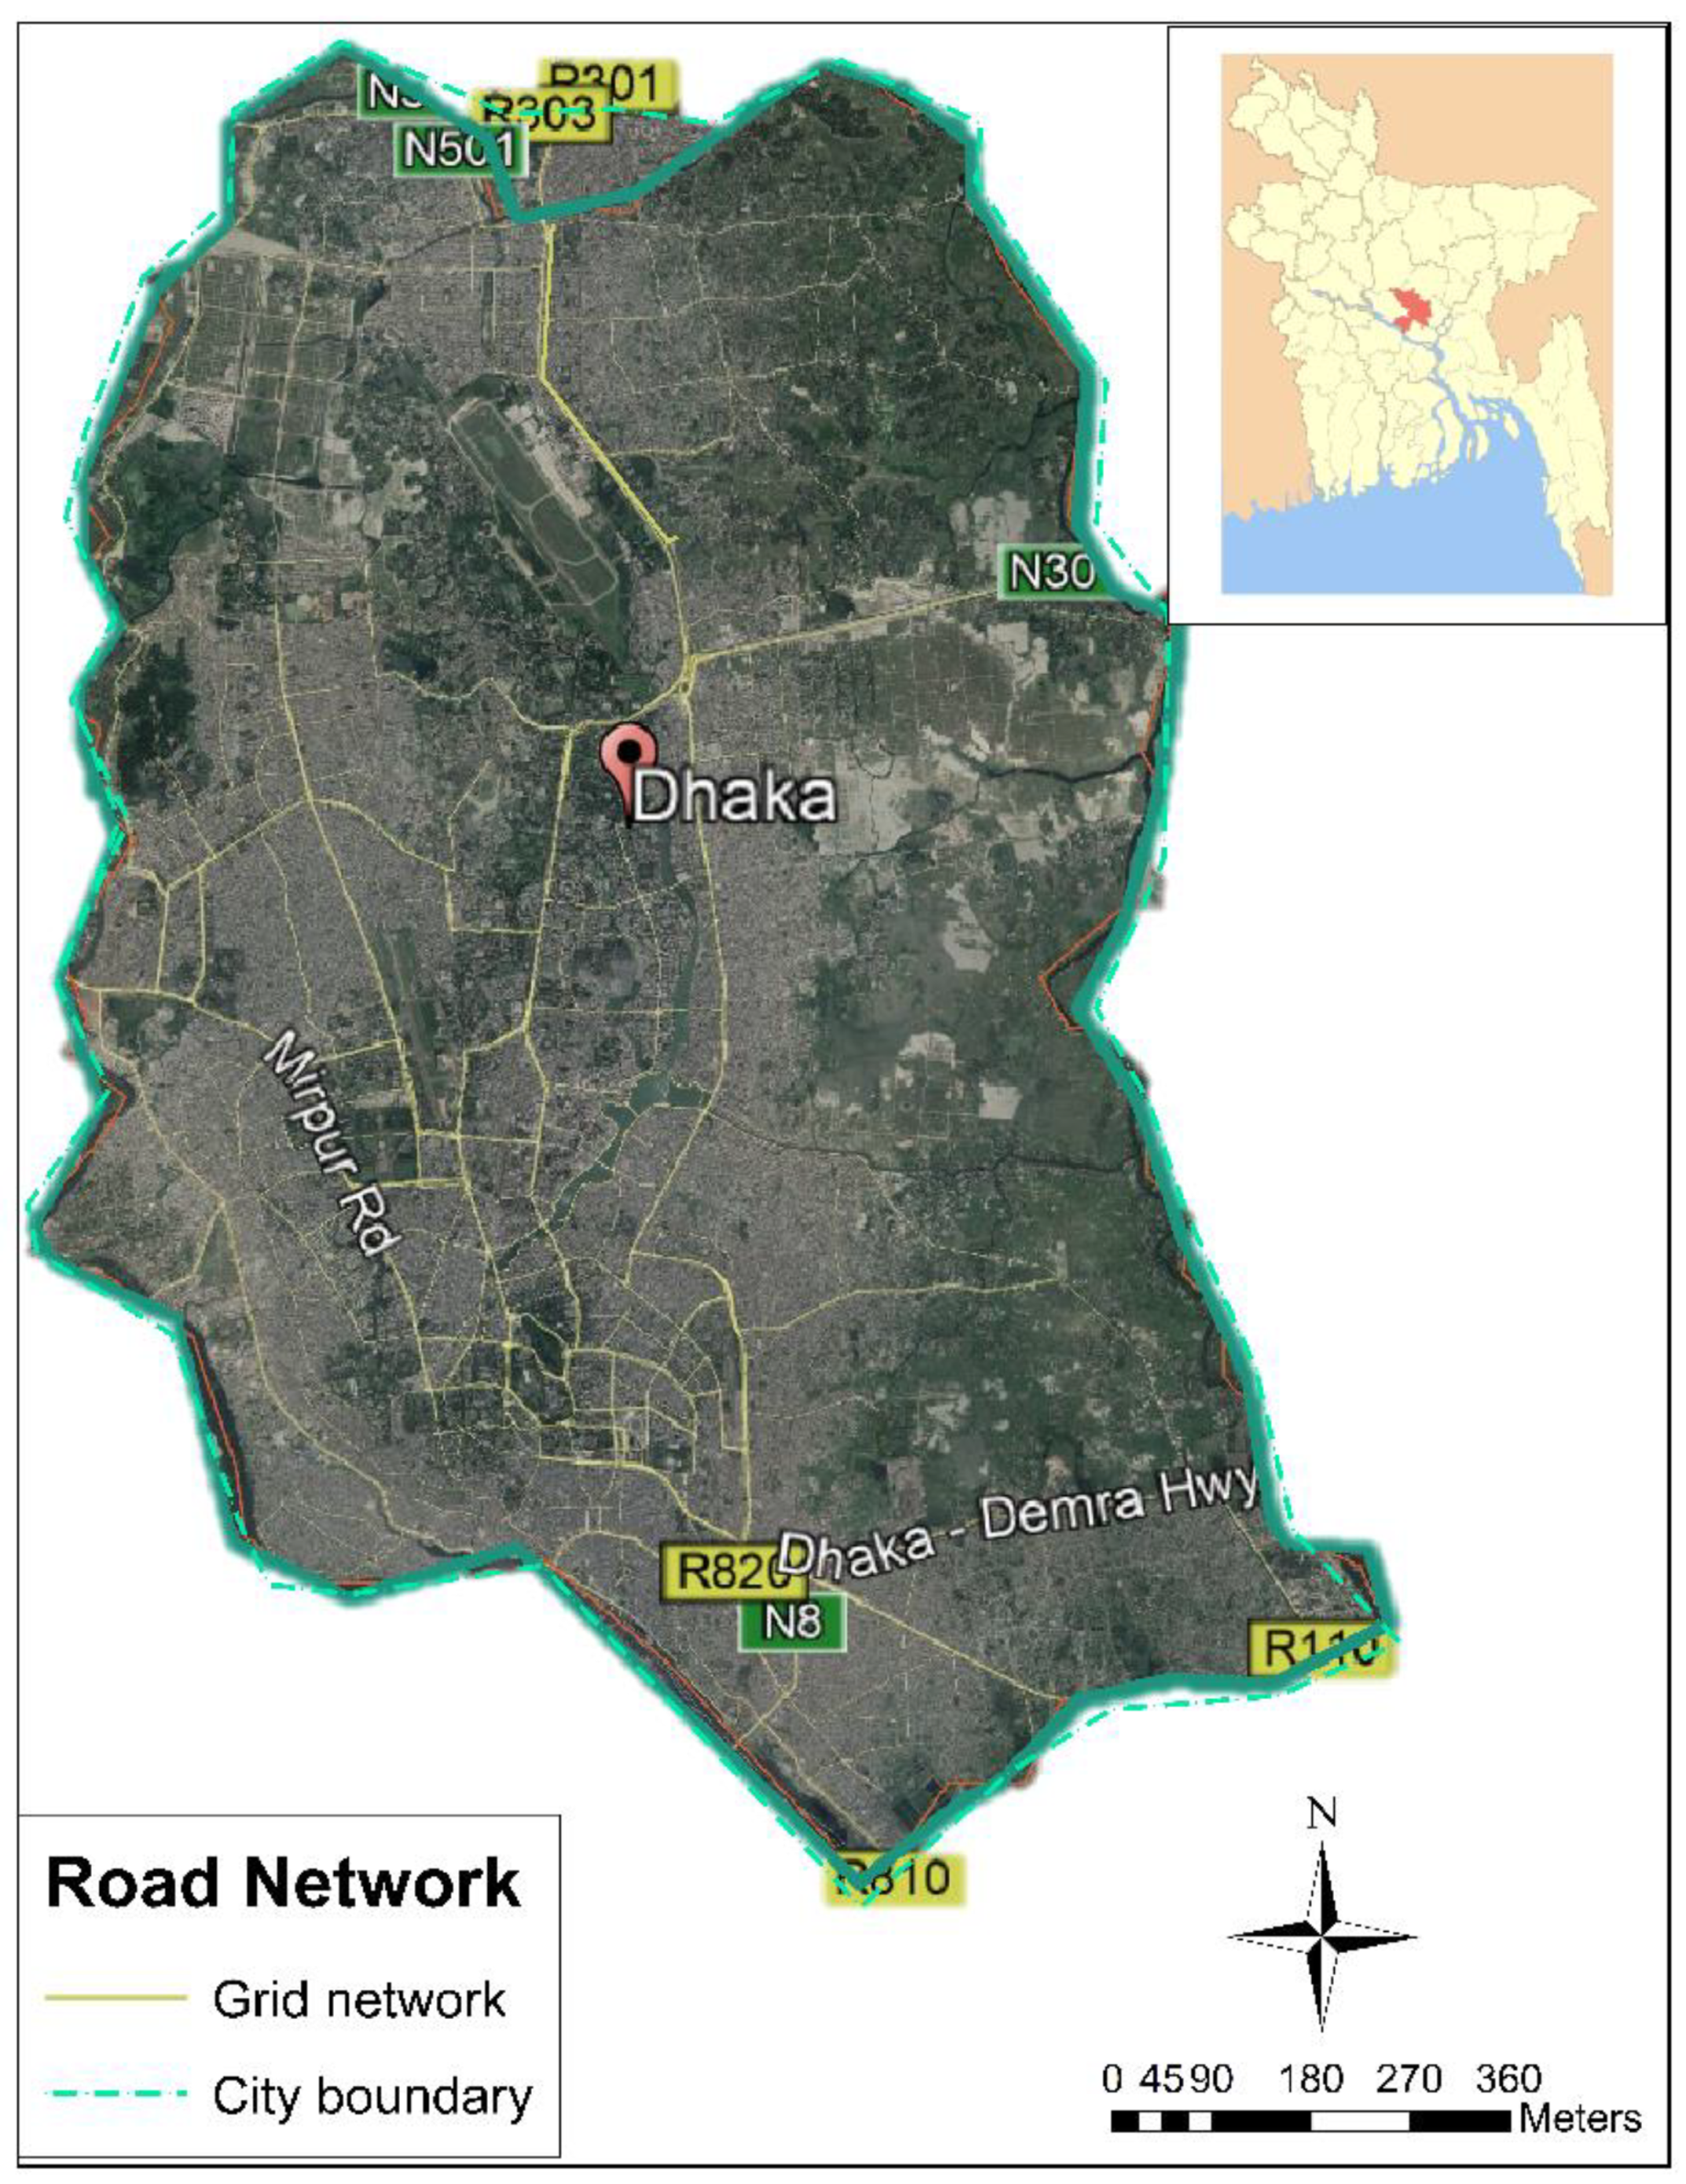
Dhaka, previously known as Dacca, is the capital and biggest city of Bangladesh, as well as the country’s main economic, political and social focal point. It is the fourth most densely populated city in the world [78], with a population of 18.89 million in the Dhaka City Corporation Area. Dhaka is one of the most important urban zones in South Asia and is the largest city in Eastern South Asia. As part of the Bengal Plain, the city is situated on the Buriganga, Turag, Dhaleshwari, and Shitalakshya Rivers. The city is situated in an eponymous locale and division [79]. Figure 2 displays the location of Dhaka with sub-district (Thana) boundary distributions.
Dhaka City is located at 23°42′ N 90°22′ E on the eastern banks of the Buriganga River. It lies in the lower ranges of the Ganges Delta and covers an aggregate territory of 306.38 km2 [80]. Tropical vegetation and wet soils make up the land, which is level and close to sea level. Dhaka City is limited by the districts of Manikganj, Tangail, Munshiganj, Rajbari, Narayanganj, and Gazipur. Dhaka City Corporation is a self-administering zone that runs the affairs of the city. Dhaka City was established on 1 August 1864 and achieved “metropolitan” status in 1978. The territory inside city partnerships is partitioned into a few wards, which each have a chosen official. Altogether, the city has 40 Thanas, 130 Wards, and 725 Mohallas.
Under the Köppen climate classification, Dhaka has a tropical savanna air. The city has a specific monsoonal season, with a yearly average temperature of 26 °C (79 °F); temperatures range from 19 °C in January–February to 29 °C in May–June. Roughly 87% of the yearly average precipitation of 2123 mm (83.6 in) occurs between May and October [81]. There are various parks inside Dhaka City, including Ramna, Shishu Park, Suhrawardy Udyan, Gulshan Park, Chandrima Udyan, Dhaka Zoo, and the National Botanical Garden. There are lakes inside the city, including Crescent Lake, Banani Lake, Dhanmondi Lake, Hatir Jheel-Begunbari Lake, and Uttara Lake.
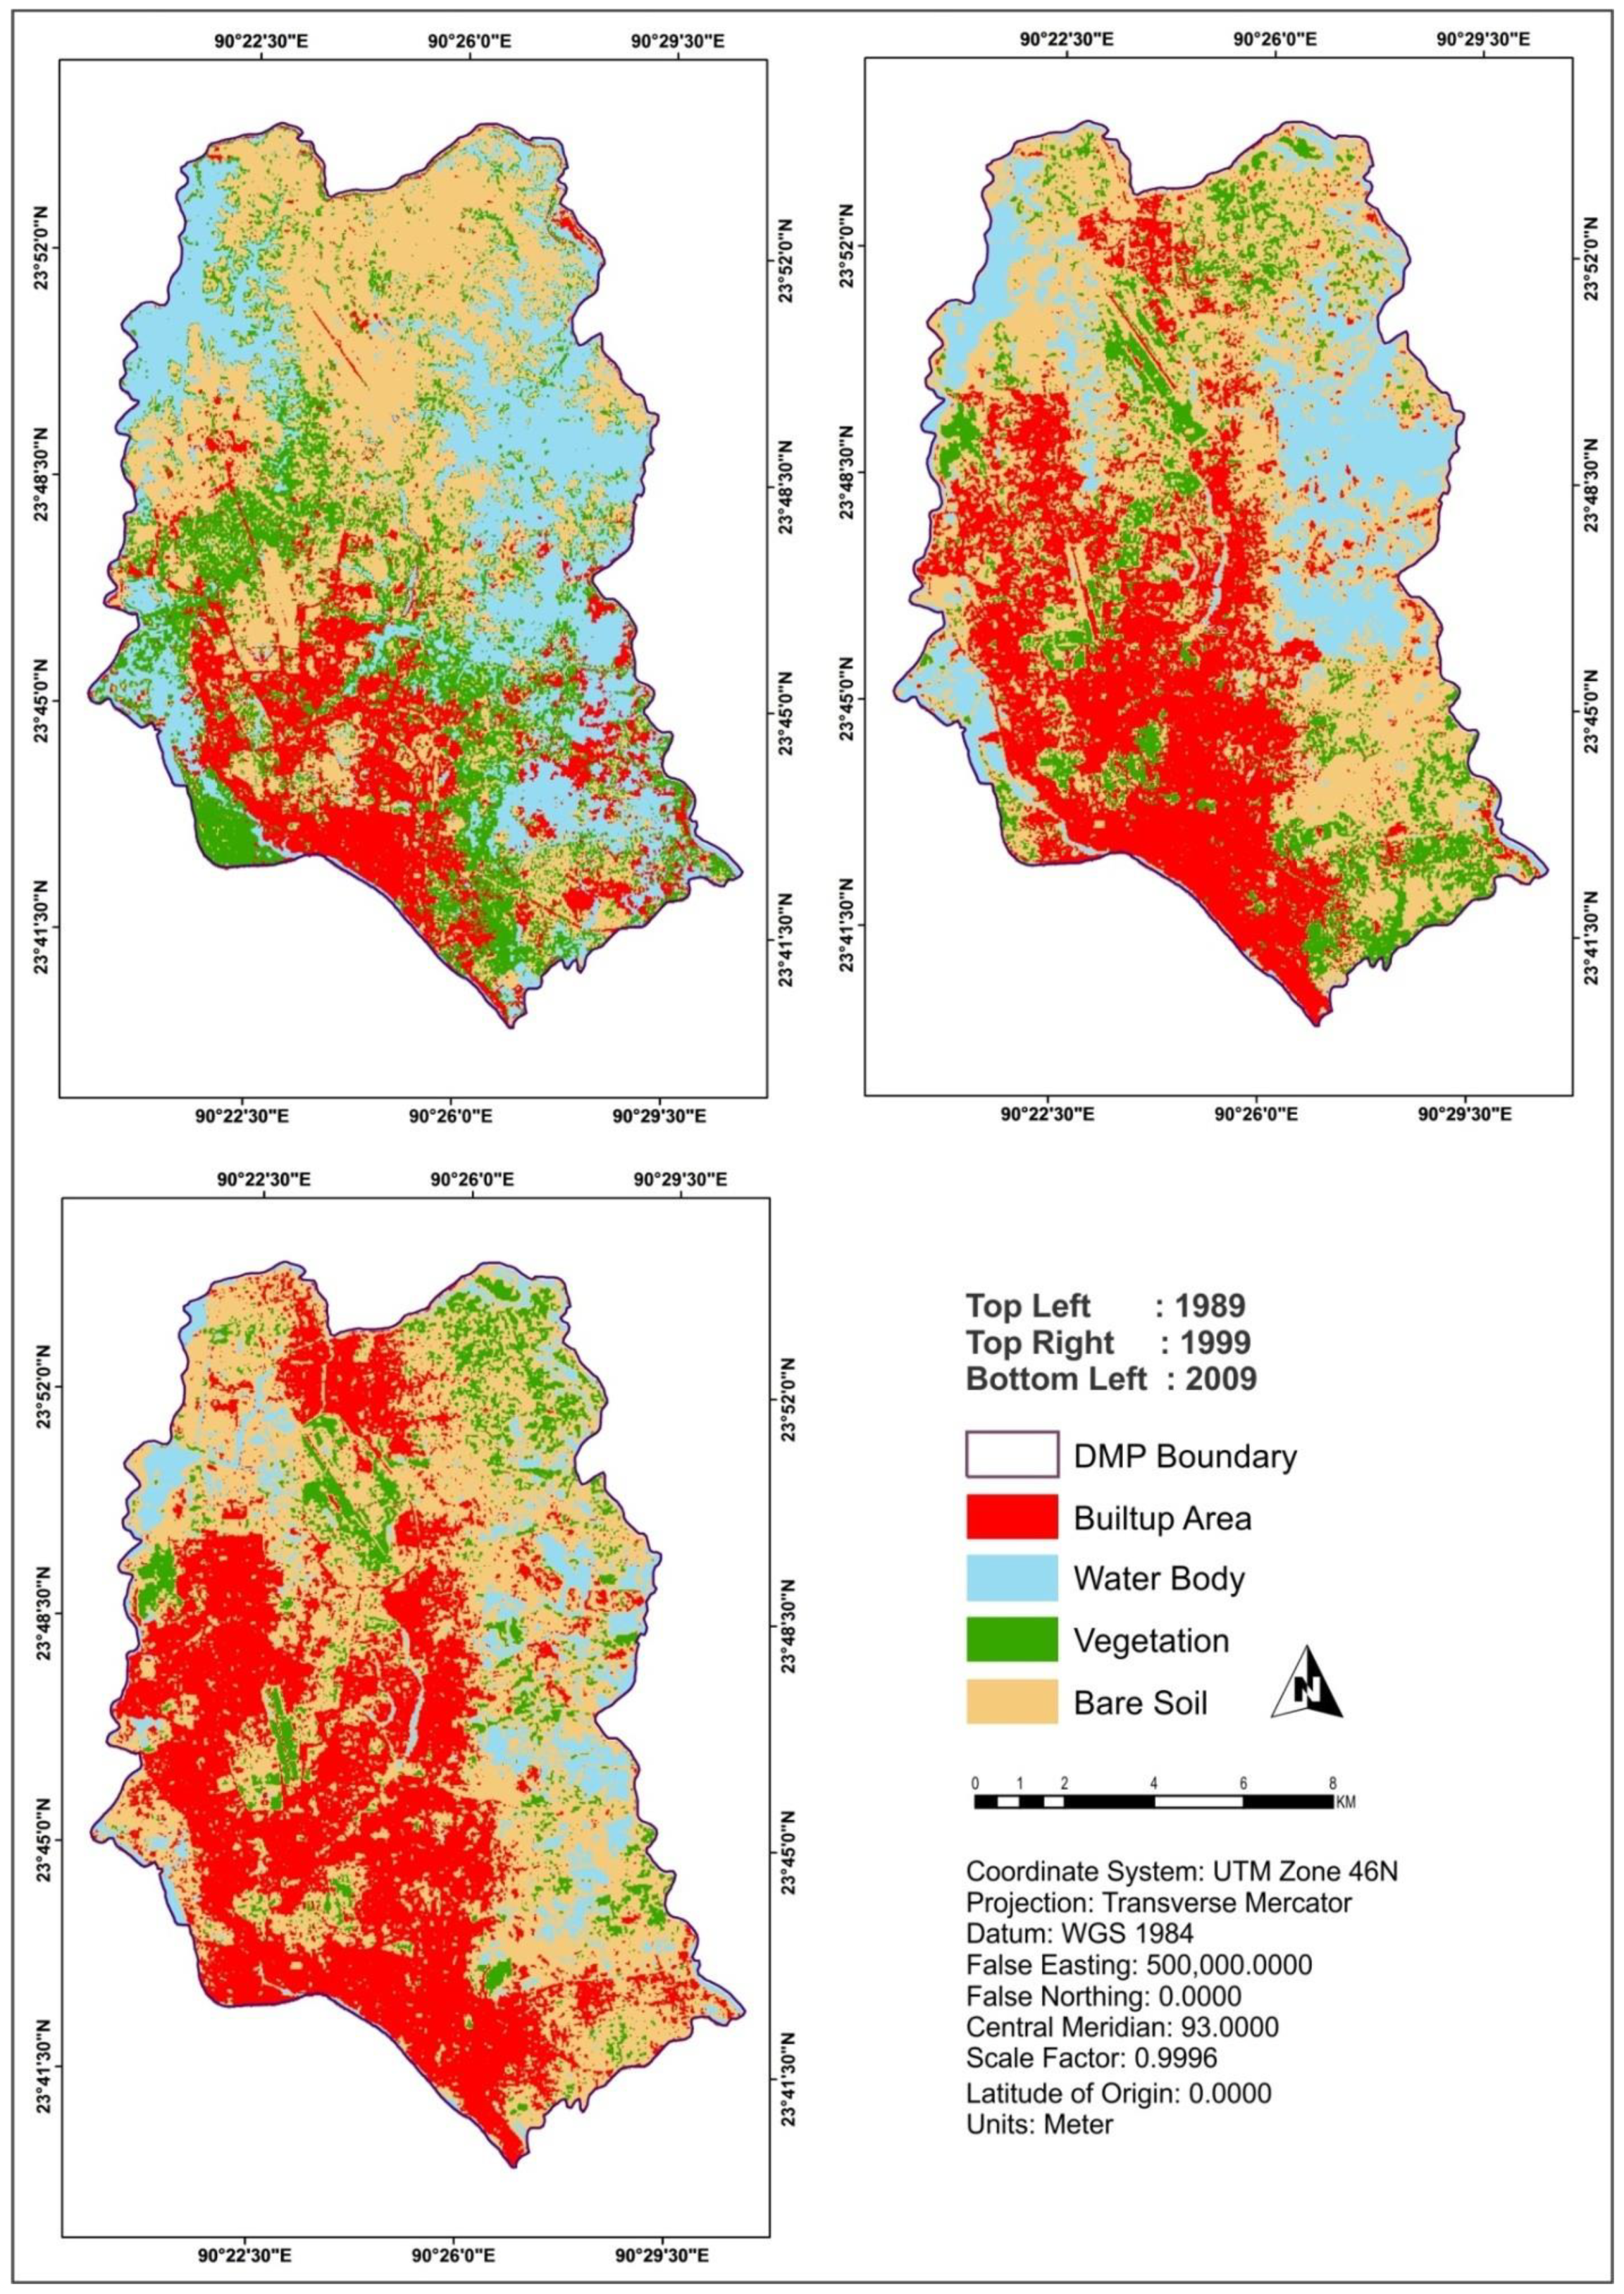
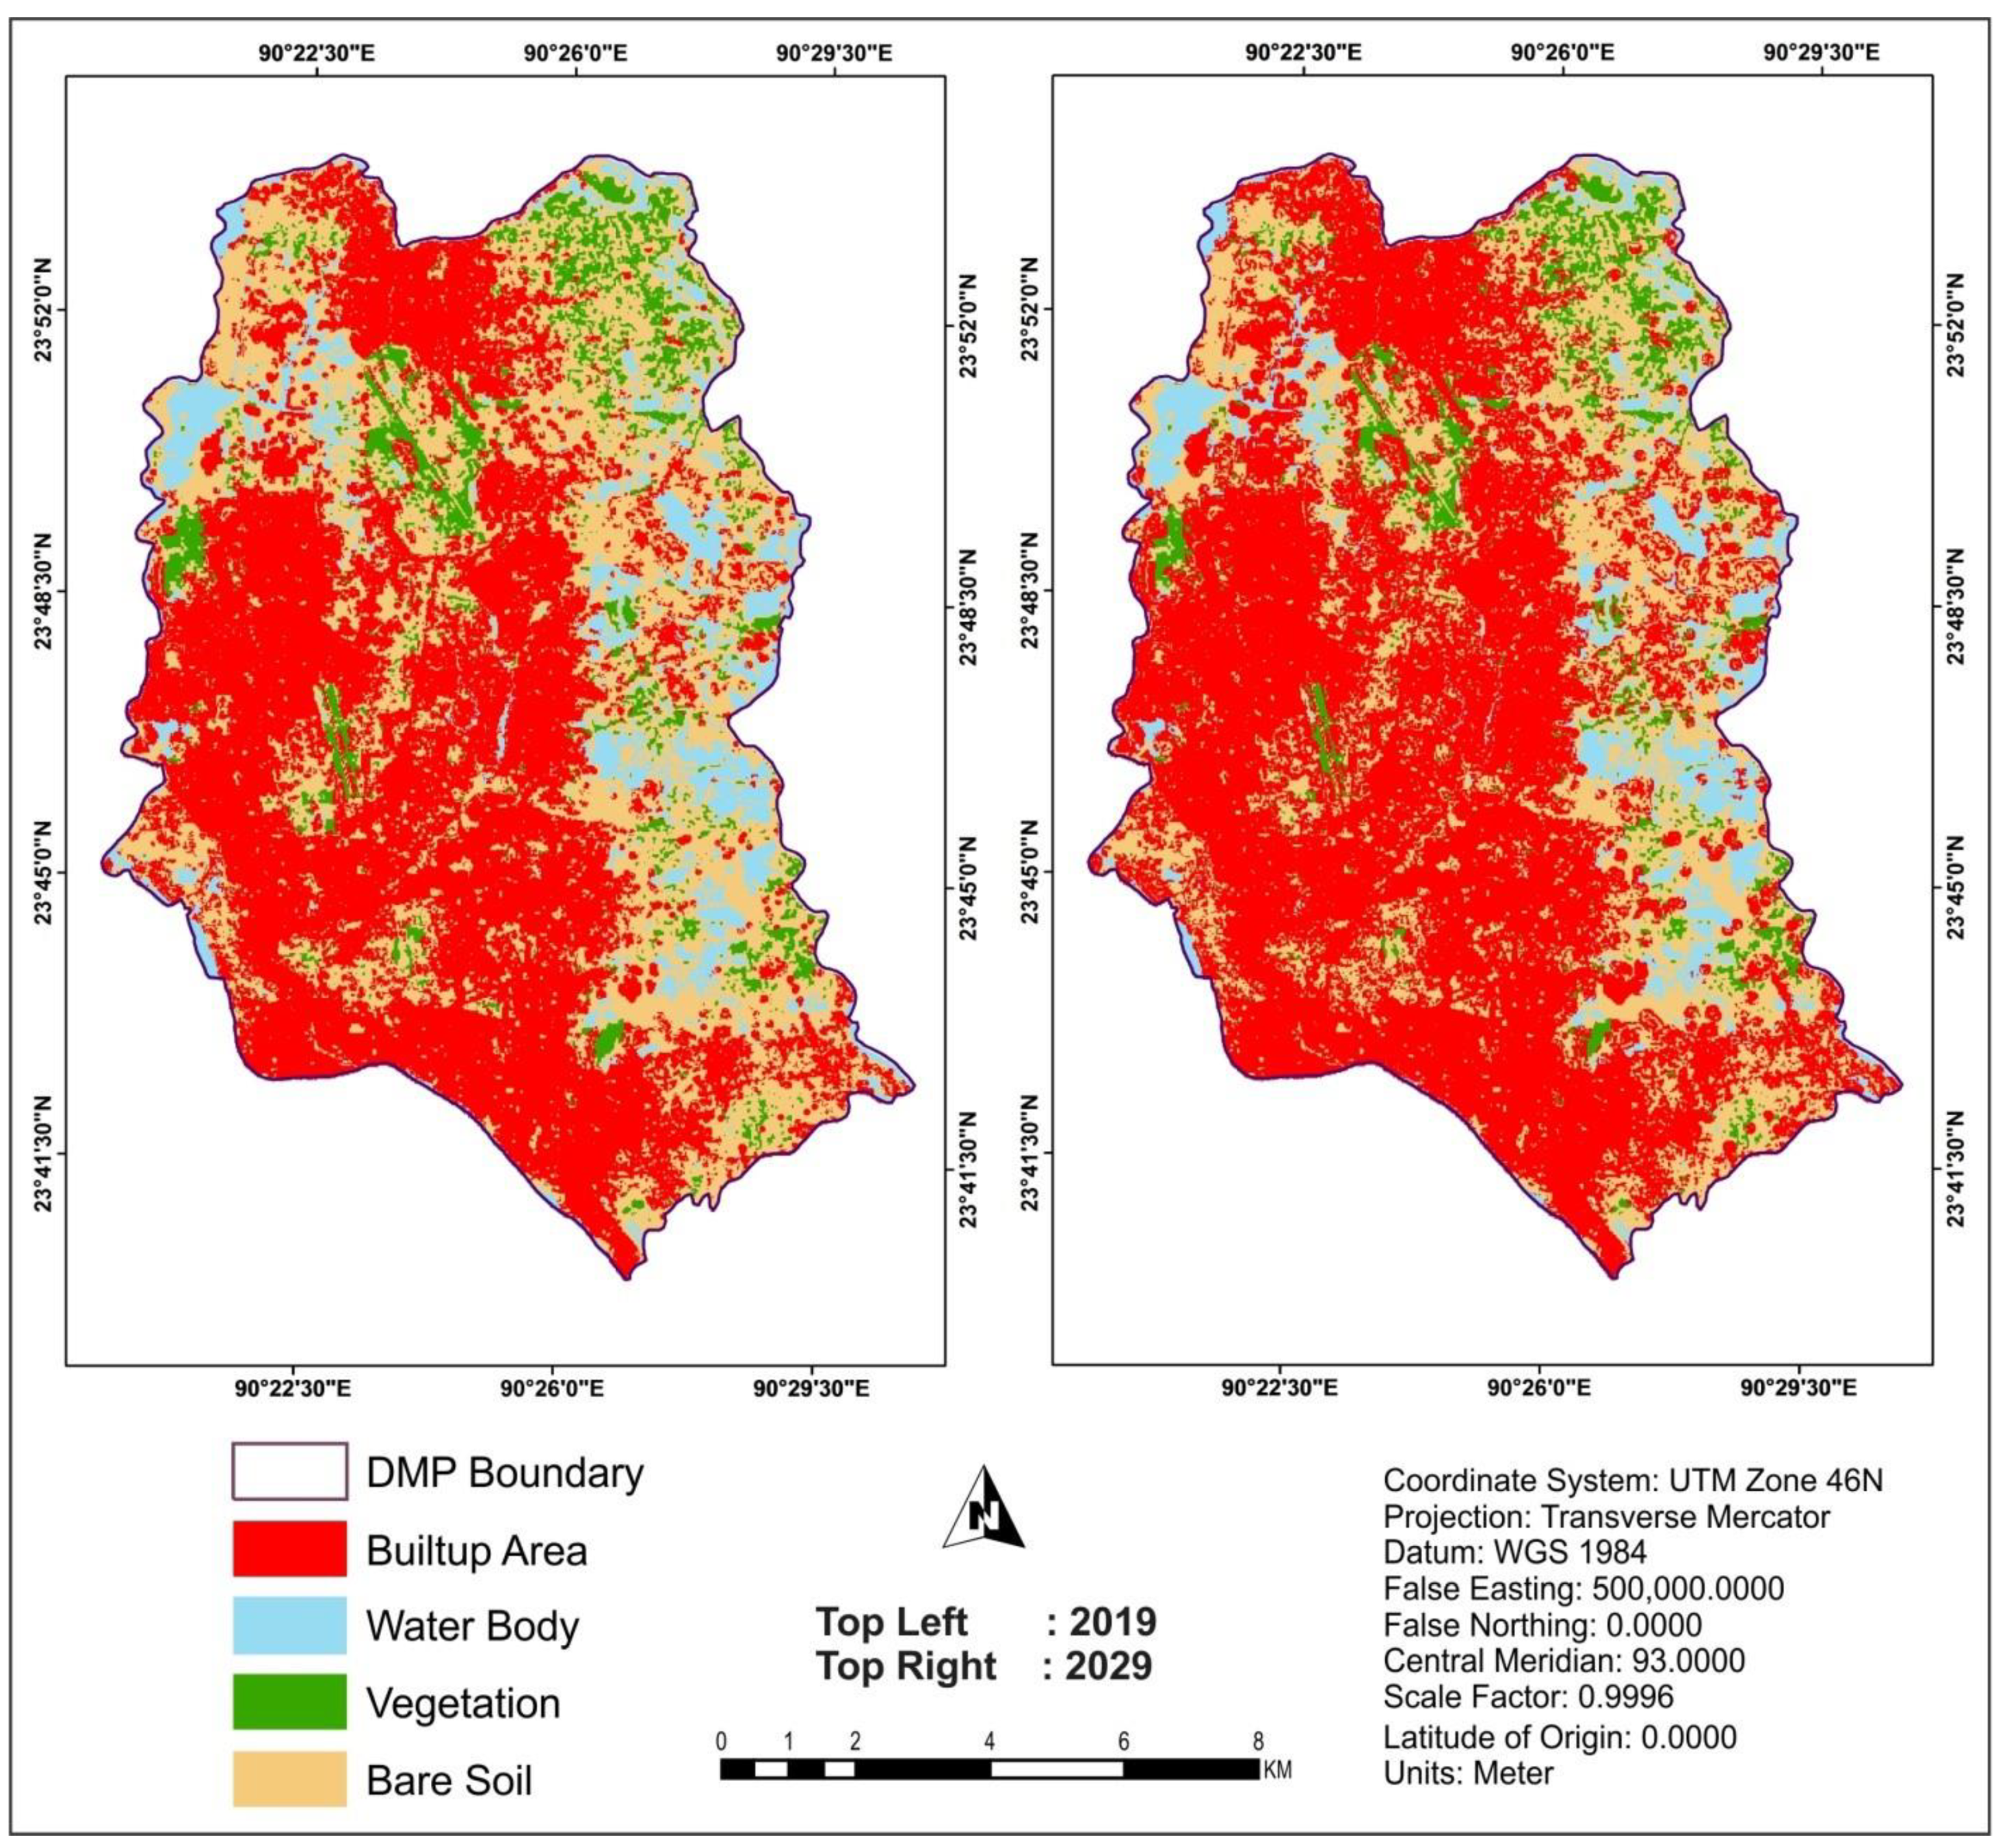
Figure 3 appears that two patterns are clearly recognizable from the figure: (1) Built-up zone and uncovered soil expanded slowly over the periods; and (2) water body and vegetation declined steadily. More particularly built-up zone expanded by 88.78% within the past 20 years, from 1989 to 2009 [82]. The maps’ results propose that around 49% and 57% of the Dhaka City region will be changed over into “built-up area” land cover sort in 2019 and 2029, separately (Figure 4) [82].
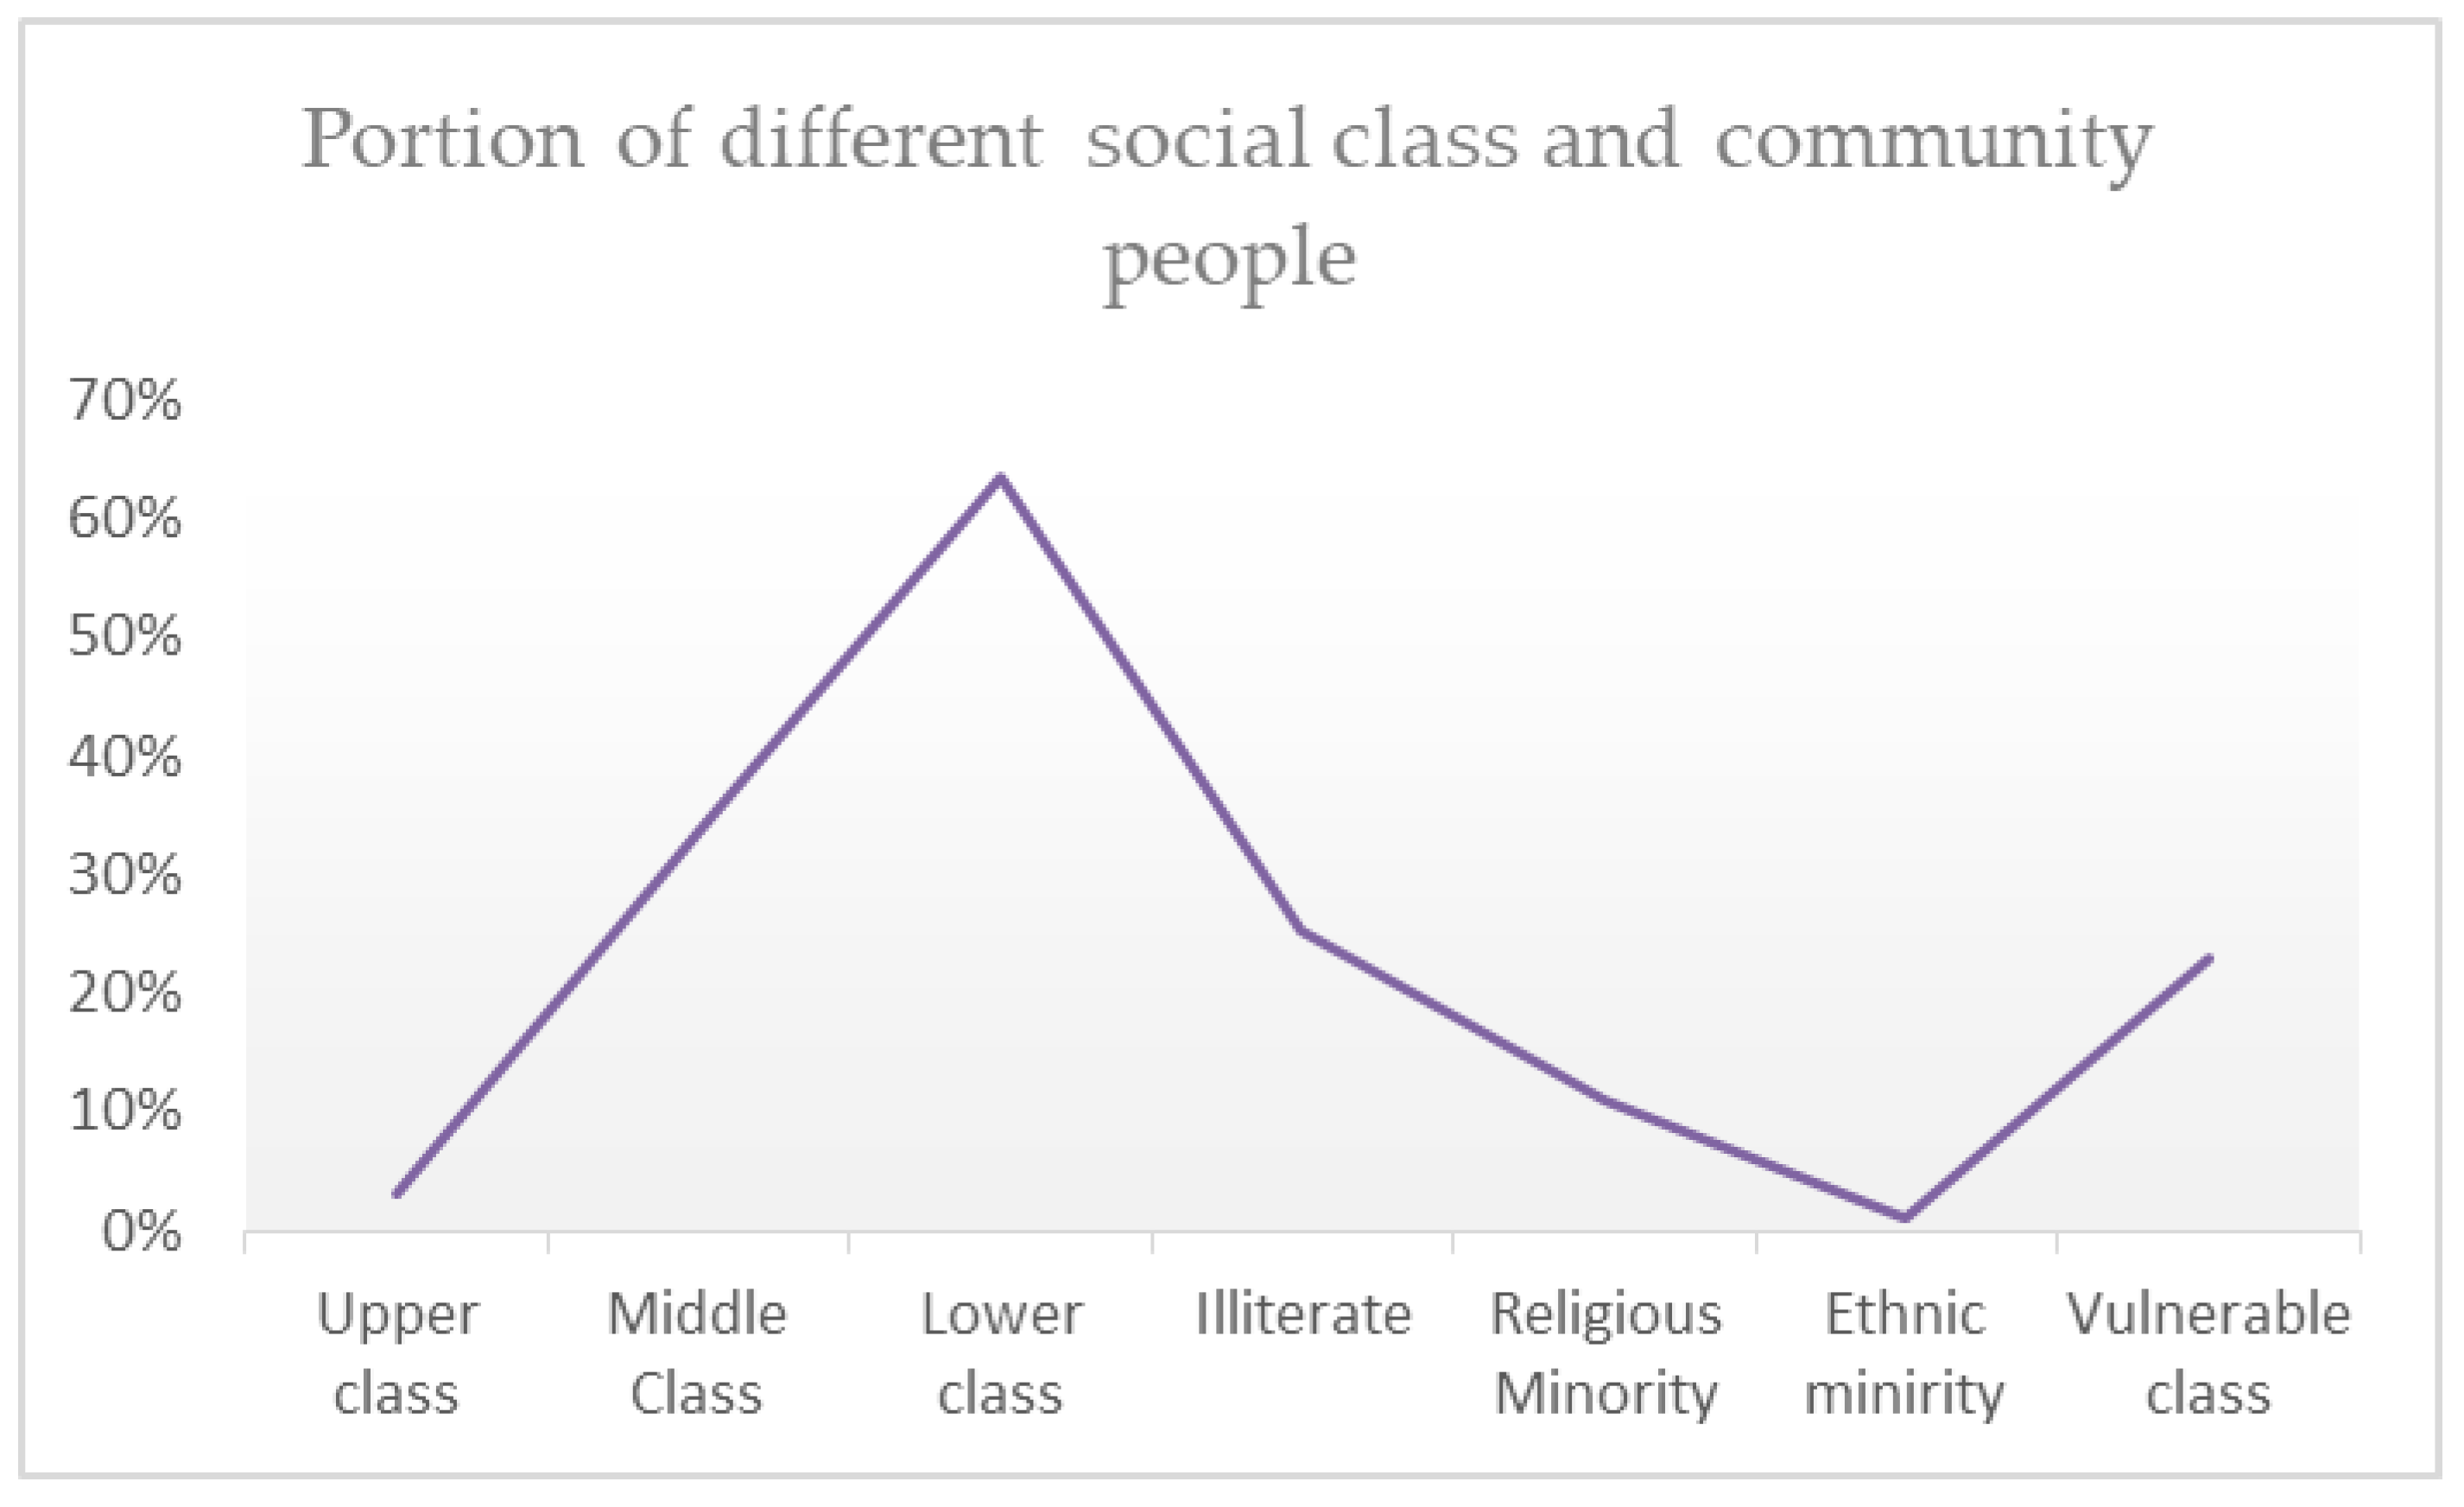
Dhaka City, which is continuous with areas comprising the more extensive metropolitan region, was home to more than 15 million people as of 2013. The population is increasing by an estimated 4.2% every year, one of the highest growth rates among all Asian cities. This growth rate influences migration movements from rural zones to Dhaka, which accounted for 60% of the city’s expansion between 1960 and the 1980s. The Far Eastern Economic Review estimates that Dhaka will have a population of 25 million by 2025 [83]. Dhaka is highly socially stratified: A total of 63.60% of people belong to the lower class and 36.40% to the upper and middle classes [84]. Additionally, 23% of the population of Dhaka City people are classed as vulnerable (women, illiterate people, religious minorities, ethnic minorities, and unemployed people) (Figure 5); as of 2011, 25.40% of Dhaka’s population were illiterate, 11% were religious minorities and 1.1% were ethnic minorities [84]. Therefore, the majority of Dhaka’s population are either of low class or vulnerable.
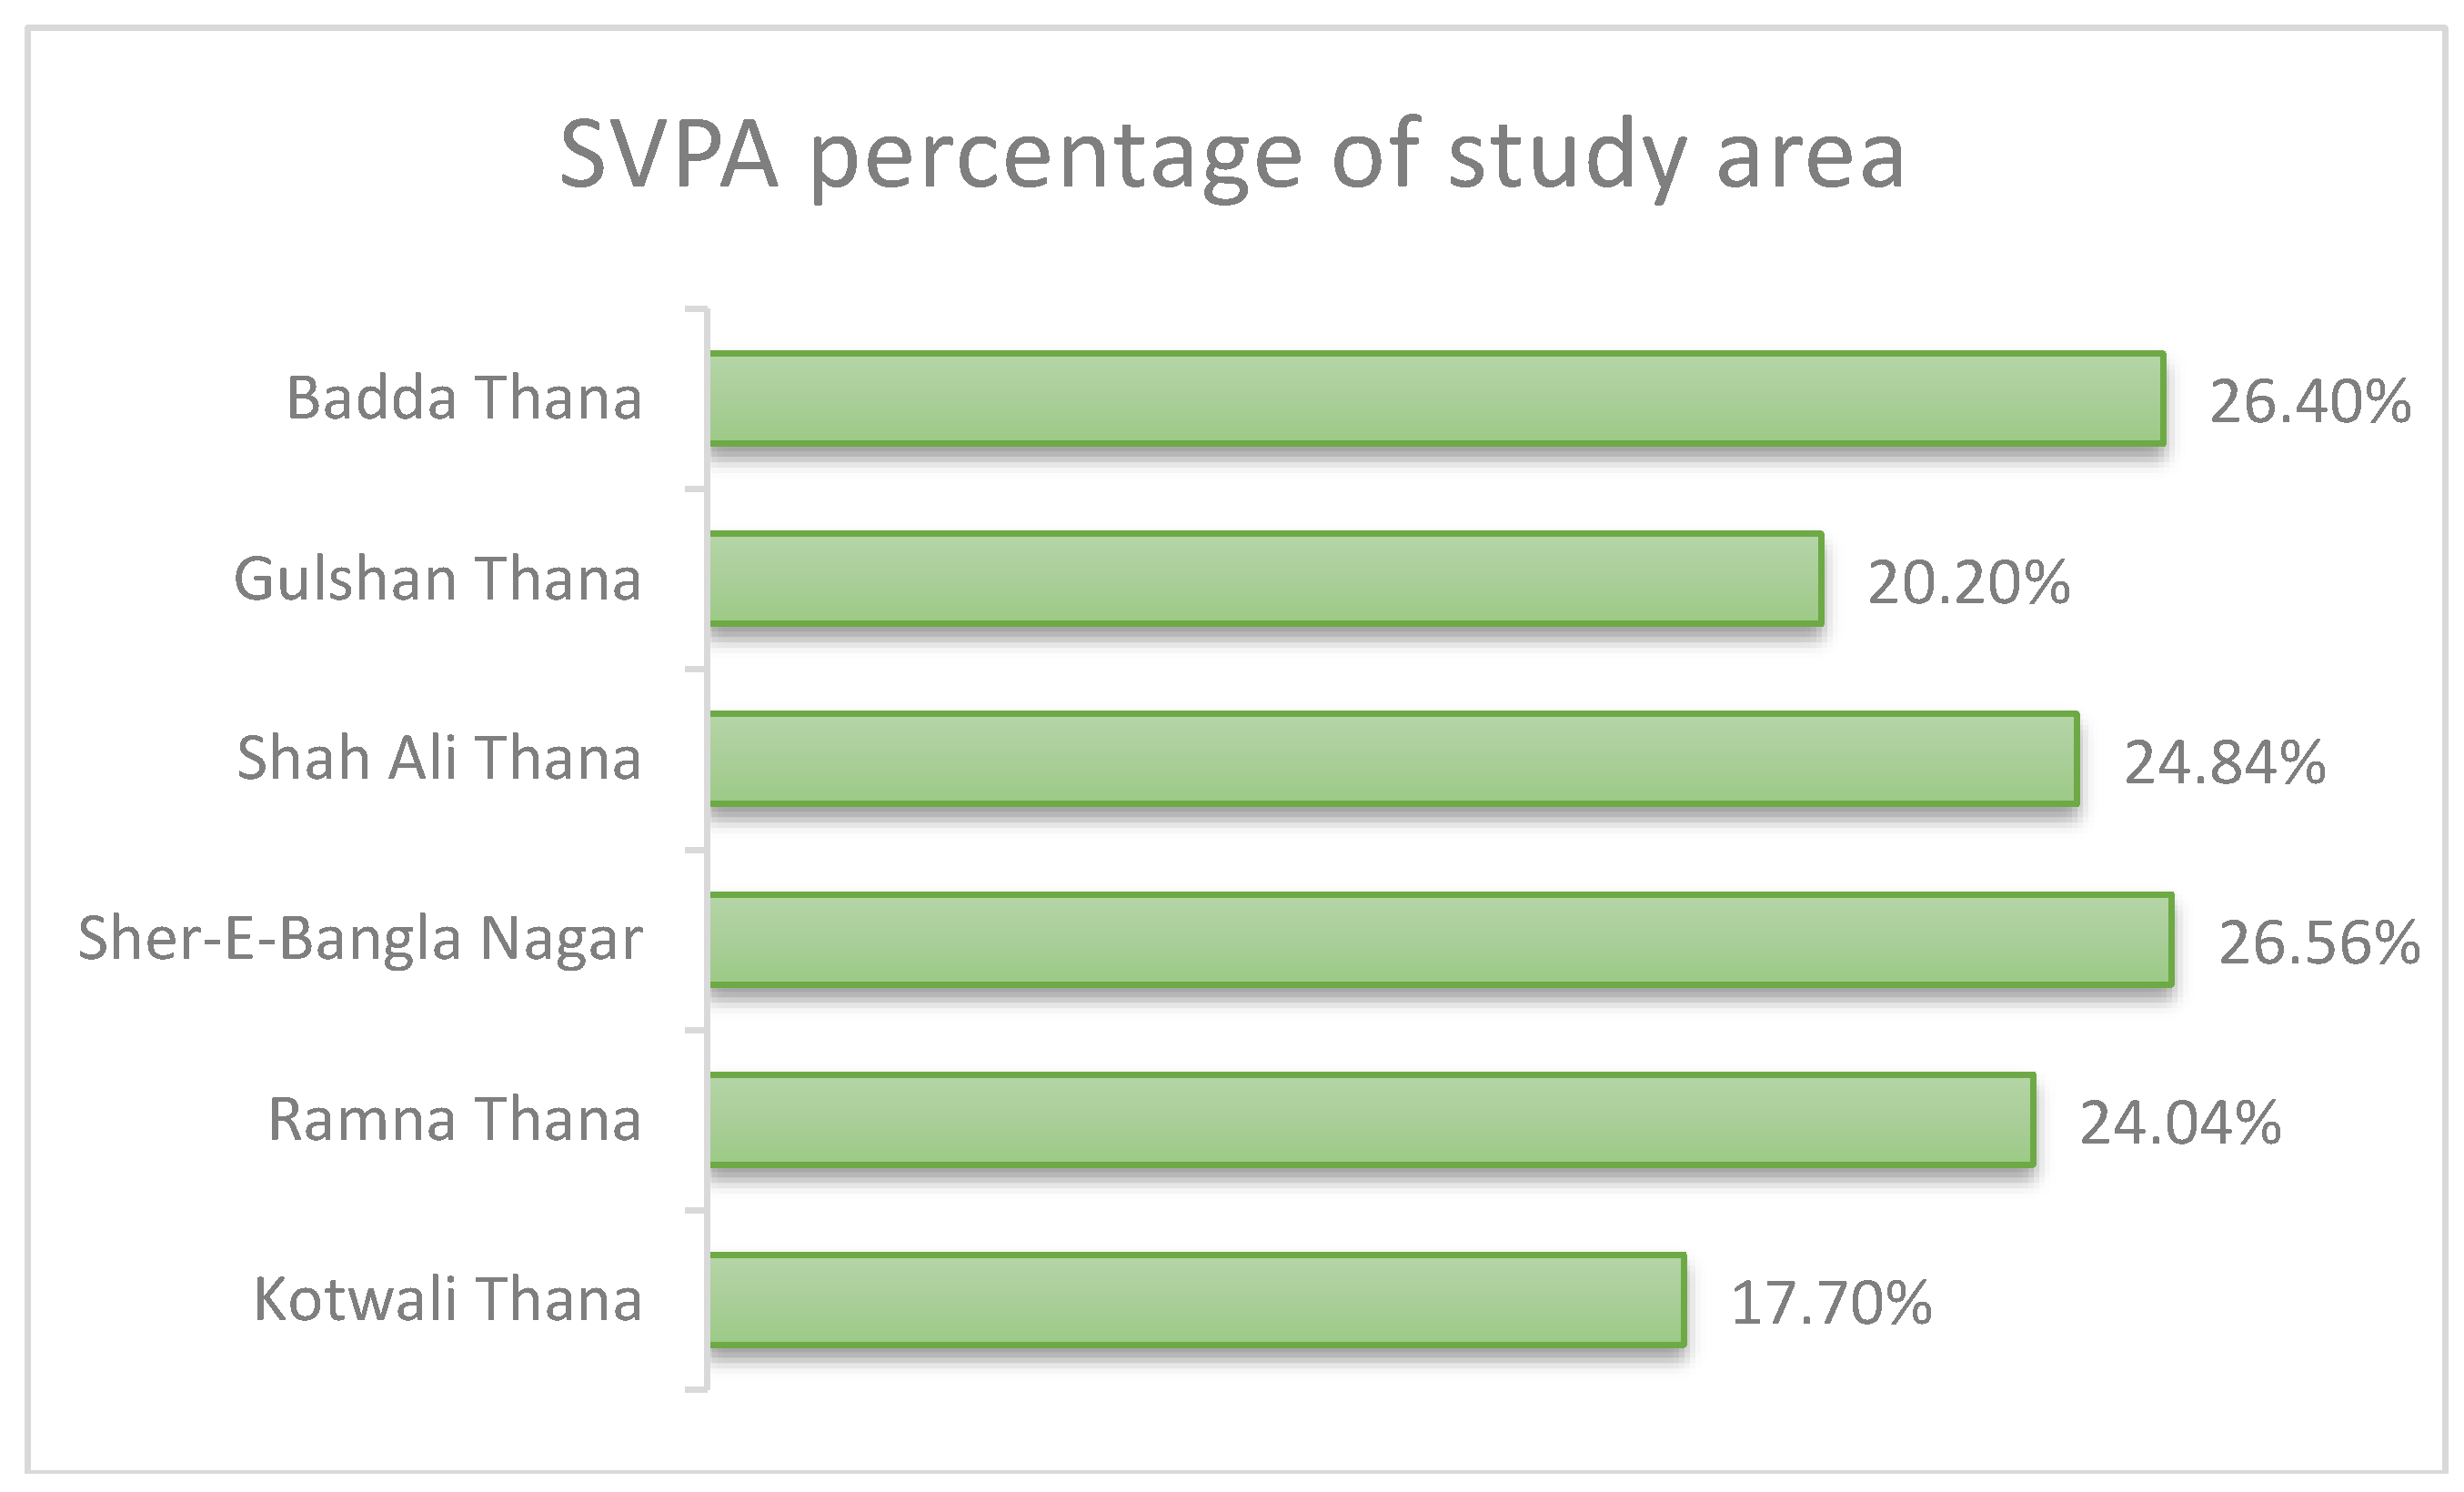
The education rate in Dhaka is rising rapidly, and was around 69.3% in 2001. The literacy rate had increased to 74.6% by 2011, which is higher than the national average. The demographics of Dhaka City include people from each district of Bangladesh. Between 15,000 and 20,000 of the Santal, Mandi, Rohingya, Chakma, Garo, and Khasya peoples live in the city. Table 1 shows that Sher-e-Bangla Nagar and Badda have the largest number of socially vulnerable people (26.56% and 26.4%, respectively). The lowest average number of socially vulnerable people is in Kotwali (17.7%). On average, 23% of the population of Dhaka are socially vulnerable and thus demand the highest accessibility of public green spaces for their socio-physical and psychological wellbeing.
In the City Corporation region, there are only 1286 km of roads, which is generally about 6% within the city zone (Figure 6). Just 9% of roadways and 6% of asphalted land is accessible, of which 62 km is utilitarian essential, 108 km is auxiliary and 221 km connector streets used for city transport. The United Nations Economic Commission for Europe (UNECE) recommends around 25% of road network for a sustainable city (Figure 6). The accessibility of green patches requires safe, smooth, and low-cost connectivity, which are regrettably lacking in Dhaka City.
Figure 6 shows that the connectivity networks in the northern and eastern parts of Dhaka City lack proper connectivity, since the Southern part is comparatively fair, but are not properly connected due to population density. The Northeastern part of Dhaka City has been developed in recent decades, and predominantly middle and upper-middle class people are settled in these zones. Several residential zones (Uttara, Baridhara, Gulshan, Banani, Bashundhara, and DOHS residential areas) have been developed in a planned way, however road connectivity here is visibly uneven, unfair, unavailable, and unplanned. As a result, demand for green space attachment increased more where accessibility facilities decreased in an equivalent manner.
2.7. Six Selected Community Areas
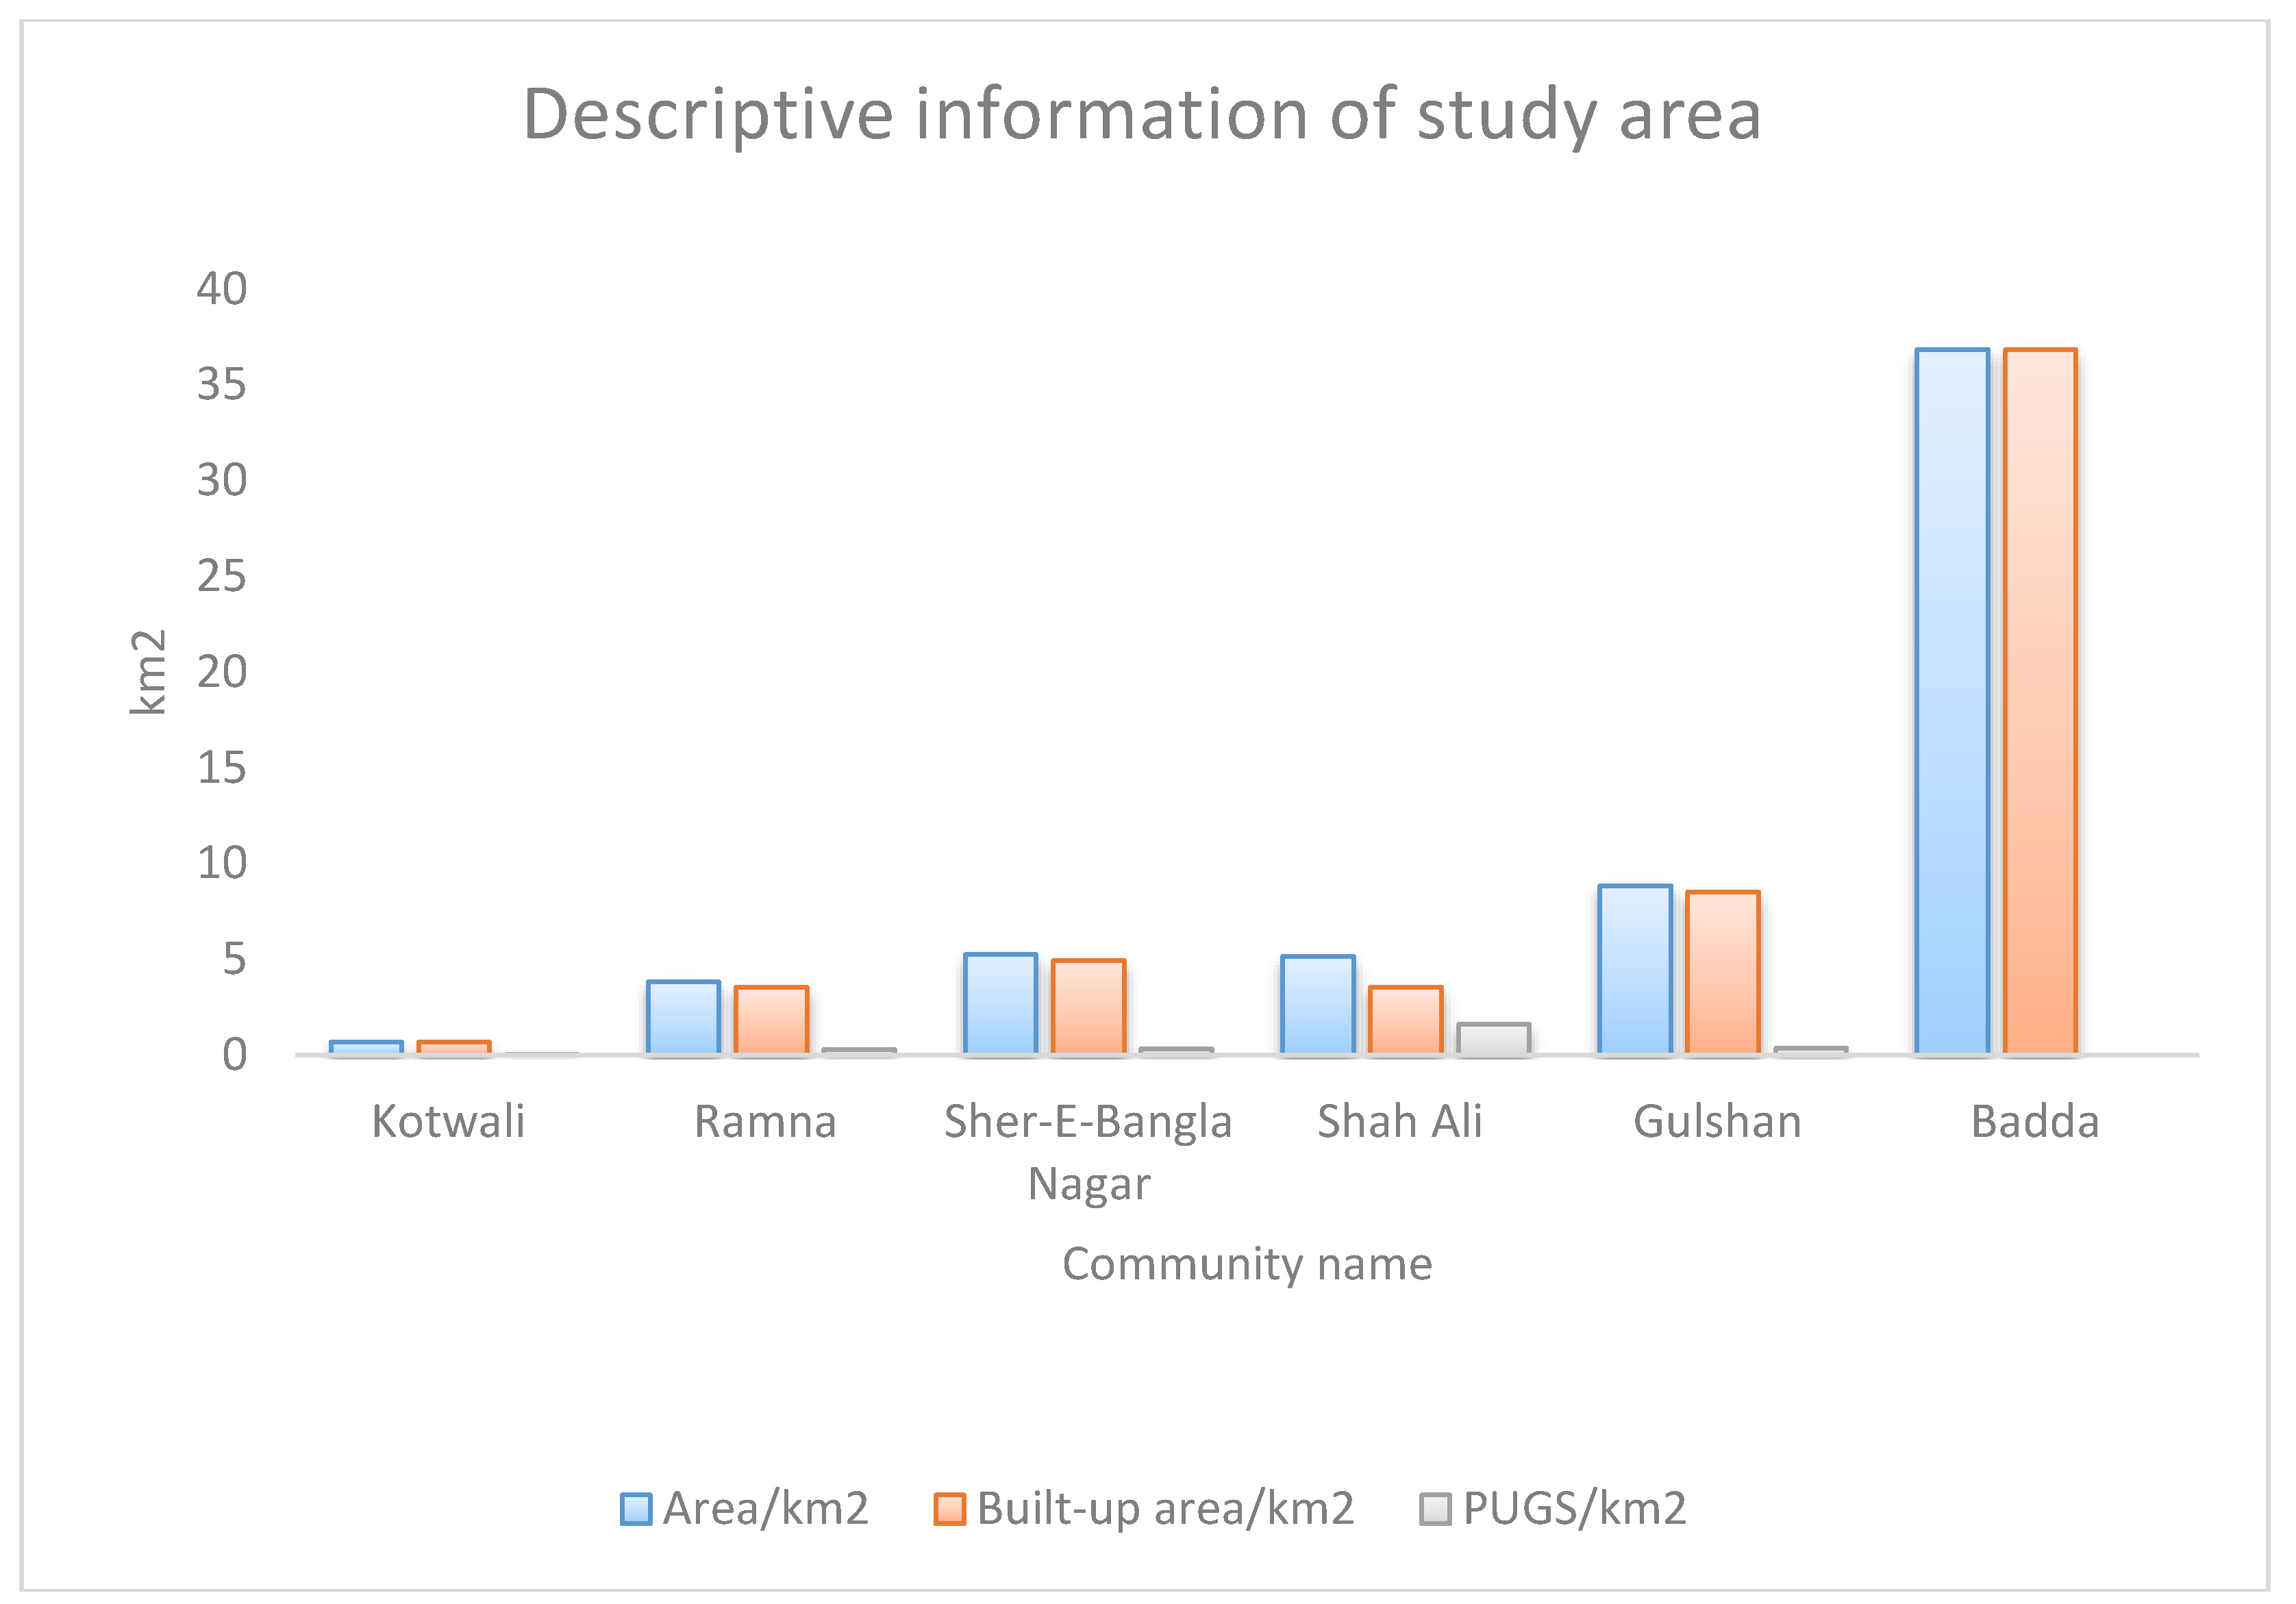
The study investigated six community areas (subdistricts, or Thanas) (Kotwali, Ramna, Sher-e-Bangla, Shah Ali, Gulshan, and Badda) out of forty. The forty Thana are diverse in terms of human and non-human features. Figure 7 shows that the built-up area of Badda has the highest community area (36.84 km2) and Kotwali has the lowest (0.6735 km2). Shah Ali has the highest amount of green space (1.6 km2) and Badda has none. It is worthy noted that Kotwali is the most densely populated community area (97,438/km2) and Badda is the least densely populated (14,566/km2).
It is noted that Kotwali holds only 0.0065 km2 of green parks, while Badda Thana has no green patches at all. Shah Ali has 1.6 km2 of green parks, meeting the demands of 22,425 people/km2. Dhaka City has an average of just 0.0002 m2 of green park per capita. Only 0.0005 m2 of green park per capita remain in Kotwali, where around 17.70% of the population are classed as vulnerable (women, illiterate, religious and ethnic minorities, and unemployed) (Figure 8 and Table 2).
Sher-e-Bangla Nagar has 26.56% of vulnerable people and 0.025 m2 of green patches per capita. Badda has no green public parks and about 26.40% vulnerable people. According to the World Health Organization, an ideal city requires 9 m2 of green patches per capita to maintain quality of life and ecological balance. In spite of high demand, poor grid connectivity, congestion, and lack of security gear reduces the accessibility of green patches.
2.8. Sampling
The study selected six community areas (Kotwali, Ramna, Sher-e-Bangla, Shah Ali, Gulshan, and Badda) out of forty following cluster sampling technique. We applied simple random sampling strategy in selection process of the six community areas in Dhaka. In cluster sampling, cluster, i.e., a group of population elements, constitutes the sampling unit, instead of a single element of the population. The main reason for cluster sampling is “cost efficiency” (economy and feasibility) [85]. These communities are diverse that includes the diversification of geographical location, distribution of green parks, grid connectivity, social stratification, community size, and population density. The study endeavored to gather data and results from the diverse environment so that it could lock out key findings. Likewise, the paper chose the five vulnerable groups based on the simple random sampling strategy. Additionally, suitable data availability was a strong consideration on the selection process of socially vulnerable groups.
2.9. Data Collection and Process
This study used imagery and statistical data. Imagery data included topographic, featured and spatial distribution maps. Statistical information incorporated the National Population and Housing Census (NPHC) 2011 data on Dhaka City and the data on socio-spatial, demographic and public green spaces of the study areas. We collected population and housing census data from the Bangladesh Bureau of Statistics (BBS), Dhaka, Bangladesh. Data on socially vulnerable groups were also collected from the NPHC. A geo-referenced master map of Dhaka City, which includes the administrative units, was also acquired from the BBS and Google Earth Pro. We extracted raster maps of the study areas and park distribution from Google Earth Pro powered by Google Satellite (www.maps.google.com). A time-distance grid network map was processed and extracted from Google Earth Pro. We collected historical Thana (subdistrict) maps from Banglapedia, an open data source platform for Bangladesh, which is the National Encyclopedia of Bangladesh (www.en.banglapedia.org).
This paper calculated time-distance scores (based on area calculation) from the residential area to public green spaces (parks) by drawing a radius circle around a specific point on the map; this process was achieved using the Free Map Tools (https://www.freemaptools.com/radius-around-point.htm). We showed the spatial distribution of the study areas by making polygons and points on Google Earth Pro. We then performed geo-processing in ArcGIS 10.0. Public green parks were displayed by drawing points.
3. Results
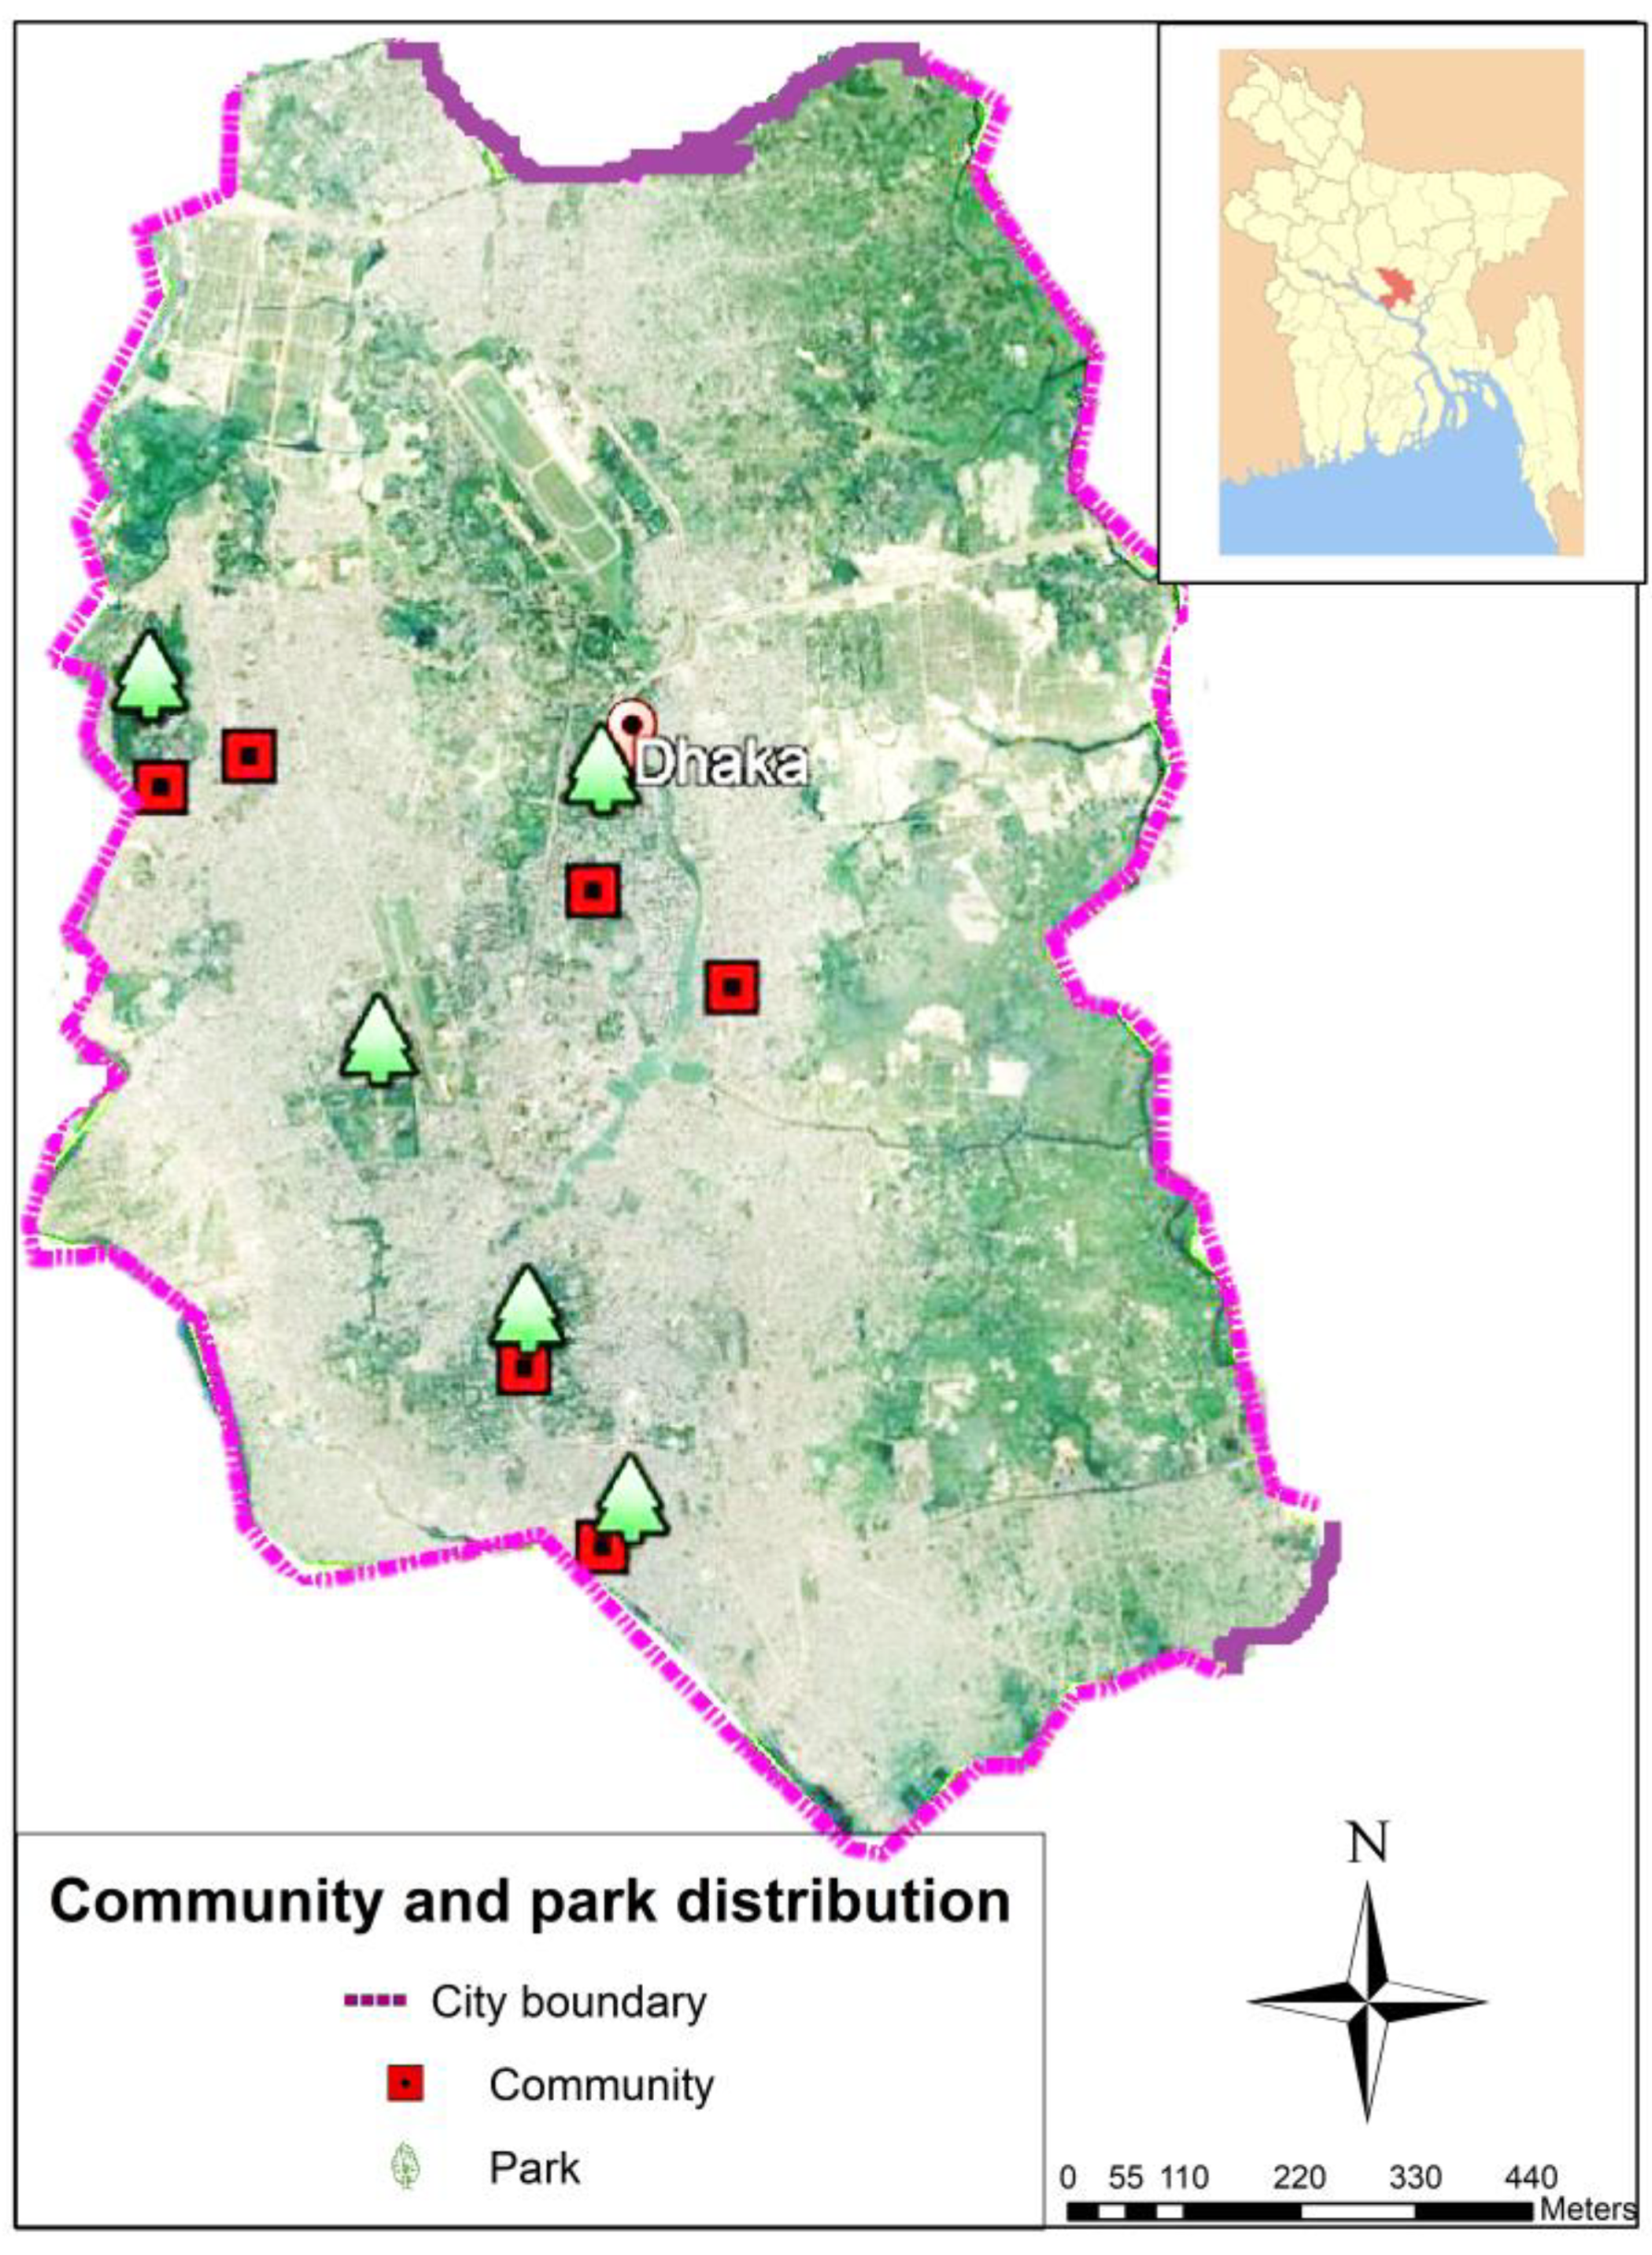
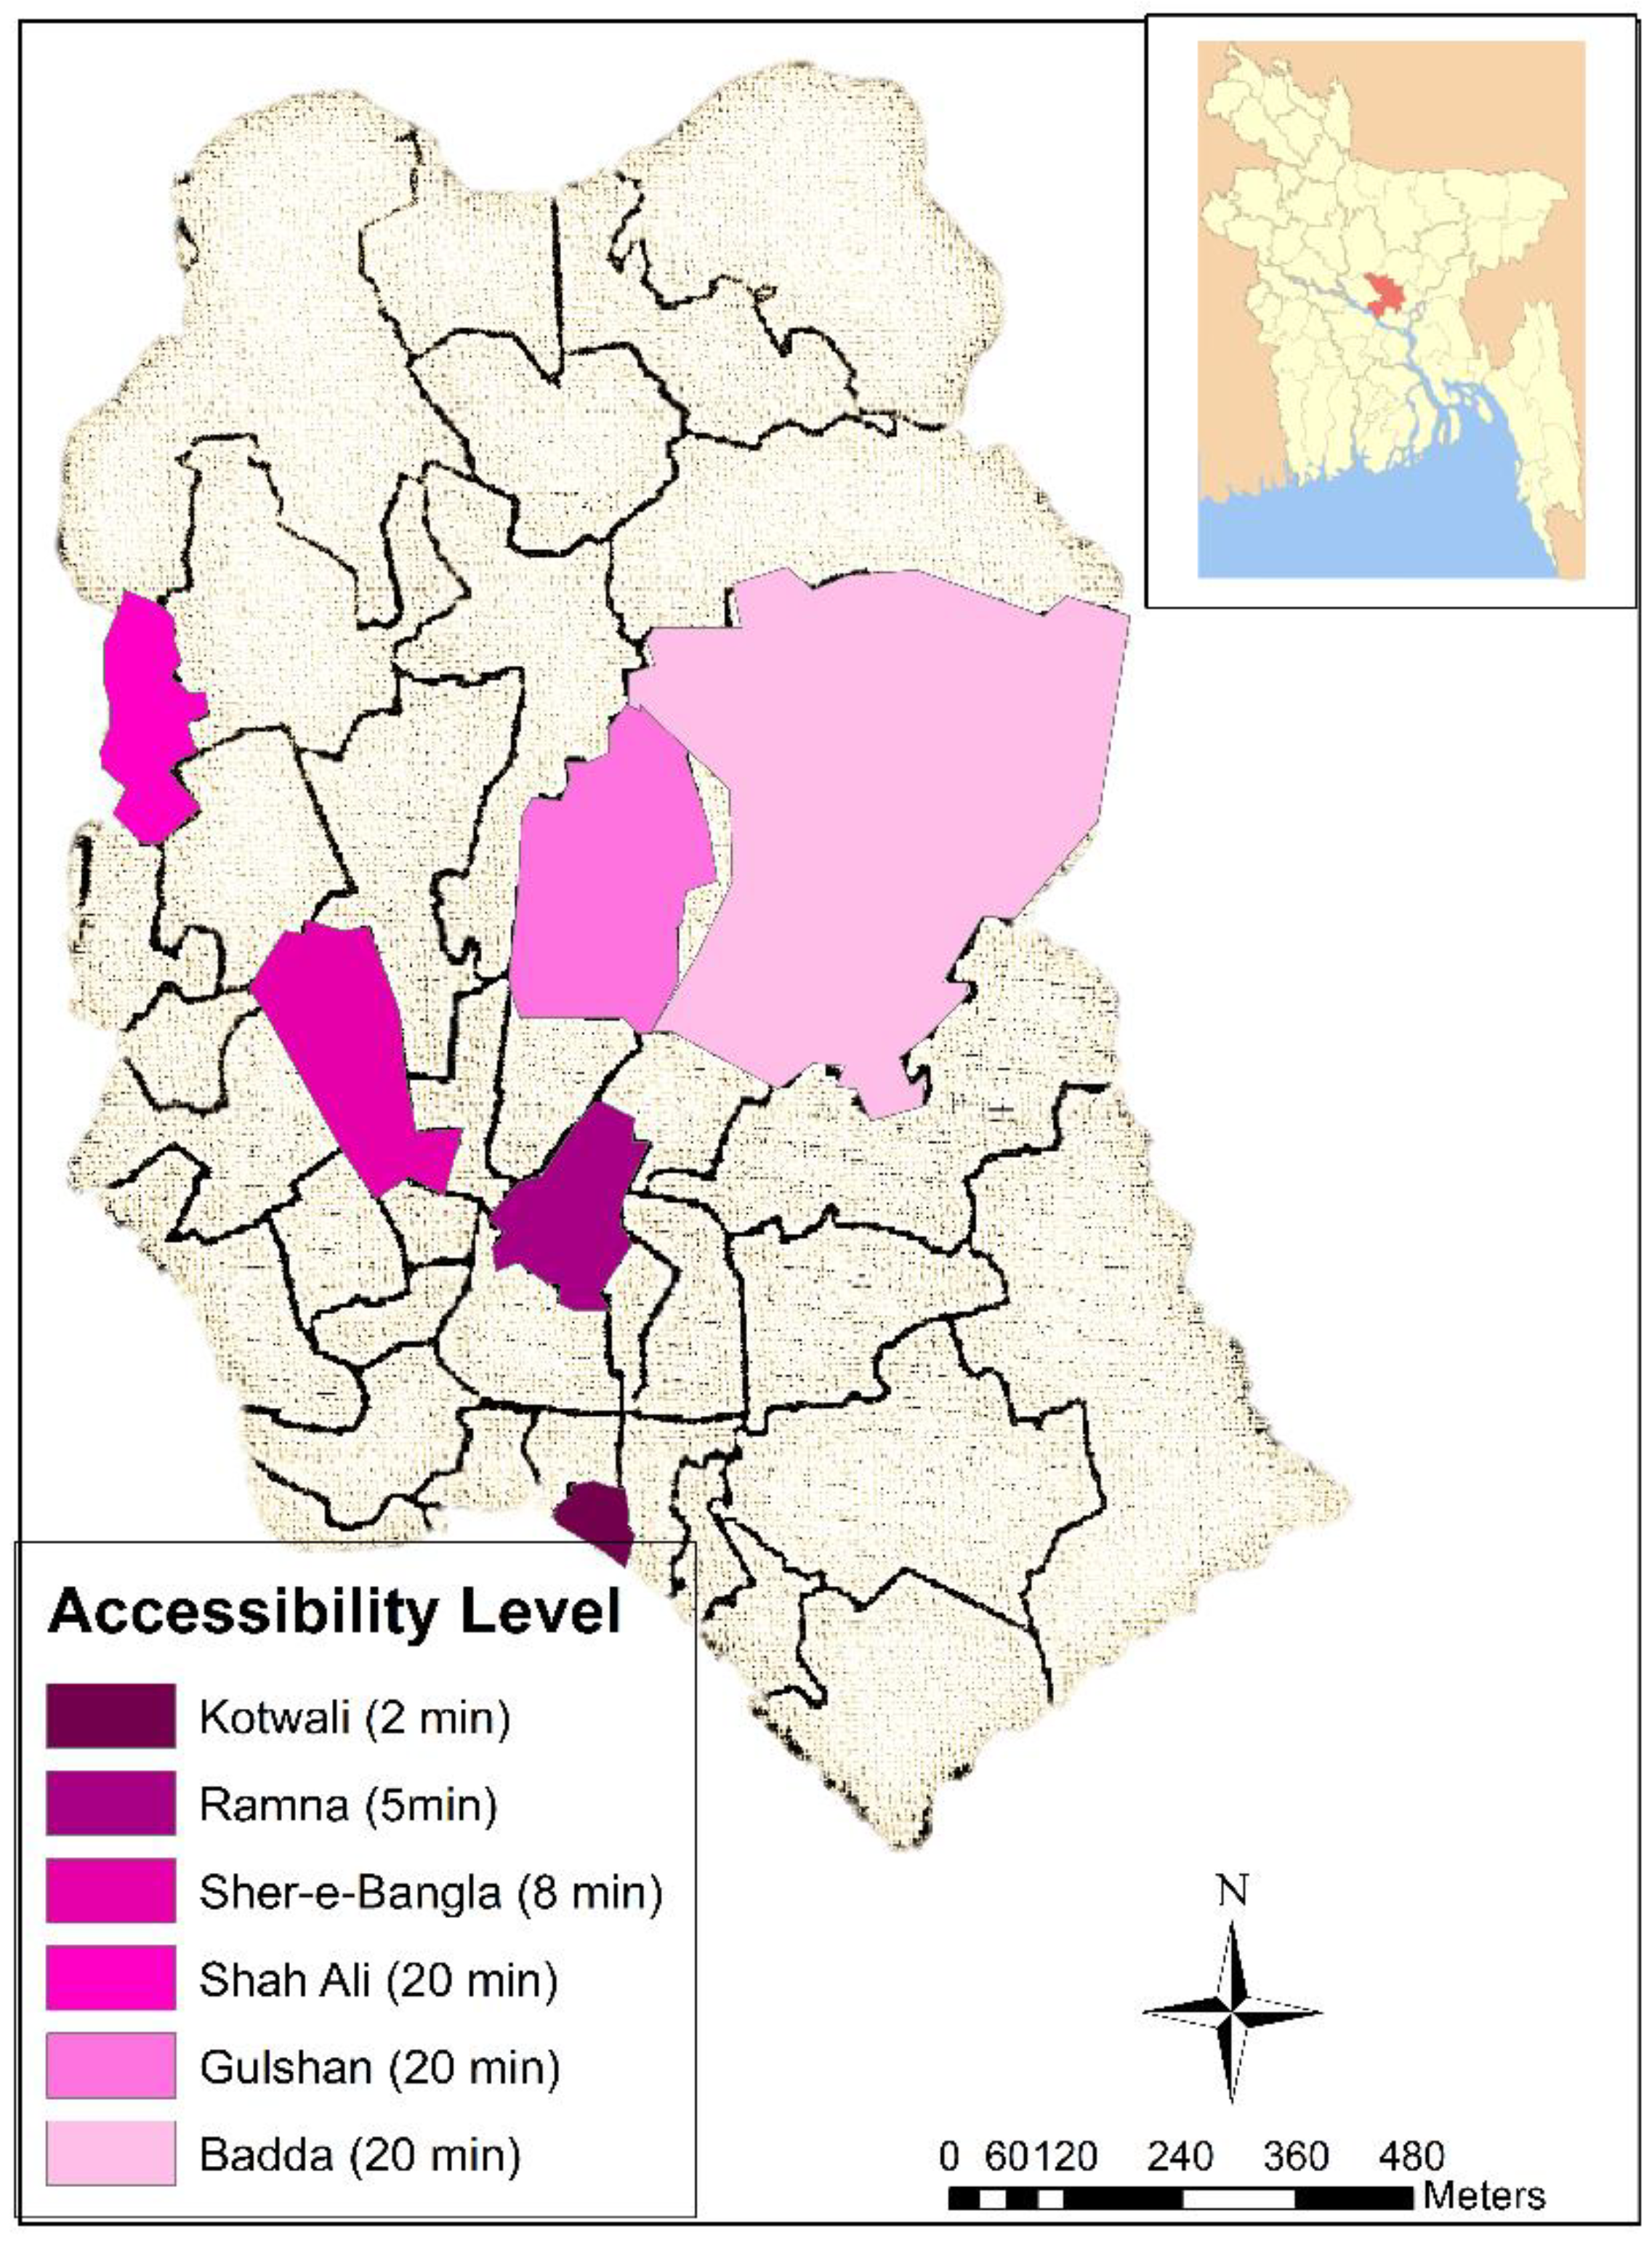
This section predominantly deals with the accessibility index estimation of different classes of people and socially vulnerable groups. We examine the components that affect the accessibility to green parks. Figure 9 presents the spatial distribution of study areas (Thanas) and public green parks. It shows the six areas selected for the study and five green park patches. Figure 10 shows the spatial location of community areas, including the time-weighted scores of accessibility level. Table 3 displays the accessibility level of public green spaces to communities in Dhaka City. It shows that Kotwali has the highest accessibility, with a score of 2.01%. Ramna has good accessibility, with a score of 6.52%. The accessibility of Shah Ali Thana is fair, while Sher-e-Bangla Nagar, Gulshan, and Badda are the least accessible Thanas, with scores of 9.52%, 7.68%, and 5.57%, respectively (Figure 10).
Dwellers in Kotwali Thana can use nearby green parks within the least time. They have a ‘very high good accessibility’ to green patches within a two-min walking distance (Table 3). This is a highly compact and small-sized community area in the older part of Dhaka established for century past. After that, there are green parks in Ramna within a five-min walking distance resulting in a ‘good accessibility’ of the surrounding people to green parks. It is also a compact community area, and the population density is higher. Gulshan and Badda are the ‘poor’ accessible communities, and the residents of these Thana have to get access to nearby green patches in the largest 20-min-way of walk. These are the parts of newly developed areas. These communities have been expanded unplanned and unfair as Badda has no green patches and road connectivity, developed a completely discriminatory way. It is worthy to note that these are the areas of less population density in comparison with other study areas. Figure 6 shows the location of Badda and it is not connected with the city major grid. Figure 6 shows that the North-Eastern part of the city is principally disconnected from the main city grid. Figure 10 and Table 3 shows the accessibility level score of vulnerable group people; and even the travel distance and time are calculated from surrounding green patches to communities in linear way measuring technique. Yuan et al. [31] showed a survey results that accessibility of vulnerable people was the most acceptable when travel time required to reach a green park was less than three minutes on foot (walking speed approximated at between 1.1 and 1.3 m/s). This study used the travel time to calculate the accessibility level score of vulnerable groups.
On the other hand, Shah Ali is the community of a ‘common’ accessibility (Table 3). The users have to spend the largest 20 min to get access to parks on foot. The Thana in the North-Western part of Dhaka, which is a recently developed community with the area of 5.15 km2 (Figure 8) that does not accommodate the high density of population. It clutches two sizable green patches (1.5 km2) and connected to a practical city grid. It was however, the area at an edge corner of North Dhaka City Corporation, far away from the central point of Dhaka. Figure 11 shows the location of the study areas and Figure 10 shows the site and size of six communities. These communities have been selected as they have a pivotal diversification in the consideration of community place, their size, green patches distribution, and spatial, demographic, and connectivity syntax. The communities are characterized by the heterogeneity of human and non-human components that influence the accessibility level to green spaces.
Table 4 shows that Kotwali has the highest and Badda the lowest accessibility to green space (20% and 9.52%, respectively). Ramna, Sher-e-Bangla Nagar, Shah Ali, and Gulshan Thana have accessibility score 12.5%, 11.76%, 10.53%, and 11.96%. Kotwali has the highest population density (98,898/km2) and its community area size is the smallest one of the study areas (Figure 8). On the other hand, Badda has the lowest density (14,566/km2) and the largest size community area. Other communities show almost similar features about the impact of population density and community area size on urban green space accessibility level. Ramna and Gulshan are the second highest accessible community, and their population density is 50,824 and 28,593/km2. Shah Ali has the second lowest accessibility to green patches scoring 10.53% and its population density is also in the second lowest (22,425/km2). It is worthy to note that the total and accessible populations of a community do not have an effect on accessibility level (Table 4). Figure 3 shows that the highest accessibility depends on the community size (small-sized community); however, Table 4 displays that population density influences the highest accessibility level.
Table 5 and Figure 11 show that Sher-e-Bangla Nagar Thana has the ‘pretty high’ (score = 0.61) and Gulshan and Badda have ‘low’ demand level (0.45 and 0.47, respectively). The ‘high’ demand areas include Kotwali, Ramna, and Shah Ali Thana, for which the scores are, respectively, 0.51, 0.52, and 0.53. Figure 6 shows the community area spatial distribution presenting the social demand scale. Figure 8 offers that Sher-e-Bangla Nagar accommodates the highest percentage of the socially vulnerable population (26.56%) and holds the second highest public green parks per head 0.025 m2. Thus, results show that the highest percentage of the socially vulnerable population has an impact on demand for green space.
Spatial Equity Measure
The spatial overlay is a scientific approach to measure the equitability of park distribution according to SDI. We overlaid the accessibility level and demand index results shown in Table 5 above. The results show that the overall spatial equity is low for Sher-e-Bangla Nagar Thana, which has the highest demand for green spaces (parks) and the lowest accessibility. Furthermore, Shah Ali Thana has high accessibility demands, but only has a fair accessibility score. Kotwali and Ramna have high accessibility demands and very good and good accessibility. Gulshan and Badda have low demand and low accessibility, but not an equitable spatial distribution of healthy accessibility to parks.
Table 6 shows that Sher-e-Bangla Nagar has the highest demand and Gulshan and Badda the lowest demand. Kotwali has the highest and Gulshan and Badda the lowest accessibility to urban green public parks. Table 6 shows that Sher-e-Bangla Nagar has the highest demand and Kotwali has the highest accessibility to public green parks in Dhaka.
4. Discussion
This section discusses the results based on the existing literature and scientific arguments so that it can be feasible whether they are significant and rational. We also picked out the key findings through a comparison between present results and previous studies. The results show that Sher-e-Bangla Nagar Thana has a very high demand and Gulshan and Badda have a low demand for green space. Kotwali has very good accessibility and Gulshan and Badda have poor accessibility. Additionally, the outcomes show that the park distribution of Dhaka City is unequal, and unjustified, as the gap between demand and accessibility (supply) is wide. Kotwali and Ramna are the most densely populated (population densities of 101,693 km2 and 48,292 km2, respectively) and smallest (0.68 and 3.84 km2, respectively). The demand and accessibility score of these two Thana are higher than others. Gulshan and Badda have the least demand and accessibility score. The size of these communities is larger and their population density is lower than others. It was found that small sized and densely populated communities have a pivotal effect on the social demand for and accessibility of urban public green parks. Likewise, large-sized and low-density community areas have low social demand and accessibility. The demand index of Sher-e-Bangla Nagar Thana has the highest score, and for this, Thana accommodates the highest proportion of the socially vulnerable population in the study areas (26.56%). The size of the vulnerable population affects the increase of the demand index: If a community area has a high number of socially vulnerable groups, it has a high demand score for urban green public parks.
The results, therefore, showed that Kotwali has a ‘very good’ accessibility, and ‘low’ is for Badda. If we discuss the factors behind the effects, we can view that demographic and geographic factors influence the accessibility level. The community, with densely populated and small-sized, is highly accessible to green parks. Kim et al. [86] conducted a study in Seoul City on the accessibility to health care centers (hospitals). He investigated that small-sized densely populated catchments have the high accessibility to hospitals. Additionally, he could see that large size of hospitals and high-income groups have high accessibility. Dhaka is almost a compact city like Seoul; that is why we opted its findings to this study to prove the accessibility accurateness. We found that a densely populated small-sized community (catchments) has very good accessibility to others.
On the other hand, the study can treasure the significance of the accessibility level if the existing literature are reviewed profoundly. It is conceivable to gauge the spatial value of urban open parks with the accessibility and demand index of people in a socially defenseless group, which can viably describe the reasonableness and social value of urban environmental space [32]. Green space accessibility can be expanded either by enhancing the walking courses or by building more small-to-medium sized green space patches that can cover the area [87]. Urban public park accessibility is highly important, since without adequate accessibility, the provision of good quality open spaces would be of very limited value. There have been investigations into the current situation of accessibility of urban public parks for planned and unplanned city neighborhoods [88]. Road parks or ground squares in Hong Kong are frequently brought together and disconnected from places of business, which require dynamic visits with particular purposes and expectations [89]. Singapore, however, has built up a model “City in a Garden”, which has a coordinated nature with structures in daily life [79]. Most open green spaces in Singapore are intended to coordinate building structures in daily travel schedules [90]. Open green spaces in a network effectively affect community connection [25], with a unified open green space design having a more prominent impact than scattered open green spaces. Existing studies showed that accessibility pivots on green space size, walk way of green patches, and quality of open parks. Additionally, accessibility (nature attachment) in Singapore hinged on the nature coordinated structures as it is a highly compact city (difficult to greening expansion horizontally there). However, this study estimated the effects of community size on the accessibility level of green space.
By applying the Gini coefficient, research has shown that there are disparities in green space arrangement in major German cities. Additionally, solid incongruities identified in green space arrangement at a city level ranged from 2.5 m2 per capita (city of Schwerin) to 36.3 m2 (city of Bergisch Gladbach) within a 500 m buffer around the place of home [91]. Discernments of distance to travel were the major obstructions to the frequent use of peri-urban green spaces. Additionally, it is worth noting that green passages empower agreeable and simple access to semi-natural spaces in and around the city [92]. The accessibility to hierarchy (characterized based on work and size) of UGS is basic for the visiting and ideal utilization of UGS since it advances social interaction and physical movement among city populations [93]. Another study expressed diverse scenarios in terms of the rank of green space accessibility, unequivocally impacted by the chosen distance metric (Euclidean vs. Network) [94]. The works revealed that unequal green space distribution, travel distance to and from residence, and park size and quality have an impact on accessibility to green space, but this work displayed that the density of population and the size of green space influence the accessibility level. On the other hand, vulnerable people’s demand for green park attachment turns on the population size of vulnerable groups in a particular community.
The existing literature predominantly focuses on the spatial equity of public green spaces, the impact of the size of green patches on accessibility, the quantity or quality of the role of public parks in accessibility, the greening approach or model, and the impact of urban planning on urban greening. Few studies have highlighted the health and ecological effects of public green spaces [10]. The present study investigated the factors affecting the social demand and accessibility level of urban green public parks. Two studies showed that disparity in green space arrangement, green passage, and hierarchy of UGS influences the accessibility level. The effects of community area size and population density on accessibility to public UGS has not yet been investigated.
This study made several new findings, including that: (1) The size of the socially vulnerable population in a certain community has an effect on increased demand to gain access to UGS; (2) population density affects the accessibility of parks; and (3) the size of a certain community area influences the accessibility. If a community area has a high number of socially vulnerable groups, it has a high score of demand for urban green public parks. A community with a high population density begets high accessibility to green parks; likewise, a small-sized community area provides high accessibility.
We collected demographic and geographical data from the BBS and faced a few difficulties due to the official service process. The data, to some extent, is inadequate and the data sorting process was time consuming. These are the limitations of the study. Moreover, patient (diabetes), children, and elderly people are seriously vulnerable in Dhaka and they needed to be included in this study. But they could not be incorporated in the study due to insufficient demographic data. Additionally, due to very compactness, traffic congestion, unzone residential and administrative boundary, unavailability of green patches, the perfectness of accessibility, and demand level calculation might not be adequate enough to a few extent.
Dhaka is a densely populated city that is comparable to the Singapore model and its approaches to the urban greening process. Urban greening is a crucial component of health and ecological wellbeing. As land reclamation in the horizontal level is almost impossible, vertical greening is a prime solution for compact cities. Singapore presently performs vertical gardening or greening (green wall, sky garden, green roof, pervasive greening, verdant wall, green building, and roof playground). In view of the Representative Green Features in Singapore Compact Land Use Policy, the green surface region in Singapore will reach 328.7 km2, which will account for around 46.3% of Singapore’s property territory in 2030 [95]. The study recommends further research on the following question:
- How to develop a ‘green space creation model’ for women and children in the densely populated urban communities?
Particularly adult women and middle school children of middle and upper social classes are getting vulnerable with obesity, overweight, and diabetes. The prevalence of overweight and obesity was found 20.5% and 24.1 %, respectively, and also the prevalence of overweight and obesity among boys were 16.4% and 26.9%, respectively, and for girls were 26.7% and 20.0%, respectively, in Dhaka middle school children [96]. Even, the overall prevalence of diabetes is 11 %, and the prevalence is slightly higher in women (11.2 %) than men (10.6 %) in Bangladesh [97]. In this regard, open green space can mitigate these challenges providing physical exercise and recreational facilities. Increasing pressure of urban population, environmental pollution is causing a serious threat for the dwellers especially the vulnerable groups’ people. Nearly one million people in Bangladesh, mostly poor, are at risk of air and noise pollution, which can lead to IQ loss and neurological damage, especially for children, and can increase the risk of miscarriage and stillbirth among pregnant women [57]. In this regard, green space might be the mitigation source of health hazards of women and children. However, traffic congestion and insecurity in Dhaka are the vital disturbance in the cutting down of the accessibility of women and children to green patches. Open green space is getting decreased along with the rise of built up areas. Planners and researchers can attempt to develop a ‘green space creation model’ for women and children to address the challenges. On the other hand, compact city governance has to adopt, gradually, the initiative for establishing the ‘smart city’, as its utility, safety, accessibility, and efficiency are sustainable. When a city will turn into a smart city, it will run through a sustainable digital system that everything (including green space for vulnerable people) will come under a unique system [98]
5. Conclusions
This study can draw three key findings: (1) The large size of socially vulnerable groups generates ‘very high demand’ for public UGS; (2) densely populated areas have ‘very good accessibility’ to green parks; and (3) small-sized community areas provide ‘very good accessibility’ as well. It is worth noting that people in small-sized community areas can find green space patches within walking distance (within 2–5 min or 200–500 m). However, the population of a large area cannot reach green parks because, in Dhaka, green space patches are inadequate. The Southern part of Dhaka is regarded as the old city, and consists of small-sized and high-density community areas. These areas were constructed during British colonial periods and the number of green public space patches constructed in that period was remarkably high [99]. However, the newly developed Northern part of Dhaka lacks green patches as a result of land scarcity due to the pressure of migration. As a result, Kotwali and Ramna Thanas, which are located in the older part of Dhaka, have high accessibility. The population density in these areas is also high compared to the newer part of Dhaka City.
Dhaka is expanding in all directions, and especially in the Northern and Eastern parts. The municipal government can adopt a legal and planning initiative so that newly expanded urban dwellers or organizations must ensure 9 m2 per capita (WHO recommended) of green space on their construction works. Governmental and non-governmental organizations should come forward to build social awareness of the benefits of UGS. Existing green spaces can be highly effective by having initiative for park equipment, fundraising, security, natural settings, utility service, special arrangements for vulnerable groups, and cultural events. Dhaka is city with high levels of diabetes, hypertension, obesity and pollution, and as such there is no alternative to increasing accessibility to UGS.
These findings are highly useful to urban planners, landscape engineers, urban governance and policymakers. Policymakers can formulate urban management policies by bearing in mind these findings. They can divide large-sized Thanas into smaller ones, and in large-sized Thanas, they can set up small green patches in consideration of population density. Moreover, vertical greening is an efficient solution in compact cities. Urban planners can also plan new urban areas according to these findings. This means that green space construction increases instead of horizontal expansion in land. Dhaka is a highly compact city where land cannot be acquired horizontally for green zones. Apart from, “smart city” concept is highly recommended to adopt as a sustainable management tool of Dhaka Megacity as well as other compact cities. It is argued that smart cities research has the potential of contributing to research on megacities (smart megacities and clusters), cities (smart cities) and villages (smart villages) [100]. It is argued that smart cities research needs to be based on real tangible experiences of individuals inhabiting rural and urban space and that it also needs to mirror and feed into policy-design and policymaking processes [100]. In order to manage Dhaka Megacity sustainably, the “smart city” notion might be the smart solution in this modern technological age.
In Singapore, modern advancements must include plant life, within the frame of green rooftops, cascading vertical gardens, and verdant dividers. The thrust to “go green” extends to development as well; green building has been obligatory since 2008 [91]. In Marina Bay, all advancements comply with a 100% greenery substitution approach. The Pinnacle@Duxton, the tallest public housing improvement in the world, has seven 50-story buildings connected by gardens on the 26th and 50th floors [95]. The Singapore urban vertical greening model might be a fruitful approach in densely populated cities. Vertical greening is therefore a rational approach to increase the green system. The roofs of large-sized buildings (public or private) can be used as playgrounds with a greenery setting. Balconies, windows, indoor furniture tops, and building walls can also be used to host greenery to mitigate indoor pollution. Footpaths, home and office premises and wetlands might be turned into micro gardens in Dhaka as well as in other compact cities across the world. By this way, all walks of people can have access to the benefits of a greenery system directly and indirectly.
Author Contributions
D.Z. conceptualized and administered the study and analyzed the data of the research work, and K.M.A.R. collected data and wrote the paper.
Funding
This research was funded by Reza Printers of Dhaka, Bangladesh (RP001/2018).
Acknowledgments
We are thankful to respected editors and reviewers as their valued comments and suggestions helped us to write the paper.
Conflicts of Interest
The authors declare no conflict of interest.
References
- Klaufus, C.; van Lindert, P.; van Noorloos, F.; Steel, G. All-Inclusiveness versus Exclusion: Urban Project Development in Latin America and Africa. Sustainability 2017, 9. [Google Scholar] [CrossRef]
- Kothencz, G.; Kolcsár, R.; Cabrera-Barona, P.; Szilassi, P. Urban Green Space Perception and Its Contribution to Well-Being. Int. J. Environ. Res. Public Health 2017, 14. [Google Scholar] [CrossRef] [PubMed]
- Lee, A.C.K.; Maheswaran, R. The health benefits of urban green spaces: A review of the evidence. J. Public Health 2011, 33, 212–222. [Google Scholar] [CrossRef] [PubMed]
- Maas, J.; Verheij, R.A.; Groenewegen, P.P.; de Vries, S.; Spreeuwenberg, P. Green space, urbanity, and health: How strong is the relation? J. Epidemiol. Commun. Health 2009, 60, 587–592. [Google Scholar] [CrossRef] [PubMed]
- Liu, Y.; Wang, Y.; Peng, J.; Du, Y.; Liu, X.; Li, S.; Zhang, D. Correlations between Urbanization and Vegetation Degradation across the World’s Metropolises Using DMSP/OLS Nighttime Light Data. Remote Sens. 2015, 7. [Google Scholar] [CrossRef]
- Bowler, D.E.; Buyung-Ali, L.M.; Knight, T.M.; Pullin, A.S. A Systematic Review of Evidence for the Benefits to Healthcare of Exposure to Natural Environments. BMC Public Health 2010, 10, 456. [Google Scholar] [CrossRef] [PubMed]
- Cohen, G.L.; Sherman, D.K. Psychology of Change: Self-Affirmation and Socio-Psychological Intervention. Annu. Rev. Psychol. 2014, 65, 333–371. [Google Scholar] [CrossRef] [PubMed]
- Escobedo, F.J.; Kroeger, T.; Wagner, J.E. Urban Forest and Pollution Mitigation: Analyzing Ecosystem Service and Disservice. Environ. Pollut. 2011, 159, 2078–2087. [Google Scholar] [CrossRef] [PubMed]
- Hamada, S.; Ohta, T. Seasonal variations amid the cooling effect of urban green areas on nearby surrounding urban areas. Urban For. Urban Green. 2010, 9, 15–24. [Google Scholar] [CrossRef]
- Costanza, R.; Limburg, K.; Naeem, S.; O’Neill, R.V.; Paruelo, J.; Raskin, R.G.; Sutton, P. The value of the world’s ecosystem services and natural capital. Nature 1997, 387, 8. [Google Scholar] [CrossRef]
- Madureira, H.; Nunes, F.; Oliveira, J.V.; Madureira, T. Preferences for Urban Green Space Characteristics-A Comparative Study in Three Cities of Portuguese. Environments 2018, 5, 23. [Google Scholar] [CrossRef]
- Arnberger, A.; Eder, R. Are urban visitors’ general preferences for green-spaces similar to their preferences while seeking stress relief? Urban For. Urban Green. 2015, 14, 872–882. [Google Scholar] [CrossRef]
- Chen, J.; Chang, Z. Rethinking Urban Green Space Accessibility: Evaluating and Optimizing Public Transportation System through Social Network Study in Megacities. Landsc. Urban Plan. 2015, 143, 150–159. [Google Scholar] [CrossRef]
- Coolen, H.; Meesters, J. Private and Public Green Spaces: Meaningful but Different Settings. J. Hous. Built Environ. 2011, 27, 49–67. [Google Scholar] [CrossRef]
- Madureira, H.; Andresen, T.; Monteiro, A. Green Structure and Planning Evolution in Porto. Urban For. Urban Green. 2011, 10, 141–149. [Google Scholar] [CrossRef]
- Shanahan, D.F.; Lin, B.B.; Bush, R.; Gaston, K.J.; Dean, J.H.; Barber, E.; Fuller, R.A. Toward Improved Health Outcomes from Urban Nature. Am. J. Public Health 2015, 105, 470–477. [Google Scholar] [CrossRef] [PubMed]
- Kabisch, N.; Qureshi, S.; Haase, D. Human-environment interactions in urban green spaces: A systematic review of contemporary issues and prospects for future research. Environ. Impact Asses. 2015, 50, 25–34. [Google Scholar] [CrossRef]
- Richardson, E.A.; Mitchell, R.; Hartig, T.; de Vries, S.; Astell-Burt, T.; Frumkin, H. Green cities and health: A question of scale? J. Epidemiol. Commun. Health 2012, 66, 160. [Google Scholar] [CrossRef] [PubMed] [Green Version]
- White, M.P.; Alcock, I.; Wheeler, B.W.; Depledge, M.H. Would You Be Happier Living in a Greener Urban Area? A Fixed-Effects Analysis of Panel Data. 2013. Available online: http://0-journals-sagepub-com.brum.beds.ac.uk/doi/abs/10.1177/0956797612464659#articleShareContainer (accessed on 19 September 2018).
- Elmqvist, T.; Setälä, H.; Handel, S.N.; van der Ploeg, S.; Aronson, J.; Blignaut, J.N.; Gómez-Baggethun, E.; Nowak, D.J.; Kronenberg, J.; de Groot, R. Benefits of restoring ecosystem services in urban areas. Curr. Opin. Environ. Sustain. 2015, 14, 101–108. [Google Scholar] [CrossRef] [Green Version]
- Hartig, T.; Mitchell, R.; de Vries, S.; Frumkin, H. Nature and Health. Annu. Rev. Public Health 2014, 35, 207–228. [Google Scholar] [CrossRef] [PubMed] [Green Version]
- Keniger, L.E.; Gaston, K.J.; Irvine, K.N.; Fuller, R.A. What are the Benefits of Interacting with Nature? Int. J. Environ. Res. Public Health 2013, 10, 913–935. [Google Scholar] [CrossRef] [PubMed] [Green Version]
- Chiesura, A. The role of urban public parks for the sustainable city. Landsc. Urban Plan. 2004, 68, 129–138. [Google Scholar] [CrossRef]
- Landers, D.H.; Nahlik, A.M. Final Ecosystem Goods and Services Classification System (FEGS-CS); (EPA/600/R-13/ORD-004914); U.S. Environmental Protection Agency, Office of Research and Development: Washington, DC, USA, 2013.
- Tsai, W.-L.; McHale, R.M.; Jennings, V.; Marquet, O.; Hipp, A.J.; Leung, Y.-F.; Floyd, F.M. Relationships between Characteristics of Urban Green Land Cover and Mental Health in U.S. Metropolitan Areas. Int. J. Environ. Res. Public Health 2018, 15. [Google Scholar] [CrossRef] [PubMed]
- Wolch, J.R.; Byrne, J.; Newell, J.P. Urban Green Space, Public Health, and Environmental Justice- the Challenge of Making Cities ‘Just Green Enough’ . Landsc. Urban Plan. 2014, 125, 234–244. [Google Scholar] [CrossRef]
- Gong, F.; Zheng, Z.-C.; Ng, E. Modeling Elderly Accessibility to Urban Green Space in High-Density Cities: A Case Study of Hong Kong. Procedia Environ. Sci. 2016, 36, 90–97. [Google Scholar] [CrossRef]
- Barbosa, O.; Tratalos, J.A.; Armsworth, P.R.; Davies, R.G.; Fuller, R.A.; Johnson, P.; Gaston, K.J. Who Benefits from Access to Green Space? A Case Study of Sheffield, UK. Landsc. Urban Plan. 2007, 83, 187–195. [Google Scholar] [CrossRef]
- Kardan, O.; Gozdyra, P.; Misic, B.; Moola, F.; Palmer, L.J.; Paus, T.; Berman, M.G. Neighborhood Green Space, and Health in a Large Urban Setting. Sci. Rep. 2015, 5, 11610. [Google Scholar] [CrossRef] [PubMed]
- Lindsey, G.; Maraj, M.; Kuan, S.C. Access, Equity, and Urban Greenways: An Exploratory Investigation. Prof. Geogr. 2001, 53, 332–346. [Google Scholar] [CrossRef]
- Yuan, Y.; Xu, J.; Wang, Z. Spatial Equity Measure on Urban Ecological Space Layout Based on the Accessibility of Socially Vulnerable Groups: A Case Study of Changting, China. Sustainability 2017, 9, 1552. [Google Scholar] [CrossRef]
- Talen, E.; Anselin, L. Assessing spatial equity: An evaluation of the measures of accessibility to public playgrounds. Environ. Plan. 1998, 30, 595–613. [Google Scholar] [CrossRef]
- Rao, N.D.; Min, J. Decent Living Standards: Material Prerequisites for Human Wellbeing. Soc. Indic. Res. 2018, 138, 225–244. [Google Scholar] [CrossRef] [PubMed]
- Mitchell, R.K.; Busenitz, L.W.; Bird, B.; Gaglio, C.M.; McMullen, J.S.; Morse, E.A.; Smith, J.B. The Central Question in Entrepreneurial Cognition Research 2007. Entrep. Theory Pract. 2007, 31, 1–27. [Google Scholar] [CrossRef]
- Sugiyama, T.; Leslie, E.; Giles-Corti, B.; Owen, N. Associations of neighbourhood greenness with physical and mental health: Do walking, social coherence and local social interaction explain the relationships? J. Epidemiol. Commun. Health 2008, 62, e9. [Google Scholar] [CrossRef]
- Hunter, C.; Fitzpatrick, R.; Jenkinson, C.; Darlington, A.-S.E.; Coulter, A.; Forder, J.E.; Peters, M. Perspectives from health, social care and policy stakeholders on the value of a single self-report outcome measure across long-term conditions: A qualitative study. BMJ Open 2015, 5, e006986. [Google Scholar] [CrossRef] [PubMed] [Green Version]
- Fan, P.; Xu, L.; Yue, W.; Chen, J. Accessibility of Public Urban Green Space in an Urban Periphery: The Case of Shanghai. Landsc. Urban Plan. 2017, 165, 177–192. [Google Scholar] [CrossRef]
- de Vries, A.L.C.; McGuire, J.K.; Steensma, T.D.; Wagenaar, E.C.F.; Doreleijers, T.A.H.; Cohen-Kettenis, P.T. Young adult psychological outcome after puberty suppression and gender reassignment. Pediatrics 2014, 134, 696–704. [Google Scholar] [CrossRef] [PubMed]
- Sadler, D.R. Beyond feedback: Developing student capability in complex appraisal. Assess. Eval. Higher Educ. 2010, 35, 535–550. [Google Scholar] [CrossRef]
- Papa, F.; Prigent, C.; Aires, F.; Jimenez, C.; Rossow, W.B.; Matthews, E. Interannual variability of surface water extent at the global scale, 1993–2004. J. Geophys. Res. 2010, 115. [Google Scholar] [CrossRef] [Green Version]
- Hansen, W.G. How Accessibility Shapes Land Use. J. Am. Inst. Planners 1959, 25, 73–76. [Google Scholar] [CrossRef]
- Ingram, D.R. The concept of accessibility: A search for an operational form. Reg. Stud. 1971, 5, 101–107. [Google Scholar] [CrossRef]
- Dalvi, M.Q.; Martin, K.M. The Measurement of Accessibility: Some Preliminary Results. Transportation 1976, 5, 17–42. [Google Scholar] [CrossRef]
- Morris, J.M.; Dumble, P.L.; Wigan, M.R. Accessibility Indicators of Transport Planning. Transp. Res. Part A Gen. 1979, 13, 91–109. [Google Scholar] [CrossRef]
- Van Wee, B.; van Cranenburgh, S. Substitutability as a concept to understand travel behavior, and its implications. In Proceedings of the BIVEC-GIBET Transport Research Days 2017: Towards an Autonomous and Interconnected Transport Future, Liège, Belgium, 18 May 2017; pp. 1–18. [Google Scholar]
- Ferreira, R.; Eberharter, A.; Bonaldi, T.; Chioda, M.; Imhof, A.; Becker, P.B. Site-specific acetylation of ISWI by GCN5. BMC Mol. Biol. 2007, 8, 73. [Google Scholar] [CrossRef] [PubMed]
- Zhou, X.; Parves, R.M. Social benefits of urban green space-a conceptual framework of valuation and accessibility measurements. Manag. Environ. Qual. Int. J. 2012, 23, 173–189. [Google Scholar] [CrossRef]
- Heynen, N.; Perkins, H.A.; Roy, P. The Political Ecology of Uneven Urban Green Space: The Impact of Political Economy on Race and Ethnicity in Producing Environmental Inequality in Milwaukee. Urban Aff. Rev. 2006, 42, 3–25. [Google Scholar] [CrossRef]
- Byomkesh, T.; Nakagoshi, N.; Dewan, A.M. Urbanization and green space dynamics in Greater Dhaka, Bangladesh. Landsc. Ecol. Eng. 2012, 8, 45–58. [Google Scholar] [CrossRef]
- United Nations Environment Programme (UNEP). Annual Report; UNEP: Nairobi, Kenya, 2006. [Google Scholar]
- Dewan, A.M.; Yamaguchi, Y. Using remote sensing and GIS to detect and monitor land use and land cover change in Dhaka Metropolitan of Bangladesh during 1960–2005. Environ. Monit. Assess. 2008, 150, 237. [Google Scholar] [CrossRef] [PubMed]
- Bangladesh Center for Advanced Studies, BCAS. Report on local level environmental governance. In Delegation of the European Commission; BCAS: Dhaka, Bangladesh, 2006. [Google Scholar]
- Francis, C.; Lieblein, G.; Gliessman, S.; Breland, T.A.; Creamer, N.; Harwood, R.; Salomonsson, L.; Helenius, J.; Rickerl, D.; Salvador, R.; et al. Agroecology: The Ecology of Food Systems. J. Sustain. Agric. 2003, 22, 99–118. [Google Scholar] [CrossRef]
- Bai, X.; Fernandez, I.S.; McMullan, G.; Scheres, S.H. Ribo-some Structures to Near-Atomic Resolution from Thirty Thousand Cryo-EM Particles. eLife 2013, 2, e00461. [Google Scholar] [CrossRef] [PubMed]
- Shakil, M.R.H. Systematic Persecution of Religious Minorities: Bangladesh Perspective. IOSR J. Hum. Soc. Sci. 2013, 7, 9–17. [Google Scholar] [CrossRef]
- Mechanic, D.; Tanner, J. Vulnerable people, groups, and populations: Societal view. Health Aff. (Millwood) 2007, 26, 1220–1230. [Google Scholar] [CrossRef] [PubMed]
- Aday, L.A. At Risk in America: The Health and Health Care Needs of Vulnerable Populations in the United States; Jossey-Bass Publishers: San Francisco, CA, USA, 1993. [Google Scholar]
- The daily Star. Dhaka, Asia’s Most Stressful City; The Daily Star: Dhaka, Bangladesh, 2017; Available online: https://www.thedailystar.net/editorial/dhaka-asias-most-stressful-city-1470055 (accessed on 8 October 2018).
- The Daily Star. Pollution the Killer; The Daily Star: Dhaka, Bangladesh, 2018; Available online: https://www.thedailystar.net/environment/environment-pollution-in-dhaka-bangladesh-18000-died-world-bank-report-1634566 (accessed on 6 October 2018).
- Segura-Ortí, E.; Martínez-Olmos, F.J. Test-Retest Reliability and Minimal Detectable Change Scores for Sit-to-Stand-to-Sit Tests, the Six-Minute Walk Test, the One-Leg Heel-Rise Test, and Handgrip Strength in People Undergoing Hemodialysis. Phys. Ther. 2011, 91, 1244–1252. [Google Scholar] [CrossRef] [PubMed] [Green Version]
- Khan, M. A Study of Open Spaces in the Context of Dhaka City for Sustainable Use: A Syntactic Approach. Int. J. Adv. Eng. Tech. 2014, 6, 238–243. [Google Scholar] [CrossRef]
- Nilufar, M. Social Inter-Mediation: Towards Gaining Access to Water for Squatter Communities in Dhaka (English); Water and Sanitation Program; World Bank: Washington, DC, USA, 1999; Available online: http://documents.worldbank.org/curated/en/101921468205459871/Social-inter-mediation-towards-gaining-access-to-water-for-squatter-communities-in-Dhaka (accessed on 25 April 2018).
- Zhang, Y.J.; Tarrant, M.A.; Green, G.T. The importance of differentiating urban and rural phenomena in examining the unequal distribution of locally desirable land. J. Environ. Manag. 2008, 88, 1314–1319. [Google Scholar] [CrossRef] [PubMed] [Green Version]
- Tian, Y.; Jim, Y.C.; Liu, Y. Using a Spatial Interaction Model to Assess the Accessibility of District Parks in Hong Kong. Sustainability 2017, 9. [Google Scholar] [CrossRef]
- Chen, J.; Chang, Z. Rethinking urban green space accessibility: Evaluating and optimizing public transportation system through social network analysis in megacities. Landsc. Urban Plan. 2015, 150–159. [Google Scholar] [CrossRef]
- Ekkel, E.D.; de Vries, S. Nearby Green Space and Human Healthcare- Evaluating Accessibility Metrics. Landsc. Urban Plan. 2017, 157, 214–220. [Google Scholar] [CrossRef]
- Mannan, H.; ElTayeb, S.; MacLachlan, M.; Amin, M.; McVeigh, J.; Munthali, A.; Van Rooy, G. Core concepts of human rights and inclusion of vulnerable groups in the mental health policies of Malawi, Namibia, and Sudan. Int. J. Ment. Health Syst. 2013, 7, 7. [Google Scholar] [CrossRef] [PubMed]
- Self-selected gait speed: A critical clinical outcome. Available online: http://lermagazine.com/article/self-selected-gait-speed-a-critical-clinical-outcome (accessed on 17 October 2018).
- Flaskerud, J.H.; Winslow, B.J. Conceptualizing vulnerable populations’ health-related research. Nurs. Res. 1998, 47, 69–78. [Google Scholar] [CrossRef] [PubMed]
- Douka, K.; Bergman, C.A.; Hedges, R.E.M.; Wesselingh, F.P.; Higham, T.F.G. Chronology of Ksar Akil (Lebanon) and implications for the colonization of Europe by anatomically modern humans. PLoS ONE 2013, 8, e72931. [Google Scholar] [CrossRef] [PubMed]
- Huang, C.; Yang, J.; Lu, H.; Huang, H.; Yu, L. Green Spaces as an Indicator of Urban Health: Evaluating Its Changes in 28 Mega-Cities. Remote Sens. 2017, 9, 1266. [Google Scholar] [CrossRef]
- World Health Organization (WHO). Urban Green Spaces and Health: A Survey of Evidence; World Wellbeing Organization: Geneva, Switzerland, 2016. [Google Scholar]
- Annerstedt van den Bosch, M.; Mudu, P.; Uscila, V.; Barrdahl, M.; Kulinkina, A.; Staatsen, B.; Swart, W.; Kruize, H.; Zurlyte, I.; Egorov, A.I. Development of an urban green space indicator and the public health rationale. Scand. J. Public Health 2016, 44, 159–167. [Google Scholar] [CrossRef] [PubMed]
- Yin, H.W.; Kong, F.H.; Zong, Y.G. Accessibility and equity assessment on urban green space. Acta Ecol. Sin. 2008, 28, 3375–3383. [Google Scholar]
- Bangladesh Bureau of Statistics (BBS). National Population and Housing Census 2011; BBS: Dhaka, Bangladesh, 2015. [Google Scholar]
- World Bank. A Modern Dhaka Is Key to Bangladesh’s Upper-Middle Income Country Vision; World Bank: Washington, DC, USA, 2017; Available online: https://www.worldbank.org/en/news/press-release/2017/07/19/modern-dhaka-key-bangladesh-upper-middle-income-country-vision (accessed on 10 September 2018).
- Dhaka City Corporation (DCC). Municipal Services and Performance; DCC: Dhaka, Bangladesh, 2013. Available online: http://www.dncc.gov.bd/site/page/c0b6953f-16d3-405b-85e9-dece13bb98de/%E0%A6%B2%E0%A7%8B%E0%A6%95%E0%A7%87%E0%A6%B6%E0%A6%A8-%E0%A6%93-%E0%A6%85%E0%A6%BE%E0%A7%9F%E0%A6%A4%E0%A6%A8 (accessed on 12 September 2018).
- Swapan, S.M.; Zaman, U.A.; Ahsan, T.; Ahmed, F. Transforming Urban Dichotomies and Challenges of South Asian Megacities: Rethinking Sustainable Growth of Dhaka, Bangladesh. Urban Sci. 2017, 1. [Google Scholar] [CrossRef]
- Hough, M. Cities and Natural Process; Rutledge: London, UK, 2004; pp. 64–65. ISBN 0-415-29855-5. [Google Scholar]
- Mondal, M.A.L. Trends of Urbanization in Bangladesh. The Daily Star. 20 September 2006. Available online: http://archive.thedailystar.net/suppliments/2006/15thanniv/ourcities/ourcities28.htm (accessed on 26 October 2018).
- Ahmed, B.; Kamruzzaman, M.; Zhu, X.; Rahman, M.; Choi, K. Simulating Land Cover Changes and Their Impacts on Land Surface Temperature in Dhaka, Bangladesh. Remote Sens. 2013, 5, 5969–5998. [Google Scholar] [CrossRef] [Green Version]
- Asia Times. Planet of Slums by Mike Davis. Asia Times. 20 May 2006. Available online: http://www.atimes.com/atimes/Front_Page/HE20Aa01.html (accessed on 8 May 2010).
- Bangladesh Bureau of Statistics (BBS). 2011 Population and Housing Census: Preliminary Results; BBS: Dhaka, Bangladesh, 2012. Available online: http://bbs.portal.gov.bd/sites/default/files/files/bbs.portal.gov.bd/page/7b7b171a_731a_4854_8e0a_f8f7dede4a4a/PHC2011PreliminaryReport.pdf (accessed on 8 September 2018).
- Yong, M.S.; Yaftian, N.; Griffiths, S.; Brink, J.; Robertson, T.; D’Orsogna, L.; Weintraub, R.G.; d’Udekem, Y.; Brizard, C.P.; Konstantinov, I.E. Long-Term Outcomes of Total Anomalous Pulmonary Venous Drainage Repair in Neonates and Infants. Ann. Thorac. Surg. 2018, 105, 1232–1238. [Google Scholar] [CrossRef] [PubMed]
- Ahmed, S. Cluster Sampling. Johns Hopkins University: Baltimore, MD, USA, 2009. Available online: http://ocw.jhsph.edu/courses/StatMethodsForSampleSurveys/PDFs/Lecture5.pdf (accessed on 20 October 2018).
- Kim, S.T.; Cristescu, R.; Bass, A.J.; Kim, K.-M.; Odegaard, J.I.; Kim, K.; Liu, X.Q.; Sher, X.; Jung, H.; Lee, M.; et al. Comprehensive molecular characterization of clinical responses to PD-1 inhibition in metastatic gastric cancer. Nat. Med. 2018, 24, 1449. [Google Scholar] [CrossRef] [PubMed]
- Tabassum, S.; Sharmin, F. Accessibility Analysis of Parks at Urban Neighborhood: The Case of Dhaka. Asian J. Appl. Sci. Eng. 2013, 2, 148–160. [Google Scholar]
- Xue, F.; Gou, Z.; Lau, S. The Green Open Space Development Model and Associated Use Behaviors in Dense Urban Settings: Lessons from Hong Kong and Singapore. Urban Des. Int. 2017, 22, 287–302. [Google Scholar] [CrossRef]
- Zhu, Y.; Ding, J.; Zhu, Q.; Cheng, Y.; Ma, Q.; Ji, X. The Impact of Green Open Space on Community Attachment—A Case Study of Three Communities in Beijing. Sustainability 2017, 9. [Google Scholar] [CrossRef]
- Wüstemann, H.; Kalisch, D.; Kolbe, J. Access to urban green space and environmental inequalities in Germany. Landsc. Urban Plan. 2017, 164, 124–131. [Google Scholar] [CrossRef]
- Žlender, V.; Ward Thompson, C. Accessibility and use of peri-urban green space for inner-city dwellers: A comparative study. Landsc. Urban Plan. 2017, 165, 193–205. [Google Scholar] [CrossRef] [Green Version]
- Gupta, K.; Roy, A.; Luthra, K.; Maithani, S. Mahavir GIS based analysis for assessing the accessibility at hierarchical levels of urban green spaces. Urban For. Urban Green. 2016, 18, 198–211. [Google Scholar] [CrossRef]
- La Rosa, D. Accessibility to green spaces: GIS based indicators for sustainable planning in a dense urban context. Ecol. Indic. 2014, 42, 122–134. [Google Scholar] [CrossRef]
- ULI and CLC. 10 Principles for Liveable High-Density Cities: Lessons from Singapore; Centre for Liveable Cities and Urban Land Institute: Singapore, 2013. [Google Scholar]
- Kolczak, A. This City Aims to Be the World’s Greenest: As Singapore expands, a novel approach preserves green space. National Geographic. 28 February 2017. Available online: https://www.nationalgeographic.com/environment/urban-expeditions/green-buildings/green-urban-landscape-cities-Singapore/ (accessed on 10 September 2018).
- Rahman, M.; Reza, S.; Islam, M.; Rahman, A.; Nath, A. Prevalence of Obesity and Overweight among English Medium School Children of Dhaka City in Bangladesh. J. Environ. Sci. Nat. Resour. 2015, 7. [Google Scholar] [CrossRef] [Green Version]
- Chowdhury, M.A.B.; Uddin, M.J.; Khan, H.M.R.; Haque, M.R. Type 2 diabetes and its correlates among adults in Bangladesh: A population based study. BMC Public Health 2015, 15, 1070. [Google Scholar] [CrossRef] [PubMed]
- Lytras, D.M.; Visvizi, A. Who Uses Smart City Services and What to Make of It: Toward Interdisciplinary Smart Cities Research. Sustainability 2018, 10. [Google Scholar] [CrossRef]
- Banglapedia. Dhaka. Banglapedia- National Encyclopedia of Bangladesh: Dhaka, Bangladesh, December 2014; Available online: http://en.banglapedia.org/index.php?title=Dhaka (accessed on 5 October 2018).
- Visvizi, A.; Lytras, M.D. Rescaling and refocusing smart cities research: From mega cities to smart villages. J. Sci. Technol. Policy Manag. 2018, 9, 134–145. [Google Scholar] [CrossRef]
Figure 1.
Methodological process flow map.

Figure 2.
The location of Dhaka with sub-district (Thana) distributions.

Figure 3.
Land use and land cover maps of Dhaka City [82].
Figure 3.
Land use and land cover maps of Dhaka City [82].

Figure 4.
MLP Markov model simulated land cover maps of Dhaka City area (2019 and 2029) [82].
Figure 4.
MLP Markov model simulated land cover maps of Dhaka City area (2019 and 2029) [82].

Figure 5.
Social class and community profile in Dhaka.

Figure 6.
Time–distance weighted grid map of Dhaka.

Figure 7.
Descriptive statistics of study areas (UGS: urban green space).

Figure 8.
Vulnerable population percentage of the study areas. (SVPA denotes the socially vulnerable people average).
Figure 8.
Vulnerable population percentage of the study areas. (SVPA denotes the socially vulnerable people average).

Figure 9.
Spatial distribution of study areas and green parks.

Figure 10.
Accessibility level measurement of community (study) area.

Figure 11.
Projection of the demand index of socially vulnerable groups in the study areas.


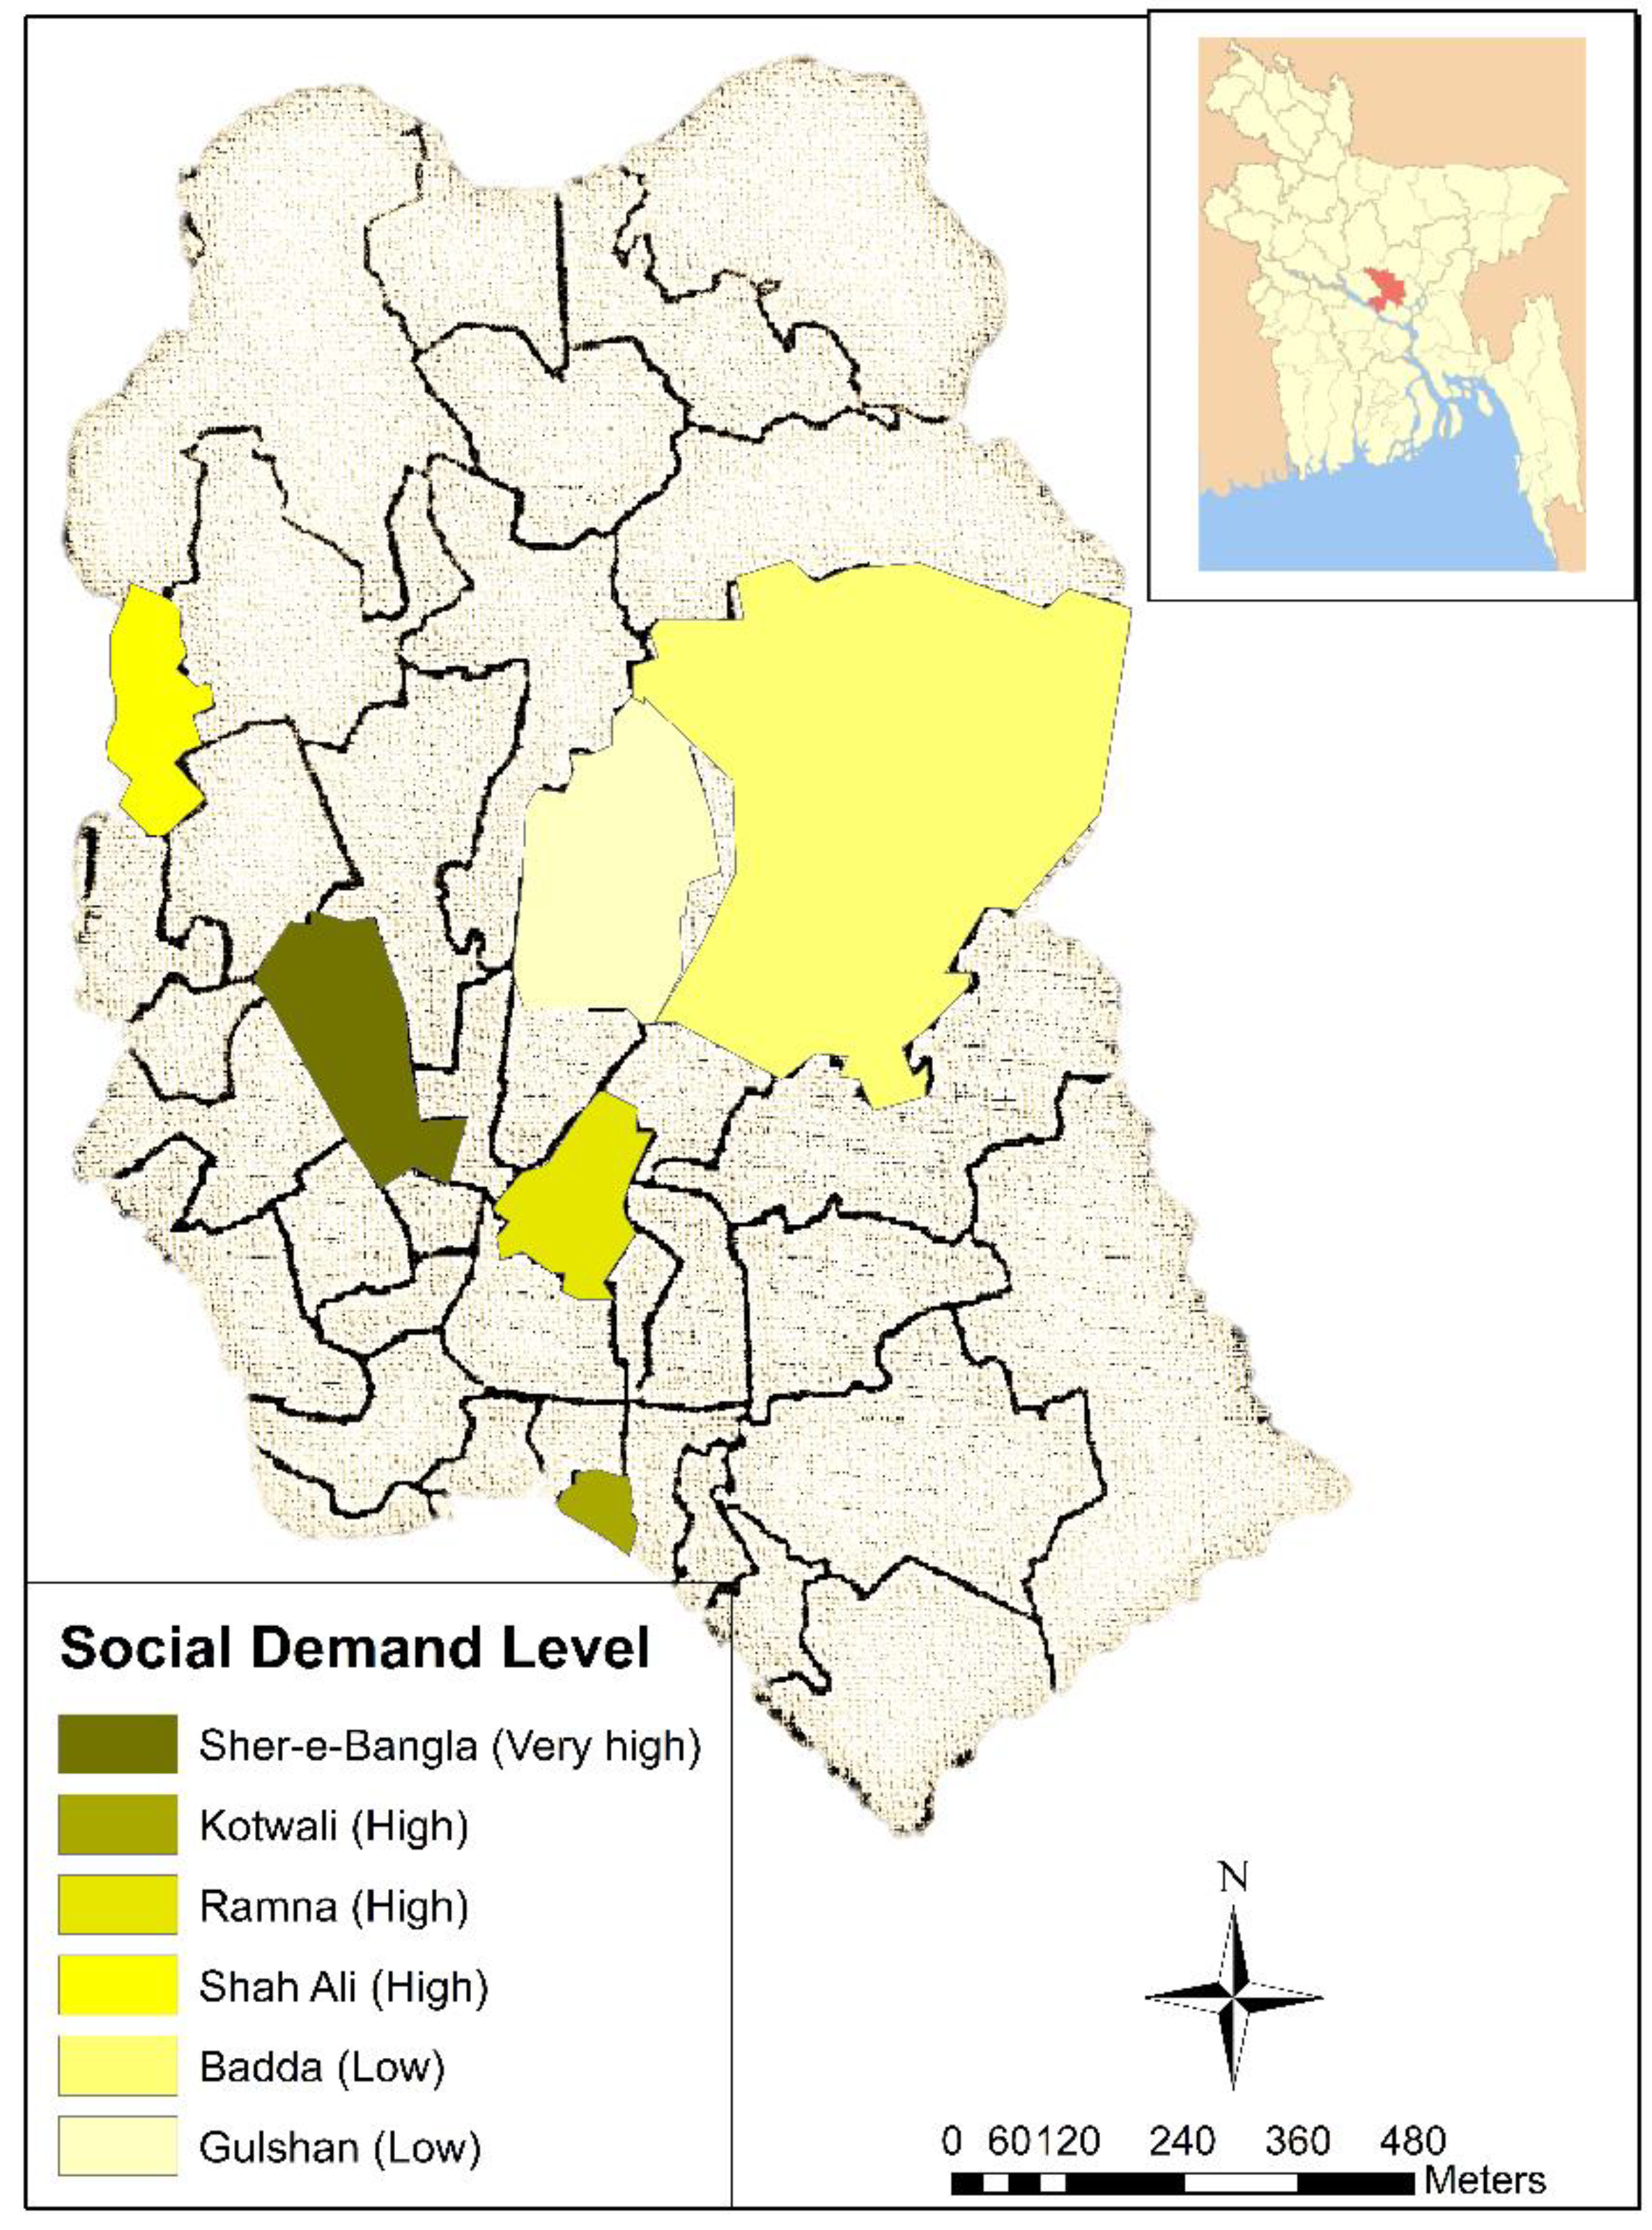
Table 1.
Demographic proportions in six communities.
| Community | Proportion of the Female Population | Proportion of the Illiterate Population | Proportion of the Religious Minority Population | Proportion of the Ethnic Minority Population | Proportion of the Unemployed Population |
|---|---|---|---|---|---|
| Kotwali Thana | 35.10% | 27% | 2.50% | 0.30% | 23.60% |
| Ramna Thana | 46.10% | 27.70% | 16.90% | 0.10% | 29.60% |
| Sher-e-Bangla Nagar Thana | 44.80% | 21.80% | 29.90% | 0.10% | 36.20% |
| Shah Ali Thana | 46.50% | 29% | 21.10% | 0.10% | 27.40% |
| Gulshan Thana | 44.50% | 25.20% | 4.70% | 0.20% | 26.40% |
| Badda Thana | 43.70% | 27.70% | 5.30% | 0.20% | 26.40% |
Table 2.
Area of Green Park per capita of the study areas.
| Community | PUGS (m2/per Capita) |
|---|---|
| Kotwali | 0.0005 m2 |
| Ramna | 0.017 m2 |
| Sher-e-Bangla Nagar | 0.025 m2 |
| Shah Ali | 0.15 m2 |
| Gulshan | 0.015 m2 |
| Badda | 0 m2 |
Table 3.
Statistics of communities’ accessibility level.
| Time (Min) | <2 min | 2–5 min | 5–10 min | 10–20 min | |
|---|---|---|---|---|---|
| Accessibility Level | Very Good | Good | Common | Poor | |
| Kotwali Thana | Proportion (%) | 2.01 | 17 | 15 | 0 |
| Ramna Thana | Proportion (%) | 0.78 | 6.52 | 12.24 | 13.8 |
| Sher-e-Bangla Nagar | Proportion (%) | 0.58 | 5.97 | 8.95 | 9.52 |
| Shah Ali Thana | Proportion (%) | 0.61 | 4.5 | 9.13 | 7.13 |
| Gulshan Thana | Proportion (%) | 0.34 | 3 | 5.2 | 7.68 |
| Badda Thana | Proportion (%) | 0.08 | 0.68 | 1.28 | 5.57 |
Table 4.
Estimation of green space accessibility based on population.
| Community | Total Population | Population Density | Accessible Population | UGSI (%) |
|---|---|---|---|---|
| Kotwali Thana | 145,431 | 98,898 | 29,086.20 | 20 |
| Ramna Thana | 195,167 | 50,824 | 24,395.88 | 12.5 |
| Sher-E-Bangla Nagar | 137,573 | 26,202 | 16,185.05 | 11.76 |
| Shah Ali Thana | 115,489 | 22,425 | 12,156.74 | 10.53 |
| Gulshan Thana | 253,050 | 28,593 | 25,305 | 11.96 |
| Badda Thana | 536,621 | 14,566 | 51,106.76 | 9.52 |
Note: UGSI denotes urban green space indicator.
Table 5.
Calculation of socially vulnerable groups’ social demand index (SDI) for different communities.
Table 5.
Calculation of socially vulnerable groups’ social demand index (SDI) for different communities.
| SDI Classification | SDI > 0.6 | 0.5 < SDI < 0.6 | 0.4 < SDI < 0.5 |
|---|---|---|---|
| Demand Level | Very High | High | Low |
| Kotwali Thana | 0.51 | ||
| Ramna Thana | 0.52 | ||
| Sher-e-Bangla Nagar | 0.61 | ||
| Shah Ali Thana | 0.53 | ||
| Gulshan Thana | 0.45 | ||
| Badda Thana | 0.47 |
Table 6.
Overlay result analysis of accessibility level (AL) and SDI.
| Accessibility Level | Very Good Accessibility | Good Accessibility | Common Accessibility | Poor Accessibility | |
|---|---|---|---|---|---|
| SDI Classification | |||||
| Low demand (0.4 < SDI < 0.5) | Gulshan Badda | ||||
| High demand (0.5 <SDI < 0.6) | Kotwali | Ramna | Shah Ali | ||
| Very high demand (SDI > 0.6) | Sher-e-Bangla Nagar | ||||
© 2018 by the authors. Licensee MDPI, Basel, Switzerland. This article is an open access article distributed under the terms and conditions of the Creative Commons Attribution (CC BY) license (http://creativecommons.org/licenses/by/4.0/).
Share and Cite
MDPI and ACS Style
Rahman, K.M.A.; Zhang, D. Analyzing the Level of Accessibility of Public Urban Green Spaces to Different Socially Vulnerable Groups of People. Sustainability 2018, 10, 3917. https://0-doi-org.brum.beds.ac.uk/10.3390/su10113917
AMA Style
Rahman KMA, Zhang D. Analyzing the Level of Accessibility of Public Urban Green Spaces to Different Socially Vulnerable Groups of People. Sustainability. 2018; 10(11):3917. https://0-doi-org.brum.beds.ac.uk/10.3390/su10113917
Chicago/Turabian StyleRahman, K M Atikur, and Dunfu Zhang. 2018. "Analyzing the Level of Accessibility of Public Urban Green Spaces to Different Socially Vulnerable Groups of People" Sustainability 10, no. 11: 3917. https://0-doi-org.brum.beds.ac.uk/10.3390/su10113917
Note that from the first issue of 2016, this journal uses article numbers instead of page numbers. See further details here.