Article

Evaluating Water Resource Security in Karst Areas Using DPSIRM Modeling, Gray Correlation, and Matter–Element Analysis

1
Key Laboratory of Geographic Information Science (Ministry of Education), East China Normal University, Shanghai 200241, China
2
School of Geographic Sciences, East China Normal University, Shanghai 200241, China
3
School of Geography Science & Tourism, Chongqing Normal University, Chongqing 400047, China
4
School of Management, Chongqing University of Technology, Chongqing 400054, China
*
Authors to whom correspondence should be addressed.
Sustainability 2018, 10(11), 3934; https://0-doi-org.brum.beds.ac.uk/10.3390/su10113934
Submission received: 13 July 2018 / Revised: 24 October 2018 / Accepted: 25 October 2018 / Published: 29 October 2018

Abstract

:
To evaluate the long-term security of water resources in Guizhou, this paper presents an evaluation index that incorporates the driving force–pressure–state–impact–response–management (DPSIRM) framework, the gray correlation method, and matter–element analysis. For the period of 2005–2012, our results show that water resources were within the “generally safe” limits for all years except 2006 and 2011, which were characterized by drought conditions. In karst regions, drought has a relatively large impact on water security and is compounded in Guizhou by rapid economic development, nonpoint-source agricultural pollution, and inadequate sewage treatment. Nonetheless, recent efforts to return farmland to forest and grassland and to control desertification have led to increased forest cover and higher levels of soil and water conservation, while systems have been implemented to foster the effective management of water resources in karst areas. In this study, we used both gray matter–element analysis and a DPSIRM framework to assess the state of water resources in Guizhou, the results of which were compared and verified by the gray set pair method, and to provide a reference for evaluating other karst areas.

1. Introduction

Societies require water for drinking, irrigation, and industry [1,2]. Yet, in many parts of the world, demand has surpassed supply, and the availability and quality of freshwater has become severely restricted [3]. This has resulted in conflict as a growing number of users compete for limited resources [4,5]. A logical approach to tackling the global water crisis is the improved management of available resources [6,7], specifically, the quantitative assessment of regional water security and a better understanding of the factors influencing the water supply.
China ranked 121st in a 2011 study of water use per capita [8] and is in the top 13 countries with insufficient water availability. Consequently, water resource security has become a principal factor limiting economic and social development in China. To date, water security evaluations have focused on regions traditionally associated with water scarcity [9], such as the populous areas of Central and Eastern China [10,11], the arid northwest, and the Yellow River Basin [12]. In contrast, little attention has been paid to water availability in the country’s humid, economically deprived southwestern areas, which includes China’s famous karst region. Despite abundant rainfall in these areas because of the karstic nature of the landscape, water resources are frequently unable to meet the growing local demand.
Over the last decade, numerous evaluation methods have been developed to assess water resource security, including the pressure–state–response (PSR) framework [13,14], the drive–pressure–status–impact–response (DPSIR) model [15,16,17,18], fuzzy comprehensive evaluation [19], analytic hierarchy processing (AHP) [20], the entropy weight [21] and water footprint [22] methods, and set pair analysis [23]. While these methods have undoubtedly contributed to our understanding of water security, their efficacy is limited by several key factors. First, index selection is one-sided and accounts for neither the process of water resource evolution nor its internal mechanisms. Second, index weight relies on user experience, making the process inherently subjective and raising the possibility that objective data will be missed. Third, existing methods ignore the relationships between single indicators and specific security levels [24,25].
Based on the gray system theory, the gray correlation method provides a mathematical basis to assess objectivity without subjectivity and is more reasonable for determining the weights. In its current form, the gray correlation method has not been used extensively in water security research. In contrast, matter–element analysis, which is based on the subordinate relationship between a single index and a rating, integrates the security rating of the evaluation object and, thus, reflects the internal evolution and mechanisms of water resources. The DPSIR–management (DPSIRM) framework includes the economic, social, ecological, and environmental factors affecting water security. This approach describes the internal mechanism of water security evolution and highlights the various environmental–resource–human interactions involved, as well as emphasizing the importance of water security management.
The predominant objectives of this study are (1) to construct a DPSIRM model of index systems used to evaluate water security in karst areas, (2) to combine and use a gray correlation–matter element to assess water resource security in Guizhou province, (3) to explore the quantitative evaluation index systems and suitable methods of water security in the karst area and assess the impact of environmental factors on water availability, and (4) to thereby provide a theoretical and methodological reference point for future research.

2. Materials and Methods
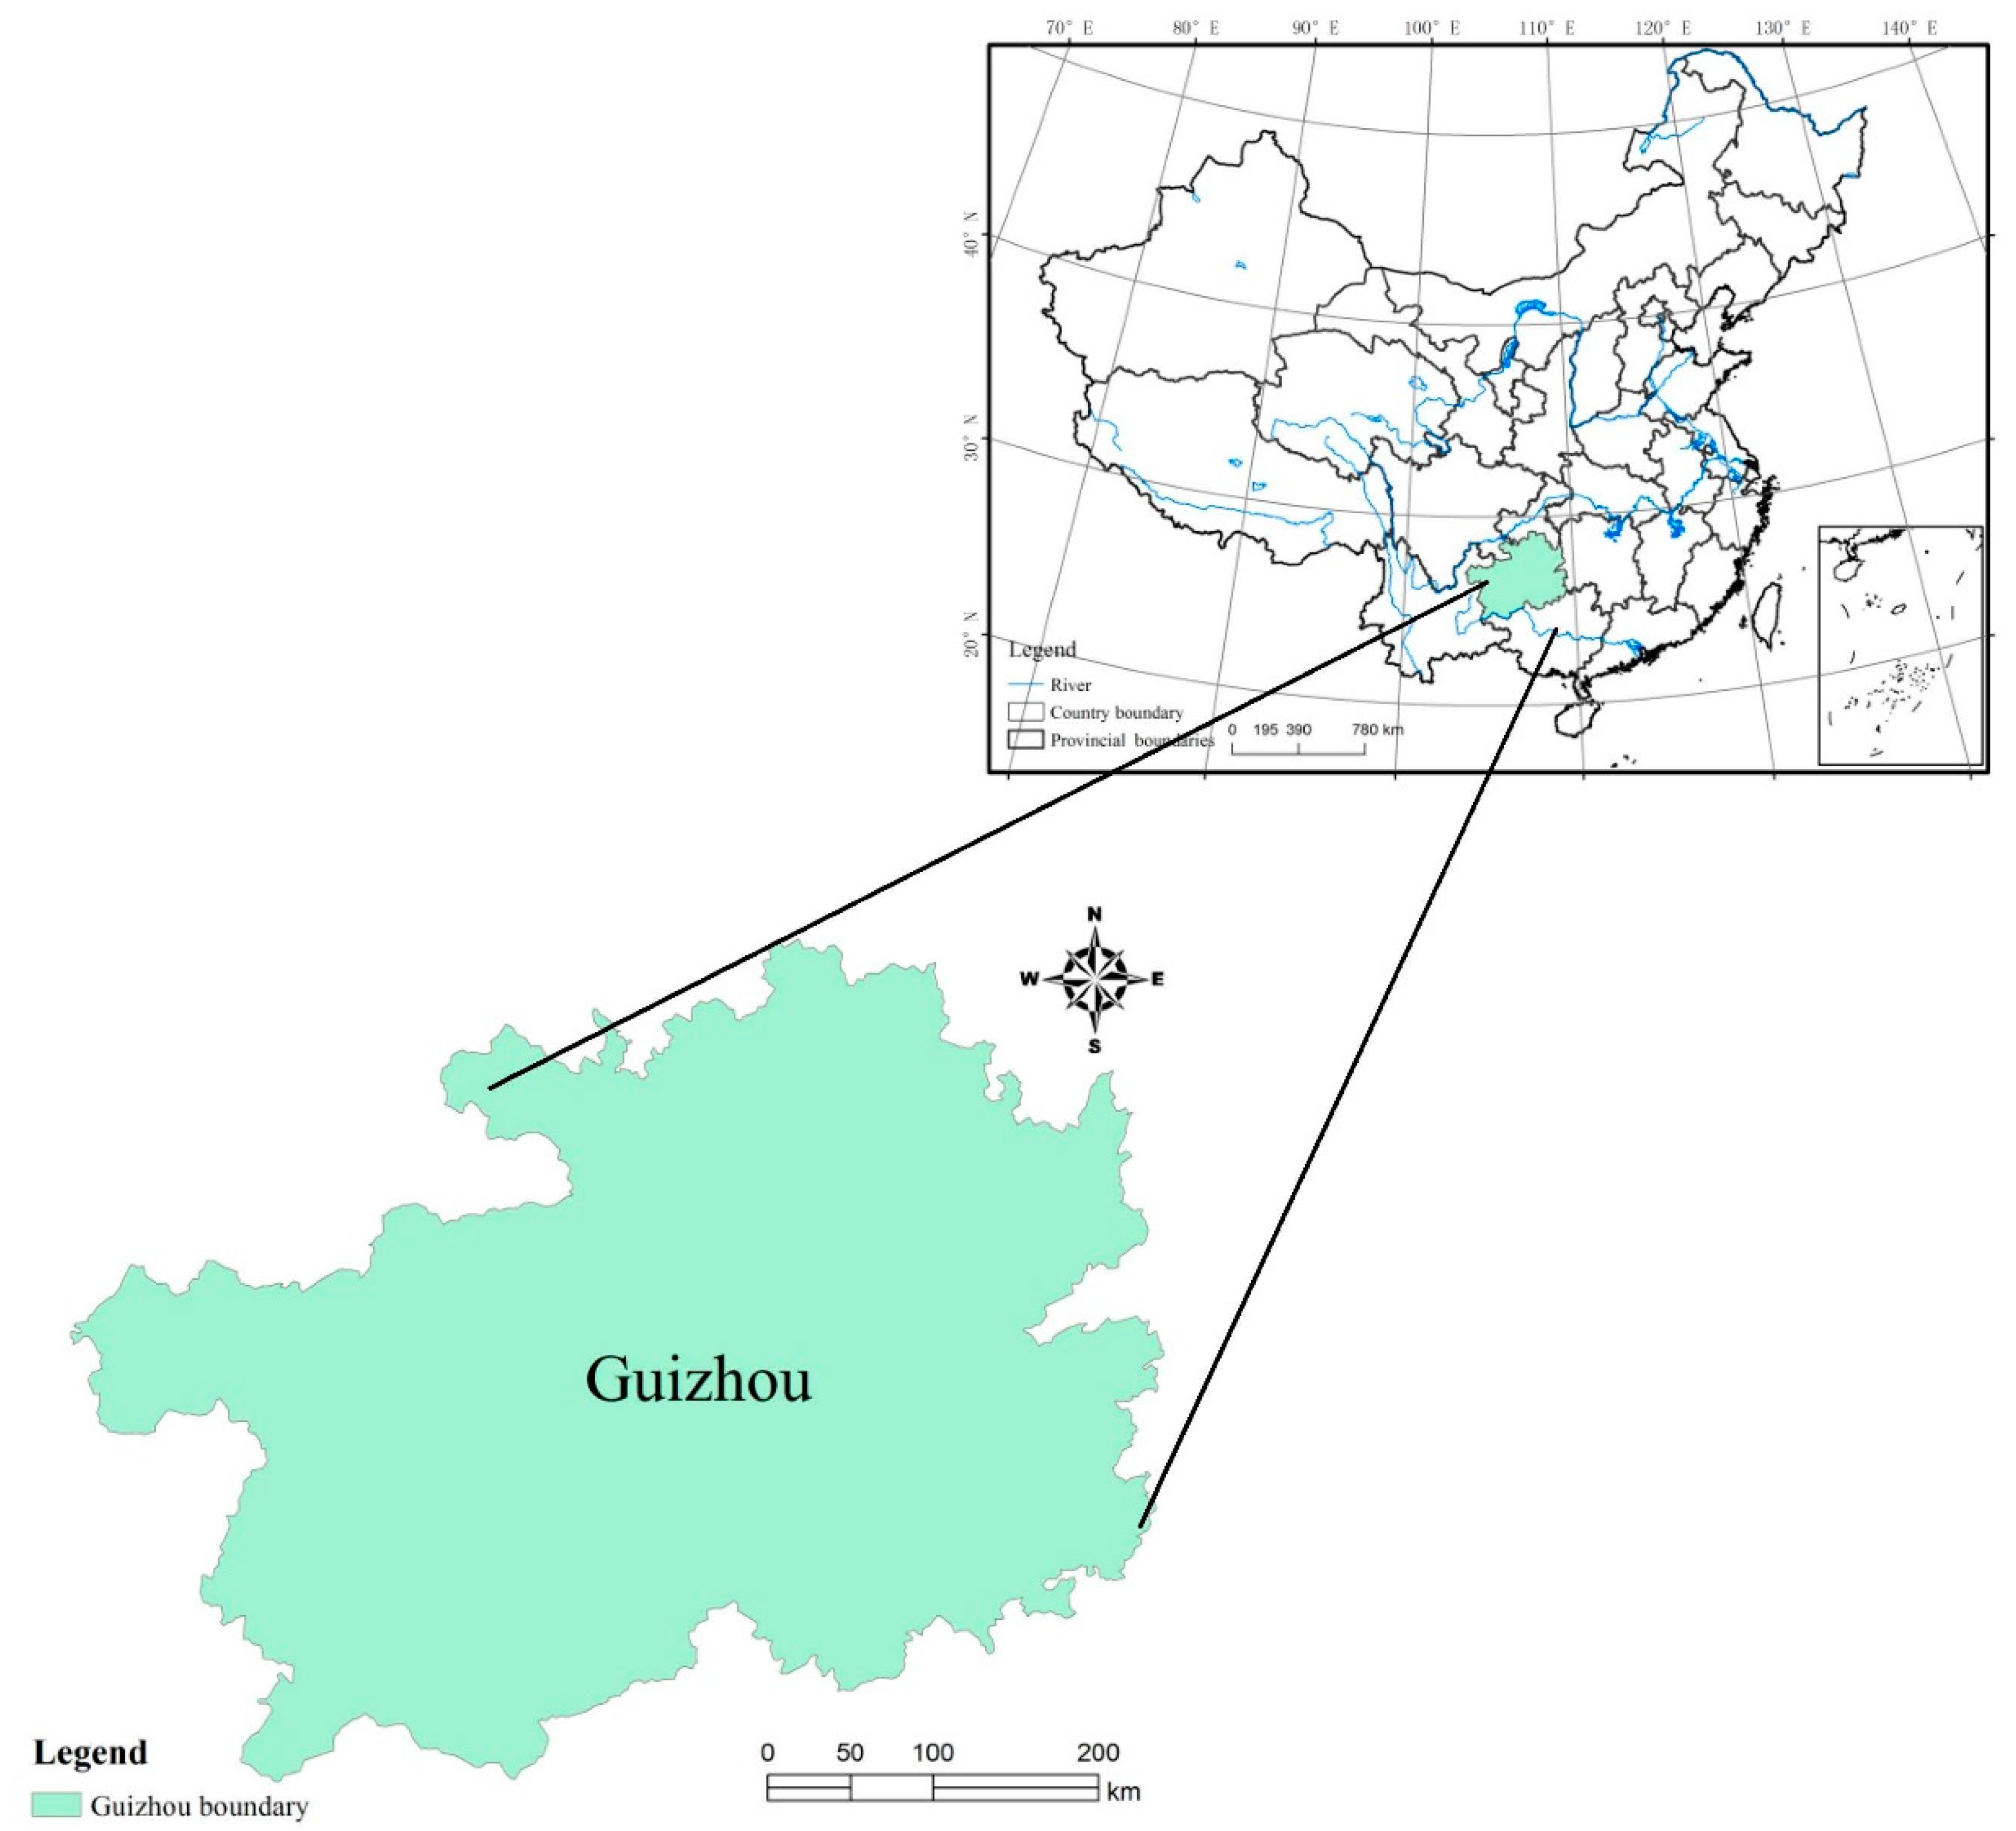
2.1. Study Area

Guizhou province, in Southwest China (37°24′–13°29′ N, 103°36′–109°35′ E) (Figure 1), is characterized by a karst landscape that—along with the neighboring provinces of Guangxi, Yunnan, Sichuan, Chongqing, Hubei, and Hunan—forms the largest karst region on earth. Seventy-three percent of the land area of Guizhou is karst, in which water availability is the principal limiting factor for ecosystem health. Located in the upper reaches of both the Yangtze River and Pearl River Basins (China’s two most economically developed regions), the province is located in the position of the plateau water tower, and its ecological environment is very important. The province is also highly diverse ethnically, with 49 nationalities and 48 ethnic minorities accounting for 37.9% of the total population. Yet, Guizhou province lags behind the rest of China economically, ranking 29th in terms GDP (10,502.56 billion yuan) and per capita income (33,242 yuan) in 2016. Ultimately, the problem of water availability relates not only to Guizhou’s economic, social, and ecological security but also to the viability of development along the Yangtze and Pearl Rivers.

2.2. Data Source

Input data for the period of 2005–2012 were sourced primarily from the “Water Resources Bulletin of Guizhou Province” and the “Environmental Protection Bulletin of Guizhou Province”, which are published on the websites of the Guizhou Provincial Water Resources Department and the Environmental Protection Bureau of Guizhou province, respectively, and from the “Statistical Yearbook of Guizhou Province”. Additional data were acquired via expert scoring and trend forecasting.

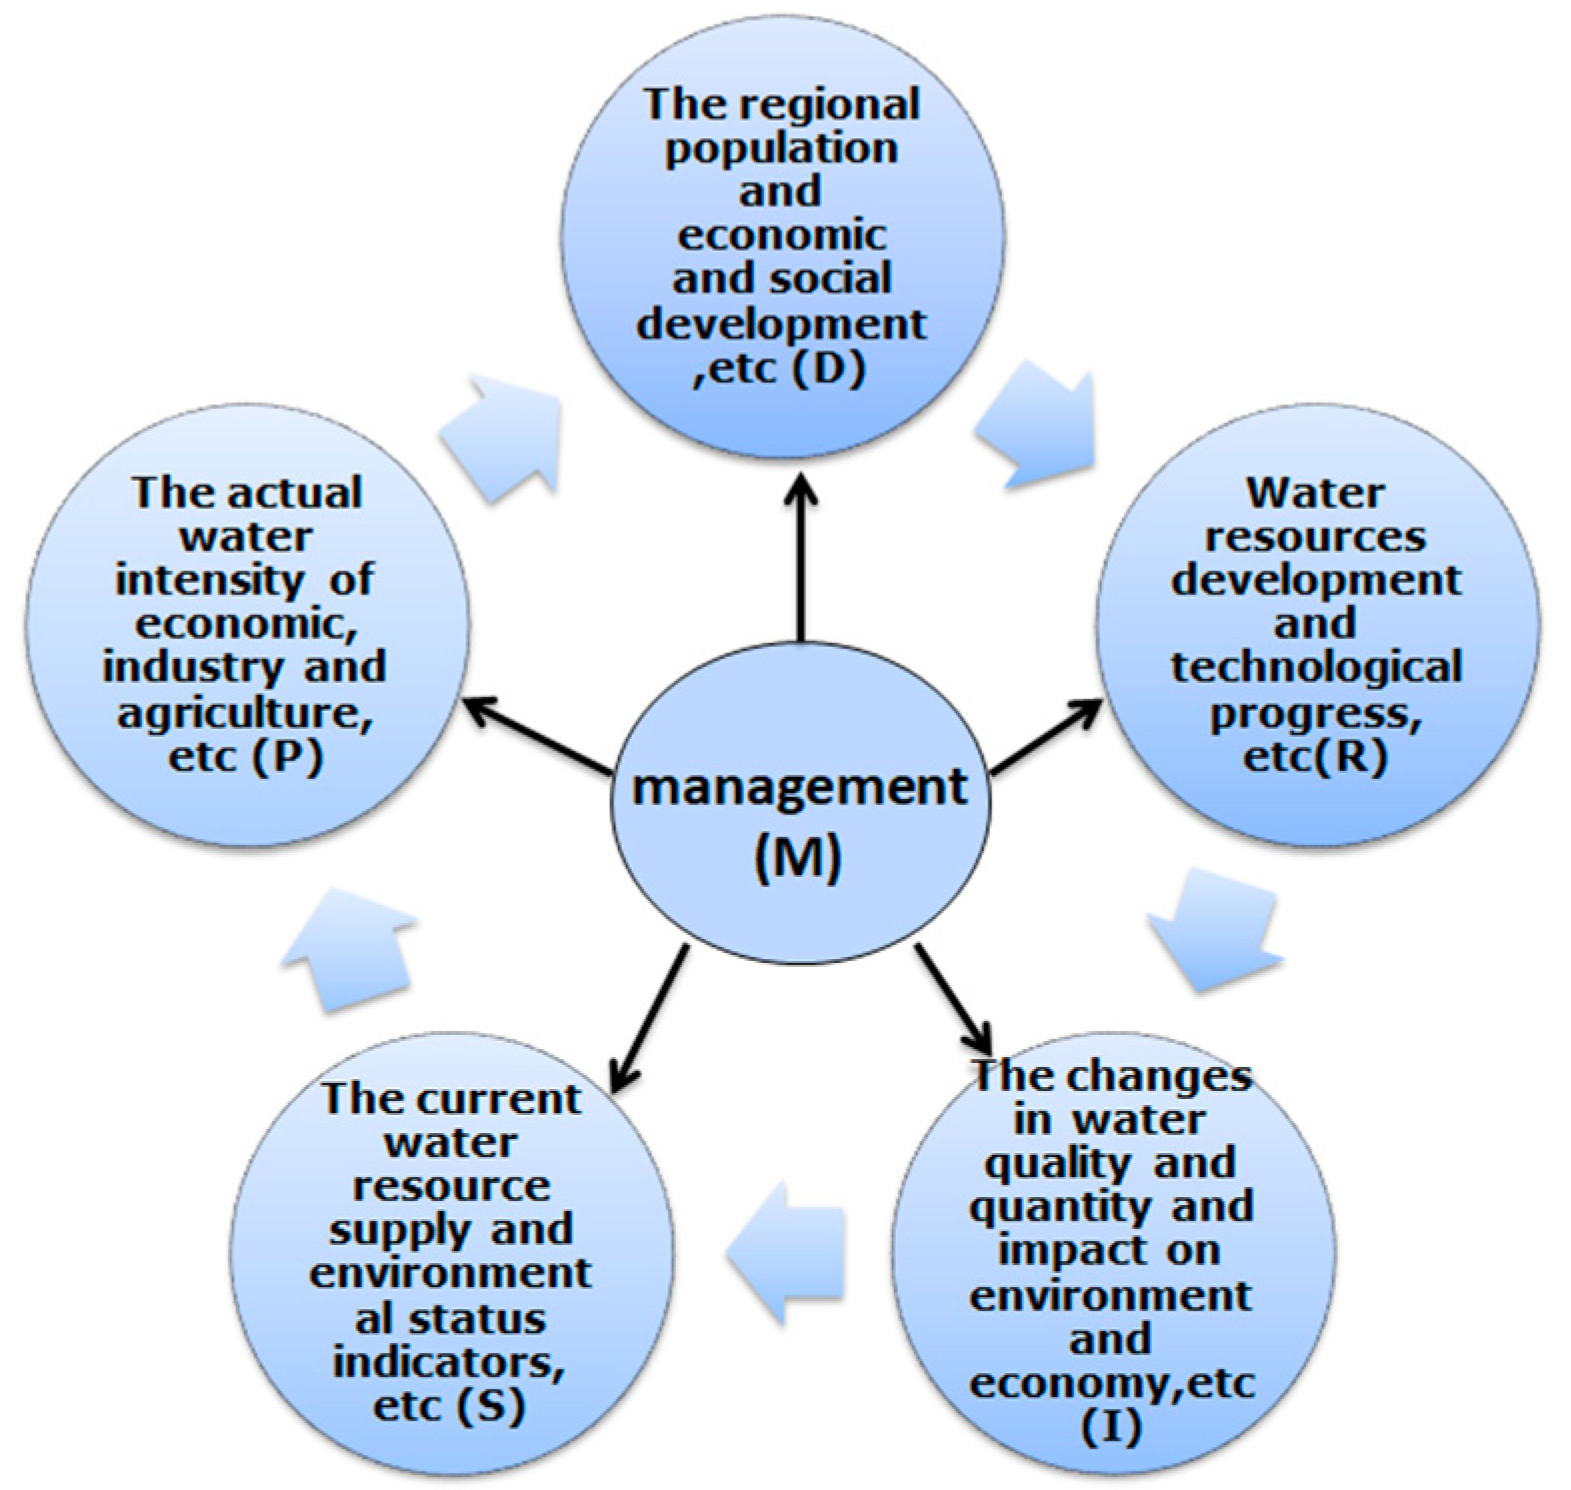
2.3. DPSIRM Framework for Water Security

The PSR framework, conceived in the 1970s by Statistics Canada, was an early causal model for making one-to-one linkages among various stresses, environmental changes, and societal responses [14,15]. The PSR framework is still widely used and continues to evolve. For instance, the DPSIR model [16] was established by the Organization of Economic Cooperation and Development [7,13] as a PSR extension designed to capture “cause–effect” relationships among the various sectors of social, economic, and environmental systems. The model describes a general chain that triggers environmental issues between the origin and the outcome, and although it does not account for management, the model has been used widely in the analysis of human–environment interactions.
Because water is a finite resource and subject to the effects of pollution and climate, the effective management of water resources is crucial to improving regional water security and thus must be included in security evaluations. At present, the DPSIRM model is rare in water resource security evaluations. The karst area is rich in precipitation resources but, due to special geological conditions, the groundwater resources are rich, and the surface water resources are limited as they belong to the engineering water shortage area. Therefore, water resource management in karst areas is particularly important. Accordingly, we incorporated water resource management into the DPSIR framework to produce the DPSIRM evaluation index, a complex causal framework designed to represent regional water security more accurately.
The DPSIRM framework consists of six parts, or submodels: the driver, pressure, state, impact, response, and management submodels. As shown in Figure 2, driving factors (D) include regional population and economic and social development, all of which present real challenges for managing water resources in karst regions. The pressure (P) mainly includes the actual water intensity of overall economic, industrial, and agricultural development, as well as the pressure on water resources caused by pollutant emissions from industrial and agricultural development. The states (S) mainly include the current water resource supply per capita and per unit area and the environmental status indicators that indirectly reflect water resource distribution characteristics in karst areas, such as “the rate of rocky desertification”. The impact (I) mainly includes the changes in water quality and the quantity impact on the environment and the economy of karst areas, such as “river index rate”, “drought and drought damage as a share of GDP”, and “modulus of sediment yield”. The responses (R) mainly include reflection and technological progress in response to changes in the quality and quantity of water resources, such as “sewage treatment rate” and “water resource development rate”. Management (M) mainly includes policies and measures adopted in response to drive, pressure, state, impact, and response. In the current situation of limited water resources in karst areas, water resource management is the key to solve the problem of water resource security. The changes in water quality and quantity, the tension between supply and demand of water resources, and fears over water resource security are all factors that highlight the need to strengthen global and regional water resource management. The specific indicators are shown in Table 1.

2.4. The Gray Correlation Method

As a new component of gray system theory, which is based on the degree of similarity or dissimilarity between factors, the gray correlation method is used to measure the correlation between factors [24,26,27]. It overcomes the subjective arbitrariness of traditionally subjective values (e.g., AHP) and can objectively assign weights when the index weight difference is too large [28,29]. The gray correlation method incorporates the objectivity of a mathematical model, although the coefficient reflects a certain degree of subjectivity, and it is thought to provide a closer determination of weight, making it suitable for enhancing water resource security indicators.

2.4.1. Data Standardization

To eliminate the physical dimension of each index’s impact, we quantified the various indexes in the sample matrix prior to evaluation, using linear interpolation for the nondimensional processing of raw data. Then, to evaluate the water security of n years in each area, we followed the original index data matrix approach of Zhang et al. (2015) [26] and Xia et al. (2016) [24].
X = { X 11 X 12 X 1 n X 21 X 22 X 11 X m 1 X m 2 X m n }  
stands for the original index.
In general, each indicator of water resource security can be divided into negative and positive indicators. For positive indicators, the bigger the value, the better. Their standardized calculation is
y = X X min X max X min .
For negative indicators (cost indicators), the smaller the value, the better. Their standardized calculation is
y = 1 X X min X max X min  
where y stands for the normalized index, and Xmax and Xmin represent maximum and minimum index values, respectively.

2.4.2. Determining the Optimal Vector of the Sequence

Due to the standardization of raw data, the optimal vector is as follows (Zhang et al., 2015):
G = ( g 1 , g 2 , g n ) = ( y 11 v y 12 v y 1 m , y 21 v y 22 , v y 2 m , y 11 v y 12 , v y n m )  
where v is the maximum operator, and G is the optimal vector.

2.4.3. Calculating the Weight

We used the gray correlation method to calculate both the connection number and the weight according to that number. The gray correlation coefficient δ i = ( y i , G ) is calculated as
δ i = ( y i , G ) = min i min j | y i j g i | + ρ max i max j | y i j g i | | y i j g i | + ρ max i max j | y i j g i |  
where δ stands for the gray correlation coefficient, min i min j | y i j g i | represents two levels of minor difference, max i max j | y i j g i | denotes two levels of great difference, and ρ is the distinguishing coefficient 0 < ρ < 1, ρ = 0.5.
The weight formula (Wi) is calculated by the equation
W i = δ i i = 1 n δ i  
where W represents the weights of each indicator.

2.5. Matter–Element Analysis of Water Resource Security

Developed by Chinese scholar Cai Wen in the 1980s, the matter–element analysis method can obtain the comprehensive evaluation result by calculating the correlation coefficient between a single index and each standard grade. This can effectively identify the degree of membership between the index and the evaluation grade, as well as avoid omitting some evaluation information within a single index. The main advantages of this method include its use of comprehensive factors without the loss of information and its quantitative, objective expression of results [25,27].

2.5.1. Matter–Element of Water Resource Security

In our evaluation of water security for the area (or time) N, the one-dimensional matter–element matrix R = (N,c,x) incorporates the feature vector c and value feature vector x . If N has n feature vectors with corresponding values X1, X2, …, Xn, this is termed the n-dimensional element of the water security evaluation, and R is the n-dimensional model of that evaluation. This relationship is shown by the following equation [25,27]:
R = ( N , c , x ) | N c 1 c 2 c n X 1 X 2 X n | .

2.5.2. Determining the Classical and Joint Domains of the Matter–Element Matrix

In evaluations of water resource security, the classical domain element matrix can be expressed as Roj = (Noj,Ci,Xo), where Noj is the jth rating (j = 1, 2, …, n) and Ci represents the ith index. Therefore, in our evaluation, the matter–element matrix of the classical domain can be expressed as [25,27]
R o j = ( N o j , C i , X o ) | N c 1 c 2 c n ( a o j 1 , b o j 1 ) ( a o j 1 , b o j 1 ) ( a o j 1 , b o j 1 ) |  
where (aoji, boji) denotes the range of values at level j.
Similarly, the matter–element matrix of the joint domain is expressed as Rp = (Np,Cn,vn), where Rp is the joint domain element and p is the overall rating. Therefore, in our evaluation of water resource security, the formula for the domain element matrix is [25,27]
R p = ( N o j , C n , V n ) | N c 1 c 2 c n ( a p 1 , b p 1 ) ( a p 2 , b p 2 ) ( a p n , b p n ) |  
where (apn, bpn) represents the range of the value of the joint domain element.

2.5.3. Determining the Evaluation Element

The matter–element of evaluation objects (RM) is expressed as
R M = ( N , c , x ) | N M c 1 c 2 c n c 1 c 2 c N | .

2.5.4. Determining the Correlation Function and Degree of Correlation

The matter–element of evaluation objects (RM) is expressed as
X o = [ a , b ] , | X o = | b a | |  
where Xo represents the classical domain of the matter–element matrix.
The water safety evaluation index correlation function K(x) is calculated using the formulas
K ( X i ) = { p ( X , X o ) | X o | X X o p ( X , X o ) p ( X , X p ) p ( X , X o ) X X o  
{ P ( X , X o ) = | X 0.5 ( a o b o ) | 0.5 ( b o a o ) P ( X , X p ) = | X 0.5 ( a p b p ) | 0.5 ( b p a p )  
where (X, Xo) is the distance between X and the finite interval of the corresponding eigenvector Xo = [ao, bo]; p(X, Xp) is the distance between X and the finite interval of the eigenvector segment of joint domain Xp = [ap, bp]; X, X0, and Xp are the values of the water security evaluation, the range of the value range of the classical domain, and the range of the value of joint domain, respectively [25,27].

2.5.5. Comprehensive Correlation Degree and Rating

The synthetic correlation of level j for evaluation objects NM (M = 1, 2, 3, …, m) is expressed as
K j ( N M ) = i = 1 n W i K j ( X i )  
where Wi is weight, Kj(Nm) is the comprehensive correlation, and Kj(Xi) is the degree of association of a single indicator. This treatment determines which class the object belongs to according to the principle of large numbers, such that Kjm = max[Kj(Nm)]. When K < 1, the evaluation object fails to meet the rating requirement and cannot be converted into the rating scale. When −1 < K < 0, the object does not conform to the evaluation requirements, yet has conditions that can be transformed into an evaluation grade, with larger values yielding more straightforward conversions. When K > 0, the evaluation object conforms to the grade evaluation requirements, with higher values representing greater stability of the object at its corresponding level [25,27].

2.6. The Evaluation Index System

The evaluation index system is an area of great interest in the study of water resource security, and the water resource conditions in karst areas are complex [9,30,31]. Therefore, the establishment of a water resource security evaluation index system in karst areas is both compelling and challenging.

2.6.1. Evaluation Index System Based on DPSIR Modeling of Karst Area Water Security

DPSIRM provides an indicator framework for the quantitative assessment of water resource security in karst areas, as well as a new research perspective. As the distribution of water resources is regionally variable, evaluation index systems need to accommodate those differences. Accordingly, in our assessment of the Guizhou karst region based on the DPSIRM framework and existing studies, an evaluation index system for water resource security in karst areas was established according to the principles of representativeness, independence, index quantification, and systematisms (Table 1). In addition, subjective indicators, such as the integrity and implementation of water resource protection and management systems and the availability of data on flood control and drought, were scored on a 10-point scale.

2.6.2. Classical and Joint Domains of Water Security Evaluation

According to the principle of extensibility, the state of water resource security can be divided into five levels, No1No2, corresponding to the classifications (1) “very safe”, (2) “generally safe”, (3) “barely safe”, (4) “unsafe”, and (5) “very unsafe”, respectively. As an indicator of karst water security, this standard exhibits regional differences due to variations in ecological and environmental vulnerability [25,26] and water pollution, as well as safety indexes and standards issued by local governments and planning initiatives. Due to the fragile ecological environment and low environmental capacity in the karst area, the safety standard may be subject to further adjustment based on expert advice (e.g., partial values may be reduced by 5–50%) to determine each index range in the classical domain. Values for the classical domain matrix—Ro1, Ro2, Ro3, Ro4, and Ro5—and the joint domain matrix RP are given below.
R o 1 = | N o 1 Very   safe c 1 ( 12000 , 30000 ) c 2 ( 0,400 ) c 3 ( 0,30 ) c 4 ( 60,100 ) c 5 ( 0,10 ) c 6 ( 0,300 ) c 7 ( 0,200 ) c 8 ( 0,500 ) c 9 ( 0,10 ) c 10 ( 0,100 ) c 11 ( 3000 , 4000 ) c 12 ( 200,300 ) c 13 ( 0,5 ) c 14 ( 40,100 ) c 15 ( 90,100 ) c 16 ( 0,1 ) c 17 ( 0,200 ) c 18 ( 80,100 ) c 19 ( 90,100 ) c 20 ( 0,5 ) c 21 ( 1.5,3 ) c 22 ( 9,10 ) c 23 ( 9,10 ) c 24 ( 9,10 ) |   R o 2 = | N o 2 Generally   safe c 1 ( 8000 , 12000 ) c 2 ( 400,800 ) c 3 ( 30,40 ) c 4 ( 50,60 ) c 5 ( 10,15 ) c 6 ( 300,600 ) c 7 ( 200,400 ) c 8 ( 500,1000 ) c 9 ( 10,20 ) c 10 ( 100,250 ) c 11 ( 2500 , 3000 ) c 12 ( 150,200 ) c 13 ( 5,10) c 14 ( 30,40) c 15 ( 80,90 ) c 16 ( 1,2.5) c 17 ( 200,1000) c 18 ( 70,80 ) c 19 ( 80,90 ) c 20 ( 5,15) c 21 ( 1,1.5 ) c 22 ( 7,9) c 23 ( 7,9 ) c 24 ( 7,9 ) |   R o 3 = | N o 3 Barely   safe c 1 ( 5000 , 8000 ) c 2 ( 800,2000 ) c 3 ( 40,50 ) c 4 ( 40,50 ) c 5 ( 15,20 ) c 6 ( 600,1000 ) c 7 ( 400,600 ) c 8 ( 1000,1500 ) c 9 ( 20,35 ) c 10 ( 250,400 ) c 11 ( 1500 , 2500 ) c 12 ( 100,150 ) c 13 ( 10,20) c 14 ( 20,30) c 15 ( 70,80 ) c 16 ( 2.5,4) c 17 ( 1000,2500) c 18 ( 60,70 ) c 19 ( 70,80 ) c 20 ( 15,30) c 21 ( 1,0.6 ) c 22 ( 6,7) c 23 ( 6,7 ) c 24 ( 6,7 ) |   R o 4 = | N o 4 Unsafe c 1 ( 2000 , 5000 ) c 2 ( 2000,5000 ) c 3 ( 50,60 ) c 4 ( 30,40 ) c 5 ( 20,30 ) c 6 ( 1000,1500 ) c 7 ( 600,1000 ) c 8 ( 1500,2000 ) c 9 ( 35,50 ) c 10 ( 400,500 ) c 11 ( 500 , 1500 ) c 12 ( 50,100 ) c 13 ( 20,25) c 14 ( 10,20) c 15 ( 60,70 ) c 16 ( 4,5.5) c 17 ( 2500,5000) c 18 ( 45,60 ) c 19 ( 60,70 ) c 20 ( 30,45) c 21 ( 0.3,0.6 ) c 22 ( 5,6) c 23 ( 5,6 ) c 24 ( 5,6 ) |   R o 5 = | N o 5 Very   Unsafe c 1 ( 0 , 2000 ) c 2 ( 5000,10000 ) c 3 ( 60,100 ) c 4 ( 0,30 ) c 5 ( 30,100 ) c 6 ( 1500,2500 ) c 7 ( 1000,2000 ) c 8 ( 2000,3000 ) c 9 ( 50,70 ) c 10 ( 500,700 ) c 11 ( 0 , 500 ) c 12 ( 0,50 ) c 13 ( 25,100) c 14 ( 0,10) c 15 ( 0,60 ) c 16 ( 5.5,10) c 17 ( 5000,7000) c 18 ( 0,45 ) c 19 ( 0,60 ) c 20 ( 45,100) c 21 ( 0,0.3 ) c 22 ( 0,5) c 23 ( 0,5 ) c 24 ( 0,5 ) |   R p = | N p c 1 ( 0 , 30000 ) c 2 ( 0,10000 ) c 3 ( 0,100 ) c 4 ( 0,100 ) c 5 ( 0,100 ) c 6 ( 0,2500 ) c 7 ( 0,2000 ) c 8 ( 0,3000 ) c 9 ( 0,70 ) c 10 ( 0,700 ) c 11 ( 0 , 4000 ) c 12 ( 0,300 ) c 13 ( 0,100) c 14 ( 0,100) c 15 ( 0,100 ) c 16 ( 0,10) c 17 ( 0,7000) c 18 ( 0,100 ) c 19 ( 0,100 ) c 20 ( 0,100) c 21 ( 0,3 ) c 22 ( 0,10) c 23 ( 0,10 ) c 24 ( 0,10 ) |.

3. Results and Discussion

According to the research methods in the second part of this paper, the following results and conclusions are drawn.
We used the gray correlation method to calculate the weight of each rating index listed in Table 1. Using Equations (11) and (12), we then incorporated the matter–element R2005R2012 into the matter–element analysis model to evaluate index correlation degrees, factor layer correlation degrees, and comprehensive correlation degrees for the Guizhou region (Table 2, Table 3 and Table 4). For 2005, for example, the correlation degrees (kj(x1)) of the five corresponding grades are No1 = −0.021, No2 = 0.013, No3 = 0.001, No4 = 0.000, and No5 = −0.014. We can conclude, therefore, that the natural growth rate of the population is No2, which is classed as “generally safe”. Other indicators give similar results (Table 2). For instance, the correlation degrees (Kj(N2005)) of the five corresponding grades are No1 = −0.326, No2 = 0.290, No3 = −0.155, No4 = −0.230, and No5 = −0.359. Thus, according to the judging criteria, water resource security in Guizhou province for 2005 was Grade 2, or “generally safe”. Evaluation factor levels and security levels for all years are given in Table 3 and Table 4, respectively.

3.1. Results of Correlation Degree of Indexes and Factors Influencing

According to Equation (3), the matrix R values are as follows:
R 2005 = | N 2005 c 1 ( 5052 ) c 2 ( 211.73 ) c 3 ( 26.87 ) c 4 ( 40.57 ) c 5 ( 18 ) c 6 ( 509 ) c 7 ( 377.04 ) c 8 ( 1514.3 ) c 9 ( 20.86 ) c 10 ( 441.45 ) c 11 ( 2123 ) c 12 ( 50.21 ) c 13 ( 20.39) c 14 ( 35.6) c 15 ( 63.5 ) c 16 ( 1.73 ) c 17 ( 313) c 18 ( 21.1 ) c 19 ( 67.7 ) c 20 ( 11.6) c 21 ( 1.7 ) c 22 ( 4.1) c 23 ( 5.1 ) c 24 ( 5.01 ) |   R 2006 = | N 2006 c 1 ( 5759 ) c 2 ( 213.27 ) c 3 ( 27.42 ) c 4 ( 45.48 ) c 5 ( 16 ) c 6 ( 442 ) c 7 ( 319.09 ) c 8 ( 1530.91 ) c 9 ( 16.25 ) c 10 ( 457.65 ) c 11 ( 2059.6 ) c 12 ( 46.24 ) c 13 ( 20.39) c 14 ( 39.93) c 15 ( 58.1 ) c 16 ( 2.6 ) c 17 ( 273) c 18 ( 21.2 ) c 19 ( 71.8 ) c 20 ( 12.3) c 21 ( 1.51 ) c 22 ( 4.3) c 23 ( 5.5 ) c 24 ( 5.5 ) |   R 2007 = | N 2007 c 1 ( 7878 ) c 2 ( 213.57 ) c 3 ( 28.2 ) c 4 ( 50.99 ) c 5 ( 17.9 ) c 6 ( 385 ) c 7 ( 324.77 ) c 8 ( 1182.85 ) c 9 ( 12.01 ) c 10 ( 468.3 ) c 11 ( 2649 ) c 12 ( 59.86 ) c 13 ( 18.8) c 14 ( 39.93) c 15 ( 64.9 ) c 16 ( 1.4) c 17 ( 345) c 18 ( 29 ) c 19 ( 71.9 ) c 20 ( 9.29) c 21 ( 1.8 ) c 22 ( 5.05) c 23 ( 5.6 ) c 24 ( 5.8 ) |  R 2008 = | N 2008 c 1 ( 9855 ) c 2 ( 215.31 ) c 3 ( 29.11 ) c 4 ( 56.29 ) c 5 ( 17.1 ) c 6 ( 337 ) c 7 ( 382.36 ) c 8 ( 1012.63 ) c 9 ( 9.42 ) c 10 ( 473.7 ) c 11 ( 2826 ) c 12 ( 59.86 ) c 13 ( 18.4) c 14 ( 39.93) c 15 ( 67.6 ) c 16 ( 13.68) c 17 ( 352) c 18 ( 31.2 ) c 19 ( 71.7 ) c 20 ( 9.29) c 21 ( 1.54 ) c 22 ( 5.3) c 23 ( 6.2 ) c 24 ( 6.6 ) |  R 2009 = | N 2009 c 1 ( 10971 ) c 2 ( 200.78 ) c 3 ( 23.9 ) c 4 ( 62 ) c 5 ( 11.5 ) c 6 ( 861 ) c 7 ( 272.54 ) c 8 ( 970.98 ) c 9 ( 10.78 ) c 10 ( 492.3 ) c 11 ( 3242 ) c 12 ( 51.68 ) c 13 ( 17.9) c 14 ( 39.93) c 15 ( 66.2 ) c 16 ( 0.91) c 17 ( 272) c 18 ( 42 ) c 19 ( 71 ) c 20 ( 11) c 21 ( 1.8 ) c 22 ( 5.6) c 23 ( 6.3 ) c 24 ( 6.2 ) | R 2010 = | N 2010 c 1 ( 13119 ) c 2 ( 197.48 ) c 3 ( 24 ) c 4 ( 68.15 ) c 5 ( 11.8 ) c 6 ( 750 ) c 7 ( 226.26 ) c 8 ( 845.08 ) c 9 ( 16.81 ) c 10 ( 491.25 ) c 11 ( 2560 ) c 12 ( 54.3 ) c 13 ( 17.3) c 14 ( 40.52) c 15 ( 71.8 ) c 16 ( 3.91) c 17 ( 352) c 18 ( 66.8 ) c 19 ( 77.3 ) c 20 ( 10.6) c 21 ( 1.9 ) c 22 ( 6.05) c 23 ( 7.12 ) c 24 ( 6.4 ) |  R 2011 = | N 2011 c 1 ( 16413 ) c 2 ( 196.91 ) c 3 ( 35 ) c 4 ( 72.22 ) c 5 ( 17.4 ) c 6 ( 712 ) c 7 ( 219.17 ) c 8 ( 606.7 ) c 9 ( 11.32 ) c 10 ( 535.95 ) c 11 ( 1806 ) c 12 ( 35.55 ) c 13 ( 17.16) c 14 ( 41.53) c 15 ( 72.9 ) c 16 ( 4.4) c 17 ( 141) c 18 ( 82 ) c 19 ( 80.3 ) c 20 ( 15.1) c 21 ( 1.9 ) c 22 ( 6.2) c 23 ( 7.2 ) c 24 ( 6.5 ) |  R 2012 = | N 2012 c 1 ( 19710 ) c 2 ( 197.76 ) c 3 ( 36.4 ) c 4 ( 75.12 ) c 5 ( 19.3 ) c 6 ( 629 ) c 7 ( 121.87 ) c 8 ( 572.93 ) c 9 ( 10.55 ) c 10 ( 554.4 ) c 11 ( 2796 ) c 12 ( 55.29 ) c 13 ( 17.1) c 14 ( 42) c 15 ( 69.5 ) c 16 ( 0.97) c 17 ( 195) c 18 ( 85 ) c 19 ( 82 ) c 20 ( 9.4) c 21 ( 1.4 ) c 22 ( 6.5) c 23 ( 7.5 ) c 24 ( 7.1 ) |.
As can be seen from Table 1 (weight ≥ 0.042), the factors influencing water resource security are population density, urbanization rate, discharge of waste water per unit of industrial output, amount of fertilizer used per unit of cultivated area, water resources per unit area, rate of rocky desertification, forest coverage, river water quality index rate, drought and drought damage as a share of GDP, water resource development rate, and environmental protection investment as a percentage of GDP. The greater the absolute value of weight, the greater influence the factor has on water resource security in the karst area. Drought and drought damage as a share of GDP (0.059) reflects the impact of natural disasters. Forest coverage (0.046) and water resources per unit area (0.046) come from the ecological and environmental systems. Discharge of waste water per unit of industrial output (0.045) and rate of rocky desertification (0.045) reflect the disturbance of economic development and human activities. It is evident that the influence of the droughts caused by climate change is much greater than that of the ecological and environmental systems, while the disturbance of economic development and human activities is between the two.
Based on the data in Table 2, the factors of the amount of fertilizer used per unit of cultivated area, river water quality index rate, sewage treatment rate, integrity of the water protection, and management system played a negative role in water security in karst areas. The amount of fertilizer used per unit of cultivated area reached 554.4 kg in 2012. The sewage treatment rate was only 66.8% in 2010 and increased to 85% in 2012. It is evident that rapid economic development, backward infrastructure, lack of management measures, and non-point agricultural pollution put great pressures on water resources security in karst areas.

3.2. Results of Water Resource Security Evaluation of DPSIRM Factor Layers

According to the factor (DPSIRM) differentiation information given in Table 3, the water security level for Guizhou province remained stable between 2005 and 2012. Although the pressure safety level had not changed, Kj(N2008, D) = −0.021, Kj(N2009, D) = −0.065, Kj(N2011, D) = −0.068, and Kj(N2012, D) = −0.173, meaning that all were <0 and thus exhibited a downward trend. In the short term, the driving force of security was generally better, with the years 2009–2012 classed as “very safe”. The states of security were classed as “generally safe” in 2005, whereas the period of 2006–2009 was “unsafe” and 2010–2012 was classed as “barely safe” due to the impact of drought and floods. Management of security was classed as “unsafe” in both 2006 and 2007. The period of 2008–2012 was classed as “barely safe”. In 2006, the average precipitation of Guizhou province was 1015.1 mm, and the total amount of water resources was 81.46 billion m3, which was 23.3% less than the normal year. In 2011, the average precipitation of the province was 820.6 mm, and the total amount of water resources was 62.635 billion m3, which was 41.0% less than the normal year. As a result, in 2006 and 2011, water resources per capita and per unit area were 2059.6 m3/person, 1806 m3/person, 46.241 m3/km2, and 35.551 m3/km2, respectively, which was far lower than that of the normal year. This made Kj(N2006, S) and Kj(N2011, S) to be classified as “unsafe” and “barely safe”, respectively. It can be seen that extreme droughts caused by climate change have a great impact on “water security states” in karst areas. From 2006 to 2009, the rate of rocky desertification reached 20.39%, 18.8%, 18.4%, and 17.9%, respectively. Therefore, Kj(N2006, S)–Kj(N2009, S) belong to the “unsafe” classification, respectively. The environmental degradation of karst region has a great impact on the water resource security states. In addition, in 2005, although the rate of rocky desertification was as high as 20.39%, the province’s average annual rainfall was 1129.7 mm, increasing 9.0% from the previous year. Kj(N2005, S) increased to be classified as “generally safe”. It is evident that, in the current situation, the impact of climate change on water resource security is far greater than environmental degradation.
In 2005 and 2012, the per capita GDP in Guizhou was 5052 and 19,710 yuan/person, respectively, far lower than the national per capita GDP in 2012 (RMB 40,007 yuan/person). In 2005 and 2012, the urbanization rate was 26.87% and 36.4%, respectively, far lower than the national average of 52.57%. However, between 2015 and 2016, the GDP of Guizhou province increased by 10.5%, exceeding the national growth rate by 3.8%. Although Guizhou province is an economically backward region, its economy has been developing rapidly in recent years. Therefore, economic and social development has limited impacts on water security in the short term, but the pressure is increasing year by year. Both Kj(N2006, M) and Kj(N2007, M) belong to the “unsafe” classification, and values from Kj(N2008, M) to Kj(N2012, M) belong to “barely safe”. Current water resource management in karst areas are constraints on water resource security, and there was a lack of management measures for water security in karst areas currently being met.

3.3. Results of Water Resource Security Comprehensive Evaluation in the Karst Area

Overall, the data presented in Table 4 showed that water security in Guizhou province was classed as “generally safe” in 2005, “barely safe” in 2006 and 2011 (when the region experienced drought), and “safe” during the remaining years evaluated. For the period of 2006–2012, the degrees of relevance to the security level were less than 0. For example, the 2006 correlation coefficients were as follows: 0 > Kj(N2006, No1) = −0.318 > Kj(N2006, No2) = −0.144 > Kj(N2006, No3) = −0.123 > Kj(N2006, No4) = −0.229 > Kj(N2006, No5) = −0.361. This finding showed that, although water resource security was relatively high between 2005 and 2012, it was also highly unstable. Individually, the years 2007, 2008, 2009, 2010, and 2012 were graded as “generally safe”. Nonetheless, their respective correlation values are small and <0, indicating that none are fully compliant with the NO2 standard. The state of water resource security in the karst area of Guizhou province was not uniformly positive. Going forward, it will be necessary to reduce nonpoint-source agricultural pollution, strengthen water resource management, control urbanization rationally, develop the requisite sewage treatment infrastructure, and increase water conservancy throughout the karst area. Natural disasters such as drought had a greater impact on water security in karst areas relative to non-karst areas [32]. Kj(N2006) and Kj(N2011) both belonged to the “barely safe” classification. It can be seen that extreme droughts caused by climate change played a decisive role in the overall water security in karst areas compared with economic, social, environmental, and resource management factors. Therefore, the next step is to strengthen the construction of water conservancy infrastructure in the karst region of Guizhou and increase the ability to resist drought and disaster in risk resistance. These are important and crucial measures to enhance water resource security in the karst region.

4. Discussion

(1) It has been found that water resource security in Guizhou was at a moderate warning level from 2005 to 2009 and a barely safe level from 2010 to 2014 (Liu et al., 2018), shown in Table 5. Results of this study showed that it was at “barely safe” in 2006 and 2011 and at “generally safe” in other years. The two results confirmed each other, which showed that the water resource security of Guizhou province was at the edge of critical security. Results of this study confirmed that the water resource security situation was serious.
Liu et al. (2018) found that the influence of the water environment and economic subsystems was much greater than that of the ecological and human subsystems, while the social subsystem had a level of influence between the two [33]. Results of this study confirmed that the influence of the droughts caused by climate change was much greater than that of the ecological and environmental systems, while the disturbance of economic development and human activities had a level of influence between the two. The difference was that Liu et al. did not consider the impact of drought disasters on water security in karst areas. The probability of winter and spring drought in the southwest region (including Guizhou province) was very high, with an average of once every three years, and the severe region could last more than 150 days [33]. Drought disaster is an inevitable and important factor influencing future water resource security in karst areas in the future. In addition to the factors found above, this study also found that water resource management in karst areas was crucial to water resource security.
(2) The same data was processed according to the method outlined in [26] (gray set pair analysis; detailed calculation process is discussed therein), calculation results were shown in Table 3 and Table 4 to compare with the research methods of this article. The results obtained by the two methods are slightly different. The reason for this was that the two methods differed in their principles for determining rank. The gray matter–element method adopted the principle of maximum membership, while gray set pair analysis adopted the principle that degree of connection accumulation was greater than 0.5 for the first time. The calculation results of the two methods were “generally safe” and “barely safe” classifications for 2005 and “barely safe” and “generally safe” classifications for 2011, respectively. However, these classifications belonged to adjacent grades. The same was true for other years. Thus, the gray matter–element method is appropriate for evaluating water resource safety. The gray matter–element method is proven to be suitable for evaluating water resource security.

5. Conclusions

(1)
Using the DPSIR conceptual framework, we constructed a model for evaluating water resource security in karst areas, which we then applied to Guizhou province for the period of 2005–2012. The model incorporates the gray correlation method and matter–element analysis, along with regional data on existing water and land resources and ecosystem health, water resource characteristics in karstic landscapes, and contemporary data on urban construction standards in China relative to global standards. Our results show that Guizhou water resources corresponded to the “generally safe” grade in 2005, to the “barely safe” grade in 2006 and 2011, and again to the “generally safe” grade for the remaining years. The occurrence of drought in both 2006 and 2011 demonstrates that these events have a large impact on karst water resources. From 2005 to 2012, the security of water resources in the Guizhou karst was good yet unstable and, going forward, will continue to face considerable challenges, including drought, agricultural nonpoint-source pollution, rapid urbanization, and an insufficient sewage treatment infrastructure.
(2)
Empirical research on the security of karst water resources showed that the internal mechanism of the DPSIRM framework successfully accounts for interactions among various factors, such as climatic, environmental, social, and economic influences. Additionally, it found that water resource management in karst areas was crucial to water resource security. The DPSIRM model reflected the role of water resource management in resource evaluation. The DPSIRM framework highlights the core role of humans in the water resource security system, That is, people can realize the supervision and regulation of water resource security through management. However, the boundary and degree of its role are difficult to be accurately defined in the evaluation of water resource security, which requires further research and improvement.
(3)
Through comparison with gray set pair analysis, we showed that the two methods gave consistent results. Further, when compared with the traditional multi-index comprehensive evaluation, the matter–element analysis method not only revealed the differentiation rule between single factor indexes but also showed the relationship between the comprehensive safety level and the intermediate transformation process. The gray correlation method was based on objective and subjective corrections and was more reasonable. Therefore, the gray matter–element method is appropriate for evaluating water resource safety, which presents a novel approach for assessing the water resource security issues within (karst) land zones suffering from drought.
(4)
Water resources are the principal factor limiting economic and social growth and environmental viability in karst regions. Because the safety evaluation index system is diverse, there is no uniform standard and evaluation methods are numerous. Here, we have presented a DPSIRM-based method that employs the gray correlation method and matter–element analysis to evaluate the security of water resources in karst areas. Not only are our results in accord with the model situation, the method has certain feasibility. Moreover, in addition, the case selected in this study is a typical karst distribution area, which indicates that this research method has certain applicability in the karst area. Due to the limitations of the data time series obtained, our overarching objective was to explore and verify the quantitative evaluation index systems and suitable methods of water security in karst areas. Thus, prediction was not involved and needs to be explored in the future.

Author Contributions

The study was designed by D.S., F.Z., and J.W. The data from yearbooks and professional websites were retrieved by F.Z. and H.H., D.S. and F.Z. wrote the manuscript. W.S. provided important ideas and suggestions.

Funding

This research was funded by the National Science and Technology project of the “13th Five-Year Plan” [2016YFC0400708], the Guizhou Province Science and Technology Support Program [QKH2016-2845], the Guizhou Provincial Science and Technology Plan Sub-Special Project[QKH-J-2015-2001], and the Guizhou Province Science and Technology Fund [QKH-J.2015-2121].

Conflicts of Interest

The authors declare no conflict of interest.

References

  1. Christensen, N.S.; Wood, A.W.; Voisin, N.; Lettenmaier, D.P.; Palmer, R.N. The effects of climate change on the hydrology and water resources of the Colorado River basin. Clim. Chang. 2004, 62, 337–363. [Google Scholar] [CrossRef]
  2. Wang, W.; Tang, D.; Pilgrim, M.; Liu, J. Water Resources Compound Systems: A Macro Approach to Analysing Water Resource Issues under Changing Situations. Water 2015, 8, 2–12. [Google Scholar] [CrossRef]
  3. Jackson, R.B.; Carpenter, S.R.; Dahm, C.N.; McKnight, D.M.; Naiman, R.J.; Postel, S.L.; Running, S.W. Water in a changing world. Ecol. Appl. 2001, 11, 1027–1045. [Google Scholar] [CrossRef]
  4. Wang, L.; Fang, L.; Hipel, K.W. Basin-wide cooperative water resources allocation. Eur. J. Oper. Res. 2008, 190, 798–817. [Google Scholar] [CrossRef]
  5. Wang, S.; Huang, G.H.; Zhou, Y. A fractional-factorial probabilistic-possibilistic optimization framework for planning water resources management systems with multi-level parametric interactions. J. Environ. Manag. 2016, 172, 97–106. [Google Scholar] [CrossRef] [PubMed]
  6. Oelkers, E.H.; Hering, J.G.; Zhu, C. Water: Is there a global crisis? Elements 2011, 7, 157–162. [Google Scholar] [CrossRef]
  7. Sun, S.; Wang, Y.; Liu, J.; Cai, H.; Wu, P.; Geng, Q.; Xu, L. Sustainability assessment of regional water resources under the DPSIR framework. J. Hydrol. 2016, 532, 140–148. [Google Scholar] [CrossRef]
  8. Ge, L.; Xie, G.; Zhang, C.; Li, S.; Qi, Y.; Cao, S.; He, T. An evaluation of China’s water footprint. Water Resour. Manag. 2011, 25, 2633–2647. [Google Scholar] [CrossRef]
  9. Zhang, J.; Wang, L. Assessment of water resource security in Chongqing City of China: What has been done and what remains to be done? Nat. Hazards 2015, 75, 2751–2772. [Google Scholar] [CrossRef]
  10. Lia, J.; Xib, R.; Wanga, A.; Zhangc, Y.; Huang, H. Early-warning system analysis for water resources security in Tianjin city. Desalin. Water Treat. 2014, 52, 2709–2716. [Google Scholar] [CrossRef]
  11. Dai, J.; Qi, J.; Chi, J.; Chen, S.; Yang, J.; Ju, L.; Chen, B. Integrated water resource security evaluation of Beijing based on GRA and TOPSIS. Front. Earth Sci. China 2010, 4, 357–362. [Google Scholar] [CrossRef]
  12. Liu, K.K.; Li, C.H.; Cai, Y.P.; Xu, M.; Xia, X.H. Comprehensive evaluation of water resources security in the Yellow River basin based on a fuzzy multi-attribute decision analysis approach. Hydrol. Earth Syst. Sci. 2014, 18, 1605–1623. [Google Scholar] [CrossRef] [Green Version]
  13. Organization for Economic Co-operation and Development (OECD). OECD Core Set of Indicators for Environmental Performance Reviews; OECD: Paris, France, 1993. [Google Scholar]
  14. Friend, A.; Rapport, D. Towards a Comprehensive Framework for Environmental Statistics: A Stress-Response Approach; Statistics Canada: Ottawa, ON, USA, 1979. [Google Scholar]
  15. Gentry-Shields, J.; Bartram, J. Human health and the water environment: Using the DPSEEA framework to identify the driving forces of disease. Sci. Total Environ. 2014, 468, 306–314. [Google Scholar] [CrossRef] [PubMed]
  16. Hambling, T.; Weinstein, P.; Slaney, D. A review of frameworks for developing environmental health indicators for climate change and health. Int. J. Environ. Res. Public Health 2011, 8, 2854–2875. [Google Scholar] [CrossRef] [PubMed]
  17. Chen, Y.; Li, B.; Li, Z.; Li, W. Water resource formation and conversion and water security in arid region of Northwest China. J. Geogr. Sci. 2016, 26, 939–952. [Google Scholar] [CrossRef]
  18. Nezami, R.S.; Nazariha, M.; Moridi, A.; Baghvand, A. Environmentally Sound Water Resources Management in Catchment Level using DPSIR Model and Scenario Analysis. Int. J. Environ. Res. 2013, 7, 569–580. [Google Scholar]
  19. Chu, H.D.; Xu, G.L.; Yasufuku, N.; Yu, Z.; Liu, P.L.; Wang, J.F. Risk assessment of water inrush in karst tunnels based on two-class fuzzy comprehensive evaluation method. Arab. J. Geosci. 2017, 10. [Google Scholar] [CrossRef]
  20. Nazif, S.; Karamouz, M.; Yousefi, M.; Zahmatkesh, Z. Increasing Water Security: An Algorithm to Improve Water Distribution Performance. Water Resour. Manag. 2013, 27, 2903–2921. [Google Scholar] [CrossRef]
  21. Sahoo, M.M.; Patra, K.C.; Swain, J.B.; Khatua, K.K. Evaluation of water quality with application of Bayes’ rule and entropy weight method. Eur. J. Environ. Civ. Eng. 2017, 21, 730–752. [Google Scholar] [CrossRef]
  22. Veettil, A.V.; Mishra, A.K. Water security assessment using blue and green water footprint concepts. J. Hydrol. 2016, 542, 589–602. [Google Scholar] [CrossRef]
  23. Wang, W.S.; Jin, J.L.; Ding, J.; Li, Y.Q. A new approach to water resources system assessment—Set pair analysis method. Sci. China Ser. E Technol. Sci. 2009, 52, 3017–3023. [Google Scholar] [CrossRef]
  24. Xia, X.F.; Sun, Y.; Wu, K.; Jiang, Q.H. Optimization of a straw ring-die briquetting process combined analytic hierarchy process and gray correlation analysis method. Fuel Process. Technol. 2016, 152, 303–309. [Google Scholar] [CrossRef]
  25. Zhang, F.; Wang, L.; Su, W. Evaluation of land ecological security in Chongqing based on the matter–element analysis-DPSIR model. China Environ. Sci. 2016, 36, 3126–3134. [Google Scholar]
  26. Zhang, F.; Wang, L.; Su, W. The safety evaluation of water resources based on DPSIRM conceptual framework in karst region. China Environ. Sci. 2015, 35, 3511–3520. [Google Scholar]
  27. He, Y.X.; Dai, A.Y.; Zhu, J.A.; He, H.Y.; Li, F.R. Risk assessment of urban network planning in china based on the matter–element model and extension analysis. Int. J. Electr. Power Energy Syst. 2011, 33, 775–782. [Google Scholar] [CrossRef]
  28. Cao, Q.; Chen, X.; Shi, M. Evaluation of water resources security in the urban area and regulating methods based on DPSIR: A case of Zhangye City. Resour. Sci. 2012, 34, 1591–1599. (In Chinese) [Google Scholar]
  29. Wang, Q.S.; Yuan, X.L.; Zhang, J.; Gao, Y.; Hong, J.L.; Zuo, J.; Liu, W. Assessment of the Sustainable Development Capacity with the Entropy Weight Coefficient Method. Sustainability 2015, 7, 13542–13563. [Google Scholar] [CrossRef] [Green Version]
  30. Zhang, F.; Wang, L.; Su, W.; Yang, Q. Evaluation on the safety of epikarst dualistic water resources by coupling model of entropy weight set pair. J. Hydroelectr. Eng. 2012, 31, 70–77. [Google Scholar]
  31. Yang, Z.; Zhou, Q.; Guo, Y.; Su, W.; Zhang, F. Dynamic assessment of water resources security in karst area based on SPA-MC model—A case study of Guiyang city. China Environ. Sci. 2017, 37, 1589–1600. [Google Scholar]
  32. Shang, C.; Wang, Q.; Hao, Z. Discussion on the reason, character and impact of the serious drought disease in 2009 and 2010 in Guizhou Province. China Water Resour. 2010, 17, 11–14. (In Chinese) [Google Scholar]
  33. Liu, L.; Guan, D.; Yang, Q. Evaluation of water resource security based on an MIV-BP model in a Karst area. Water 2018, 10, 786. [Google Scholar] [CrossRef]
Figure 1. Location of the Guizhou study area.
Sustainability 10 03934 g001
Figure 2. Driving force–pressure–state–impact–response–management (DPSIRM) model framework for evaluating water resource security.
Sustainability 10 03934 g002
Table 1. Water safety indexes and their meanings.
Target LayerFactor LayerIndex LayerWeightWeight of ItemMeaning
Water Resource SecurityDriving forces (D)Per capita GDP (yuan/person)0.0360.178Driving force of economic development on water security
Population density (people/km2)0.0430.214Driving force of population density on water security
Urbanization rate (%)0.0440.220Driving force of regional development on water security
Area of irrigated land that is the proportion of cultivated area (%)0.0410.203Driving force of agricultural development on water security
Annual growth rate of GDP (%)0.0370.184Driving force of economic development intensity on water security
Pressures (P)Water consumption of 10,000 yuan GDP (m3/10,000 yuan)0.0410.200Intensity of economic development pressures on the quantity of water resources
Amount of water used for the industrial production of 10,000 yuan (m3/10,000 yuan)0.0350.173Industrial water pressure on the quantity of water resources
Water for agricultural production (m3/10,000 yuan)0.041 0.199Agricultural water pressure on the quantity of water resources
Discharge of waste water per unit of industrial output (t/10,000 yuan)0.0450.223Industrial production pressure on the quality of water resources
Amount of fertilizer used per unit of cultivated area (kg/hm2)0.0420.204Agricultural production pressure on the quality of water resources
States (S)Water per capita (m3/person)0.0380.294Per capita state of water resources
Water resources per unit area (104 m3/km2)0.0460.357Water resource state of the unit land area
Rate of rocky desertification (%)0.0450.349State of soil erosion
Impact (I)Forest coverage (%)0.0460.244Impact on the surface storage capacity
River water quality index rate (%)0.0420.226Impact on the water quality of rivers
Drought and drought damage as a share of GDP (%)0.0590.318Impact on economy and society
Modulus of sediment yield (t/km2)0.0390.212Impact on soil erosion
Responses (R)Sewage treatment rate (%)0.0380.319Water quality response
Discharge standard-meeting rate of industrial wastewaters (%)0.0370.318Water quality response
Water resource development rate (%)0.0430.363Water quantity response
Management (M)Environmental protection investment as a percentage of GDP (%)0.0440.268Adequacy of fund management
Integrity of the water protection and management system0.0410.248Integrity of management system
Implementation of the water resource protection and management system0.0400.243Effectiveness of management
Information on flood control and drought relief0.0400.242Communication of management information
Table 2. Correlation degree and evaluation results of the water resource security evaluation index.
Correlation Degree200520052006200720082009201020112012
No1No2No3No4No5Grade
kj(x1)−0.0210.0130.0010.000−0.01423322111
kj(x2)0.0200.020−0.032−0.038−0.04121111111
kj(x3)0.0050.0050.015−0.020−0.02413311233
kj(x4)−0.0130.0080.002−0.001−0.00823221111
kj(x5)−0.0110.0050.015−0.004−0.01533332233
kj(x6)−0.0120.012−0.006−0.020−0.02722223333
kj(x7)−0.0120.004−0.002−0.013−0.02222222221
kj(x8)−0.0170.0110.0000.001−0.01024332222
kj(x9)−0.0160.0020.003−0.019−0.02732212222
kj(x0)−0.0240.018−0.0060.017−0.00824444455
kj(x11)−0.0120.0060.014−0.009−0.01833221233
kj(x12)−0.0340.031−0.0230.0000.00025444454
kj(x13)−0.0190.015−0.0010.004−0.00824333333
kj(x14)−0.0050.020−0.006−0.014−0.01922222111
kj(x15)−0.0180.013−0.0060.015−0.00445444334
kj(x16)−0.0160.026−0.017−0.031−0.03723251341
kj(x17)−0.0090.005−0.023−0.030−0.03222222211
kj(x18)−0.0280.027−0.025−0.0200.01825555311
kj(x19)−0.0160.010−0.0030.009−0.00723333322
kj(x20)−0.0180.017−0.011−0.030−0.03622222232
kj(x21)0.0060.006−0.015−0.020−0.02311111112
kj(x22)−0.0220.017−0.013−0.0070.00725444333
kj(x23)−0.0170.011−0.0060.004−0.00124433222
kj(x24)−0.017−0.011−0.0060.0000.00044433332
Table 3. Correlation degrees of DPSIRM factor layers and evaluation results.
YearsComprehensive Correlative DegreeNo1No2No3No4No5Gray Matter–Element MethodGray Set Pair Method
2005Kj(N2005, D)−0.1020.2540.006−0.316−0.510Generally safeBarely safe
Kj(N2005, P)−0.3870.228−0.058−0.163−0.457Generally safeBarely safe
Kj(N2005, S)−0.5110.405−0.074−0.044−0.202Generally safeUnsafe
Kj(N2005, I)−0.2720.363−0.311−0.361−0.538Generally safeGenerally safe
Kj(N2005, R)−0.4960.434−0.310−0.319−0.182Generally safeUnsafe
Kj(N2005, M)−0.3140.137−0.250−0.141−0.100Generally safeVery unsafe
2006Kj(N2006, D)−0.073−0.1980.098−0.370−0.533Barely safeBarely safe
Kj(N2006, P)−0.3620.101−0.173−0.214−0.488Generally safeGenerally safe
Kj(N2006, S)−0.521−0.419−0.069−0.065−0.168UnsafeUnsafe
Kj(N2006, I)−0.264−0.068−0.231−0.391−0.465Generally safeGenerally safe
Kj(N2006, R)−0.494−0.196−0.214−0.402−0.208Generally safeBarely safe
Kj(N2006, M)−0.340−0.218−0.1870.106−0.134UnsafeUnsafe
2007Kj(N2007, D)−0.036−0.1210.014−0.392−0.533Barely safeGenerally safe
Kj(N2007, P)−0.3150.041−0.167−0.327−0.541Generally safeGenerally safe
Kj(N2007, S)−0.459−0.239−0.131−0.085−0.317UnsafeUnsafe
Kj(N2007, I)−0.2280.057−0.356−0.360−0.567Generally safeVery safe
Kj(N2007, R)−0.442−0.102−0.242−0.384−0.270Generally safeBarely safe
Kj(N2007, M)−0.267−0.236−0.1780.014−0.219UnsafeBarely safe
2008Kj(N2008, D)0.0040.033−0.033−0.424−0.553Generally safeGenerally safe
Kj(N2008, P)−0.240−0.021−0.302−0.399−0.580Generally safeGenerally safe
Kj(N2008, S)−0.435−0.222−0.151−0.113−0.338UnsafeUnsafe
Kj(N2008, I)−0.471−0.334−0.514−0.520−0.337Generally safeBarely safe
Kj(N2008, R)−0.434−0.093−0.237−0.367−0.284Generally safeBarely safe
Kj(N2008, M)−0.305−0.1410.041−0.079−0.273Barely safeBarely safe
2009Kj(N2009, D)0.125−0.061−0.247−0.523−0.625Very safeVery safe
Kj(N2009, P)−0.329−0.065−0.157−0.331−0.496Generally safeGenerally safe
Kj(N2009, S)−0.340−0.412−0.245−0.229−0.340UnsafeBarely safe
Kj(N2009, I)−0.109−0.073−0.428−0.430−0.605Generally safeVery safe
Kj(N2009, R)−0.405−0.057−0.161−0.262−0.341Generally safeBarely safe
Kj(N2009, M)−0.259−0.194−0.007−0.065−0.300Barely safeBarely safe
2010Kj(N2010, D)0.178−0.142−0.280−0.547−0.642Very safeVery safe
Kj(N2010, P)−0.3480.013−0.129−0.343−0.506Generally safeGenerally safe
Kj(N2010, S)−0.474−0.319−0.081−0.141−1.343Barely safeBarely safe
Kj(N2010, I)−0.286−0.098−0.128−0.285−0.460Generally safeBarely safe
Kj(N2010, R)−0.3300.0980.081−0.367−0.542Barely safeBarely safe
Kj(N2010, M)−0.232−0.139−0.021−0.240−0.381Barely safeBarely safe
2011Kj(N2011, D)0.129−0.127−0.067−0.474−0.589Very safeVery safe
Kj(N2011, P)−0.289−0.068−0.290−0.474−0.515Generally safeGenerally safe
Kj(N2011, S)−0.555−0.457−0.041−0.195−0.129Barely safeUnsafe
Kj(N2011, I)−0.157−0.214−0.196−0.220−0.448Very safeBarely safe
Kj(N2011, R)−0.219−0.025−0.130−0.465−0.617Generally safeGenerally safe
Kj(N2011, M)−0.229−0.1200.034−0.260−0.397Barely safeBarely safe
2012Kj(N2012, D)0.166−0.216−0.152−0.483−0.602Very safeVery safe
Kj(N2012, P)−0.189−0.173−0.402−0.547−0.531Generally safeVery safe
Kj(N2012, S)−0.446−0.268−0.117−0.165−1.489Barely safeBarely safe
Kj(N2012, I)−0.068−0.084−0.423−0.509−0.625Very safeVery safe
Kj(N2012, R)−0.1340.144−0.327−0.576−0.694Generally safeGenerally safe
Kj(N2012, M)−0.3080.0950.016−0.286−0.415Barely safeGenerally safe
Table 4. Comprehensive correlative degrees and results for the water resource security evaluation index.
YearsComprehensive Correlative DegreeNo1No2No3No4No5Gray Matter–Element MethodGray Set Pair Method
2005Kj(N2005)−0.3260.290−0.155−0.230−0.359Generally safeBarely safe
2006Kj(N2006)−0.318−0.144−0.123−0.229−0.361Barely safeBarely safe
2007Kj(N2007)−0.269−0.087−0.172−0.266−0.431Generally safeGenerally safe
2008Kj(N2008)−0.293−0.123−0.205−0.333−0.413Generally safeGenerally safe
2009Kj(N2009)−0.197−0.130−0.213−0.323−0.472Generally safeGenerally safe
2010Kj(N2010)−0.227−0.096−0.110−0.333−0.616Generally safeGenerally safe
2011Kj(N2011)−0.197−0.161−0.124−0.355−0.460Barely safeGenerally safe
2012Kj(N2012)−0.142−0.096−0.242−0.439−0.686Generally safeGenerally safe
Table 5. Research results.
YearsGray Matter–Element MethodLiu et al., 2018
2005Generally safeModerate Warning
2006Barely safeModerate Warning
2007Generally safeModerate Warning
2008Generally safeModerate Warning
2009Generally safeModerate Warning
2010Generally safeBarely safe
2011Barely safeBarely safe
2012Generally safeBarely safe

