Article

Analysis of Influencing Factors of Big Data Adoption in Chinese Enterprises Using DANP Technique

1
School of Economics and Management, Beijing University of Posts and Telecommunications, Beijing 100876, China
2
School of Automation, Beijing University of Posts and Telecommunications, Beijing 100876, China
*
Author to whom correspondence should be addressed.
Sustainability 2018, 10(11), 3956; https://0-doi-org.brum.beds.ac.uk/10.3390/su10113956
Submission received: 12 September 2018 / Revised: 18 October 2018 / Accepted: 26 October 2018 / Published: 30 October 2018

Abstract

:
Globally, many enterprises are currently focusing on big data technology to improve their performance and operations. Recent literature points out several factors that influence the adoption of big data. However, enterprises often resist using the business value of big data due to a lack of knowledge. The purpose of this study is to investigate the factors influencing big data adoption by Chinese enterprises and to develop an indicator system based on the Motivation–Opportunity–Ability (MOA) model. Moreover, the Decision-Making Trial and Evaluation Laboratory (DEMATEL) method is used to construct a network relationship map and to analyze its effects. Using the DEMATEL-based Analytic Network Process (ANP) (DANP) method to identify the weight distribution of index, this study quantitatively evaluates the influencing factors. The results show that leadership support, perceived usefulness, financial support, data resources, industrial development, data talents, and technical capability are key elements affecting the application of big data. Accordingly, some targeted suggestions are proposed.

1. Introduction

Over the last decade, the development of information and communication technology (ICT) and the Internet have led to massive amounts of data being generated in various fields. The term “big data” is used to describe this phenomenon in the digital world [1]. Big data plays an increasingly significant role in the development of the economy and society [2], garnering attention in both academia and in business [3]. Recent literature describes big data as the next “management revolution” [4], “the fourth paradigm of science” [5], and the “the key to sustainable innovation within an Industry 4.0 factory” [6]. Due to these potentials social and economic benefits, many government agencies have formulated relevant policies to promote the development of big data. Similarly, understanding that big data is a crucial basic strategic resource, China’s “13th Five-Year Plan” propose measures to promote the use of big data in an efficient way. Due to these factors, big data has become a mainstream activity of many organizations [7]. According to the Gartner’s 2015 survey, 76% of global business are planning to invest in big data. Additionally, the China Academy of ICT survey showed that 56% of Chinese enterprises are planning to adopt big data.
Although the significance of big data is widely recognized, there is still no single clear definition of it [8]. In 2011, the International Data Corporation defined big data as follows: “big data technologies describe a new generation of technologies and architectures designed to economically extract value from very large volumes of a wide variety of data by enabling high-velocity capture, discovery, and/or analysis” [9]. This concept is generally recognized because it embodies the characteristic “4Vs” of big data: Volume, Variety, Velocity, and Value. Furthermore, the definition reveals the essential aim of big data, which is discovering hidden values [10]. The United Nations’ Department of Economic and Social Affairs classified big data into three categories: social networks (such as data from Facebook or other social media platforms and Internet searches), traditional business systems (such as data concerning e-commerce transactions), and the Internet of Things (such as data from mobile phone tracking) [11]. The data from these different sources are widely used in multiple fields such as scientific research, government management, and the global economy. This study focuses on the application of big data in commerce and the business field.
Big data can be useful to enterprises from all industries in identifying customer needs, improving productivity, and gaining a competitive advantage. More importantly, big data plays a new and important role in achieving sustainable economic development [12]. Sustainability consists of three aspects: environmental, economic, and social sustainability [13]. Enterprises can improve their contributions to these three areas by using big data to develop resources and boost operational efficiency. Depending on the industry, enterprises can use big data to reduce environmental impact, produce individually tailored goods and services, provide better living experiences, and create many opportunities for innovation and business models. In short, the implementation of big data systems and the use of big data in general can improve sustainability immeasurably [14].
Due to large volumes of data and time constraints regarding processing speed, the adoption of big data is a complex process that includes data collection, organization, storage, analysis, mining, and application [15]. There are many prerequisites for the adoption of big data—such as a well-developed IT infrastructure, the talents of specialist big data analysts, and special analytical tools—to address technical challenges [16]. However, the most important challenge in the adoption of big data is constructing an appropriate model and identifying managerial concerns [17]. This may enable enterprises to consider all the factors that may affect the adoption of big data. However, many companies have little or no knowledge about the concept or use of big data.
Identifying the key factors is a well-known method for conducting a structured system analysis and has been used for effective IT management [18]. Since big data forms part of the larger concept of IT, finding the key influencing factors concerning the adoption of big data is of great interest to both academics and business managers. Several studies have been carried out, presenting a variety of influencing factors concerning the adoption of big data. However, existing literature focused mainly on qualitative research, with most of the studies being based on only one or a small number of dimensions. This indicates a lack of quantitative evaluation and the analysis of the relationships between the influencing factors. The fragmented findings of previous studies point to an urgent need for comprehensive research that can provide clear and systematic insight for scholars and provide guidance concerning the implementation and practice of big data for business managers. To address this gap, this paper aims to provide a systematic study of the influencing factors of big data adoption to broaden the understanding of big data and to assist Chinese enterprises with the adoption of big data. More specifically, we focused on three research objectives:
  • To construct a system that determines the influencing factors for the adoption of big data by Chinse enterprises
  • To explore the relationship among the influencing factors
  • To identify the key factors and calculate the weight of each factor
The remainder of this study is organized as follows: Section 2 contains a literature review and describes the model constructed to determine the influencing factors for the adoption of big data. Section 3 introduced the research methodology and the computational procedure. Section 4 documents the analysis of the relationships among the influencing factors and presents the results. Section 5 discussed the research results and is followed by conclusion in Section 6.

2. Theoretical Framework

The factors that influence the adoption of big data that have been highlighted by very few researchers. For instance, Brinkhues et al. proposed some of the factors that influence data capabilities to be IT infrastructure, data resources, financial support, and cost and earnings expectations [19]. From a knowledge management perspective, Izhar and Shoid suggested that data quality, capacity, infrastructure, and big data awareness were critical factors for the implementation of big data [20]. By investigating Chinese enterprises, Cheng and Li proposed the following factors concerning big data adoption: data talent, technical ability, organizational culture, organizational structure, and data policies [21]. Based on resource-based view, Hu summarized factors that affected enterprises’ motivation to use big data, which include technical capacity, environmental pressure, expected earnings, data resources, and data quality [22]. All these factors should not be seen as independent concepts, as they are all interrelated. These factors and their relationships with each other mean that analyzing the adoption of big data from a systematic perspective could yield convincing results. Previous studies have presented analyses of the interaction mechanism among the different factors. However, framework for these influencing factors which cover all dimensions is scarce.
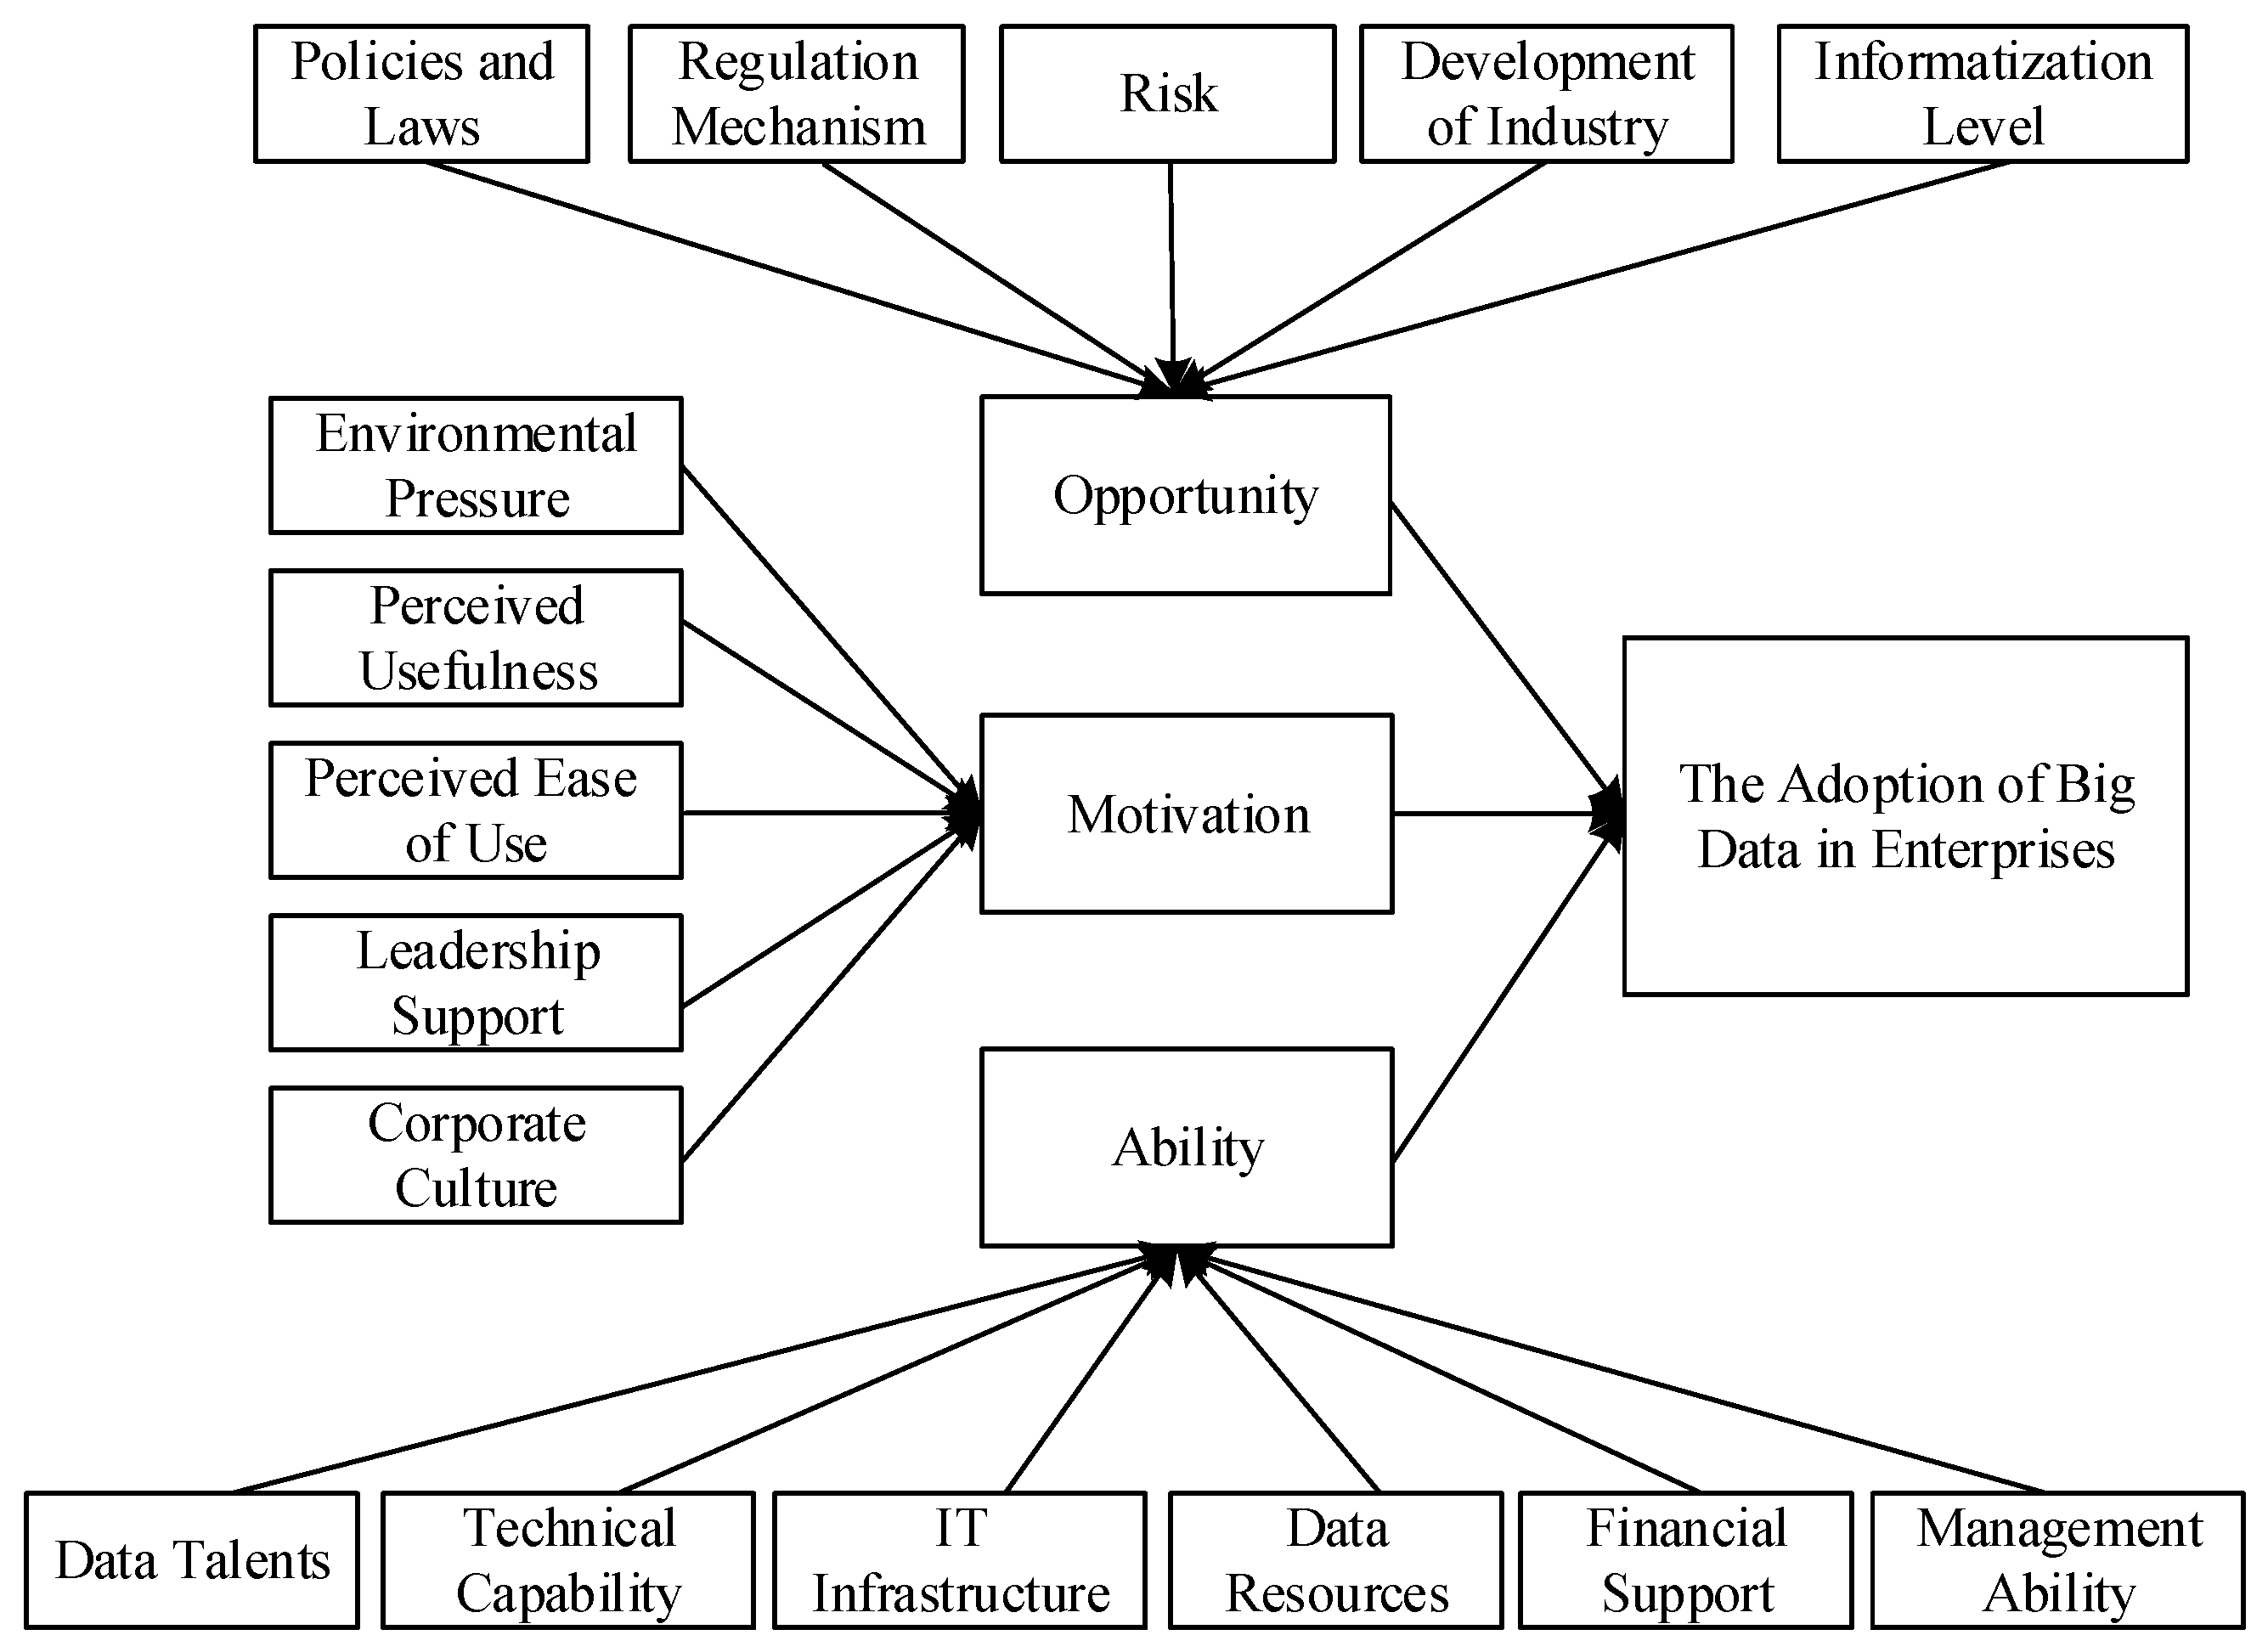
To address this problem, this study employs the Motivation–Opportunity–Ability (MOA) model. The MOA model is a relatively well-known theoretical framework within the field of organizational theory [23]. Ölander & Thøgerson was first to comprehensively analyze and explain the three basic constructs of the MOA model and the relationships between them [24]. The principle of the MOA framework states that each item of motivation, opportunity, and ability is indispensable for the framework to lead to the desired outcome [25]. The MOA framework is characterized as a meta-theory [26] and provides a complete analysis framework to explain individual or organizational behaviors from both subjective and objective perspectives. Therefore, the framework has good stability and predictability [27] which is why it is widely used in various research areas such as the adoption of innovations, business decision-making, marketing, and knowledge management [28]. For example, when analyzing enterprises’ behavior, Zhang applied the MOA theory to explain companies’ behavioral patterns when they constructed a structural hole in the coalition organization [25]. Additionally, Chai and Baudelaire analyzed the main obstacles to the improvement of energy efficiency in Singapore’s basic industries based on the MOA model [29].
Following these previous studies, we propose that big data adoption not only relies on enterprises’ motivation and ability but is also upon how closely linked these enterprises are to specific opportunities within the market and the environment. When associated with an opportunity, the subject’s ability and motivation become more greater [30]. Therefore, the MOA model is suitable to analyze the influencing factors for enterprises’ big data adoption. This study uses the model to construct a framework which in turn examines enterprises’ behavior in-depth. This study also uses expert interviews to summarizes the influencing factors from relevant literatures on the adoption of big data. After the influencing factors have been discovered, they are divided into three dimensions within the MOA framework. The index system is shown in Table 1.
As discussed above, the framework consists of three factors; motivation, opportunity, and ability. We discuss each factor briefly below.
Motivation. The term motivation refers to the desire and willingness to engage in a certain behavior [42] and it is an intrinsic reason for the adoption of big data. There are many factors that may increase the motivation of enterprises, such as leadership support [39], environmental pressure [20], and corporate culture [33]. Moreover, based on the technology acceptance model (TAM), perceived usefulness and perceived ease of use also play an important role for the desire of organizations. Drawing on the current literature mentioned above, we determine five indicators that comprise the dimension of motivation ( m 1 to m 5 shown in Table 1).
Opportunity. Opportunity refers to a collection of external environmental or contextual elements that are not controlled by the subject and enable action [43]. It is clear that the regulation mechanism, policies and laws concerning big data contribute to the legal environment for the adoption of big data [36] while the development of industry [32] and its information level [23] form the industrial foundation. However, Ekbia et al. found that external risk may have a negative impact on enterprises’ activities [41]. We therefore determine five indicators ( o 1 to o 5 shown in Table 1) to describe the dimension of opportunity.
Ability. Ability refers to the knowledge and skills that an entity or enterprise possesses which are relevant to certain behaviors [28]. Because of the technology-intensive nature of big data implementation, enterprises’ ability concerning big data cannot improve without the support of data talents [37], technical capability [40], financial support [38] and data resources [41]. Additionally, it is important to note that IT infrastructure provides the basis for execution of big data, making it an essential element [19]. Lastly, solid management ability would increase the efficiency of big data project. Consequently, we put forward six indicators ( a 1 to a 6 shown in Table 1) that comprise the dimension of ability.
The MOA theoretical framework for this study—including the three dimensions and the 16 sub-variables—is shown in Figure 1.

3. Methodology

3.1. Method Selection

Enterprises’ big data adoption is a complex Multiple-Attribute Decision-Making (MADM) process. A typical decision-making process consists of several different factors: determine goal, criteria, and hierarchy [44]. For this study, determine goal is the adoption of big data. The first-level criteria include motivation, opportunity, and ability and the second-level criteria include 16 factors such as environmental pressure and perceived usefulness. These factors are not independent of each other but are mutually influential and restrictive. Therefore, we need a method to consider the interactions among the various factors.
There are several methods to address MADM problems, such as AHP, TOPSIS, or VIKOR methods. Most methods assume that the criteria that can affect the decision-making process (e.g., the influencing factors of big data adoption in this study), are independent of each other, but for many practical problems, this assumption is not established [44]. Therefore, the Analytic Network Process (ANP) was proposed to address the dependence and feedback between various criteria. However, the ANP method operates under the assumption that the MADM problem network structure is known and the elements are of the same weight. In fact, the network structure is frequently unknown, and the weight of each element differ [45]. Furthermore, the comparison matrices of ANP are too many and some matrices are too complicated to provide accurate and useful information to decision makers [46].
Recent studies have shown a variety of methods that have been widely adopted to solve MADM problems. Among these methods, a combination of Decision-Making Trial and Evaluation Laboratory (DEMATEL) and ANP is one of the most rapidly development methods [46]. The amalgamation of DEMATEL and ANP can be divided into four categories: Network Relationship Map (NRM) of ANP, Inner Dependency in ANP, Cluster-Weighted ANP, and DEMATEL-Based ANP (DANP) [46]. Among these methods, DANP stands out, since it combines the advantages of the other three methods and is more effective than the ANP method alone [47]. Therefore, this method has been developed rapidly and has been applied in fields of policy evaluation, risks analysis and factors research [46]. It has become an important method for addressing MADM situations successfully.
In the DANP method, DEMATEL solves the problem of influencing factors within a multi-factor interleaving system [48]. By using graph theory and matrix tool, the DEMATEL method can calculate the cause and effect of each factor and convert the relationships among factors into an understandable structural model that visually represents the interdependence among the factors (i.e., a directed causal diagram) [49]. The DANP method also adopts a composite influence matrix instead of normal pair wise comparison matrices within the ANP to discover the weight of each factor. This not only reduces the complexity of the ANP method, but also solves the dependence and feedback relation issues among the factors in the system. Therefore, this study uses the DANP method to identify the key influencing factors for the adoption of big data in Chinese enterprises.

3.2. The DANP Method

The DANP method can be summarized as follows [49,50]:
(1) Application of DEMATEL for a NRM
Step 1: Calculating the direct influence matrix
This method first constructs the direct influence matrix (matrix A) according to the logical relationships among the factors. A scale is incorporated that ranges from 0–4, indicating the degree of influence among the factors. The scale values are 0—no, 1—very weak, 2—weak, 3—strong and 4—very strong. Next, the direct influence matrix A = [ a i j ] n × n can be achieved. In matrix A, a i j denotes the degree of impact of element i on element j , and n is the number of factors.
A = [ a 11 a 1 j a 1 n a i 1 a i j a i n a n 1 a n j a n n ]
Step 2: Calculating the normalized direct-relation matrix
Using the normalization Equations (1) and (2) deal with the direct matrix A to achieve a normalized matrix (matrix G).
G = k A
k = m i n { 1 max i j = 1 n a i j , 1 max j i = 1 n a i j }
Step 3: Calculating the total influence matrix
The total influence matrix can be derived from Equation (4), where I represents the identity matrix.
T = G + G 2 + G 3 + = G ( I G ) 1
The row sum d i of the i th row elements t i j of matrix T denotes the factor i that influences others. Similarly, the column sum r j of the j th column elements t i j of matrix T denotes the factor j that is influenced by others. When i = j , c i = d i + r i represents the degree of the central role that factor i plays in the problem. If h i = d i r i is positive, factor i influences others. On the contrary, if h i is negative, factor i is affected by others.
(2) Measuring weights by DANP
Step 4: Normalizing the total influence matrix
The total influence matrix includes T D based on dimensions as well as T C based on criteria. Normalizing T D and T C by Equations (4)–(8), T D α   and   T C α can be derived.
T D α = [ t D α i j ] m × m = [ t D 11 / d 1 t D 1 j / d 1 t D 1 m / d 1 t D i 1 / d i t D i j / d i t D i m / d i t D m 1 / d m t D m j / d m t D m m / d m ]
d i = j = 1 m t D i j ,   i = 1 , 2 , , m
T C α = [ T C α 11 T C α 1 j T C α 1 m T C α i 1 T C α i j T C α i m T C α m 1 T C α m j T C α m m ]
In the normalized matrix T C α , T C α i j is a m i × m j sub-matrix. We take an example sub-matrix T C α 12 to show the process of normalization.
      C 21 C 2 j C 2 m 2 T C α 12 = C 11 C 1 i C 1 m 1 [ t 11 12 / t 1 12 t 1 j 12 / t 1 12 t 1 m 2 12 / t 1 12 t i 1 12 / t i 12 t i j 12 / t i 12 t i m 2 12 / t i 12 t m 1 1 12 / t m 1 12 t m 1 j 12 / t m 1 12 t m 1 m 2 12 / t m 1 12 ]
t i 12 = j = 1 m 2 t i j 12
Step 5: Deriving unweighted super matrix
The unweighted super matrix W can be obtained using Equation (9).
W = ( T C α )
Step 6: Constructing weighted super matrix
T D α is adopted along with the unweighted matrix W using Equation (10) to derive the weighted matrix W α .
W α = T D α W = [ t D α 11 × W 11 t D α 1 i × W i 1 t D α 1 n × W n 1 t D α j 1 × W 1 j t D α j i × W i j t D α j n × W n j t D α n 1 × W 1 n t D α n i × W i n t D α n n × W n n ]
Step 7: Calculating the limited super matrix
By multiple productions of the weighted super matrix W α as l i m h ( W α ) h , the limited supermatrix W * and influential weights of each criterion can be obtained until it has converged and become a long-term stable super matrix.
W * = l i m h ( W α ) h

4. Data Analysis and Results

4.1. Data Collection

The research team designed questionnaires according to the framework of influencing factors of enterprises’ big data adoption (as shown in the Appendix A). Since the scope of this study is limited to Chinese enterprises, the questionnaires were sent to 20 Chinese experts (including 8 scholars that have concentrated their research on big data application, 6 experts with considerable experience in the big data application field, and 6 senior managers from different enterprises that have carried out big data applications). The questionnaire contained two pairwise comparison matrices that need to be completed by experts. The first matrix is for the first-level criteria, which are the three dimensions of motivation, opportunity, and ability. The second matrix pertains to the second-level criteria, which are the 16 sub-criteria that refer to the factors of big data adoption. These experts were required to first determine the relative importance between two criteria and then use the 0–4 scale mentioned in the methodology section to assess their influential strength. Since the DEMATEL method can make the most of the experts’ input, their opinions will be used to calculate the degrees of influence of each criterion, both how they influence others and how they are influenced by others. This data will enable us to build the NRM.

4.2. Building the Network Relation Map (NRM)

Using Equations (1)–(3) to calculate the arithmetic mean value of the questionnaire results, Table 2 and Table 3 depict the given and received influence for each dimension and criterion, respectively.
Table 2 shows that the central degrees are motivation (4.4784), opportunity (3.8274) and ability (4.7758) respectively. The results indicate that the importance of the three dimensions can be prioritized as ability > motivation > opportunity. The Ability dimension is also the most likely to be influenced by others.
Concerning the influencing factors shown in Table 3, the results state that perceived usefulness, development of industry, leadership support and data talents are the most important determinants. Since the values of ( d i r i ) of the factors, which include policies and laws, environmental pressure, perceived usefulness, corporate culture, information level, risk, regulatory mechanism, management ability and development of industry, are positive among these variables. The results of the analysis show that these variables influence other factors. Additionally, the results indicate that perceived ease of use, leadership support, data talents, technical capability, IT infrastructure, data resources and financial support, are negative and are influenced by other factors. Based on the results of Table 2 and Table 3, the NRM of enterprises’ big data adoption is shown in Figure 2 as.

4.3. Finding the Influential Weights of Each Factor

Based on the matrices derived through DEMATEL method, we can use Equations (4)–(9) to obtain the unweighted super matrix W , as shown in Table 4. Next, we drive the weighted super matrix W α by using Equation (10). The matrix is shown in Table 5 below.
Lastly, the limits of the super matrix W α (Equation (11)) are used to derive the weights of each factor as shown in Table 6.
The results discussed above illustrate that the weights of leadership support (0.113), perceived usefulness (0.102), financial support (0.094), data resources (0.088), development of industry (0.081), data talents (0.080) and technological capability (0.078) far exceeds those of other factors. Therefore, these 7 criteria are the key factors for the adoption of big data by enterprises.

5. Discussions

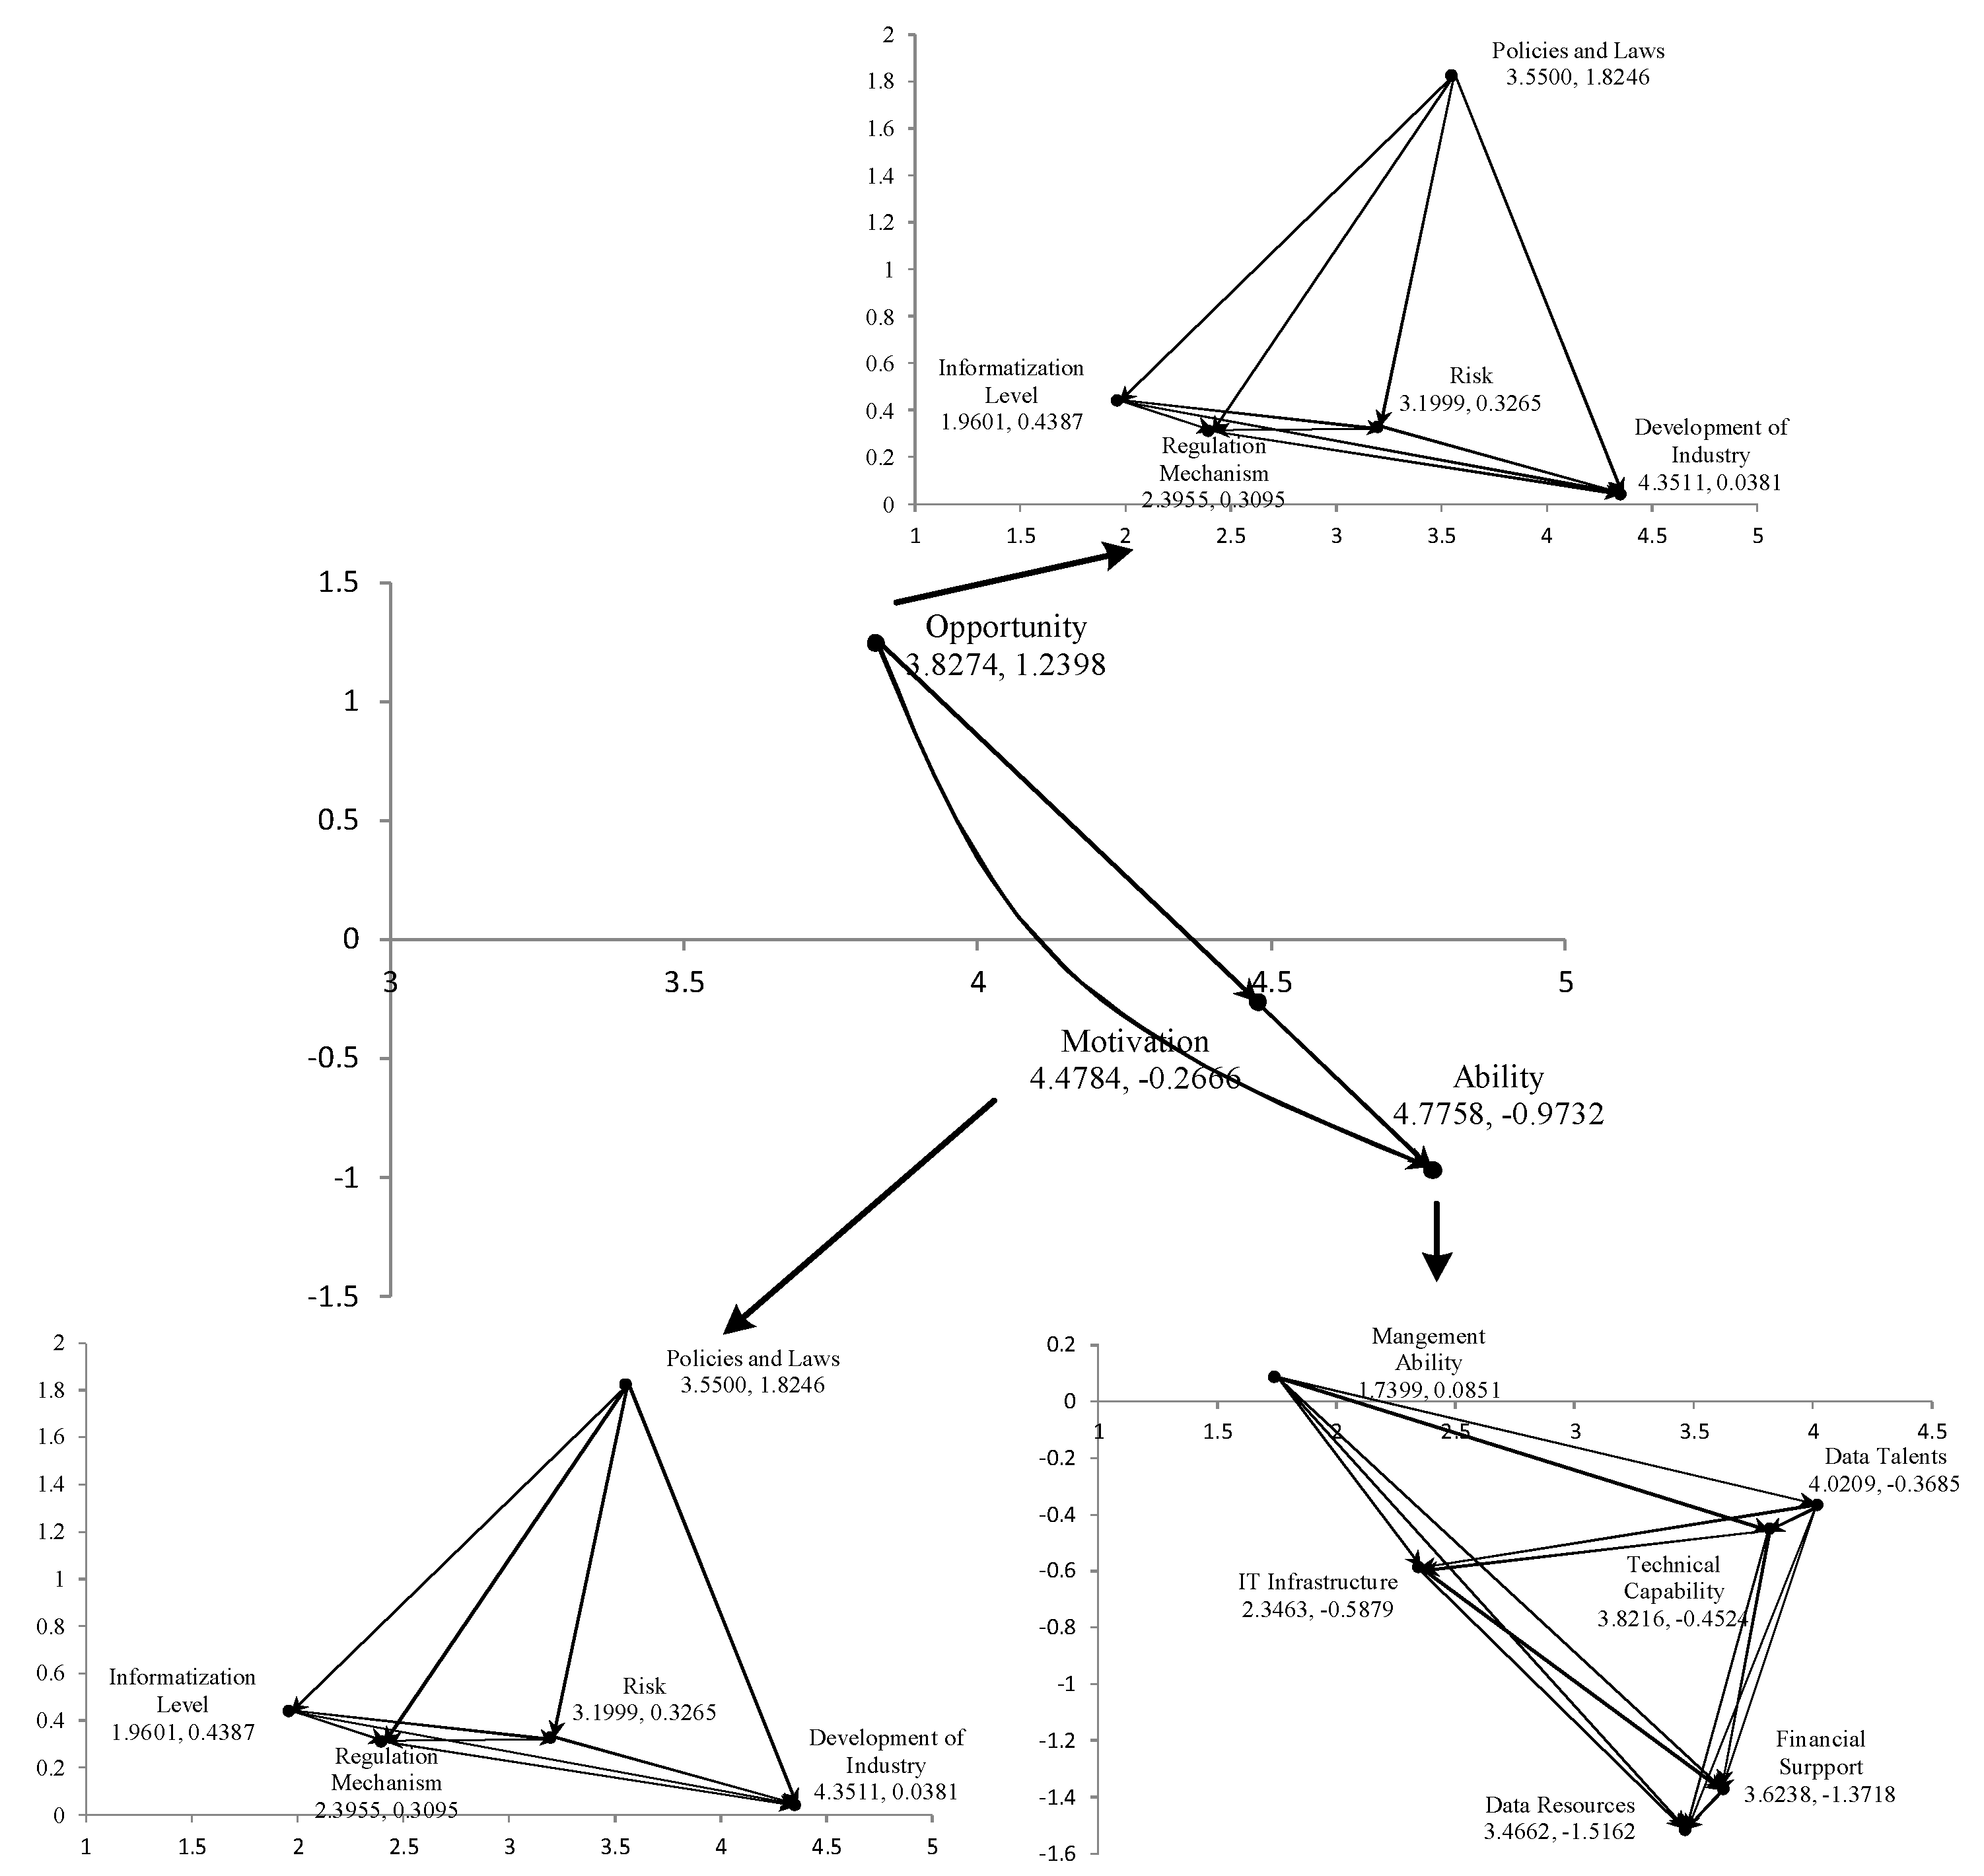
The model to determine enterprises’ big data adoption is illustrated by using an NRM (Figure 2). The dimension of opportunity ( d i ) has the highest value of the three dimensions. This means that it needs to be prioritized for enterprises’ big data adoption which can enhance their motivation and ability. From this information, we derive that the government and business need to improve the top design first to provide good opportunities for enterprises to implement big data. The dimension of Ability has the highest value ( d i + r i ) means that it plays a pivotal part in adoption of big data. In term of factors, the value of policies and laws ( d i ) is the highest. This means that the government needs to recognize the importance of suitable policies and laws pertaining to the promotion of big data adoption and act to instate these policies and laws as soon as possible.
We identified seven key factors from the results of the DANP analysis. The following strategic recommendations are proposed to promote the adoption of big data by Chinese enterprises.
Of the seven identified factors, leadership support and perceived usefulness belong to the dimension of motivation. Since it has the highest value of all the factors, leadership support demands that senior managers of enterprises should change their attitude towards understanding and development of big data, establish big data thinking, and lead their enterprise towards the implementation of big data. Perceived usefulness is the next key factor. If enterprises can perceive the usefulness of big data, they will be likely to adopt big data more enthusiastically. Therefore, enterprises should be encouraged to recognize the importance of big data for improving their operational efficiency and enhancing management level and corporate image. Furthermore, if enterprises recognize the scope and prospects of big data and its expected contributions, they will adopt big data as soon as possible. We therefore state that the cognition of big data (perceived usefulness) can motivate enterprises to adopt big data.
The development of the big data industry is a key factor in the opportunity dimension. Developing the big data industry cannot only can accelerate the cultivation of data talents and technological development, but also provide data trade platforms to increase data resources, which will encourage the development of big data. Moreover, industrial development can simultaneously create external conditions and have a demonstrational effect. It is, therefore, crucial for enterprises’ big data adoption to cultivate leading enterprises, establish big data industry clusters, and optimize a big data industry chain. For example, the establishment of big data industry in Guiyang not only promoted the development of big data in general, but also accelerated the adoption of big data in local government and enterprises, which in turn led to economic development in the whole region.
Financial support, data talents, data resources and technological capability are four key factors in the dimension of ability. The results revealed that all aspects of ability are crucial for the adoption of big data. If enterprises aim to benefit from big data, they should implement a series of processes which include data acquisition, storage, transmission, and analysis. Each process requires funds to provide the required human and material resources and to address possible risks. A lack of funds could obviously lead to failure of the business adoption of big data. As one of the basic conditions for big data adoption, the factor of data resources not only depends upon the enterprise itself to improve data resources acquisition, but the support of government and society to expand data sources and promote data sharing and transactions. The significance of big data does not lie in the accumulation of data, but rather in the insight into the value of data through data analysis. To implement the necessary measures, enterprises need to strengthen their personnel training as well as acquire data talents to improve their advanced technology in real-time. By investigating and implementing the above measures, enterprises can enhance the technical capacity, translate data into knowledge, and promote productivity and the bottom line.

6. Conclusions and Future Research

Although the adoption of big data may provide many benefits to organizations, enterprises should acknowledge and resolve the challenges concerning the adoption of big data before it can add value to their businesses. The process of big data adoption consists of many interrelated factors that may affect enterprises’ activities. Understanding those factors clearly can facilitate the effective use of big data within organizations. Therefore, a comprehensive framework is required for the development and operation of big data.
After a detailed literature review, experts’ opinions were acquired and used to construct an MOA theoretical framework to understand the interdependencies among various factors. This method also expanded the scope of the MOA theory. Our study established an index system from a Chinese perspective and emphasized the importance of coordination of the three dimensions of the model: motivation, opportunity, and ability. The framework provides valuable insight for scholars and managers concerning the full spectrum of factors that influence the adoption of big data. Although some factors in our model have previously been tested in other technology innovation frameworks, this study presents unique factors in the context of big data adoption. An example is data resources that have not been mentioned in other IT adoption studies. However, it is an important factor in this study due to the particular characteristics of big data. Similarly, privacy and security issues pertaining to big data make policies and laws another important factor.
The model used the DEMATEL method to analyze the relationships between the main dimensions and the 16 sub-variables or factors and constructed an NRM. Next, the DANP method was used to do a quantitative analysis, calculate the index weights, and identify the key influencing factors. Using the DANP method corrected the shortcomings of the ANP method and reflected the interdependent feedback relationships among the factors. This ensured that the results were scientific and reasonable. The results illustrate the change in factor weights in big data. For example, according to the factor weights, leadership support is the most significant factor. We believe that this has arisen for two reasons: The first is the unique business context of China, and the second is the fact that big data is changing the methods and models of business management.
Referring to practical implications for enterprises, the conclusions can provide theoretical support and meaningful practical guidance to enterprises to accomplish big data adoption. The framework explained that the development of big data differs from other technological development strategies and government agencies should encourage the development and actively participate in the process of providing policies and support from a legal point of view. Furthermore, this study could assist enterprises in finding the disadvantages in adopting big data. The results could make managers aware of both the positive and the negative aspects of big data adoption in their enterprises and thus enable them to improve weaknesses and make the suitable decisions.
This study provided several contributions but still has some limitations. First, this study was conducted using a small sample size of experts. In the future, a larger sample size may provide more explanatory power. It may also allow a more in-depth analysis to attain results with a more general applicability. Second, this study was conducted in China using Chinese businesses with specific characteristics. These contextual characteristics may influence the understanding of big data adoption practices. Therefore, replications of this study in different geographical contexts and a comparison of the results may represent an important next step. Finally, the results of this study have not been empirically tested. Therefore, future research may invite enterprises to be part of our research to test the findings of this paper. This may provide more managerial implications.

Author Contributions

Conceptualization, L.W. and J.Z.; Methodology L.W. and M.Y.; Software Z.H.P. and S.S.; Validation S.S. and K.S.; Investigation Z.H.P. and S.S.; data curation L.W. and K.S.; Writing—original draft preparation, L.W., Z.H.P. and S.S.; Writing—review and editing, M.Y. and K.S.; Supervision, J.Z. All authors have read and approved the final manuscript.

Funding

This research was funded by the Fundamental Research Funds of Beijing University of Posts and Telecommunications, grant number 2018RC27, 2018XKJC07. The APC was funded by the Fundamental Research Funds of Beijing University of Posts and Telecommunications, grant number 2018RC27, 2018XKJC07.

Acknowledgments

The authors would like to thank the anonymous reviewers for their valuable comments.

Conflicts of Interest

The authors declare no conflict of interest.

Appendix A

Dear Madam/Sir:
Thank you for filling out this questionnaire during your busy schedule. Please rate the relationship among the adoption factors of big data in enterprises, thank you for your support!
Please score the first-level indicator and the second-level indicator according to the scale meaning in the table below and fill in the corresponding points in the blank.
ScaleMeaning
0the row factor has no effect on the column factor
1the row factor has very weak effect on the column factor
2the row factor has weak effect on the column factor
3the row factor has strong effect on the column factor
4the row factor has very strong effect on the column factor
Table A1. The first-level indicator of adoption of big data in enterprises.
Sustainability 10 03956 i001
Table A2. The second-level indicator of adoption of big data in enterprises.
Sustainability 10 03956 i002
M: Motivation, O: Opportunity, A: Ability. m 1 : Environmental Pressure, m 2 : Perceived Ease of Use, m 3 : Perceived Usefulness, m 4 : Leadership Support, m 5 : Corporate Culture. o 1 : Policies and Laws, o 2 : Regulation Mechanism, o 3 : Risk, o 4 : Development of Industry, o 5 : Informatization Level. a 1 : Data Talents, a 2 : Technical Capability, a 3 : IT Infrastructure, a 4 : Data Resources, a 5 : Financial Support, a 6 : Management Ability.

References

  1. Wu, J.; Guo, S.; Li, J.; Zeng, D. Big data meet green challenges: Big data toward green applications. IEEE Syst. J. 2016, 10, 888–900. [Google Scholar] [CrossRef]
  2. Arnaboldi, M. The Missing Variable in Big Data for Social Sciences: The Decision-Maker. Sustainability 2018, 10, 3415. [Google Scholar] [CrossRef]
  3. Hu, F.; Liu, W.; Tsai, S.B.; Gao, J.; Bin, N.; Chen, Q. An Empirical Study on Visualizing the Intellectual Structure and Hotspots of Big Data Research from a Sustainable Perspective. Sustainability 2018, 10, 667. [Google Scholar] [CrossRef]
  4. McAfee, A.; Brynjolfsson, E. Big data: The management revolution. Harv. Bus. Rev. 2012, 90, 60–66. [Google Scholar] [PubMed]
  5. Strawn, G.O. Scientific Research: How Many Paradigms? Educause Rev. 2012, 47, 26. [Google Scholar]
  6. Santos, M.Y.; e Sá, J.O.; Andrade, C.; Lima, F.V.; Costa, E.; Costa, C.; Martinho, B.; Galvão, J. A Big Data system supporting Bosch Braga Industry 4.0 strategy. Int. J. Inf. Manag. 2017, 37, 750–760. [Google Scholar] [CrossRef]
  7. Janssen, M.; van der Voort, H.; Wahyudi, A. Factors influencing big data decision-making quality. J. Bus. Res. 2017, 70, 338–345. [Google Scholar] [CrossRef]
  8. Yau, Y.; Lau, W. Big Data Approach as an Institutional Innovation to Tackle Hong Kong’s Illegal Subdivided Unit Problem. Sustainability 2018, 10, 2709. [Google Scholar] [CrossRef]
  9. Gantz, J.; Reinsel, D. Extracting value from chaos. IDC iView 2011, 1142, 1–12. [Google Scholar]
  10. Chen, M.; Mao, S.; Liu, Y. Big data: A survey. Mob. Netw. Appl. 2014, 19, 171–209. [Google Scholar] [CrossRef]
  11. Hasnat, B. Big Data: An Institutional Perspective on Opportunities and Challenges. J. Econ. Issues 2018, 52, 580–588. [Google Scholar] [CrossRef]
  12. Can, U.; Alatas, B. Big Social Network Data and Sustainable Economic Development. Sustainability 2017, 9, 2027. [Google Scholar] [CrossRef]
  13. Rosen, M.A.; Kishawy, H.A. Sustainable manufacturing and design: Concepts, practices and needs. Sustainability 2012, 4, 154–174. [Google Scholar] [CrossRef]
  14. Etzion, D.; Aragon-Correa, J.A. Big data, management, and sustainability: Strategic opportunities ahead. Organ. Environ. 2016, 29, 3–10. [Google Scholar] [CrossRef] [Green Version]
  15. Raguseo, E. Big data technologies: An empirical investigation on their adoption, benefits and risks for companies. Int. J. Inf. Manag. 2018, 38, 187–195. [Google Scholar] [CrossRef]
  16. Syafrudin, M.; Fitriyani, N.L.; Li, D.; Alfian, G.; Rhee, J.; Kang, Y.S. An Open Source-Based Real-Time Data Processing Architecture Framework for Manufacturing Sustainability. Sustainability 2017, 9, 2139. [Google Scholar] [CrossRef]
  17. Eybers, S.; Hattingh, M. Critical Success Factor Categories for Big Data: A Preliminary Analysis of the Current Academic Landscape. In Proceedings of the IST-Africa 2017 Conference Proceedings, Windhoek, Namibia, 31 May–2 June 2017; pp. 1–11. [Google Scholar]
  18. Lim, C.; Kim, K.H.; Kim, M.J.; Heo, J.Y.; Kim, K.J.; Maglio, P.P. From data to value: A nine-factor framework for data-based value creation in information-intensive services. Int. J. Inf. Manag. 2018, 39, 121–135. [Google Scholar] [CrossRef]
  19. Brinkhues, R.; Freitas Junior, J.C.; Maçada, A.C. Information management capability as competitive imperfection in the strategic factor market of big data. In Proceedings of the Twenty-first Americas Conference on Information Systems, Fajardo, Puerto Rico, 13–15 August 2015. [Google Scholar]
  20. Izhar, T.A.T.; Shoid, M.S.M. A Research Framework on Big Data awareness and Success Factors toward the Implication of Knowledge Management: Critical Review and Theoretical Extension. Int. J. Acad. Res. Bus. Soc. Sci. 2016, 6, 325–338. [Google Scholar] [CrossRef]
  21. Gang, C.; Min, L. Cultivation Mechanism of Big Data Capability of Enterprise. J. Mod. Inf. 2014, 3, 7–11. [Google Scholar]
  22. Shuijing, H. Affecting Factors on Firms’ Acquisition Intention for Big Data Analytics Technology Based on RBV. Inf. Sci. 2016, 5, 148–152. [Google Scholar]
  23. Zhe, F.; Qian, Z. Research on Users’ Contribution Behavior of Q&A Websites from the Perspective of MOA. Libr. Inf. 2015, 5, 123–132. [Google Scholar]
  24. Ölander, F.; Thøgerson, J. Understanding of consumer behaviour as a prerequisite for environmental protection. J. Consum. Policy 1995, 18, 345–385. [Google Scholar] [CrossRef]
  25. Zhang, G. How to Manage Status and Structure Holes in Alliance Combinations? Based on the prospective of MOA Model. Manag. World 2013, 11, 89–100. [Google Scholar]
  26. Baumhof, R.; Decker, T.; Röder, H.; Menrad, K. Which factors determine the extent of house owners’ energy-related refurbishment projects? A Motivation-Opportunity-Ability Approach. Sustain. Cities Soc. 2018, 36, 33–41. [Google Scholar] [CrossRef]
  27. Chen, Z. The Establishment, Development and Core Construct of MOA Model. Res. Libr. Sci. 2013, 13, 53–57. [Google Scholar]
  28. Terho, H.; Eggert, A.; Ulaga, W.; Haas, A.; Böhm, E. Selling Value in Business Markets: Individual and Organizational Factors for Turning the Idea into Action. Ind. Mark. Manag. 2017, 66, 42–55. [Google Scholar] [CrossRef]
  29. Chai, K.H.; Baudelaire, C. Understanding the energy efficiency gap in Singapore: A Motivation, Opportunity, and Ability perspective. J. Clean. Prod. 2015, 100, 224–234. [Google Scholar] [CrossRef]
  30. Argote, L.; McEvily, B.; Reagans, R. Managing knowledge in organizations: An integrative framework and review of emerging themes. Manag. Sci. 2003, 49, 571–582. [Google Scholar] [CrossRef]
  31. Chen, W.; Huang, L. A Review on the Factors Research Stream on Organization Information Technology Adoption. Soft Sci. 2006, 3, 1–4. [Google Scholar]
  32. Shi, J.; Wu, D. Analysis on the Obstacles to the Application of Big Data in Domestic Press and Publication Industry. China Public J. 2015, 23, 29–31. [Google Scholar]
  33. Wamba, S.F.; Akter, S.; Edwards, A.; Chopin, G.; Gnanzou, D. How ‘big data’ can make big impact: Findings from a systematic review and a longitudinal case study. Int. J. Prod. Econ. 2015, 165, 234–246. [Google Scholar] [CrossRef]
  34. He, G.; Wang, G. An Empirical Study on the Mechanism of Organizational Change Motivation to BIM Technology Adoption. Stat. Decis. 2013, 7, 97–100. [Google Scholar]
  35. Wong, L.; Li, Y. The Opening and Sharing of Governmental Big Data: A Study on the Conditions, Obstacles, and Basic Principal. Comp. Econ. Soc. Syst. 2016, 2, 113–122. [Google Scholar]
  36. Jetzek, T.; Avital, M.; Bjorn-Andersen, N. Data-driven innovation through open government data. J. Theor. Appl. Electron. Commer. Res. 2014, 9, 100–120. [Google Scholar] [CrossRef]
  37. Akter, S.; Wamba, S.F. Big data analytics in E-commerce: A systematic review and agenda for future research. Electron. Mark. 2016, 26, 173–194. [Google Scholar] [CrossRef]
  38. Ma, L. Motivation, Ability and Performance of Public Sector Big Data Application: Theoretical Review and Prospect. Electron. Gov. 2016, 4, 62–74. [Google Scholar]
  39. Félix, B.M.; Tavares, E.; Cavalcante, N.W.F. Critical success factors for Big Data adoption in the virtual retail: Magazine Luiza case study. Rev. Bras. Gest. Negoc. 2018, 20, 112–126. [Google Scholar] [Green Version]
  40. Kim, M.K.; Park, J.H. Identifying and prioritizing critical factors for promoting the implementation and usage of big data in healthcare. Inf. Dev. 2017, 33, 257–269. [Google Scholar] [CrossRef]
  41. Ekbia, H.; Mattioli, M.; Kouper, I.; Arave, G.; Ghazinejad, A.; Bowman, T.; Suri, V.R.; Tsou, A.; Weingart, S.; Sugimoto, C.R. Big data, bigger dilemmas: A critical review. J. Assoc. Inf. Sci. Technol. 2015, 66, 1523–1545. [Google Scholar] [CrossRef]
  42. Johnson, J.S.; Sohi, R.S. Getting business-to-business salespeople to implement strategies associated with introducing new products and services. Ind. Mark. Manag. 2017, 62, 137–149. [Google Scholar] [CrossRef]
  43. Baranowski, T.; Smith, M.; Baranowski, J.; Wang, D.T.; Doyle, C.; Lin, L.S.; HEARN, M.D.; Resnicow, K. Low validity of a seven-item fruit and vegetable food frequency questionnaire among third-grade students. J. Am. Diet. Assoc. 1997, 97, 66–68. [Google Scholar] [CrossRef]
  44. BaykasoğLu, A.; KaplanoğLu, V.; DurmuşOğLu, Z.D.; ŞAhin, C. Integrating fuzzy DEMATEL and fuzzy hierarchical TOPSIS methods for truck selection. Expert Syst. Appl. 2013, 40, 899–907. [Google Scholar] [CrossRef]
  45. Yang, Y.P.; Shieh, H.M.; Leu, J.D.; Tzeng, G.H. A novel hybrid MCDM model combined with DEMATEL and ANP with applications. Int. J. Oper. Res. 2008, 5, 160–168. [Google Scholar]
  46. Gölcük, İ.; Baykasoğlu, A. An analysis of DEMATEL approaches for criteria interaction handling within ANP. Expert Syst. Appl. 2016, 46, 346–366. [Google Scholar] [CrossRef]
  47. Kuan, M.J.; Hsiang, C.C.; Tzeng, G.H. Probing the innovative quality system structure model for NPD Process based on combining DANP with MCDM model. Int. J. Innov. Comput. Inf. Control 2012, 8, 5745. [Google Scholar]
  48. Uygun, Ö.; Kaçamak, H.; Kahraman, Ü.A. An integrated DEMATEL and Fuzzy ANP techniques for evaluation and selection of outsourcing provider for a telecommunication company. Comput. Ind. Eng. 2015, 86, 137–146. [Google Scholar] [CrossRef]
  49. Liu, C.H.; Tzeng, G.H.; Lee, M.H. Improving tourism policy implementation—The use of hybrid MCDM models. Tour. Manag. 2012, 33, 413–426. [Google Scholar] [CrossRef]
  50. Liou, J.J.H. Building an effective system for carbon reduction management. J. Clean. Prod. 2015, 103, 353–361. [Google Scholar] [CrossRef]
Figure 1. The research framework.
Sustainability 10 03956 g001
Figure 2. Network relation map of Enterprises’ big data adoption.
Sustainability 10 03956 g002
Table 1. The index system of influencing factors.
Influencing FactorsLiteraturesDimension
Environmental Pressure m 1 Chen and Huang [31], Shi and Wu [32], Wamba et al. [33], He and Wang [34], Hu [11], Izhar and Shoid [20]motivation
Perceived Ease of Use m 2 Chen and Huang [31], Wong and Li [35], Jetzek et al. [36], He and Wang [34]motivation
Perceived Usefulness m 3 Cheng and Li [21], Brinkhues et al. [19], Shi and Wu [32], Wamba et al. [33], Hu [22], Izhar and Shoid [20]motivation
Leadership Support m 4 Jetzek et al. [26], Wamba et al. [33], Akter and Wamba [37], He and Wang [34], Ma [38], Félix et al. [39]motivation
Corporate Culture m 5 Jetzek et al. [36], Wamba et al. [33], Akter and Wamba [37], Hu [22], Ma [38], Félix et al. [39]motivation
Policies and Laws o 1 Cheng and Li [21], Jetzek et al. [36], Wamba et al. [33], Wong and Li [35], Kim and Park [40], Ekbia et al. [41]opportunity
Regulation Mechanism o 2 Chen and Huang [31], Cheng and Li [21], Jetzek et al. [36], Ma [38], Kim and Park [40]opportunity
Risk o 3 Ekbia et al. [41], Wamba et al. [33], Akter and Wamba [37], Wong and Li [35], Kim and Park [40], Félix et al. [39]opportunity
Development of Industry o 4 Chen and Huang [31], Cheng and Li [21], Shi and Wu [32], Wamba et al. [33], Kim and Park [40]opportunity
Informatization Level o 5 Chen and Huang [31], Cheng and Li [21], Jetzek et al. [36], Wamba et al. [33], Wong and Li [35], Janssen et al. [7]opportunity
Data Talents a 1 Cheng and Li [21], Wamba et al. [33], Akter and Wamba [37], Ma [38], Wong and Li [35], Janssen et al. [7], Kim and Park [40], Félix et al. [39]ability
Technical Capability a 2 Jetzek et al. [36], Brinkhues et al. [19], Wamba et al. [33], Akter and Wamba [37], Hu [22], Izhar and Shoid [20], Ma [38], Kim and Park [40]ability
IT Infrastructure a 3 Brinkhues et al. [19], Ekbia et al. [41], Shi and Wu [32], Akter and Wamba [37], He and Wang [34], Izhar and Shoid [20], Wong and Li [35], Janssen et al. [7]ability
Data Resources a 4 Jetzek et al. [36], Brinkhues et al. [19], Ekbia et al. [41], Akter and Wamba [37], Hu [22], Izhar and Shoid [20], Janssen et al. [7], Kim and Park [40], Félix et al. [39]ability
Financial Support a 5 Chen and Huang [31], Cheng and Li [21], Brinkhues et al. [19], Ekbia et al. [41], Wong and Li [35], Ma [38], Kim and Park [40]ability
Management Ability a 6 Chen and Huang [31], Cheng and Li [21], Jetzek et al. [36], Brinkhues et al. [19], Akter and Wamba [37], He and Wang [34], Félix et al. [39]ability
Table 2. Sum of influences given and received on dimensions.
M O A d i r i d i + r i d i r i
M 0.58500.45671.06422.10592.37254.4784−0.2666
O 0.98160.38451.16752.53361.29383.82741.2398
A 0.80590.45260.64281.90132.87454.7758−0.9732
Table 3. Sum of influences given and received on criteria.
m 1 m 2 m 3 m 4 m 5 o 1 o 2 o 3 o 4 o 5 a 1 a 2 a 3 a 4 a 5 a 6
d i 1.7820.6812.5852.0731.3802.6871.3531.7632.1951.1991.8261.6850.8790.9751.1260.913
r i 1.0081.3571.9002.2470.7160.8631.0431.4372.1570.7612.1952.1371.4672.4912.4980.827
d i + r i 2.7902.0384.4854.3202.0953.5502.3963.2004.3511.9604.0213.8222.3463.4663.6241.740
d i r i 0.774−0.6760.685−0.1740.6641.8250.3100.3270.0380.439−0.369−0.452−0.588−1.516−1.3720.085
Table 4. The unweighted super matrix W .
m 1 m 2 m 3 m 4 m 5 o 1 o 2 o 3 o 4 o 5 a 1 a 2 a 3 a 4 a 5 a 6
m 1 0.0790.4140.1840.1000.2310.1890.1090.0950.1950.0890.0810.0830.0660.0830.0790.191
m 2 0.2110.1250.1360.1250.2070.1200.3000.2810.1660.2450.2000.2660.2490.0760.1220.220
m 3 0.2890.2070.2080.3000.2400.2810.1770.1810.2220.2900.3170.3200.3080.4010.3580.131
m 4 0.3480.2070.3920.2150.2700.3430.3460.3740.2990.2020.2990.2710.3260.3710.3680.279
m 5 0.0730.0470.0800.2600.0530.0680.0680.0700.1190.1750.1030.0600.0530.0690.0740.180
o 1 0.1020.0940.1460.1630.1120.0870.2400.2330.1950.0880.0880.0850.1060.1030.1000.098
o 2 0.1130.1070.1600.1800.1220.2460.0970.2460.2130.2710.1030.0980.1160.1120.1110.106
o 3 0.2010.2370.2020.1550.3610.2230.2950.1150.2120.2500.2520.2830.3870.1240.1800.466
o 4 0.4610.4210.3450.3370.2990.3230.3160.3390.2260.3260.3680.3740.2920.5650.4890.252
o 5 0.1240.1410.1470.1640.1070.1210.0520.0670.1550.0660.1890.1610.0990.0960.1200.079
a 1 0.1900.1880.2040.1910.1960.2050.1500.1860.2170.1970.1210.1960.1150.1630.2260.232
a 2 0.1600.1970.1930.1490.1200.1880.1470.1840.2150.2000.3130.1360.2530.1470.1790.123
a 3 0.1670.1720.1400.1340.0980.1280.1760.0880.0910.0750.1470.0890.0760.1070.2000.092
a 4 0.1790.2000.1710.1580.1270.2420.3150.2930.2300.3390.1380.2680.2770.1530.2360.238
a 5 0.2100.2100.2190.2430.2730.1890.1680.2060.1950.1460.1900.2680.2420.3730.1210.258
a 6 0.0950.0330.0730.1250.1860.0490.0440.0430.0520.0430.0910.0430.0380.0570.0370.059
Table 5. The weighted super matrix W α .
m 1 m 2 m 3 m 4 m 5 o 1 o 2 o 3 o 4 o 5 a 1 a 2 a 3 a 4 a 5 a 6
m 1 0.0220.1150.0510.0280.0640.0730.0420.0370.0750.0340.0340.0350.0280.0350.0330.081
m 2 0.0590.0350.0380.0350.0570.0470.1160.1090.0640.0950.0850.1130.1060.0320.0520.093
m 3 0.0800.0570.0580.0830.0670.1090.0690.0700.0860.1120.1340.1360.1300.1700.1520.056
m 4 0.0970.0580.1090.0600.0750.1330.1340.1450.1160.0780.1270.1150.1380.1570.1560.118
m 5 0.0200.0130.0220.0720.0150.0260.0260.0270.0460.0680.0440.0250.0220.0290.0310.076
o 1 0.0220.0210.0320.0350.0240.0130.0370.0350.0300.0130.0210.0200.0250.0240.0240.023
o 2 0.0250.0230.0350.0390.0270.0370.0150.0370.0320.0410.0250.0230.0280.0270.0270.025
o 3 0.0440.0510.0440.0340.0780.0340.0450.0170.0320.0380.0600.0670.0920.0300.0430.111
o 4 0.1000.0910.0750.0730.0650.0490.0480.0520.0340.0500.0880.0890.0700.1340.1160.060
o 5 0.0270.0310.0320.0360.0230.0180.0080.0100.0240.0100.0450.0380.0240.0230.0290.019
a 1 0.0960.0950.1030.0960.0990.0940.0690.0860.1000.0910.0410.0660.0390.0550.0760.079
a 2 0.0810.1000.0980.0750.0610.0860.0680.0850.0990.0920.1060.0460.0850.0500.0610.041
a 3 0.0840.0870.0710.0680.0490.0590.0810.0410.0420.0350.0500.0300.0260.0360.0680.031
a 4 0.0900.1010.0870.0800.0640.1120.1450.1350.1060.1560.0470.0910.0940.0520.0800.080
a 5 0.1060.1060.1110.1230.1380.0870.0780.0950.0900.0680.0640.0910.0820.1260.0410.087
a 6 0.0480.0170.0370.0630.0940.0230.0200.0200.0240.0200.0310.0150.0130.0190.0130.020
Table 6. The weights of dimensions and criteria.
DimensionsGlobal WeightsCriteriaGlobal Weights
Motivation0.363Environmental Pressure0.047
Perceived Ease of Use0.064
Perceived Usefulness0.102
Leadership Support0.113
Corporate Culture0.036
Opportunity0.212Policies and Laws0.026
Regulation Mechanism0.030
Risk0.048
Development of Industry0.081
Informatization Level0.028
Ability0.425Data Talents0.080
Technological Capability0.078
IT Infrastructure0.055
Data Resources0.088
Financial Support0.094
Management Ability0.030

