Impact of Construction IT Technology Convergence Innovation on Business Performance

1
Department of Architectural & Civil Engineering, Dongseo University, Busan 47011, Korea
2
Department of Public Administration, Korea University, Seoul 02841, Korea
*
Author to whom correspondence should be addressed.
Sustainability 2018, 10(11), 3972; https://0-doi-org.brum.beds.ac.uk/10.3390/su10113972
Submission received: 17 August 2018
/
Revised: 22 October 2018
/
Accepted: 25 October 2018
/
Published: 31 October 2018
(This article belongs to the Special Issue Sustainability of Economy, Society, and Environment in the 4th Industrial Revolution)
Abstract
:As the era of the fourth Industrial revolution begins, there is high demand for new information technology (IT) innovation to address the challenges of a dramatically changing industrial landscape. The construction industry, which is one the most important traditional industries in Korea, has adopted new IT innovation in their products to meet customer demand, regulation from government, energy efficiency, security, and so on. The aim of our study is to empirically clarify the impact of technology innovation on the business performance for Korean domestic construction conglomerates. The study performs an empirical analysis with time series analysis on business performance from the perspective of client satisfaction with the services the target companies provide and the production process improvement, as well as from a financial perspective. As analysis data, statistical data from the Ministry of Science, ICT, and Future Planning; Brand Stock; Bank of Korea; and each company are utilized, and the target companies for our study are limited to 19 construction companies with an apartment brand. Multiple regression analysis is used as a fundamental analysis methodology of our study. For Time Series Analysis, the Box Jenkins Model, namely, ARIMA is utilized. According to our results, it is found that any improvement of IT convergence innovation competence such as business efficiency IT index, collaboration IT index, and strategy management IT index has a positive impact on the production process, financial performance, and customer satisfaction with the services the companies provide.
1. Introduction
Human history has been focused around the development of new technologies and technical innovations, which have brought about great changes in the social and economic structure, not just changes in technology [1]. We call periods in which there are rapid technological innovations that result in social and economic changes ‘Industrial Revolutions.’ In the course of human history, scientific and technological events such as ‘Industrial Revolutions’ have only taken place very recently [2]. The first human beings, ‘Homo Sapiens,’ were recorded as having appeared on the Earth around 200,000 or 70,000 to 80,000 years ago. The first Industrial Revolution, our turning point from an agricultural society to a modern society, took place about 200 years ago, which shows that our society has developed and changed within a very short period of time. In addition, as our society has advanced to a modern society, the cycle of new technology and technical innovation has become extremely shortened, while the technology penetration rate has increased [3,4,5,6].
It took 76 years for the wired telephone invented by Graham Bell in 1876 to go from 10 percent to 90 percent penetration [7]. On the other hand, commercialized Internet took just 20 years to achieve the same level of penetration, while mobile phones required just 14 years, which speaks to the dramatic diffusion of technology along with the speed of technical development [8]. That is, new technologies have a shorter cycle and their influence has been greater [9]. Having experienced the rapid changes brought about by two Industrial Revolutions, we are now living in the era of the Third Industrial Revolution, and preparing for the Fourth Industrial Revolution [10]. In recent years, Technology has been the important factor in the information society [11]. The more importantly innovation is emphasized, the more frequently technology is being recognized [11]. In the fierce global competition environment, it is a necessary strategy for companies to create new services by fusing themselves with other industries to make inroads into new markets and ultimately achieve sustained growth. IT convergence technical innovation within a company is an important factor to select and promote a convergence strategy [12]. Technological conversion is being created through technological advances [11]. Following this trend, the companies should know the changes and what things they need to adapt for their own sustainable technological strategies [11]. Considering the importance of IT convergence innovations, many companies strive to achieve business performance by introducing various innovations and diffusing them within their companies, but it is undeniable that business performance through IT convergence innovations is hard to evaluate [12]. However, many global companies recognize the importance of IT convergence innovations and try to introduce and accept multiple policies and systems in order to reduce or remove disincentives to sustained growth [13].
Recently, a number of researchers have analyzed the relationship between IT convergence innovations and business performance, and presented their research findings [13]. However, many of the previous studies analyzed business performance only from a financial and productive perspective [14]. Also, R&D practitioners have difficulties in analyzing emerging new technologies because of the rapid advances of technological innovation [15]. The Korean industrial environment has experienced significant change in its industrial framework through the Fourth industrial revolution [16]. When a company wants to obtain significant business returns from an innovation, IT strategy has been shown to be an important factor in making a decision for integration and collaboration [17]. Our study is significant in that it includes not only the financial performance brought about by IT convergence innovations, which has been discussed in the previous studies, but also considers the main resulting factors of the production process and customer satisfaction with the products and services the target companies provide [11]. Some of the previous studies apparently contradict the impact of IT innovation on business performance [18,19]. Specifically, one previous study claims that the introduction of a system for IT innovation has a positive impact on financial growth, while another study maintains that it has no impact on financial growth [20]. For this reason, our study performs an empirical study on the relationship between the level of an IT convergence innovation and business performance for construction conglomerates in Korea. The analytical materials cover 19 construction companies which have measurable business performance based on the publically announced company information data and finance statistical data. As for the methodology, it used a multiple regression analysis and time series analysis (TSA), ARIMA model to address the result of our study.
2. Literature Review and Research Framework
2.1. Innovation
The concept of innovation is so broad that it has been studied in a number of academic realms, from management and the behavioral sciences including sociology, psychology, and anthropology to economics and also to politics [16,21]. Innovation is defined differently by scholars, but it is largely defined as offering a new change to the organization which adopts it in the form of a product, technology, or program or another vehicle [15,17]. Since a new change to an organization is subjective and relative, it is differentiated from an absolute and objective fact [16,22].
Gopalakrishnan & Damanpur explain that innovation is one of the means by which a new change can be accepted according to creation and changes [23,24]. The perceived attributes include relative advantage, compatibility, trialability, observability, and complexity, and he maintains that the process of innovation diffusion gets faster when relative advantage, compatibility, trialability, and observability are higher while complexity is lower [25]. The innovation diffusion theory provides an explanation of a diffusion phenomenon within a particular organization or society with the passage of time [19]. The innovation diffusion theory has been studied in a wide variety of academic fields, and in the information and technology innovation field in particular since 1980 [19,26].
Since technology innovation is one of the important forms of innovation that a company implements, understanding how this innovation is diffused in an organization and accepted by its members is an important theoretical foundation for understanding the technology innovation within a company [27]. Rogers proposes an innovation diffusion theory, and refers to a process of communication between members within an organization through a channel with the passage of time [19]. According to his explanation, innovation diffusion includes four main factors: innovation, communication channel, time, and organizational system [19].
First, innovation can be defined if it is absolute and objective and newly accepted within a group from various points of view [19,27]. From this perspective, one thing can be considered as an innovation by an organization, while not considered as an innovation by others [19,27]. Second, the communication channel is defined as an information production and sharing process between members who form reciprocal interests [19]. This communication channel is defined as a means and method through which information is conveyed and shared [25]. The information obtained within the organizational communication system is propagated and diffused to the members who lack knowledge of an innovation [9,26]. Third, time plays an important role in the process of innovation diffusion, and can also be explained as meaning the relative swiftness or delay in the selection of an innovation and the adoption of the innovation, or innovation decision process [16,22,28]. Lastly, the interconnectivity between members in an organization is a group of units to achieve a common goal within a social system [29]. In addition, because values, attributes, and norms within a social system affect the adoption of an innovation, the social system is an important foundation on which an innovation is diffused [25,30].
Utterback defines innovation diffusion as taking place in five phases depending on the level of an innovation [28]. An organization can make advancement at the first and second phases of the evolution if it only accepts an innovation. However, it can make advancement if it achieves its business innovation as well as its technology innovation at the third through fifth phases [31]. At the first phase of the evolution or localized exploitation, a functionally distributed system is developed, and efforts should be made to increase efficiency and effectiveness, which would bring about a high cost reduction in its related parts [21,28].
It is defined that at the second phase of the evolution, the interconnection of an innovative technology is incorporated through the internal integration, and an application is interconnected with different systems, which is an innovation factor; operability is also included [18,30]. In addition, organizational roles and responsibilities are highly interconnected between functional lines distinguished by technology innovation factors and interconnection of business processes. Beyond the second phase of evolution, which is when an organization enters the third phase or business process redesign, a new business processing and procedure is composed through a technology innovation, and most of the logic and system of the business process is reviewed appropriately for the technology innovation factors [25,28].
The fourth phase is the business network phase, at which innovation technologies are accepted to incorporate business with other related organizations beyond an organization by reducing re-entry of data and improving responsiveness for an effective information exchange [28]. In addition, all of the other factors necessary for internal and external innovation of an organization need to be adjusted through a common, innovative platform. The last phase of innovation is the business scope redefinition phase, at which the frame of the value chain by which an organization performs activities is fundamentally recomposed and the organization goes through a new innovation process [16,22,30].
Technology Innovation is one of the critical factors to sustain the deployment in the construction industry [32]. Also, technology innovation is a critical role which contributes to the competitiveness of construction enterprises [33]. Technology innovation is crucial factor for implementing successful construction projects [34]. R&D activities and new product development can be improved with collaboration ratio when the economy of industry changes to a knowledge-based economy [35]. Leadership in strategic management is also a key factor for enhancing innovation in a construction company [36].
2.2. IT Convergence Innovation
Many innovations in recent years have been caused by technological convergence [31]. The organization redesigns and newly composes its business process and network for innovation adoption. IT convergence innovations is a concept incorporating various IT innovations both within an organization and between organizations, and many of the previous studies have analyzed that IT convergence innovations have a positive relationship with business performance [15,16,23]. Some of the related studies are summarized below.
First, Mahmood and Mann, and Harris and Karz claim that an improvement of IT convergence level accompanied with an investment in IT has a significant relationship with strategic performance variables of an organization [19,22]. They mention that the ratio of the expenses for IT and various aspects of an investment in IT have a positive impact on business performance [22]. Oliner and Sichel reveal that increased productivity of an organization results from the IT industry that contributes to an increase in much of the total factor productivity [20]. Freedman conducted their studies on the relationship of an IT convergence technology with productivity from different perspectives by using time series data, panel data, and industry level data, respectively [18]. Second, many of the previous studies maintain that the innovation level of an IT convergence technology has a positive relationship with business performance, but some show different findings [18]. “There is nothing to be known about how and why an IT innovation or a strategy has something to do with a business performance system” [20], and “In the studies on IT innovations, a significant emphasis has been put on business performance, but in the studies on business performance, almost no interest has been shown in IT innovations” [23].
From a business perspective, IT convergence may improve a path dependency to serve as a block to a company’s innovative activities and suggest a strategy to guarantee competitive advantages [30]. The government in Korea established “Basic principle for development of national technology convergence” in 2006 and has tried to provide the support for R&D projects in Korea [30]. Since 2012, the Korean guarantee has been enhancing a national competence of IT Innovation by creating the structure of the main industry and developing a creative economy to establish the industrial convergence and IT convergence diffusion strategy [30].
3. Research Framework and Hypothesis
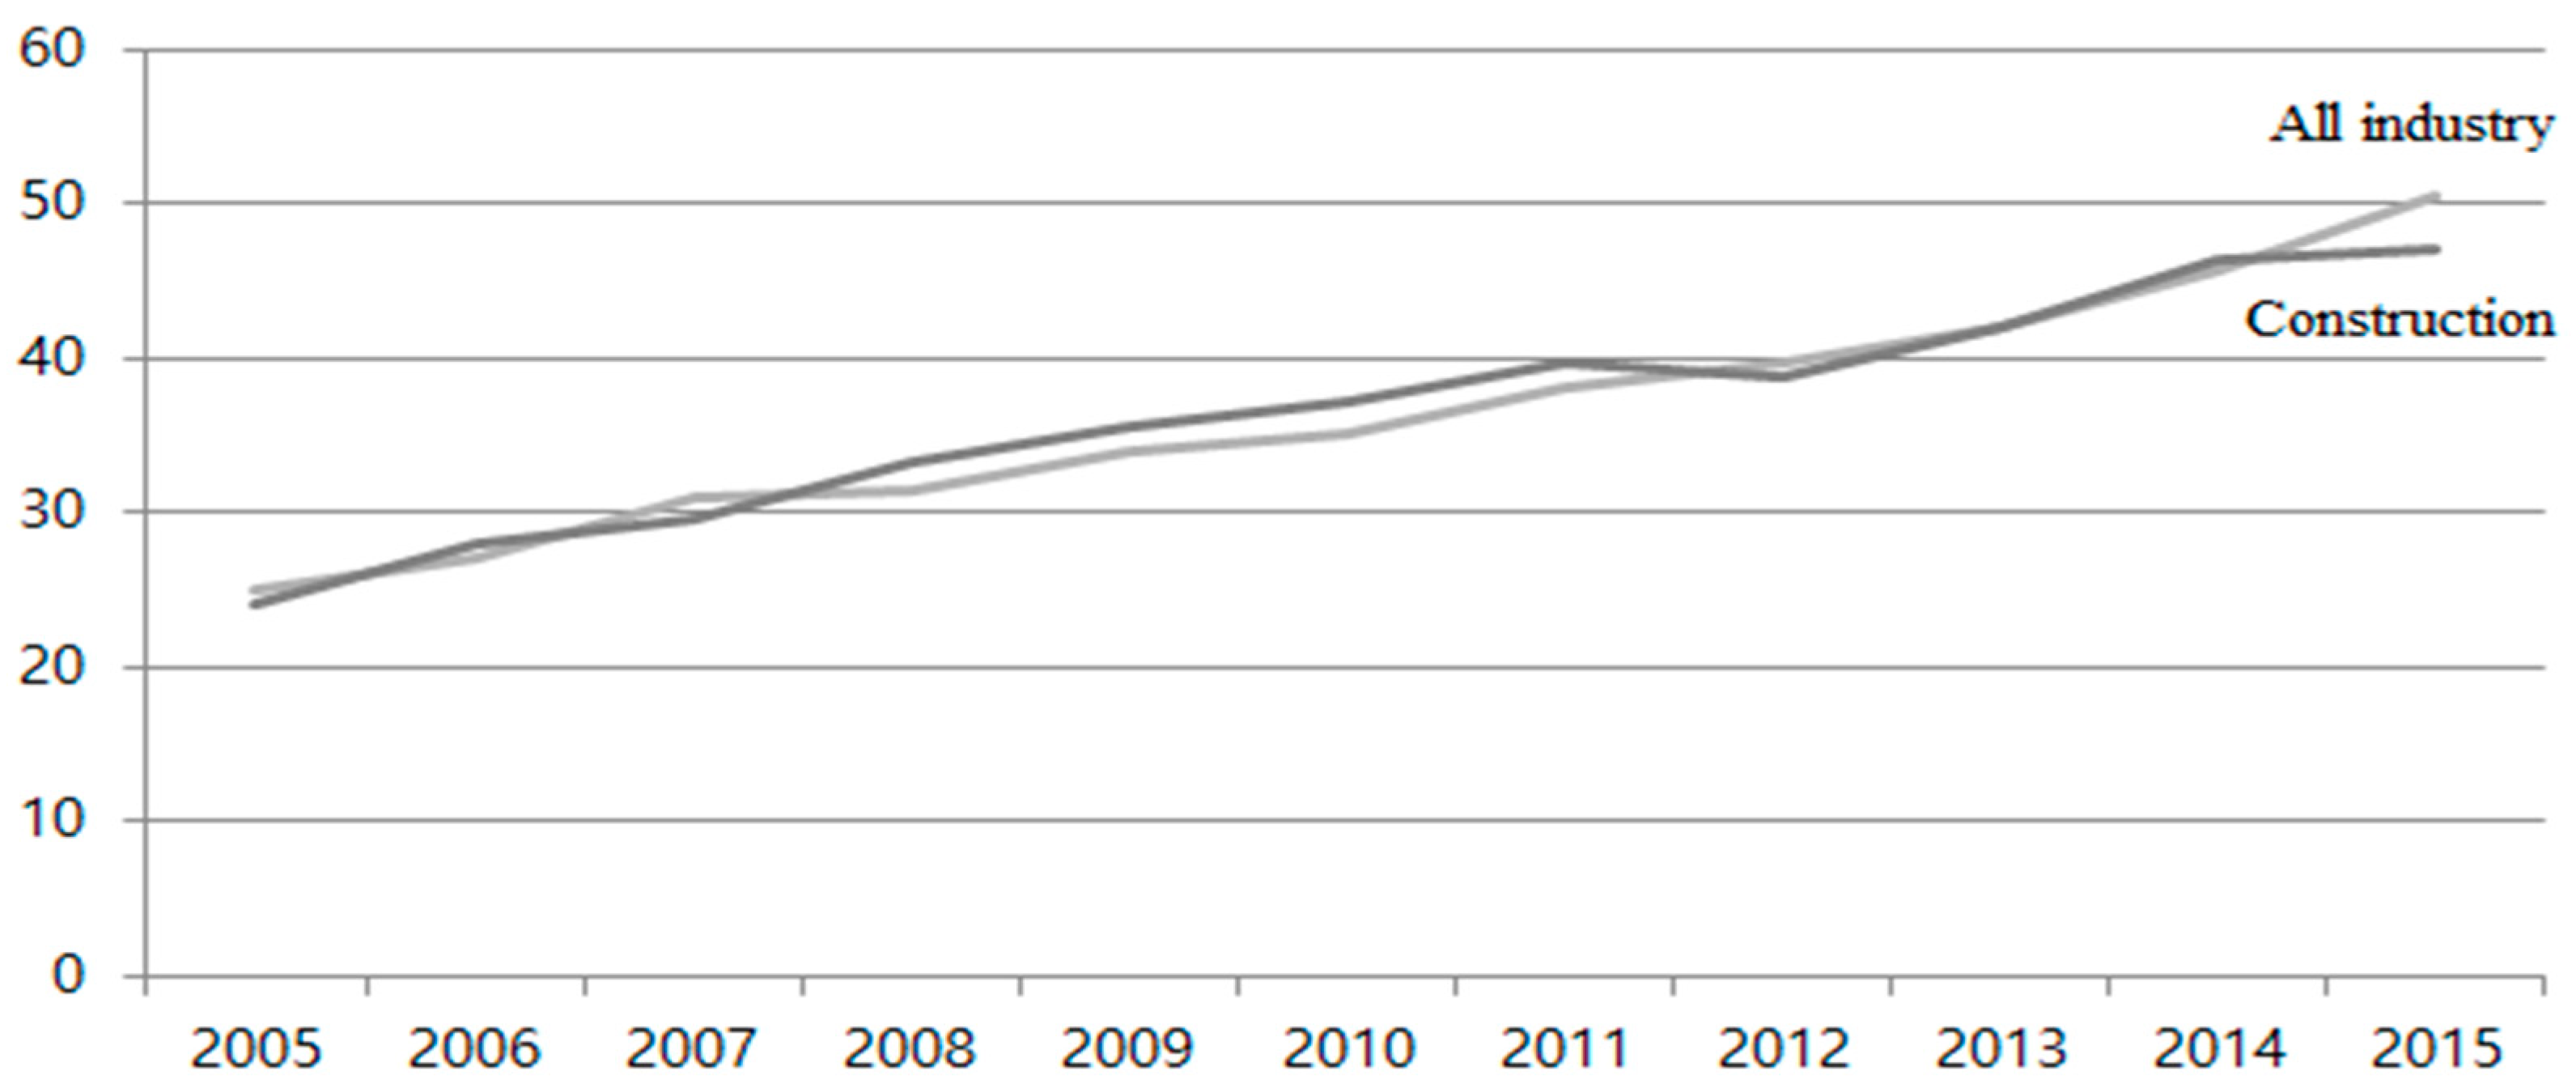
For achieving the policy of enhancing the IT innovation and IT convergence innovation, the Korean government increased its budget more than 13% every year to support the companies in Korea [24]. When we looked at the IT convergence index of all industries in 2015, 50.4, it has increased two times more than it was in 2005, when it was 25.0 [24]. The IT convergence index of the construction industry in 2005 was 24.0 but it increased to 47.1 in 2015 [24], as shown in Figure 1.
Mahomood and Mann, and Harris and Karz claim that an improvement of IT convergence level accompanied with an investment in IT has a significant relationship with strategic performance variables of an organization [10]. They mention that the ratio of the expenses for IT and various aspects of an investment on IT have a positive impact on business performance [7].
Oliner and Sichel reveal that increased productivity of an organization results from the IT industry that makes a contribution to an increase in much of the total factor productivity [10]. Park and Ha conducted their studies on the relationship of an IT convergence technology with productivity from different perspectives by using time series data, panel data, and industry level data, respectively [16].
The impact of the innovation level of an IT convergence technology on business performance can differ depending on the environmental factors of an organization, including the size of the organization, the CEO’s understanding of IT, the investment in IT, and the organization [21]. The hypotheses of our study can be summarized as follows. First, to perform an empirical analysis of the relationship between an IT convergence innovation and business performance in a construction company, IT convergence technology innovations are defined from the perspective of work efficiency, to understand various interrelations with business performance, and support an analysis of the relationship of the level of IT convergence with business performance of a company, from the perspective of a business strategy [26]. Taking the attributes of IT SW utilization survey data into account, as explained earlier, work efficiency IT index, collaboration index, and strategic management IT index are first defined to measure their impact in the construction industry [25].
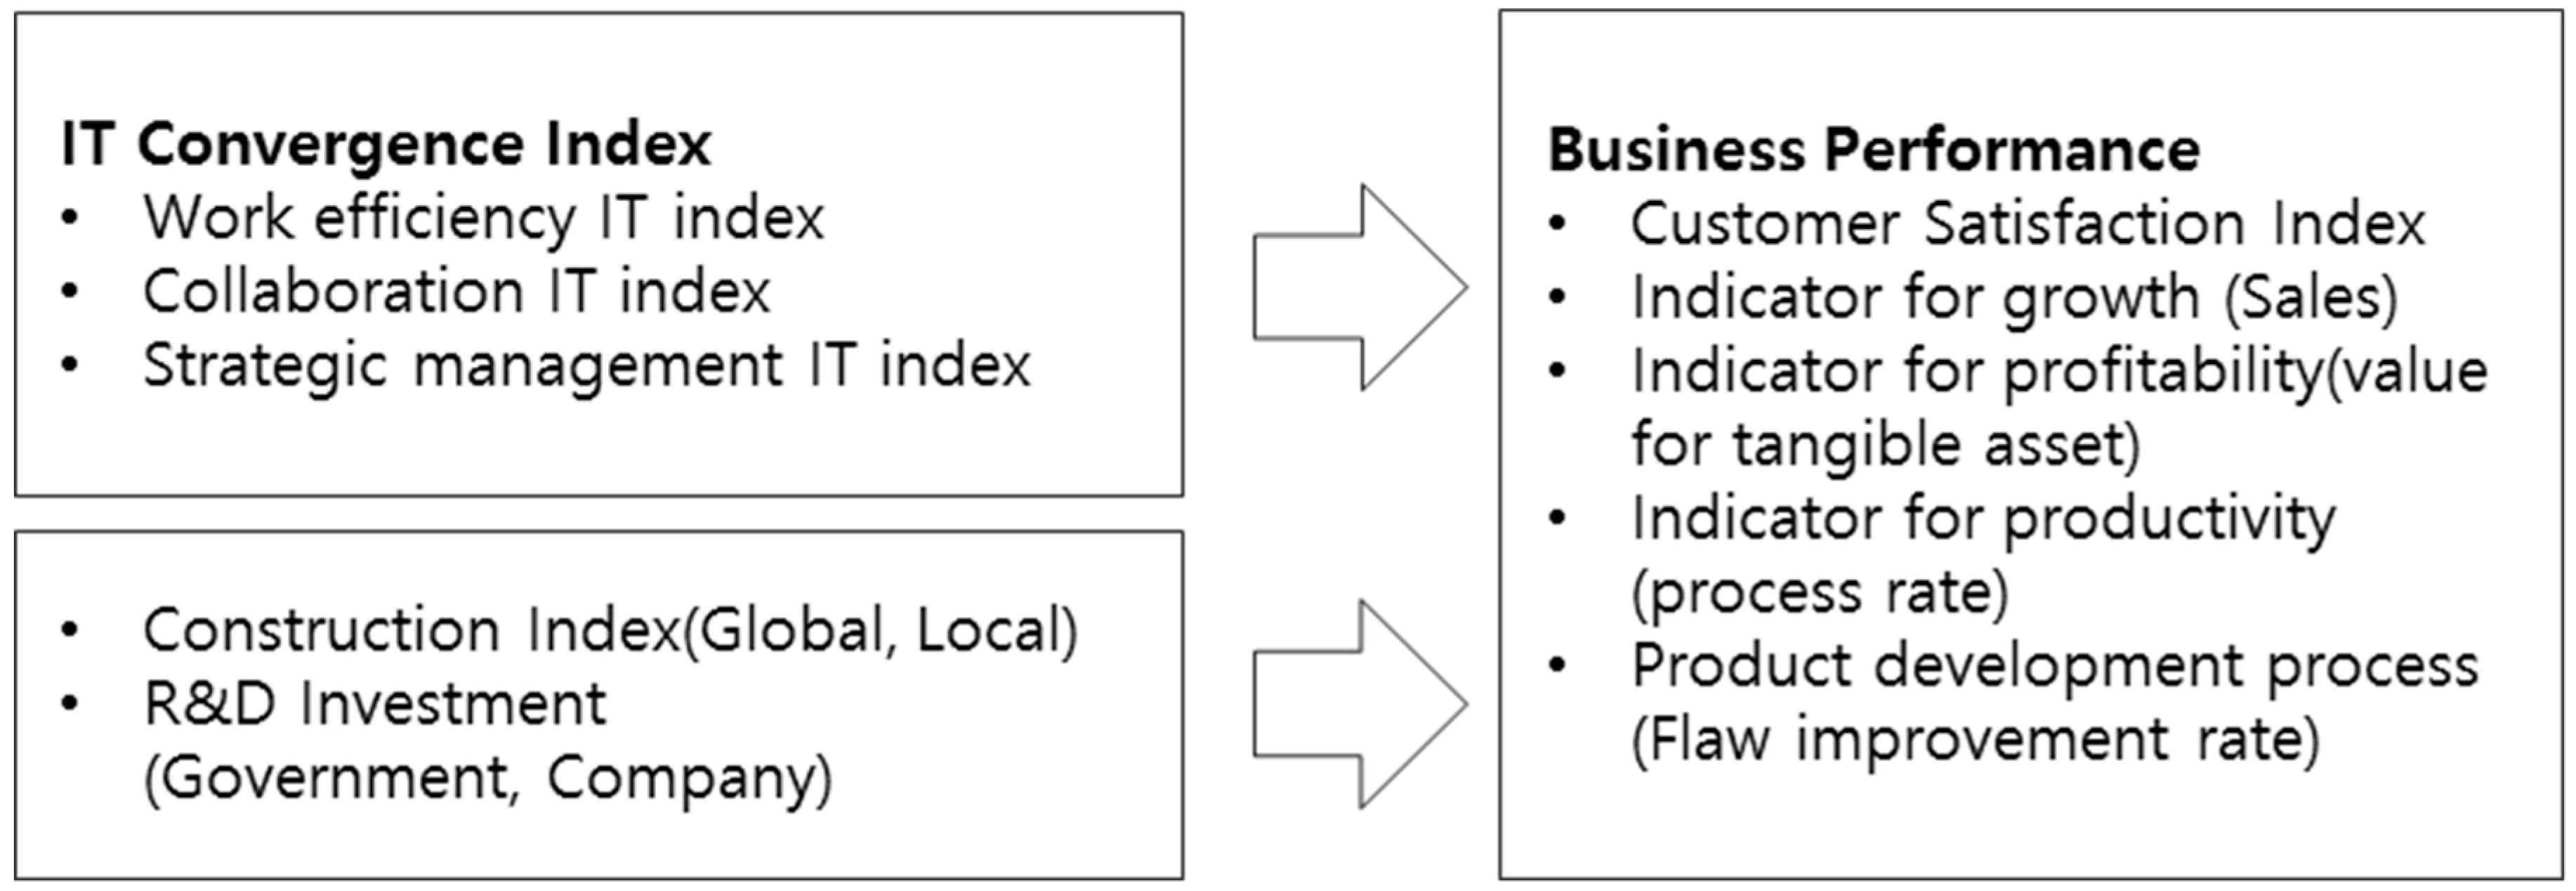
Based on previous studies [21,25], we set the above research framework shown in Figure 2 and tested three hypotheses with 15 sub hypotheses to analysis our topic. First, the improvement of IT efficiency in the workplace will enhance the business performance for the company; enhancing workplace IT means how well the employees and the departments in the company work together by using IT. Second, Enhancing IT collaboration between companies will improve the business performance of the companies. Lastly the innovation on Strategic part in company will enhance the business performance of the company.
Hypothesis 1 (H1).
In the Korean construction industry, Work efficiency IT will promote business performance.
- (1-1) Work efficiency IT index will promote customer satisfaction index.
- (1-2) Work efficiency IT index will promote business growth index.
- (1-3) Work efficiency IT index will promote business profit index.
- (1-4) Work efficiency IT index will promote business productivity index.
- (1-5) Work efficiency IT index will promote business production process.
Hypothesis 2 (H2).
In the Korean construction industry, Collaboration IT will promote business performance.
- (2-1) Collaboration IT index will promote customer satisfaction index.
- (2-2) Collaboration IT index will promote business growth index.
- (2-3) Collaboration IT index will promote business profit index.
- (2-4) Collaboration IT index will promote business productivity index.
- (2-5) Collaboration IT index will promote business production process.
Hypothesis 3 (H3).
In the Korean construction industry, Strategic management IT will promote business performance.
- [H3] Strategic management IT index will promote business performance.
- (3-1) Strategic management IT index will promote customer satisfaction index.
- (3-2) Strategic management IT index will promote business growth.
- (3-3) Strategic management IT index will promote business profit.
- (3-4) Strategic management IT index will promote business productivity.
- (3-5) Strategic management IT index will promote business prod process.
4. Design/Methodology/Approach
4.1. Data Collection
The data used for our study include IT Software statistical data of companies in Korea published by the Ministry of Science, ICT, and Future Planning; corporations’ financial statistical data obtained from the Financial Supervisory Service; data on brand value from Brandstock; and economic statistics from the Bank of Korea. IT SW utilization data of companies in Korea is surveyed and provided by the Ministry of Science, ICT and Future Planning together with the National IT Industry Promotion Agency. The data is collected through surveys or 1:1 interview by paying visits to companies in Korea (with more than 10 employees) in order to understand and evaluate the general current state of companies, the foundation of technical innovations, the management of technical innovations, technical innovation adoption and leadership, the technical innovation process, and the performance and environment of technical innovations. Table 1 shows the questionnaires for the survey, and Table 2 shows the descriptive statistics. With the aim of surveying the IT utilization index, the subjects were limited to 3000 companies, which were surveyed and the survey results were announced upon the approval of the National Statistical Office. This survey is designed to grasp the present conditions and characteristics of the overall innovative activities in the whole industry in Korea for the purpose of providing baseline data required for the nation’s innovation policies and studies [24]. The survey, based on the globally recognized OECD Oslo Manual, is intended to gain reliable statistics on innovation enabling us to make international comparison [24]. The survey is targeted to manufacturing and service firms with ten or more full-time employees [24]. The sample frame is the list of the companies and businesses filed by the NSO a total of 65,649 firms were selected [24]. All the companies with 500 or more full-time workers are surveyed through the method of cut-off sampling [24]. The samples are stratified first based on the type of businesses and then stratified again on the number of workers. As for sample allocation, the Neyman allocation method is used [24]. In consideration of know-how that include the adjustment of the minimum sample sizes per cell, the final sample sizes allocated were 4000, which equals the number of the respondents that actually answered the survey [24]. For these reasons, it is believed to be reliable. In addition, the data is also appropriate to be utilized for our study since it comprehensively includes the current state of various data such as IT utilization level by business, company, and area. As of 2015, the survey group consisted of 19 construction companies that have more than 1000 employees and an apartment brand of their own. In sum, the survey group for our study consists of 19 construction conglomerates in Korea found from 2005 to 2015.
4.2. Measurement of Variables
Table 3 shows that dependent variable are customer satisfaction, economic growth, productivity, and production process performance [4]. Independent variables are the work efficiency IT utilization index, the collaboration IT index, and the strategic management IT index. First, the work efficiency IT utilization index is a preliminary index used to evaluate the level of IT utilization by individuals and by department and between departments in an organization, and the collaboration IT index is a variable used to evaluate the collaboration level when a company collaborates or shares information with external organizations and agents such as a client or supply company in an inter-corporation process. The work efficiency IT index includes the IT utilization level used for supply, purchase, customer contact point, and support in an organization. Second, the strategic management index is used to evaluate the IT utilization level employed in the establishment of a management strategy, an analysis of business performance and creation of a new business [6]. Control variables are the third variables that can affect customer satisfaction, economic growth, profitability, productivity, and production process [10].
Based on the previous studies [22], domestic construction index, overseas construction index, government R&D investment, and business’ R&D costs are set as the control variables. Variable inflation factor (VIF) between independent variables and control variables was measured to check the multicollinearity in variables, and there was not any multicollinearity found between variables.
5. Results
As discussed earlier, when business performance and IT convergence index were empirically analyzed, in some cases the IT convergence index was found not to contribute, but in most cases, it was found that the IT convergence index has a positive impact on business performance [28]. All variables including independent variables were empirically analyzed as business performance creation factors, and the following summarizes how the various IT convergence indices have an impact on business performance through verification of the hypotheses [21,25].
Table 4 shows that work efficiency IT index (WE), collaboration (CL), Strategic development process (SM) in independent variables had a statistically significant correlation in the construction industry. R&D investment from government had a statistically significant correlation with all three independent variables.
Table 5 shows that work efficiency IT (WE) had a significant impact on the increase in sales growth of the company (GR) and process (PRS) and also, collaboration IT (CL), strategy management IT (SM) had a significant impact on the increase in the customer satisfaction (CS), in other words, the enhancement of the IT convergence values of companies in the construction industry was affected. Collaboration IT (CL) had a significant impact on the increase in Profitability (PRF), Productivity (PRD), and Process (PRS) and Strategic management IT (SM) had a significant impaction the increase in CS, PRF, and PRD.
The main purpose of this study is to analyze the relationship between IT convergence innovation and business performance through the ARIMA model which is a time series model. The ARIMA model is a model that analyzes stationarity-based time series data, including some of the auto-regressive elements, integrated elements, and moving averages. In other words, the ARIMA model is composed of p past factors, which are autoregressive elements, and q number of confounders, which are the moving average elements, centering on θ0 indicating the integration elements, and provides very good predictability in short-term prediction [36].
The analysis steps used in the construction of the time series model are explained through an iterative process of identification, estimation, and diagnostic checking. In the identification phase, a provisional model is constructed through time series data. In the estimation process, a parameter value of a provisional model is estimated. In the diagnostic checking process, conformity is verified, and if not, it will go back to the beginning and repeat the identification, estimation, and diagnostic process.
The utilized auto regressive integrated moving average (ARIMA) model is a combination of auto-regressive, difference, and moving averages, and is modeled as ARIMA (p, d, q) where p is the order of the autoregressive model, d is the degree of differencing, and q is the order of the moving-average model [36]. According to the Box-Jenkins method, in this process the nonstationary time series data is transformed to stationary by taking the difference of the d-order to eliminate the trend, determining the values of p and q by viewing the autocorrelation plot, and diagnosing whether the estimated model is valid by checking the Q value of the Ljung-Box for residuals; this is suggested as the ARIMA modeling procedure [36]. In this study, the ARIMA model was also used to estimate the model through time series analysis, and it was verified that the IT index affected the management performance.
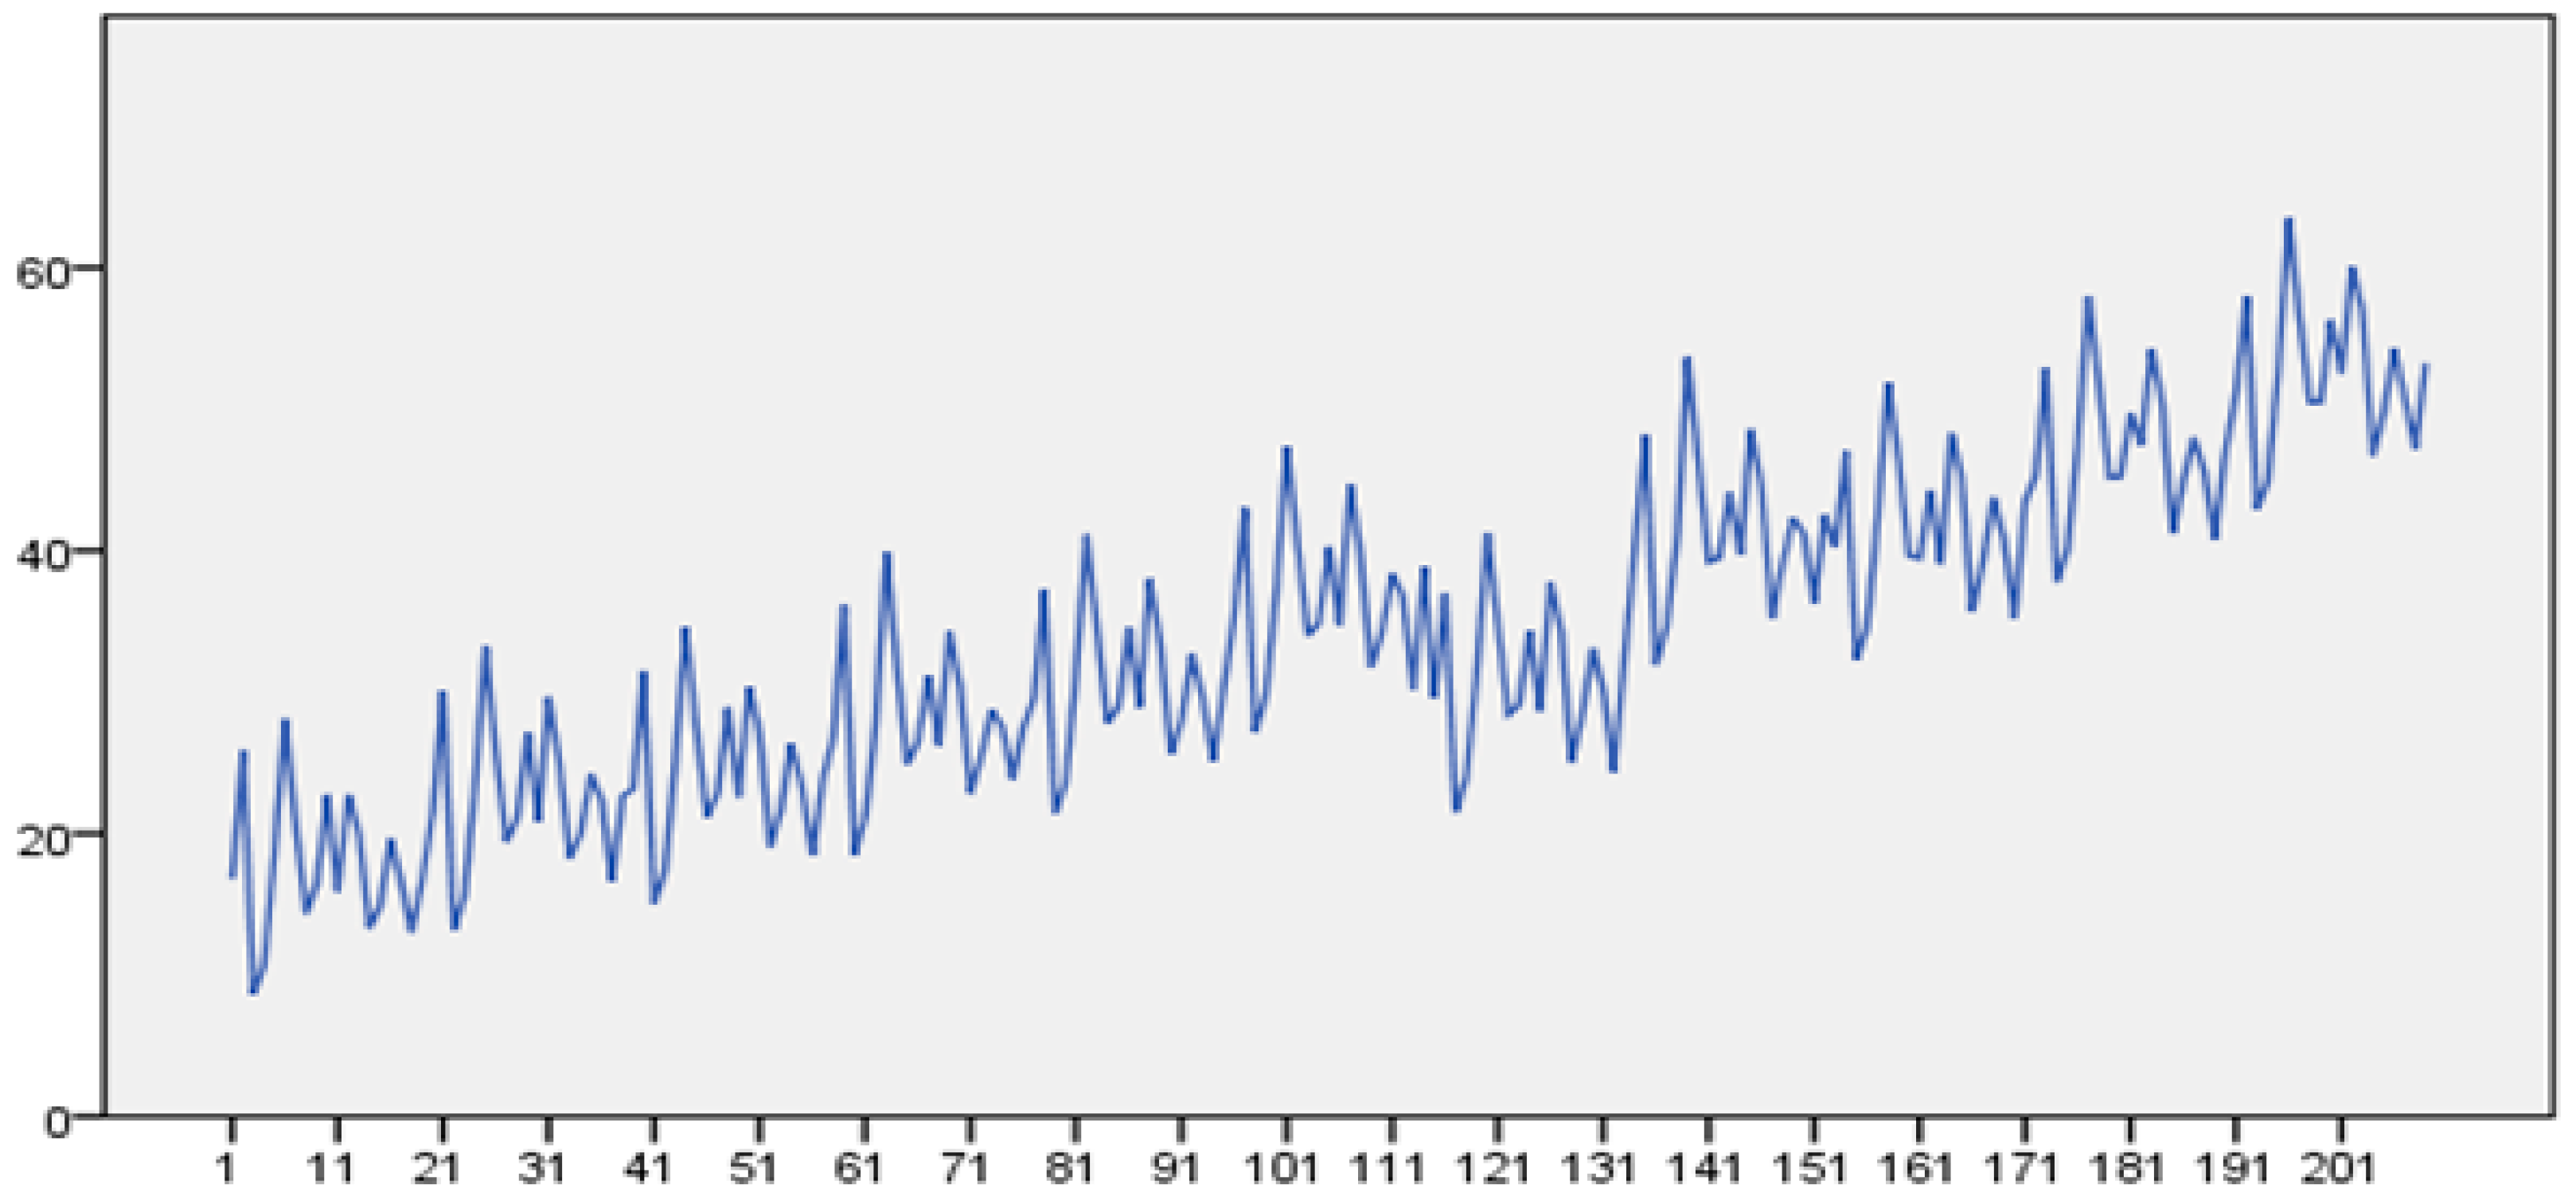
The ARIMA model setup procedure applied in this study is as follows. First, identification of stationarity and differencing was performed for model identification. Model identification refers to finding a suitable interim ARIMA model based on observed time series data. Since the stationarity condition must be satisfied, data transformation and differencing are required if the time series data are not stationary. To see if a given time series data has stationarity, it is necessary to look at the chart showing the variation of the original time series data, and the autocorrelation function should be examined to determine whether the value of the variable over time has trend or tendency. That is, when the time series is stationary, the absolute value of ACF decreases when the time difference increases, and converges to zero. However, in the case of nonstationary time series, the ACF decreases very slowly even if the time difference increases.
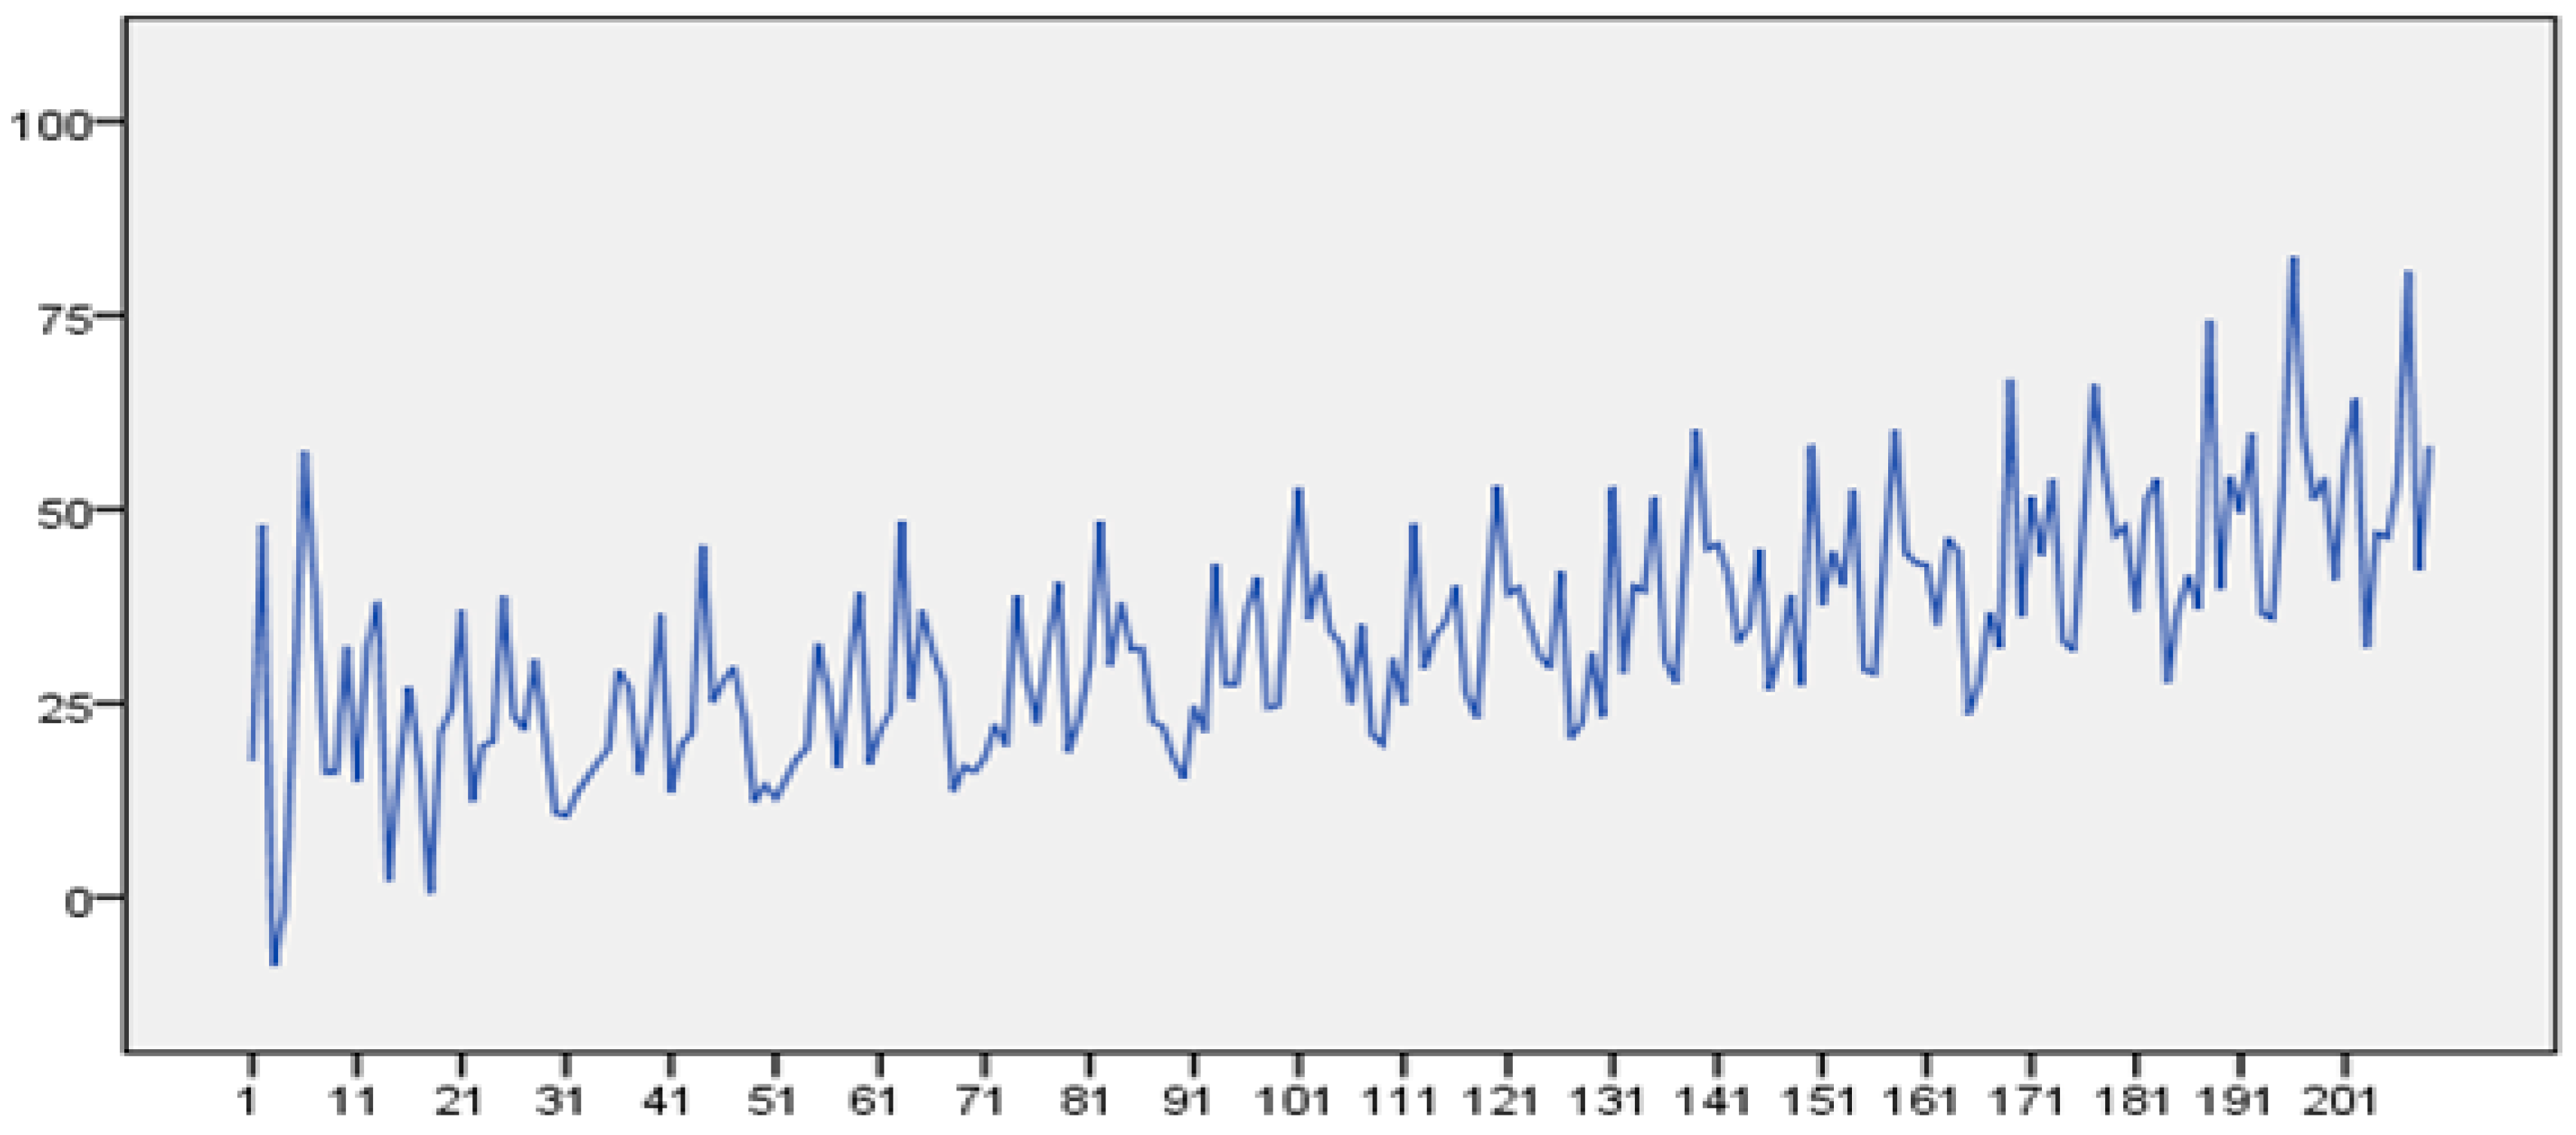
Figure 3 shows that original time series chart shows the increase and decrease with the time flow, and the original auto-correlation chart also shows a very slow decrease with increasing time. Therefore, it is confirmed that it is an on stationary time series. In order to remove the trend, the differencing was carried out and converted to the stationary time series data. As shown in Figure 4, trends are removed in the first order differencing time series data and are uniformly distributed.
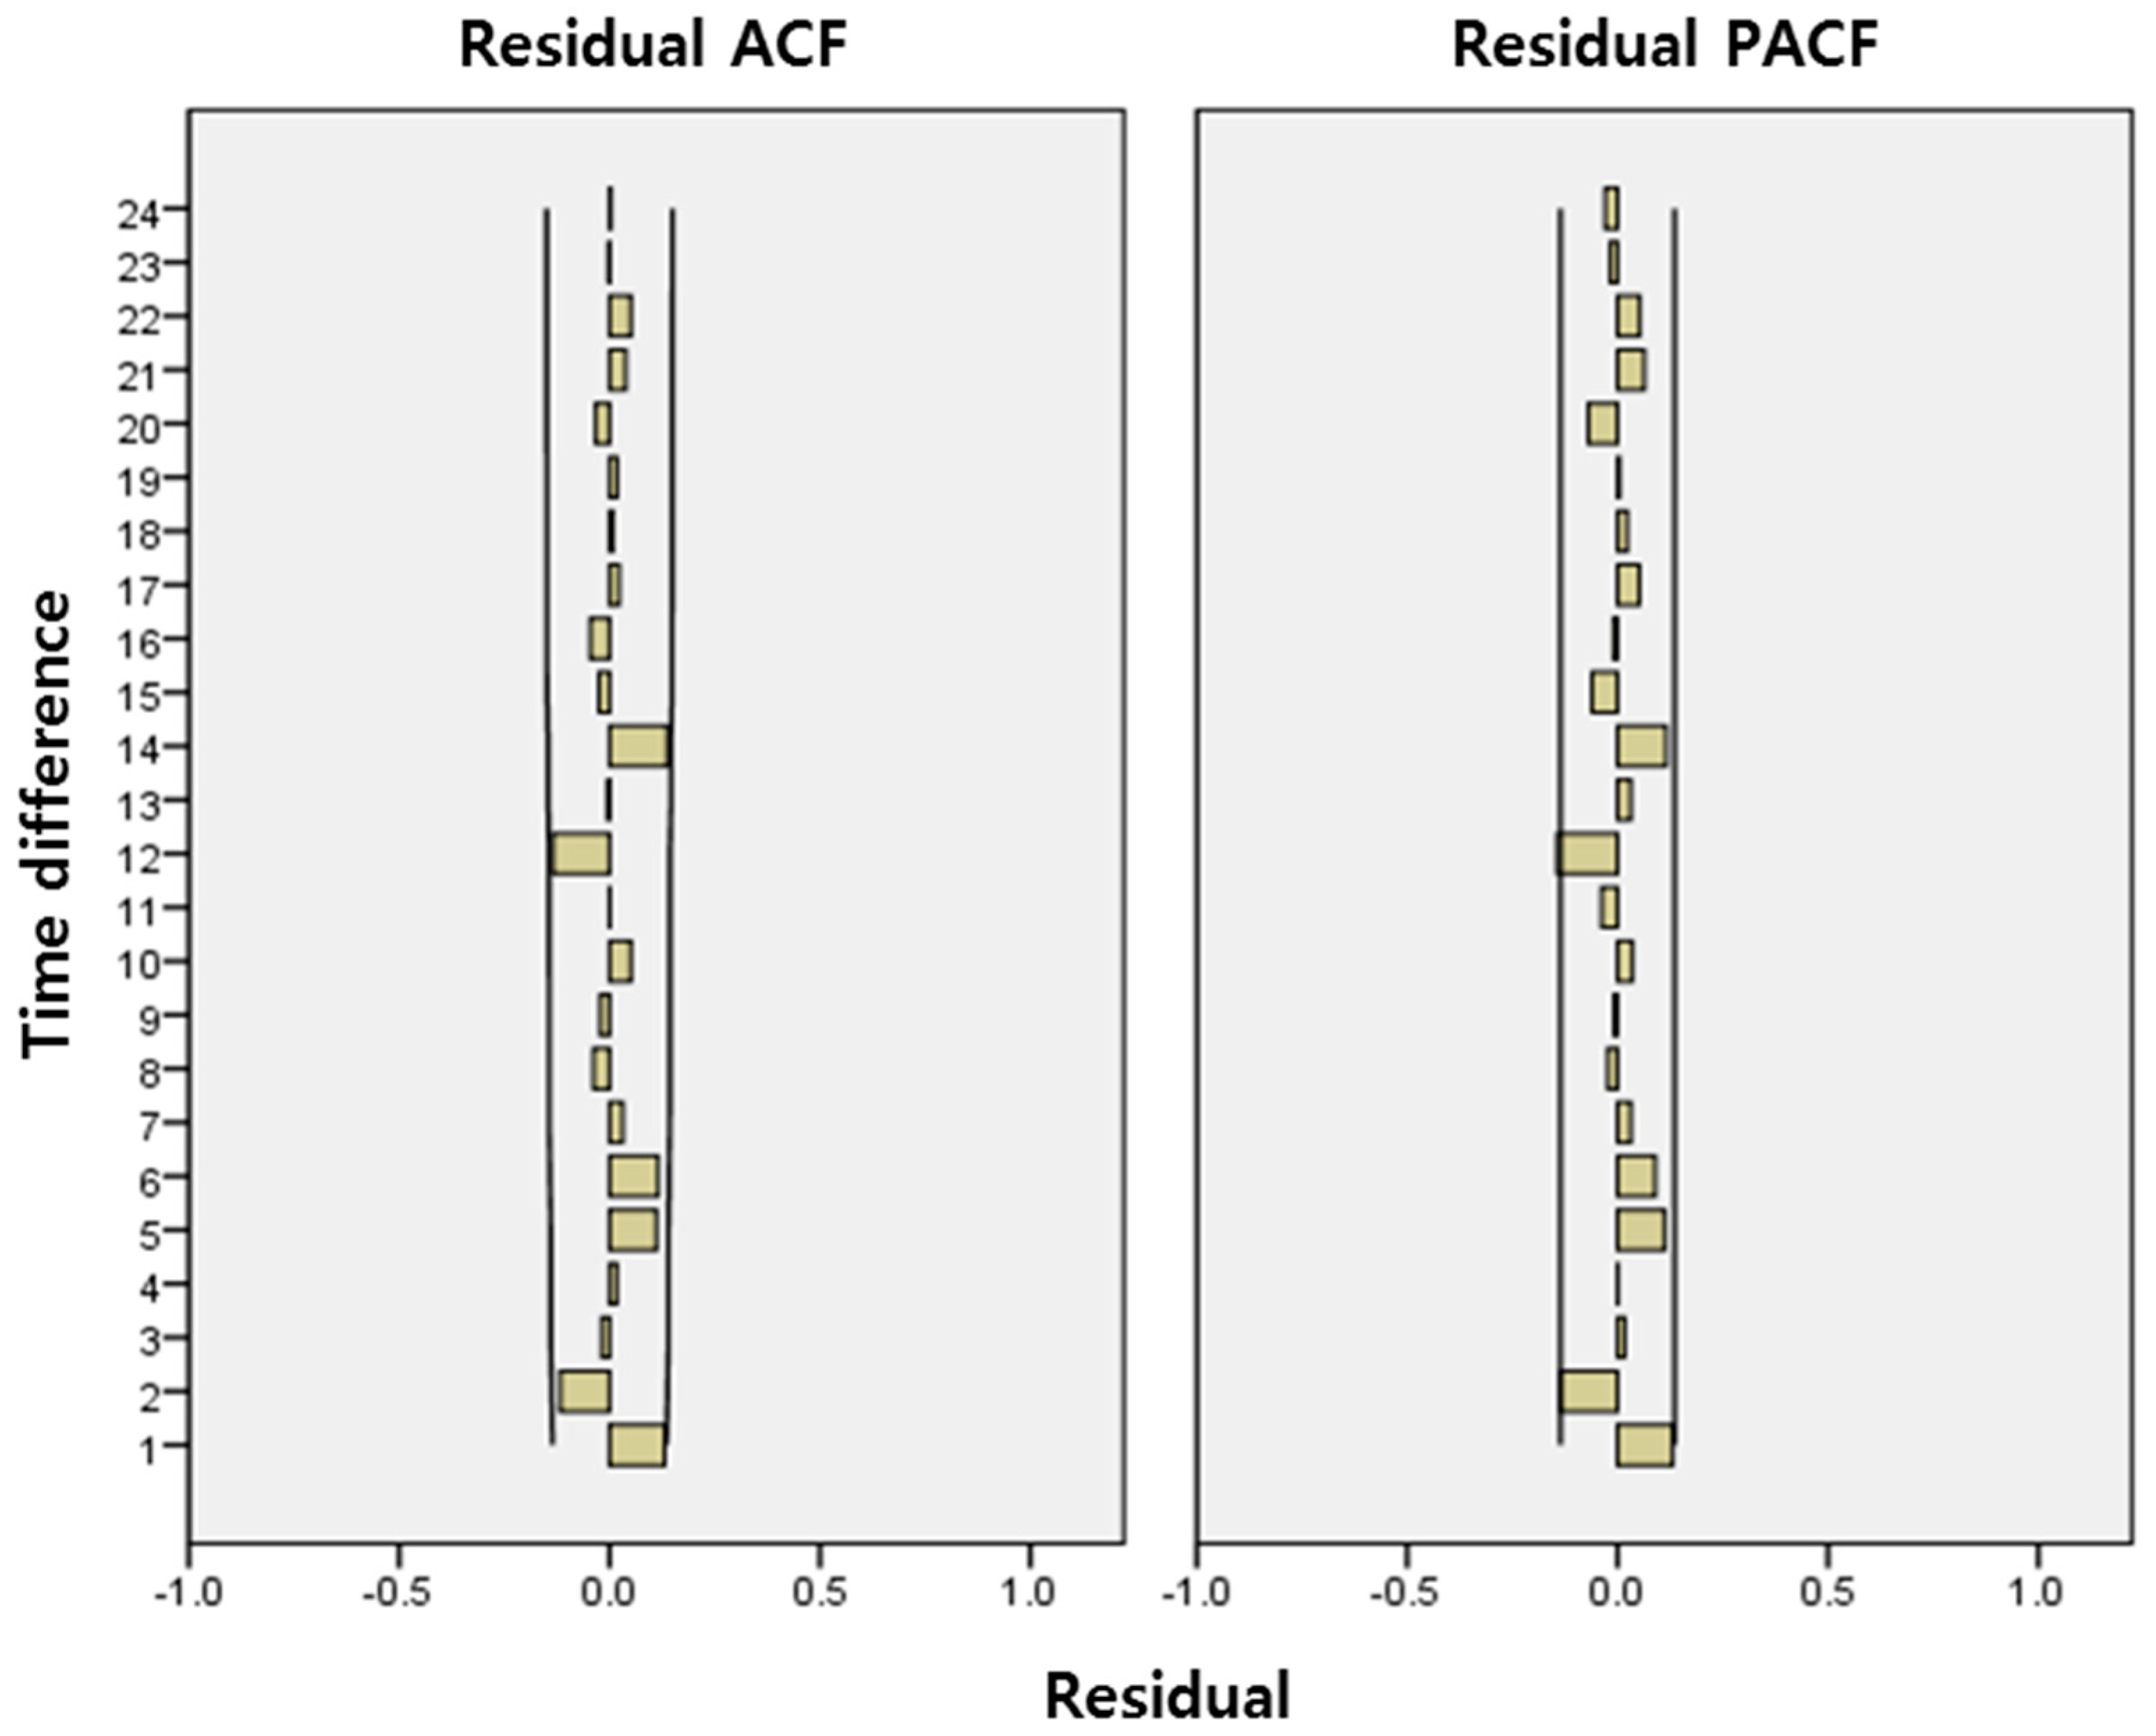
Therefore, it can be said that the first-order differencing time-series data have stationarity. It can be seen from Auto-Correlation Function (ACF) and Partial Auto-Correlation Function (PACF) of the differenced time series data, according to Figure 5.
Differencing is used for the stationarity of the time series data, and then the model identification procedure is performed. Model identification takes ARIMA (p, q) based on Autocorrelation, Partial Auto-Correlation plot and then completes the ARIMA model. The Q value of the ARIMA model (fit for p > 0.05) is confirmed and finally the model is confirmed.
Table 6 shows that the analysis result between IT convergence index and business performance, in some cases the IT convergence index was found not to contribute or work efficiently. IT index did not affect the improvement of growth performance of a company. However in most cases, it was found that IT convergence index, work efficient index, collaboration index, strategic development index, have a positive impact on business performance.
6. Discussion
First, to analyze how the IT convergence indices affect business performance, a regression analysis and time series analysis were conducted, and the empirical analysis confirms Hypothesis 1 that the work efficiency IT index that shows the IT convergence level of doing work in an organization has a positive influence on business performance.
Through this empirical analysis, it is found that an improvement in the work efficiency IT convergence index level can lead to an improvement in the quality of a company’s service and product, which ultimately results in customer satisfaction. In addition, from the perspective of financial performance it contributes to an increase in the profit ratio, indicating the profitability of a company, from which it can be interpreted that IT utilization in doing a task results in an increase in efficiency in business operation and has a positive effect on productivity, a measure of product efficiency against invested facilities. In addition, it was revealed that an improvement in the work efficiency IT convergence index causes the process rate to increase and the defect rate to decrease.
From the analysis of Hypothesis 2, it was found that the collaboration IT index, which evaluates the level of IT convergence used for inter-corporation work, has a positive impact on customer satisfaction, financial performance, and the production process. This implies that companies actively collaborate with external and other organizations and agents through IT in order to improve customer service, sales, related profitability, productivity, and production process; as a result, companies can obtain unattainable values for themselves through collaboration with external organizations or agents.
Lastly, in the analysis of Hypothesis 3, it was shown that the impact of the strategic management IT index that evaluates the IT convergence level used in establishing a business strategy or creating a new business is as statistically significant in the business performance as in the analysis of Hypothesis 2. The analysis results can be summarized as follows. In the analysis of [Hypothesis 1], the work efficiency IT index, the IT convergence level used for doing a task in an organization has a significant effect on customer satisfaction, profitability, and productivity of financial performance and process rate and defect improvement rate, indicating the efficiency of the production process. However, the work efficiency index does not show any significant impact on an increase in sales, an indicator of the economic growth of a company.
Therefore, Hypothesis 1 as well as sub-hypotheses 1-1, 1-3, 1-4 and 1-5 are adopted. In the analysis of Hypothesis 2, the collaboration IT index that indicates the IT convergence level in the collaboration between companies has a significant influence on customer satisfaction, financial performance (an increase in sales, net profit rate of sales, investment rate in facilities) and the production process (process rate and defect improvement rate).
For this reason, Hypothesis 2 as well as all of the sub-hypotheses 2-1, 2-2, 2-3, 2-4, and 2-5 are adopted. Like Hypothesis 2, Hypothesis 3 has a significant impact on customer satisfaction, financial performance and the production process, which is also adopted. The Table 7 summarizes the verification results of the hypotheses.
According to the analysis results and discussion, first, work efficient IT index affected the business performance of the company to increase the business brand value, the development of the finance area in the company, and also the enhancement of new product development and process optimization. But work efficient IT index did not affect the enhancement of company financial growth. Second, Collaboration IT affected all five aspects of the business performance, customer satisfaction, the growth and profit aspect, and the improvement of the product development and process. Lastly, strategic IT index also affected all five aspect of the business performance as a collaboration IT index.
The analysis found that many companies ceaselessly strive to achieve IT convergence innovations, and those companies, particularly conglomerates, have invested in IT convergence innovations and tried to educate and train manpower. Recently, globally oriented Korean companies have tried to lead new growth drivers and actively participated in the competition for a standardized platform, escaping from the Fast Follower paradigm. The Korean government has a keen interest in the creation of new growth drivers, but it is difficult to develop and utilize all the technologies and patents internally [1]. In addition, it is essential for all of the companies including non-IT companies to secure the productivity of their working process and create business performance based on the improved work process [1]. Therefore, in addition to the conventional growth strategies, based on the analysis results a strategic framework is suggested at an organizational level by which IT convergence technology innovations are added and diffused within an organization by reviewing the review of theoretical background and previous studies to allow an organization to achieve sustainable growth [12].
In addition, to improve the performance and development of IT convergence innovations, the CEO should take a keen interest in and promote the introduction and diffusion of IT/SW convergence, which has a great impact of a task force on an organization for IT convergence, priorities in budget, efforts to enhance communication and collaboration between departments through which IT is fused in an organization more actively [34]. In addition, companies should make multiple efforts to secure high-quality IT specialized manpower, in large numbers [5].
Companies can consider adopting new IT convergence innovations, and training and educating manpower that can meet their requirements through strengthened collaboration with diverse organizations, schools, government agencies and other companies as well as within an organization [26]. Therefore, companies that are considering some investment in IT convergence innovations either from the perspective of ROI or from the business performance perspective should create a new infrastructure, strategy, system and culture in which the innovation level of IT convergence technology can improve business performance from the aspects of business, collaboration, and strategic management, respectively [30,31]. It is expected that the findings of our study can be presented as an important basis from which policy implications can be drawn.
7. Conclusions
From a comprehensive perspective, our study has significance in that it makes proposals based on an empirical study on the relationship between an IT convergence innovation and business performance. Many companies question whether IT convergence innovations can actually improve business performance [16,27]. Through the empirical analysis, it is found that the more improved the level of IT convergence innovations becomes, the higher business performance will be in terms of customer satisfaction, financial performance, and the production process, which is a completely different finding from the general view that IT convergence innovations can promote the IT supporting system for the business process only [1].
Based on the results of our study, the following policy implications were derived. First, these empirical analysis results provide the government and companies with an opportunity to verify the result of the investment for IT utilization in the sector. With this opportunity, the government and companies can prepare a strategic framework by thinking over how to improve and activate IT convergence innovations within an industry. Second, rather than simply assuming that business performance will be improved if the government makes an investment or manpower is secured in a company for IT convergence innovations, the government and companies can consider the strategies to fuse IT technologies in an organization and operation policies from an overall perspective to increase the efficiency of IT convergence innovations and following productivity when they are establishing strategies for the adoption and activation of IT convergence. In particular, the results can be utilized to secure competence factors of IT convergence innovations (business efficiency, collaboration, strategic management). Therefore, if the results continue to be managed as a performance index of IT convergence innovations, it will have more significant effects on the business performance based on the improvement of the IT convergence level. Moreover, the analysis results mentioned earlier can be utilized as important data to establish a body to promote the investment and activation of IT convergence innovations.
First, the NIPA IT SW convergence index data utilized in our study is based on the results of surveys conducted by domestic construction companies, which implies that the index is highly likely to be made subjectively; this is a limitation. Even though its research and methodology are more reliable than those used for the indices made by existing companies, it is insufficient to define and measure the index of IT convergence innovations more comprehensively. Further, the data is too limited to enable an analysis of the relationship between IT convergence innovations and business performance from composite and diverse perspectives. Also, while a regression analysis and the time series analysis were conducted based on the time series data of the IT convergence index, the analyses were focused only on construction companies rather than encompassing all companies. From this perspective, the question of whether the analysis results of our study can be applied to companies in industries other than the construction industry suggests another limitation. It would be possible to perform a comparative analysis of the impact of IT convergence innovations index on business performance by company type and size and determine the validity of the results if data could be secured in various industries. Third, a limitation lies in the measurement of business performance. In our study, the business performance is measured from a comprehensive perspective that includes customer satisfaction and work process as well as the financial viewpoint, which has been considered a limitation. In addition, the performance of IT convergence innovations was measured and evaluated based on relatively short-term performance, but in fact needs to be analyzed from various perspectives such as a long-term view, while also considering changes in the organizational culture. Lastly, the circumstances were not considered in the analysis of the relationship between IT convergence innovations index and business performance.
The business performance of a company can be changed depending on the national and industrial circumstances of the company, and unique factors in the environment, government regulations, specific events, and accidents are highly likely to affect business performance. As well, they can be changed by the mutual relationships a rising from IT convergence innovations, when IT convergence innovations and their accompanying changes are adopted within the company in the future.
Author Contributions
D.G.K. did conceptualization, Data Curation, Formal analysis and Writing-Original draft preparation. S.O.C. did Validation, Writing-Review& Editing, Supervision and Project Administration.
Funding
This research was supported by the Basic Science Research Program through the National Research Foundation of Korea (NRF) funded by the Ministry of Education, Science and Technology (NRF-2018R1C1B5045860).
Conflicts of Interest
The authors declare no conflict of interest.
References
- Yun, J.J.; Won, D.; Park, K. Dynamics from open innovation to evolutionary change. J. Open Innov. Technol. Mark. Complex. 2016, 2, 7. [Google Scholar] [CrossRef]
- Cooke, P. Complex spaces: Global innovation networks & territorial innovation systems in information & communication technologies. J. Open Innov. Technol. Market Complex. 2017, 3, 9. [Google Scholar]
- Schiuma, G. Arts catalyst of creative organizations for the fourth industrial revolution. J. Open Innov. Technol. Mark. Complex. 2017, 3, 20. [Google Scholar] [CrossRef]
- Amara, N.; Landry, R. Sources of information as determinants of novelty of innovation in manufacturing firms: Evidence from the 1999 statistics Canada innovation survey. Technovation 2005, 25, 245–259. [Google Scholar] [CrossRef]
- Arudel, A.; Hollanders, H. EXIS: An Exploratory Approach to Innovation Scoreboards; European Trend Chart on Innovation Series; European Commission: Brussels, Belgium, 2005. [Google Scholar]
- Brynjolfsson, E.; Hitt, L. Information Technology as a factor of production: The role of difference among firms. Econ. Innov. New Technol. 1995, 3, 183–199. [Google Scholar] [CrossRef]
- Boynton, A.C.; Zmud, R.W.; Jacobs, G.C. The influence of IT management practice on IT use in large organizations. MIS Q. 1994, 18, 299–318. [Google Scholar] [CrossRef]
- Barney, J.B. Strategic factor markets: expectations, luck and business strategy. Manag. Sci. 1986, 32, 1231–1241. [Google Scholar] [CrossRef]
- Bower, J.L.; Christensen, C.M. Disruptive technologies: Catching the wave. Harv. Bus. Rev. 1995, 73, 43–53. [Google Scholar]
- Cainelli, G.; Evangelista, R.; Savona, M. Innovation and economic performance in service: A firm-level analysis. Camb. J. Econ. 2006, 30, 435–458. [Google Scholar] [CrossRef]
- Lee, J.; Kang, J.H.; Jun, S.; Lim, H.; Jang, D.; Park, S. Ensemble modeling for sustainable technology transfer. Sustainability 2018, 10, 2278. [Google Scholar] [CrossRef]
- Damanpour, F. Innovation effectiveness, adoption and organizational performance. Innov. Creat. Work Psychol. Organ. Strateg. 1990, 21, 125–141. Available online: https://0-scholar-google-com.brum.beds.ac.uk/scholar?cluster=2313058966885972590&hl=en&oi=scholarr (accessed on 25 October 2018).
- Dosi, G. Sources, Procedures and microeconomic effects of innovation. J. Econ. Lit. 1988, 26, 1120–1171. [Google Scholar]
- Fichman, R.G. Information technology diffusion: A review of empirical research. In Proceedings of the Thirteenth International Conference on Information Systems, Dallas, TX, USA, 13–16 December 1992; pp. 195–206. [Google Scholar]
- Choi, J.; Jang, D.; Jun, S.; Park, S. A predictive model of technology transfer using patent analysis. Sustainability 2015, 7, 16175–16195. [Google Scholar] [CrossRef]
- Park, H.S. Technology convergence, open innovation, and dynamic economy. J. Open Innov. Technol. Mark. Complex. 2017, 13, 24. [Google Scholar] [CrossRef]
- Yun, J.J.; Jeong, E.; Lee, Y.K.; Kim, K.H. The effect of open innovation on technology value and technology transfer: A comparative analysis of the automotive, robotics, and aviation industries of Korea. Sustainability 2018, 10, 2459. [Google Scholar] [CrossRef]
- Freedman, D.A. Statistical Models: Theory and Practice; Cambridge University Press: New York, NY, USA, 2004; ISBN 9780521743853. [Google Scholar]
- Grover, V.; Teng, J.; Aegars, A.; Fiedler, K. The influence of information technology diffusion and business process change on perceived productivity: The IS executive’s perspective. Inf. Manag. 1998, 34, 141–159. [Google Scholar] [CrossRef]
- Smith, H.A.; Mckeen, J.D. How does information technology affect business value? A reassessment and research propositions. Can. J. Adm. Sci. 1993, 10, 229–240. [Google Scholar] [CrossRef]
- Scott, J.E. Facilitating inter organizational learning with information technology. J. Manag. Inf. Syst. 2000, 17, 81–113. [Google Scholar]
- O’Brien, R.M. A Caution Regarding Rules of Thumb for Variance Inflation Factors. Qual. Quant. 2007, 41, 673–690. [Google Scholar] [CrossRef]
- Pavitt, K. R&D, Patenting and Innovative Activities: A Statistical Exploration. Res. Policy 1982, 11, 33–51. [Google Scholar]
- Uhm, M.J.; Cho, J.S.; Lee, J.Y. Report on the Korean Innovation Survey 2005: Manufacturing Sector. Available online: http://www.dbpia.co.kr/Journal/PDFViewNew?id=NODE06286468&prevPathCode= (accessed on 24 October 2018).
- Howard, H.V. Differences in the usage of bootstrap financing among technology-based versus non-technology-based firms. J. Small Bus. Manag. 2005, 43, 93–103. [Google Scholar]
- Weil, P. The Relationship between investment of information technology and firm performance: A study of the value manufacturing sector. Inf. Syst. Res. 1992, 3, 307–400. [Google Scholar] [CrossRef]
- Tippins, M.J.; Sohi, R.S. IT competency and firm performance: IS organizational learning a missing link? Strateg. Manag. J. 2003, 24, 745–761. [Google Scholar] [CrossRef]
- Weinel, I.; Crossland, P.D. The scientific foundation of technical progress. J. Econ. Issues 1989, 23, 795–806. [Google Scholar] [CrossRef]
- Choi, J.Y.; Jeong, S.; Kim, K. A study of diffusion pattern of technology convergence: Patent analysis for Korea. Sustainability 2015, 7, 11546–11569. [Google Scholar] [CrossRef]
- Park, S.; Jun, S. Technology analysis of global smart light emitting diode (LED) development using patent data. Sustainability 2017, 9, 1363. [Google Scholar] [CrossRef]
- Yun, J.J.; Jeong, E.; Park, J. Network analysis of open innovation. Sustainability 2016, 8, 729. [Google Scholar] [CrossRef]
- The Organization for Economic Co-operation and Development. Guidelines for Collecting and Interpreting Technological Innovation Data; Oslo Manua; OECD: Paris, France, 2005. [Google Scholar]
- Slaughter, E.S. Models of construction innovation. J. Constr. Eng. Manag. 1998, 124, 226–231. [Google Scholar] [CrossRef]
- Zheng, J.; Wu, G.; Xie, H. Impacts of leadership on project-based organizational innovation performance: The mediator of knowledge sharing and moderator of social capital. Sustainability 2017, 9, 1893. [Google Scholar] [CrossRef]
- Zang, Y.; Zheng, J.; Darko, A. How does transformational leadership promote innovation in construction? The mediating role of innovation climate and the multilevel moderation role of project requirements. Sustainability 2018, 10, 1056. [Google Scholar]
- Box, G.E.; Jenkins, G.M.; Reinsel, G.C.; Ljung, G.M. Time Series Analysis: Forecasting and Control; John Wiley & Sons: Hoboken, NJ, USA, 2015; ISBN 9781118674925. [Google Scholar]
Figure 1.
IT Convergence index in Korea.

Figure 2.
Research framework.

Figure 3.
Original time series chart.

Figure 4.
Differenced time series chart.

Figure 5.
Differenced Auto-Corellation Function (ACF) chart and Partial Auto-Corellation Function (PACF) chart.
Figure 5.
Differenced Auto-Corellation Function (ACF) chart and Partial Auto-Corellation Function (PACF) chart.


Table 1.
Information of questionnaires for survey.
| Division | Description | Relevance |
|---|---|---|
| General Information | Company type, legal type, designation/listing status, main sales place, etc. | GR, PRF |
| Sales/exports, number of employees (always, master, female workforce, etc.) | ||
| R&D type (research institute, etc.) | ||
| R&D personnel (dedicated personnel, etc.) | ||
| Process Innovation | Process innovation, product innovation (new product development, function creation), facility investment | WE |
| Development subject | ||
| Domestic/World first development | ||
| Innovation activities & Costs | R&D (internal/external/joint), machinery, equipment, software, etc. | PRD, PRS |
| Total cost of innovation activities, Proportion of innovation activities | ||
| Information Source, Cooperation, Purpose | Cooperation with other companies/institutions, partner location, useful partners Importance of Process Innovation by Purpose | CL |
| Organizational Innovation & Marketing Innovation | Task performance method, Operation execution organization, Changes in relations with external organizations Changes in PR, sales strategy, and pricing | SM |
Note: GR; Indicators concerning growth, PRF; Indicators concerning profitability, WE; Work efficiency IT index, PRD; Indicators concerning productivity, PRS; Product development process, CL; Collaboration IT index, SM; Strategic management IT index.
Table 2.
Descriptive Statistics.
| Variables | Minimum Value | Maximum Value | Average | Standard Deviation | Skewness | kurtosis |
|---|---|---|---|---|---|---|
| WE | 10.75 | 77.43 | 43.35 | 14.34 | −0.09 | −0.50 |
| CL | 5.00 | 76.00 | 37.63 | 15.30 | 0.19 | −0.22 |
| SM | 3.40 | 63.20 | 29.92 | 10.46 | 0.19 | −0.02 |
| CIL | 91.30 | 158.00 | 116.15 | 16.74 | 1.06 | 1.21 |
| CIG | 38.21 | 71.58 | 53.52 | 11.58 | 0.13 | −1.54 |
| RDG | 135.20 | 206.20 | 165.19 | 24.94 | 0.51 | −.143 |
| RDC | 0.10 | 5.40 | 3.19 | 1.21 | −0.93 | 2.08 |
| CS | 100.20 | 868.40 | 659.85 | 140.89 | −0.87 | 0.07 |
| GR | −4.80 | 36.00 | 7.26 | 5.14 | 0.24 | 2.02 |
| PRF | −2.60 | 17.30 | 4.78 | 2.94 | 0.89 | 2.03 |
| PRD | 64.50 | 612.90 | 135.75 | 75.92 | 1.46 | 3.48 |
| PRS | 0.60 | 17.30 | 5.15 | 2.82 | 1.32 | 2.56 |
| FI | 6.71 | 77.87 | 33.93 | 14.75 | 0.58 | 0.16 |
Note: WE; Work Efficiency IT Index, CL; Collaboration IT Index, SM; Strategic Management IT Index, CIL; Construction Index (Local), CIG; Construction Index (Global), RDG; R&D Investment (Government), RDC; R&D Investment (Company), CS; Customer Satisfaction Index, GR; Indicators Concerning Growth, PRF; Indicators Concerning Profitability, PRD; Indicators Concerning Productivity, FI; Flaw Improvement Rate.
Table 3.
Variables for Analysis.
| Variables | Description |
|---|---|
| Dependent Variable: Business Performance | |
| Customer Satisfaction Index (CS) | Growth rate of sales |
| Indicators concerning growth (GR) | Net income to sales |
| Indicators concerning profitability (PRF) | Growth value for tangible asset |
| Indicators concerning productivity (PRD) Product development process (PRS) | Process rate Flaw improvement rate |
| Independent Variable: IT convergence index | |
| Work efficiency IT index (WE) | IT index for integration rate of function and inter-department |
| Collaboration IT index (CL) | IT index for collaboration with external organizations |
| Strategic management IT index (SM) | IT index for management strategy and new business model development |
| Control Variables | |
| Construction index: Local (CIL) | Total amount for business contract in Korea (KR) |
| Construction index: Global (CIG) | Total amount for business contract globally (OS) |
| R&D investment: Government (RDG) | R&D investment of government to company |
| R&D investment: Company (RDC) | R&D investment of companies |
Note: Data Set; 2005–2015 for 11 years.
Table 4.
Correlation Analysis.
| Category | WE | CL | SM | CIL | CIG | RDG | RDC |
|---|---|---|---|---|---|---|---|
| WE | 1 | ||||||
| CL | 0.204 ** | 1 | |||||
| SM | 0.554 ** | 0.221 ** | 1 | ||||
| CIL | 0.089 | −0.002 | 0.148 * | 1 | |||
| CIG | 0.618 ** | 0.190 ** | 0.311 ** | 0.030 | 1 | ||
| RDG | 0.360 ** | 0.134 | 0.068 | 0.667 ** | 0.488 ** | 1 | |
| RDC | 0.067 | 0.23 | −0.12 | 0.175 * | 0.030 | 0.234 ** | 1 |
* p < 0.1, ** p < 0.05.
Table 5.
Effect of IT Innovation Activities on Firm’s Performance (Regression Analysis).
| Variables | CS | GR | PRF | PRD | PRS |
|---|---|---|---|---|---|
| WE | 1.120 | 2.125 ** | −0.213 | −0.815 | 2.044 ** |
| CL | 3.178 ** | 2.047 * | 4.714 *** | 2.623 ** | 5.534 *** |
| SM | 3.853 *** | 2.045 * | 3.067 ** | 2.738 ** | 1.452 |
| CIL | 0.216 | 4.257 *** | 2.641 ** | −0.330 | 1.929 |
| CIG | 0.503 | 3.933 *** | −1.066 | 0.112 | 2.237 * |
| RDG | −0.214 | 3.951 *** | 0.927 | 0.310 | 0.047 |
| RDC | −0.118 | 5.489 *** | 2.952 *** | −0.368 | 0.044 |
* p < 0.1, ** p < 0.05, *** p < 0.01.
Table 6.
Effect of IT Innovation Activities on Firm’s Performance (Time Series Analysis).
| Independent Variables | CS | GR | PRF | PRD | Development Process |
|---|---|---|---|---|---|
| WE IT | 3.621 *** | 1.848 | 2.415 * | 1.909 * | 2.899 ** |
| CL IT | 4.110 *** | 5.854 *** | 4.415 *** | 3.002 ** | 3.478 ** |
| SM IT | 7.322 *** | 2.463 * | 2.272 * | 1.646 * | 3.919 *** |
| R2 | 0.539 | 0.393 | 0.394 | 0.809 | 0.849 |
| Ljung-Box Q | 21.006 | 24.988 | 13.890 | 20.280 | 22.626 |
| p = 0.226 | p = 0.095 | p = 0.675 | p = 0.260 | p = 0.124 |
* p < 0.1, ** p < 0.05, *** p < 0.01.
Table 7.
Validation of Effect of IT Innovation Index to Firm’s Performance.
| Hypothesis | |
|---|---|
| H1. Work efficiency IT index will promote business performance | (+) |
| Work efficiency IT index will promote customer satisfaction index | + |
| Work efficiency IT index will promote business growth index | N/A |
| Work efficiency IT index will promote business profitability index | + |
| Work efficiency IT index will promote business productivity index Work efficiency IT index will promote business production process | + + |
| H2. Collaboration IT index will promote business performance | (+) |
| Work efficiency IT index will promote customer satisfaction index | + |
| Work efficiency IT index will promote business growth index | + |
| Work efficiency IT index will promote business profitability index | + |
| Work efficiency IT index will promote business productivity index Work efficiency IT index will promote business production process | + + |
| H3. Strategy management IT index will promote business performance | (+) |
| Strategy management IT index will promote customer satisfaction index | + |
| Strategy management IT index will promote business growth index | + |
| Strategy management IT index will promote business profitability index | + |
| Strategy management IT index will promote business productivity index Strategy management IT index will promote business production process | + + |
© 2018 by the authors. Licensee MDPI, Basel, Switzerland. This article is an open access article distributed under the terms and conditions of the Creative Commons Attribution (CC BY) license (http://creativecommons.org/licenses/by/4.0/).
Share and Cite
MDPI and ACS Style
Kim, D.G.; Choi, S.O. Impact of Construction IT Technology Convergence Innovation on Business Performance. Sustainability 2018, 10, 3972. https://0-doi-org.brum.beds.ac.uk/10.3390/su10113972
AMA Style
Kim DG, Choi SO. Impact of Construction IT Technology Convergence Innovation on Business Performance. Sustainability. 2018; 10(11):3972. https://0-doi-org.brum.beds.ac.uk/10.3390/su10113972
Chicago/Turabian StyleKim, Dae Geon, and Sang Ok Choi. 2018. "Impact of Construction IT Technology Convergence Innovation on Business Performance" Sustainability 10, no. 11: 3972. https://0-doi-org.brum.beds.ac.uk/10.3390/su10113972
Note that from the first issue of 2016, this journal uses article numbers instead of page numbers. See further details here.