Article

Prediction of Life Cycle Carbon Emissions of Sponge City Projects: A Case Study in Shanghai, China

1
College of Environmental Science and Engineering, Tongji University, Shanghai 200092, China
2
Key Laboratory of Yangtze River Water Environment, Ministry of Education, Tongji University, Shanghai 200092, China
3
Tongji Architectural Design (Group) Co., Ltd., Shanghai 200092, China
*
Author to whom correspondence should be addressed.
Sustainability 2018, 10(11), 3978; https://0-doi-org.brum.beds.ac.uk/10.3390/su10113978
Submission received: 1 October 2018 / Revised: 22 October 2018 / Accepted: 25 October 2018 / Published: 31 October 2018
(This article belongs to the Special Issue Sustainability in Transportation and the Built Environment)

Abstract

:
In recent years, China has been vigorously carrying out the planning and implementation of Sponge City. Since the implementation of Sponge City projects involves substantial materials and energy consumption, it is significant to account corresponding carbon emissions and sinks. The existed studies about carbon emission of stormwater management measures, however, are not able to take the whole life cycle and different facilities into consideration. Therefore, this study develops a comprehensive accounting model based on Intergovernmental Panel on Climate Change (IPCC) guidelines and life cycle assessment (LCA) method to predict carbon emissions and carbon sinks of Sponge City projects more comprehensively and accurately. The model is applied to an actual residential community in Shanghai as a case study. Results show that the total indirect carbon emission is estimated to be 774,277 kg CO2 eq during a 30-year lifespan, among which carbon emissions from operation and maintenance phases are 2570 kg CO2 eq/year and 7309 kg CO2 eq/year, respectively, both directly proportional to the service life of the facilities. Three kinds of achievable carbon sinks are carbon sequestration in green space (5450 kg CO2 eq/year), carbon sink from rainwater utilization (15,379 kg CO2 eq/year) and carbon sink from runoff pollutant removal (19,552 kg CO2 eq/year). Carbon neutrality is expected to be reached after approximately 19 years. The established carbon emission accounting model can contribute to better planning and construction of Sponge City in China and enhance further energy conservation and carbon emission reduction.

1. Introduction

With the rapid development of urbanization, large quantities of pervious natural land in China has been replaced by impervious roofs and pavements. Meanwhile, heavy rainfall events are more and more frequent due to global climate change. Since it is difficult for imperious surface to infiltrate, retain and store runoff, urban areas are easy to be attacked by floods when large storm comes, threatening the safety and property of urban residents [1]. Under this background, China has been gradually and vigorously promoting the planning and construction of Sponge City since 2013, intending to mitigate urban floods, reduce non-point pollution, promote rainwater utilization and improve the urban microclimate and local environment [2,3,4,5]. Sponge City is a Chinese version of the urban stormwater management concept proposed to achieve better management and control of stormwater runoff, which is similar to best management practices (BMPs), low impact development (LID), green infrastructure (GI), and sustainable urban drainage system (SUDS) and water-sensitive urban design (WSUD), which all aim to achieve better management and control of stormwater runoff [6]. From a global perspective, sustainable development will also be a long-term trend in the future. In 2015, the 2030 Agenda for Sustainable Development and its 17 Sustainable Development Goals was adopted by the United Nations [7]. Among the 17 goals, there are several goals related to urban and building sustainability, including: Ensure healthy lives and promote wellbeing for all at all ages; Ensure availability and sustainable management of water and sanitation for all; Ensure access to affordable, reliable, sustainable and modern energy for all. In this case, the Sponge City strategy proposed and adopted by China is also greatly in line with global sustainable development trends and goals.
To improve global sustainability, China has strengthened its implementation of a carbon emission reduction plan and green economy strategy [8,9,10]. In order to explore the sustainable development path, almost all industries are required to take measures to conserve energy, reduce carbon emission and abate pollution. From the perspective of time, Sponge City planning and construction will coexist with carbon emissions reduction actions for a long time. In order to explore the sustainable development path, almost all industries are required to take measures to conserve energy, reduce carbon emission and abate pollution [11,12,13,14,15,16], it is also a vast and long-lasting engineering activity with substantial materials utilization, energy consumption and waste produced, making corresponding carbon emissions unable to be ignored. Moreover, the cleanliness and reasonable utilization and recycling of materials and energy, as well as potential carbon sinks, all have considerable impacts on total net carbon emission reduction [17,18,19,20,21], which can provide references for the proposing of carbon reduction measures. Therefore, it is crucial to analyze the approaches of carbon emissions and sinks from Sponge City facilities or low impact development—best management practices (LID-BMPs), in order to reduce the net emission to the minimum.
Up to now, some studies have been conducted to estimate the carbon emissions and sinks of stormwater management measures in recent few years. Flynn and Traver [22] conducted carbon emission accounting for both rainwater gardens and green roofs. Spatari et al. [23] used life cycle assessment (LCA) and a stochastic urban watershed model to account the avoided greenhouse gas emissions of permeable pavements corresponding to annual energy savings in America. Kim et al. [24] established a comprehensive model to estimate greenhouse gas emissions from LID facilities and integrated management practices (IMPs) and carbon emissions and sinks of five LID facilities, such as reservoirs. Moore and Hunt [25] analyzed carbon emission pathways in storm-control measures (SCMs) and carbon emission accounting for multiple measures. O’Sulivan et al. [26] studied the environmental effects related to the materials, construction, transport, operation, and maintenance of rain gardens based on an LCA modeling method. Besides, there are many studies on carbon sinks or sequestration as well as CO2 flux on a single facility, such as a green roof [27], rain garden [28], grassed swale [29], constructed wetland [30,31,32,33]. Although these studies have provided precious preference for carbon emissions accounting of storm management measures, they are mostly focusing on one or several certain parts of the whole implementation process. Under this situation, LCA method can be used to consider all implementation phases, which has been used to quantify the environmental impact including greenhouse gas emissions of many technologies and systems [26,34,35,36] from the whole life cycle. On the other hand, many researches are focused on a single facility or neglect some possible carbon emissions and sinks. Without considering the various carbon emissions and potential carbon sinks comprehensively, as well as various stormwater control facilities and their coupled performance, it is impossible to fully and correctly analyze the carbon emission reduction benefits or the greenhouse effect of Sponge City facilities or LID-BMPs facilities [36].
To address the shortcomings mentioned above, this study chooses LCA method to analyze the carbon emissions and carbon sinks in the whole life cycle of Sponge City projects, takes the characteristics and parameters of actual Sponge City projects into consideration, and develops a comprehensive carbon emission accounting model for Sponge City projects based on the guidelines of the Intergovernmental Panel on Climate Change (IPCC) and the United Nations Framework Convention on Climate Change (UNFCCC). A pilot residential community for Sponge City construction in Shanghai is selected as a case study, based on which, the characteristics of carbon emissions and carbon sinks from the whole life cycle can be explored and studied, and several carbon reduction measures can be proposed. This study can contribute to identifying and proposing effective carbon reduction measures, helping planners select facilities with greater carbon sink benefits, and optimizing the overall stormwater management program.

2. Materials and Methods

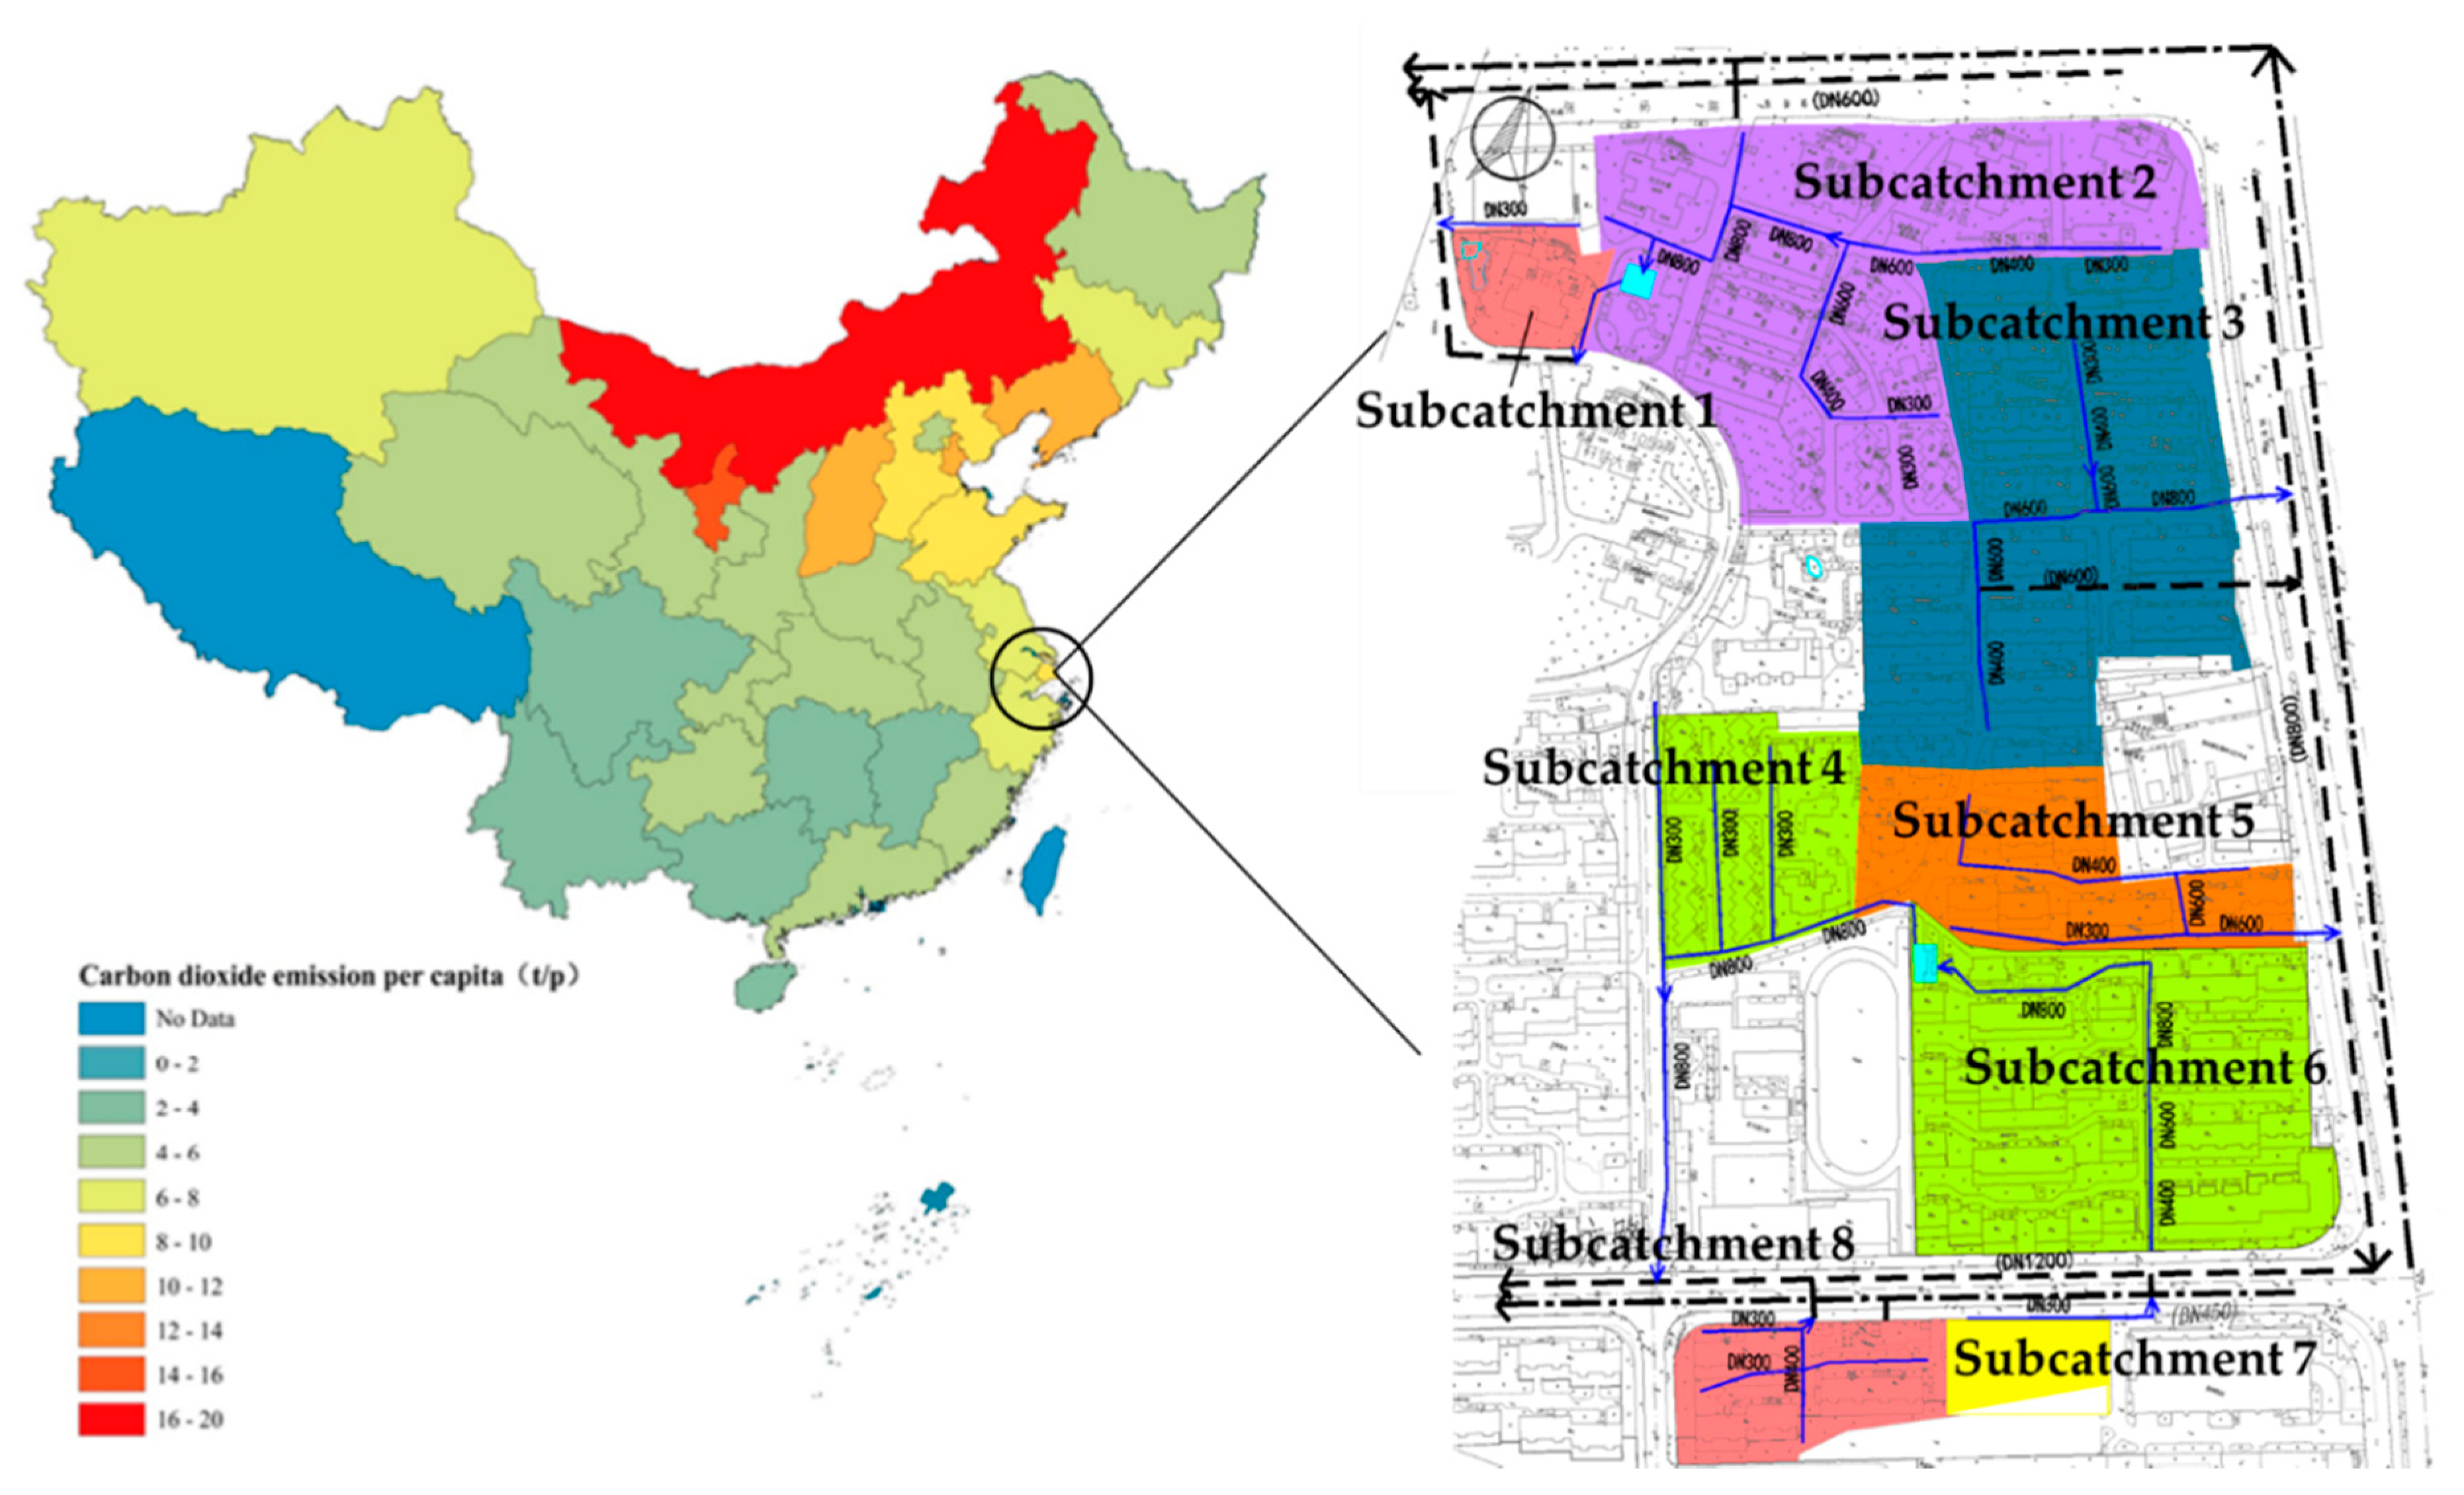
2.1. Case Study Area and Data

Shanghai is a highly urbanized city, located in eastern China. Due to the high density of impervious roofs and pavements, Shanghai is frequently affected by heavy floods, which have a negative impact on social stability and citizens’ life. With the support of the central and local government, Shanghai has been selected as an important pilot city for Sponge City construction. Meanwhile, in recent years, Shanghai has also been constantly striving to strengthen the implementation of carbon emission reduction strategies in various industries. From Zhu’s research [37] on the per capita CO2 emissions of various provinces in China in 2012, as shown in Figure 1, Shanghai’s per capita carbon emissions is at the medium level among all provinces. However, considering Shanghai’s large population, it is still of great significance for Shanghai to reduce carbon emission. Therefore, it is necessary to account carbon emissions amount of Sponge City projects in Shanghai and find solutions to reduce carbon emission.
The accounting model was applied to a pilot residential community in Shanghai, where the Sponge City project is to be implemented, as shown in Figure 1. With a total area of 10.67 hm2, the Sponge City construction project involves three old and small residential communities. According to the design proposal, a comprehensive rainwater control system consisting of greening modules, ecological buffering modules, and rainwater utilization modules, will be constructed. Within the scope of the project, there are 8 subcatchments in the design plan and technologies such as the grassed swale, rain garden, permeable pavement, and water storage pond are to be applied to reduce at least 75% of total runoff. The inventory of main materials used of facilities construction in this Sponge City project is presented in Table 1, which was obtained from engineering designers and actual construction organizations.

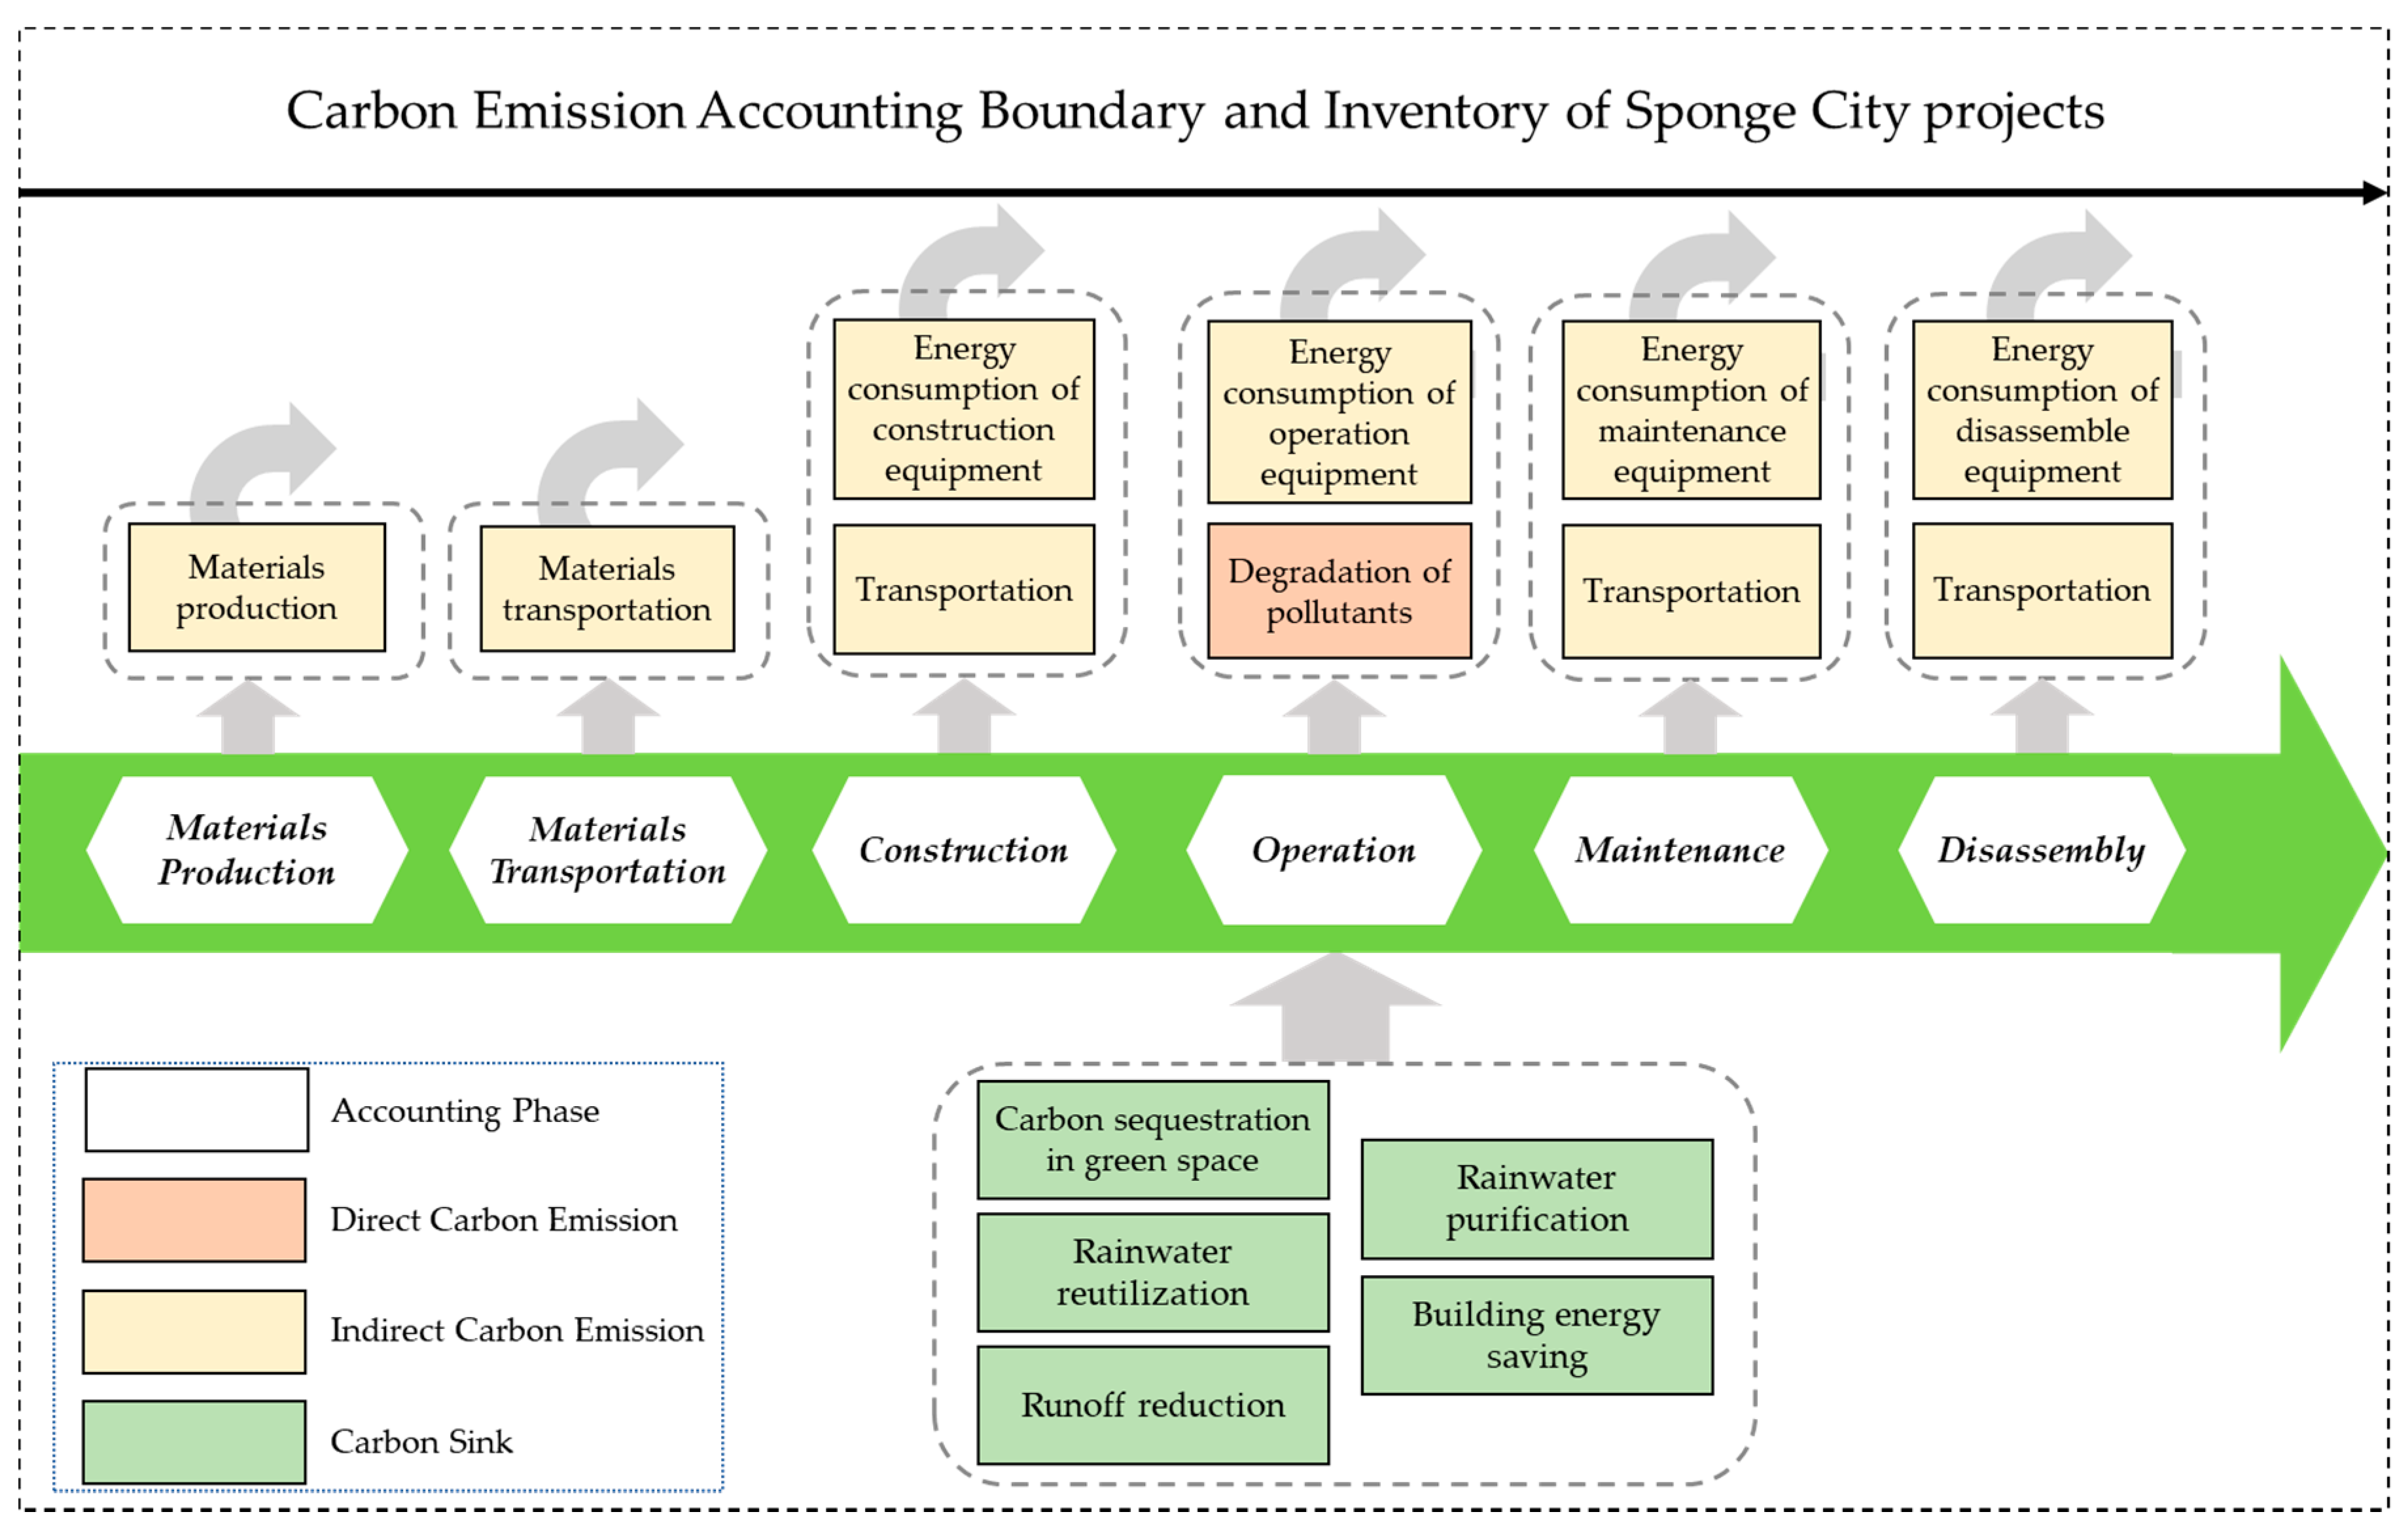
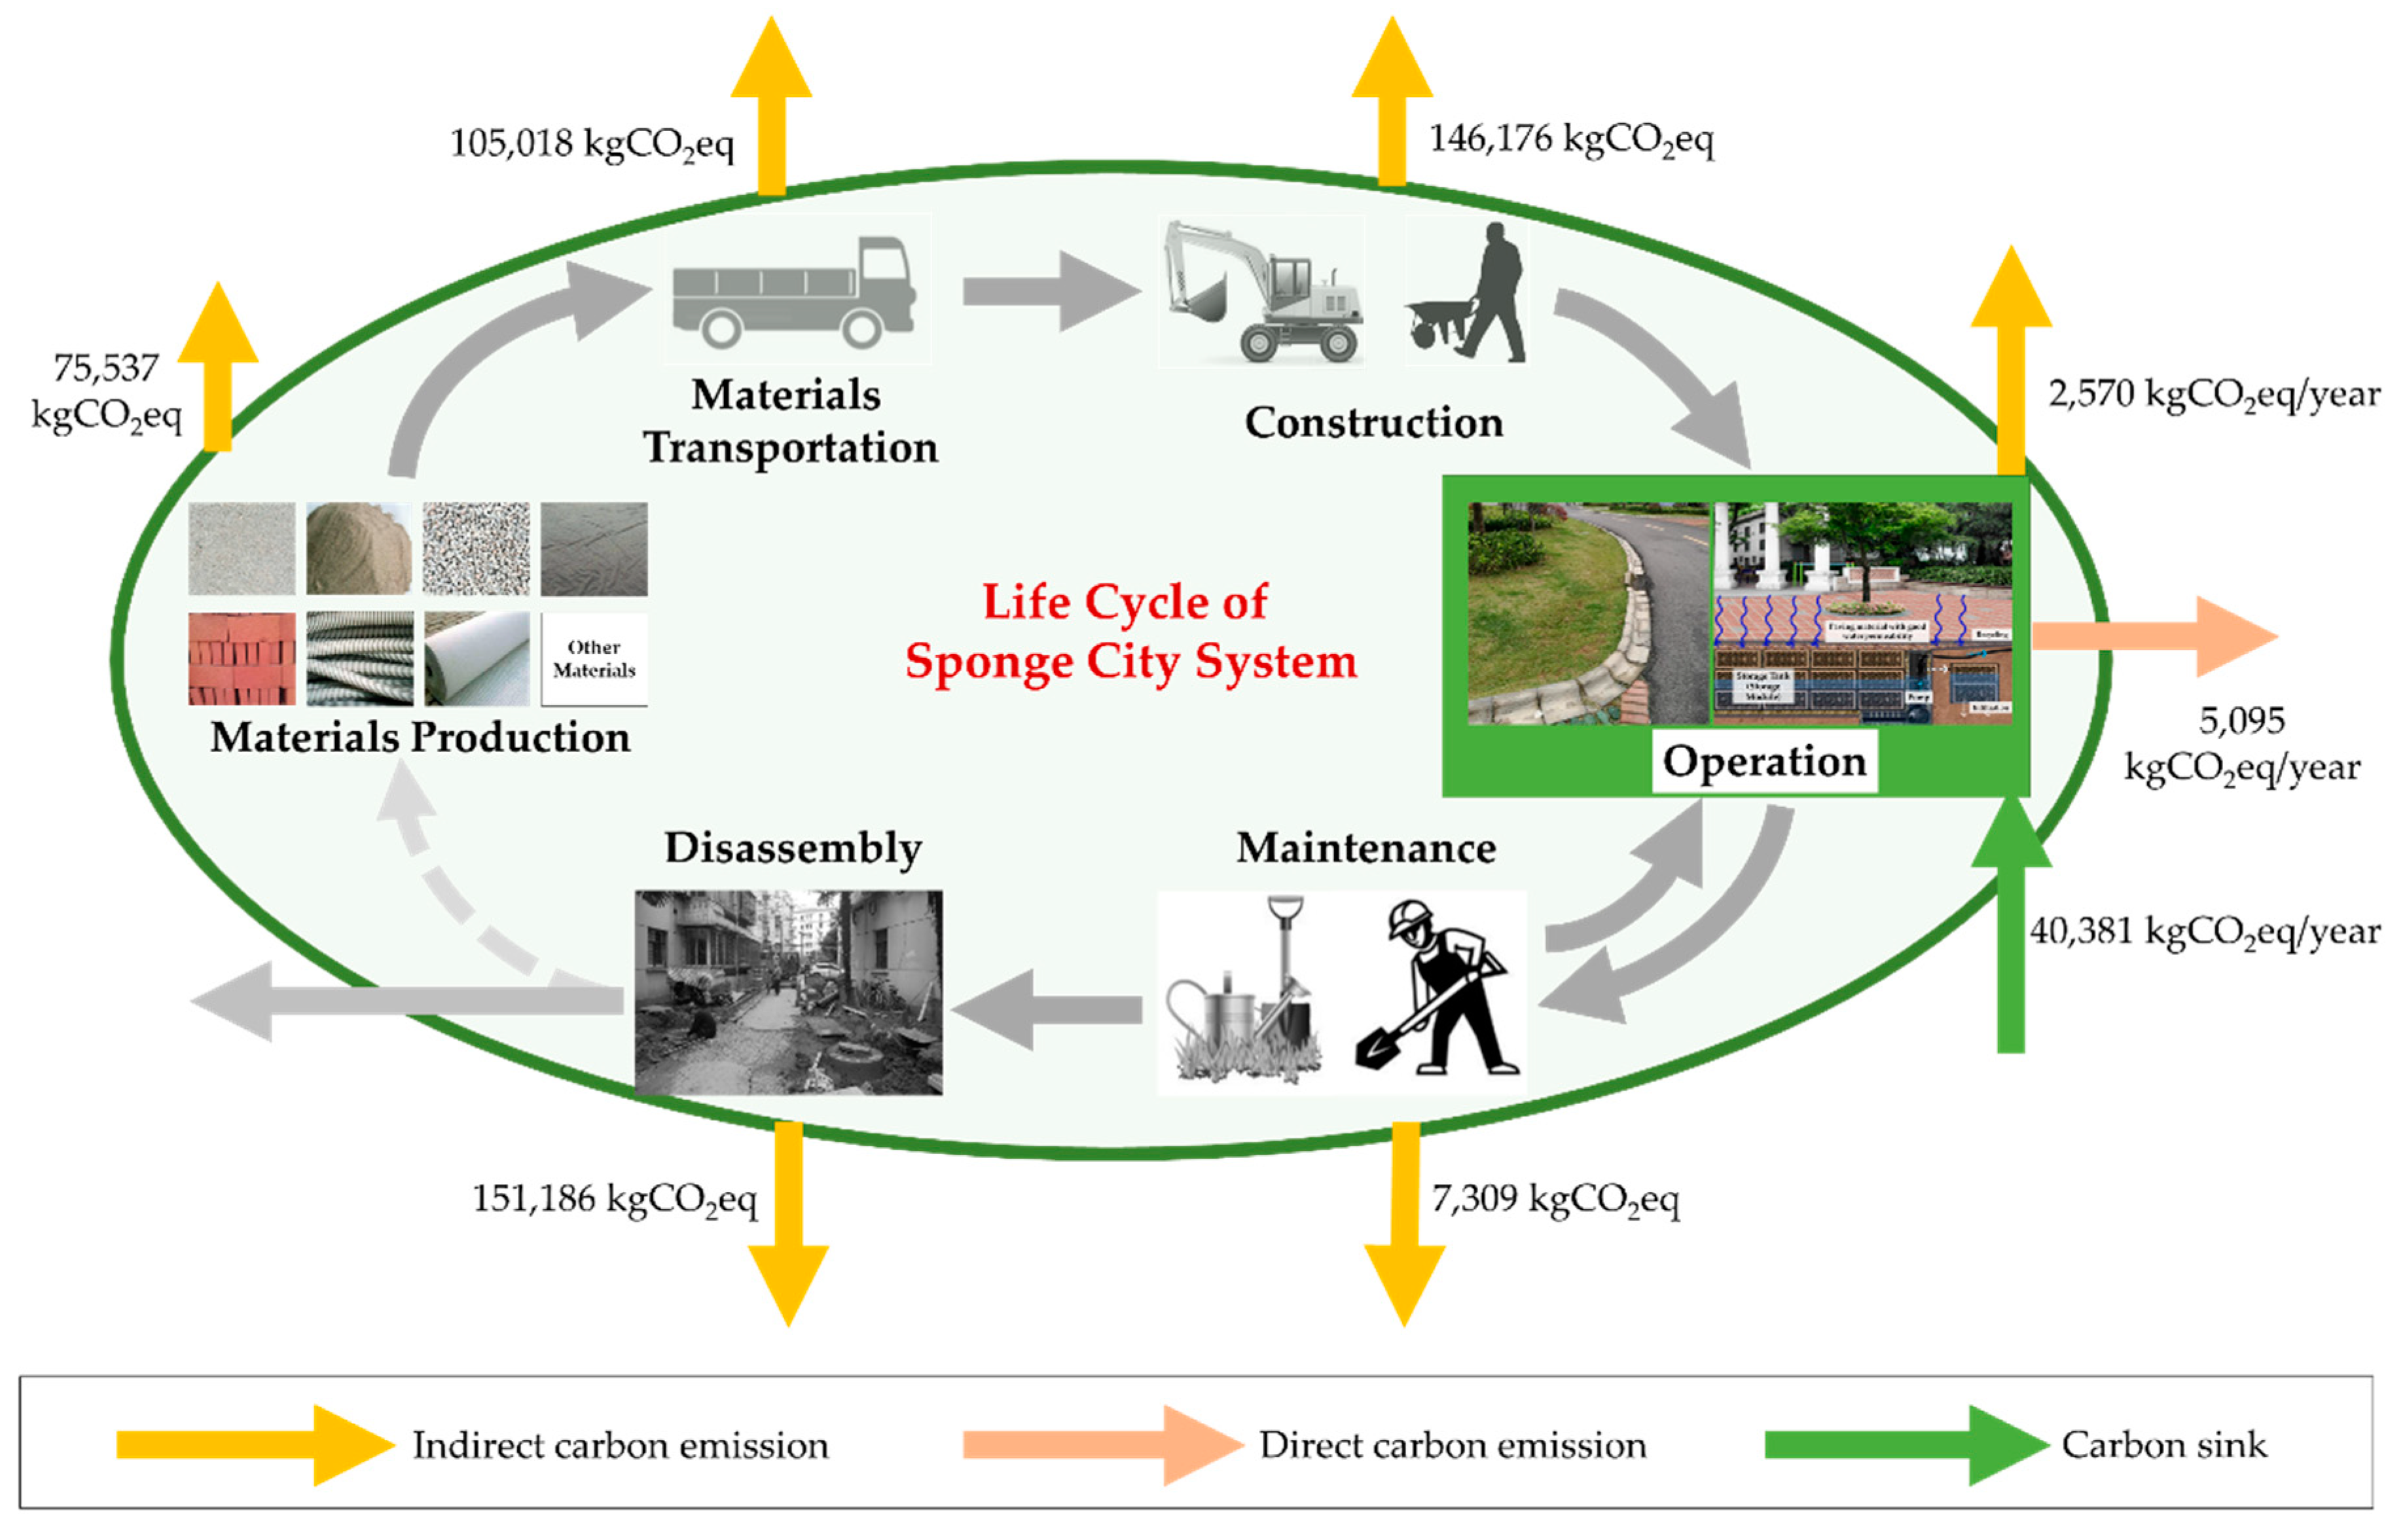
2.2. Accounting Boundary and Inventory

Determining a reasonable carbon emission accounting boundary is an essential step in studying the carbon emissions of Sponge City facilities. This study uses a LCA method to analyze different phases in the whole process of Sponge City projects, including material production, material transportation, construction, operation, maintenance, and disassembly phases. In the study, the direct carbon emissions, indirect carbon emissions, and carbon sinks of the Sponge City facilities are fully considered. Direct carbon emissions are carbon emissions coming from pollutant degradation. Indirect carbon emissions include carbon emissions from material production, materials transportation carbon emission, and energy consumption by equipment used in different phases. The carbon sink is generated by plant carbon sequestration, rainwater utilization, runoff reduction, rainwater purification, and building energy conservation during the operation of Sponge City facilities. Thus, the carbon emission accounting boundary and inventory can be defined as shown in Figure 2.

2.3. Accounting Model

This accounting model is based on the methodology of IPCC and adopted the accounting method of emission factors. The amount of net carbon emissions of Sponge City facilities is the total amount of direct carbon emissions plus total indirect carbon emissions and minus the total amount of carbon sinks that can be generated, as shown in the following equation:
T C E = ( T C E D + T C E I D ) T C S
where TCE is total carbon emissions (net carbon emissions), TCED is total direct carbon emissions, TCEID is total indirect carbon emissions, and TCS is the total carbon sink.

2.3.1. Accounting for Direct Carbon Emissions

The direct carbon emissions of Sponge City facilities come from pollutant degradation during the operation phase, mainly comprised of CO2, CH4, and N2O. Among them, CO2 and CH4 are mainly derived from the degradation and conversion processes of organic matter, while N2O is produced in the denitrification process. According to the IPCC guidelines, since direct emissions of CO2 are sourced, hence, only the contributions of CH4 and N2O are considered in the accounting of direct carbon emissions. Direct carbon emissions can be accounted for using measurement-based or computation-based methods. However, due to the current research on the measurement and calculation of CH4 and N2O emissions in the operation of Sponge City facilities, this study calculates the direct carbon emissions in the operation of Sponge City facilities by referring to the accounting methods of CH4 and N2O emissions in wastewater treatment.
According to the guidance on the calculation of carbon emissions from wastewater treatment of 2006 IPCC Guidelines for National Greenhouse Gas Inventories [38], the emission factor of methane in the anaerobic decomposition of organic matter is adopted. The CH4 emission factor can be calculated by the following formula:
E F j = B 0 × M C F j
where B0 is the theoretical emission coefficient of methane produced by the anaerobic decomposition of organic matter, the 5 day biochemical oxygen demand (BOD5) and chemical oxygen demand (COD), whose IPCC default factor is 0.6 kg CH4/kg BOD5 or 0.25 kg CH4/kg COD, and MCFj represents a correction factor for methane emissions in different anaerobic environments, with the value of 0.1 when the wastewater is directly discharged.
Since the degradation of rainwater pollutants in Sponge City facilities are equivalent to the direct discharge of sewage and natural purification, the above formula is suitable to be applied to the direct carbon emission accounting of Sponge City facilities and MCF is taken as 0.1. Considering that the global warming potential value of CH4 is 25 [39], the CO2 equivalent of CH4 emissions from Sponge City facilities can be calculated by the following formula:
C E C H 4 = M C O D × B 0 × M C F j × G W P C H 4 = 0.625 M C O D
where MCOD is the amount of COD reduced by Sponge City facilities.
During the accounting of N2O emissions of Sponge City facilities, the emission factor of N2O generated by the IPCC for domestic sewage discharge can be considered, with the EFN2O of 0.005 kg N2O/kg N. Considering that the global warming potential value of N2O is 298 [39], the carbon dioxide equivalent of N2O emissions from Sponge City facilities can be calculated by the following formula:
C E N 2 O = M N × E F N 2 O × G W P N 2 O = 2.341 M N
where MN is the amount of nitrogen reduced by Sponge City facilities in rainwater.

2.3.2. Accounting for Indirect Carbon Emissions

The indirect carbon emissions of Sponge City facilities include carbon emissions corresponding to energy consumption, electricity consumption, and material consumption during the whole process of material production, transportation, construction, operation, maintenance, and disassembly. Thus, the total amount of indirect carbon emissions can be calculated as follows:
T C E I D = C E M P + C E M T + C E e c + C E E T
where TCEID is the total indirect carbon emissions, CEMP is the carbon emissions from the production of materials, CEMT is the carbon emissions in the transportation process, CEec is the carbon emissions corresponding to the electricity consumption of the equipment, and CEET is the carbon emissions corresponding to the energy consumption of the equipment.
(1) Carbon emissions from materials production
Carbon emissions from the phase of materials’ production primarily comes from the various materials required in Sponge City facilities, which can be calculated by the following equation:
C E M P = i ( M M × C E u n i t M ) i
where CEMP is the carbon emissions in the production of materials, i is the material category, MM is the consumption amount of the material, and CEunit-M is the carbon emissions per unit for the corresponding material (carbon emission factors).
Materials utilized in the project mainly include concrete, gravel, polyvinyl chloride (PVC) pipe, permeable membrane, geotextiles, sand, brick, and graded gravel, with their carbon emission factors derived from previous studies [40,41,42,43,44] which have considered the process and energy consumption of local production of these materials in China.
(2) Carbon emissions from transportation
The energy consumption and corresponding carbon emissions of transportation depend on the mode of transport, the type of energy, and the distance of transport. Carbon emissions of transportation can be calculated as follows:
C E M T = i ( D i s t × M × C E u n i t M T ) i
where CEMT is the carbon emissions of the transportation process, i is a specific transportation mode, Dist is the transportation distance, M is the transportation volume of the material, and CEunit-MT is the carbon emissions per unit weight of the material and per unit transportation distance, with the value of 0.1759 kg CO2 eq/(t·km), calculated in combination with data from previous studies [43,45]. Materials to be transported should include all materials and equipment, such as construction materials, construction and operation equipment, and construction waste and earthwork.
(3) Carbon emissions from equipment
Relevant equipment is to be used in the construction, operation, maintenance, and disassembly processes. The carbon emissions corresponding to the power consumption of the equipment can be calculated as follows:
C E e c = i ( P i × T i × E F e c ) i
where i is the type of equipment, CEec is the carbon consumption of the equipment, Pi is the power of the equipment, Ti is the time of use of the equipment, and EFec is the emission factor of carbon dioxide from electricity consumption, with the value of 0.8112 tCO2/MWh in the case which is derived from Baseline Emission Factor of China’s Regional Power Grid in 2015 released by the National Development and Reform Commission (NDRC) of China [46].
Some devices are not powered by electricity, but may be powered by energy sources such as coal, diesel, and gasoline. The carbon emissions corresponding to the energy consumption of such equipment are calculated as follows:
C E E T = i ( E × C E u n i t E T ) i
where i is the type of equipment, CEET is the carbon emissions of the energy consumption of the equipment, E is the energy consumption, and CEunit-ET is the carbon emissions corresponding to the unit of energy consumption.

2.3.3. Accounting for the Carbon Sink

The carbon sink generated by Sponge City facilities basically comes from the operation phase.
(1) Carbon sequestration in green space
In this study, green space is defined in a broad sense, including bioretention measures such as rain gardens, concave green spaces, and ordinary green spaces. Plants and soils in green spaces both have carbon sequestration capacity and their carbon sequestration can be calculated by the following formula:
C S G A C = i ( S G A × C S u n i t G A × T ) i
where i is the Sponge City technical facility category, SGA is the area of the green space, CSunit-GA represents the unit of carbon sequestration rate of the green space, and T is the accounting period. According to the studies of Wu et al. [47] and other scholars, the carbon sequestration rate depends on the types of plants and several other factors, as discussed in the next section.
(2) Carbon sink from rainwater utilization
Through rainwater buckets, rainwater storage tanks, and other facilities, the rainwater can be collected and treated to different degrees and can be recycled, saving a lot of water resources and energy consumption during processing and configuration. The amount of carbon sink from rainwater utilization can be calculated as follows:
C S R e u s e = i ( Q r × C E t a p w a t e r ) = i ( Q r × Q E × E F e c ) i
where CSReuse is the carbon sink in the process of rainwater utilization, i represents one specific category of Sponge City facility, Qr is the amount of available rainwater collected by the Sponge City facility, CEtap-water is the carbon emissions of using equivalent tap water, QE is the amount of the electricity consumed per cubic meter of tap water, and EFec is the carbon emission factor for the electricity consumption.
(3) Carbon sink from runoff reduction
The use of Sponge City facilities can effectively reduce runoff and thus avoid carbon emissions from the drainage network for this part of the runoff, which can be calculated as follows:
C S R u n o f f = i ( M r u n o f f × C E r u n o f f ) i
where CSRunoff is the carbon sink generated by the reduction of runoff, i represents one specific category of Sponge City facility, MRunoff represents the amount of reduced runoff brought about by a specific kind of Sponge City facility, and CErunoff represents the carbon emissions that can be saved corresponding to the equivalent amount of runoff discharged by the drainage pipe network.
(4) Carbon sink from runoff pollutant removal
Carbon emissions from the treatment of these pollutants in runoff can be avoided while Sponge City facilities reduce runoff. The amount of this kind of carbon sink can be calculated as follows:
C S R a i n p u r i f y = i ( j ( M r a i n p u r i f y × C E r a i n p u r i f y ) j ) i
where CSRain-purify is the carbon sink generated by runoff pollutant removal, i represents one specific category of Sponge City facility, j represents a category of pollutant reduced by a Sponge City facility, Mrain-purify is the amount of pollutant reduced by a specific kind of Sponge City facilities, and CErain-purify is the equivalent carbon emissions corresponding to reduced pollutants.
(5) Carbon sink from buildings’ energy saving
Buildings’ energy saving carbon sinks come mainly from green roofs, which can help reduce the cost and energy consumption of heating or cooling indoor areas of buildings. The carbon sink corresponding to the energy saved for this part can be calculated by the following formula:
C S B u i l d i n g e n e r g y = i ( Q e n e r g y × C E b u i l d i n g e n e r g y ) i
where CSBuilding-energy is the carbon sink corresponding to the buildings’ energy saved brought about by Sponge City facilities, i represents one specific category of Sponge City facility, Qenergy is the energy saved by these facilities, and CEbuilding-energy is the amount of carbon emissions required to provide the corresponding energy. Many researchers have extensively studied the energy saving of a green roof compared with a common roof. Among them, Su [48] found that green roofs can save a significant amount of energy, for example, 19.86 kWh/(m2∙a) compared with a cool roof.
The comprehensive and universal life cycle carbon emission accounting model of Sponge City projects established in this study can be widely applied. However, most of the important carbon emission factors given in the case study were derived from prior research as they were more suitable to be used in the case study due to the location, which aimed at making the accounting more in line with engineering practice, as well as more reasonable and credible. If they need to be used in regions other than the case study site, it is recommended to amend or adopt more appropriate values, since the selection and determination of carbon emission factors have a large impact on the accuracy and rationality of carbon emission accounting [17,49]. In this study, the life cycle of Sponge City facilities is assumed to be 30 years. In addition, due to the linear characteristic of the model, the uncertainty analysis in this study uses a single-factor sensitivity analysis method.

3. Results and Discussion

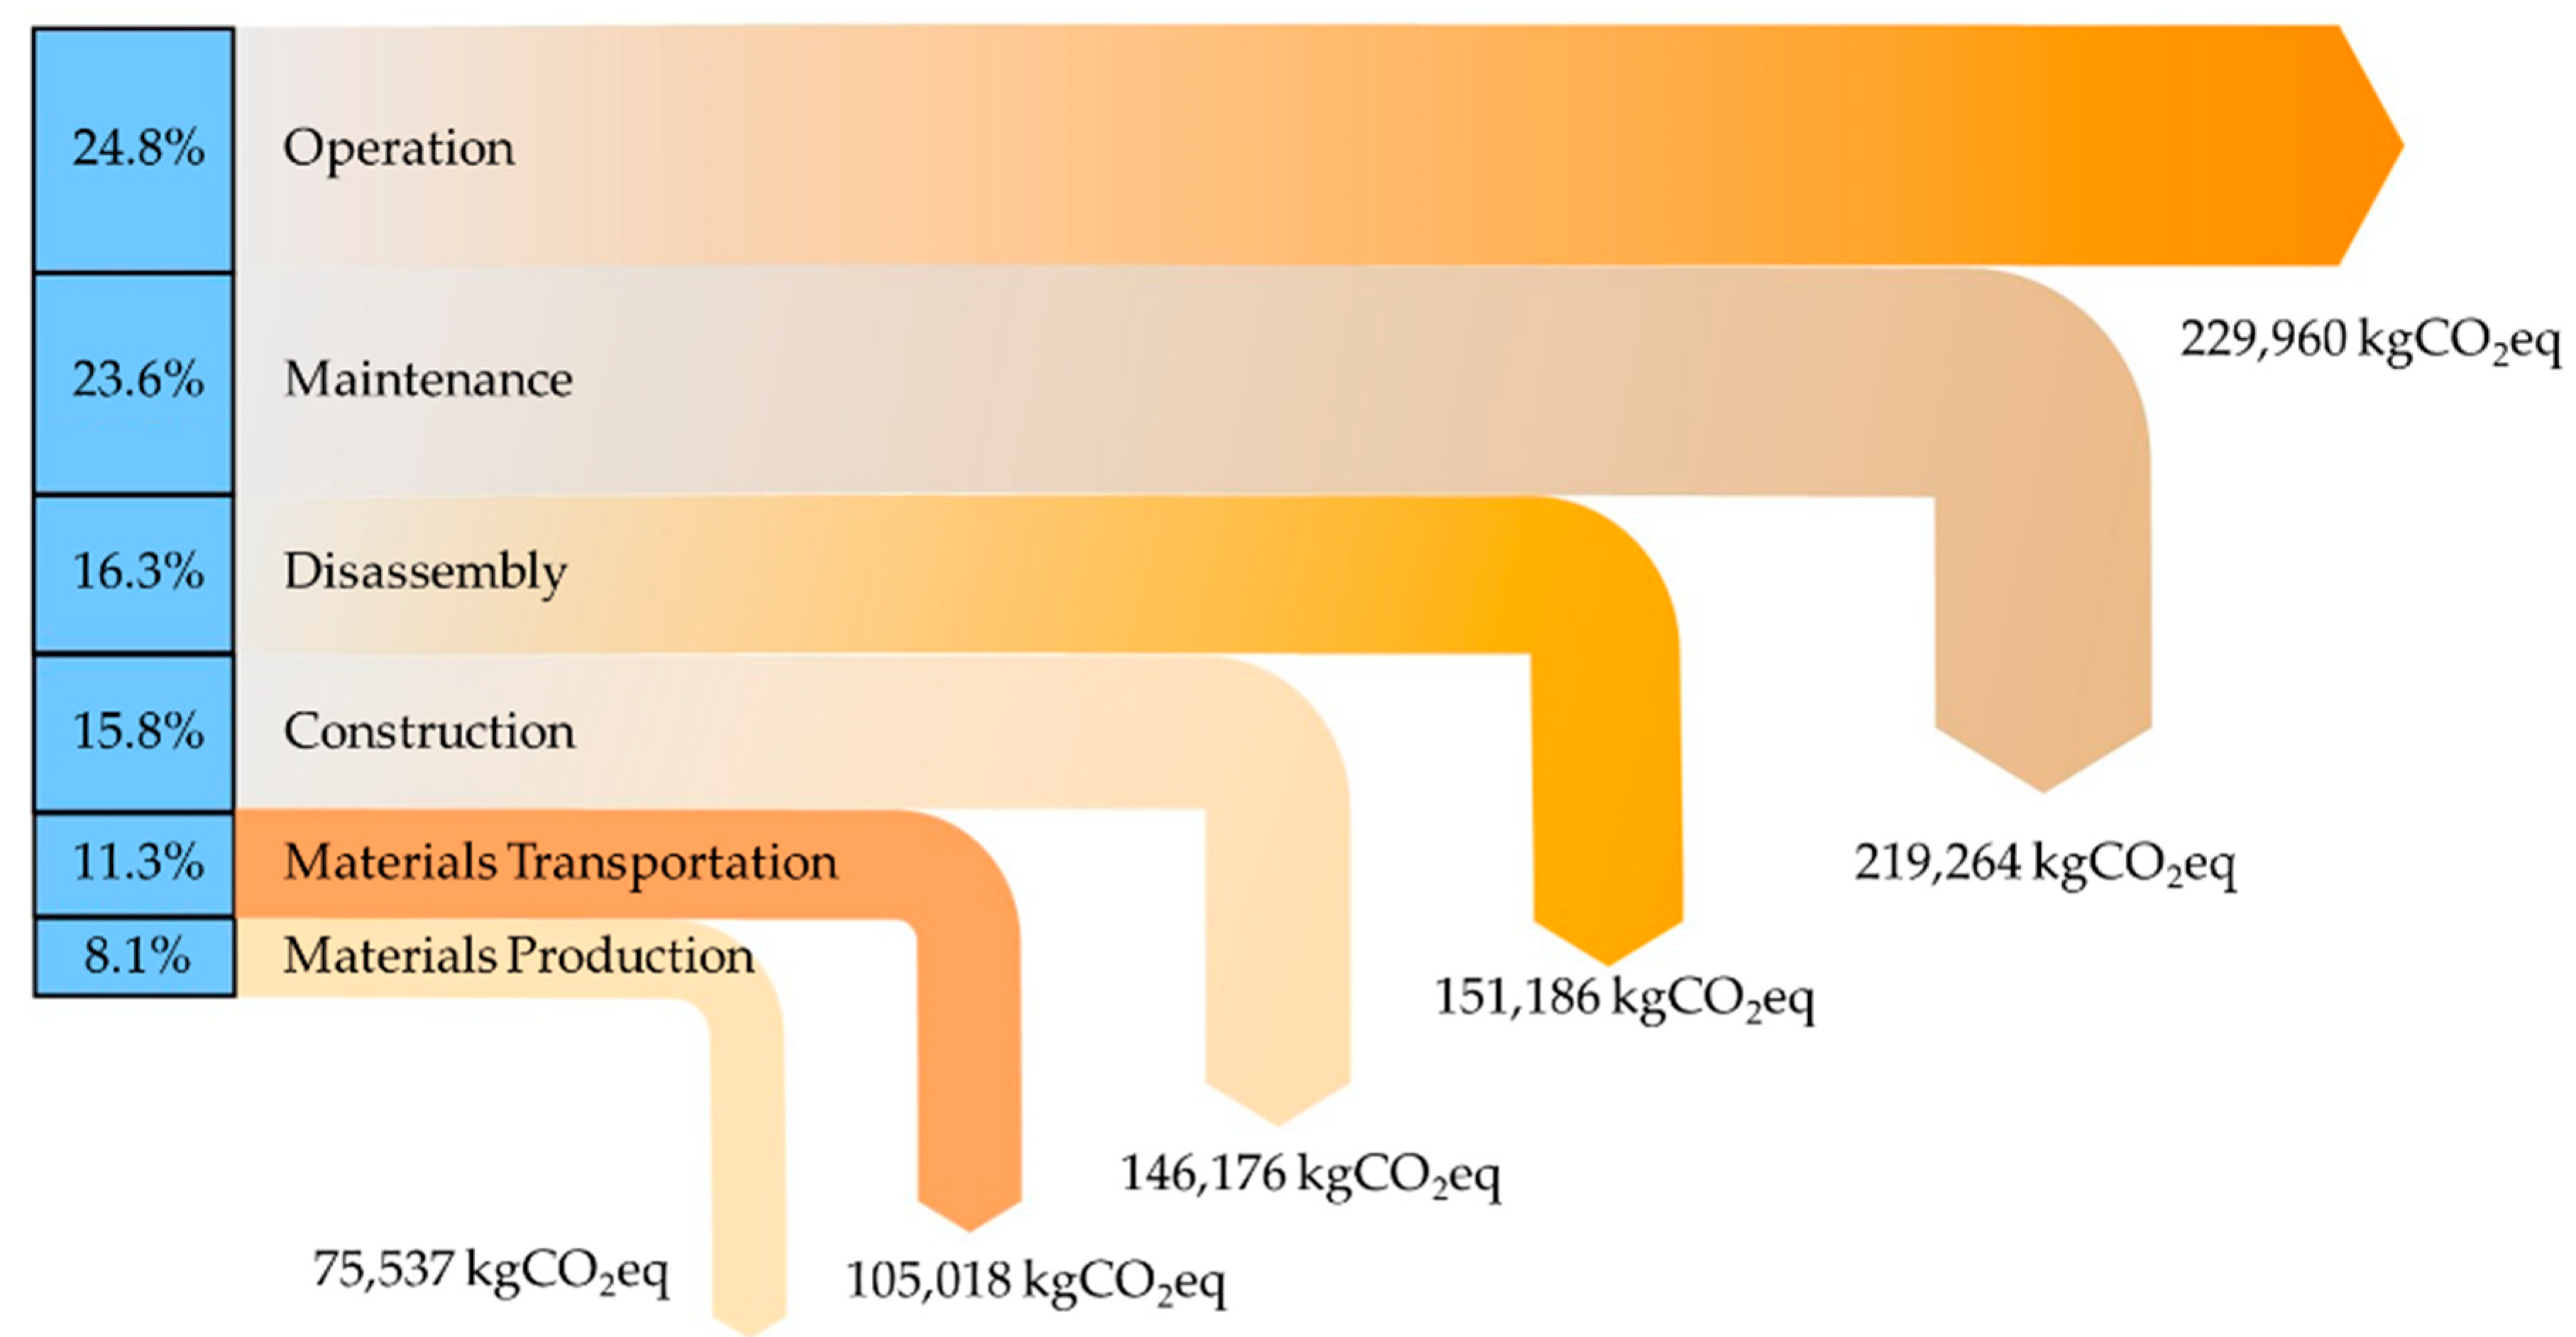
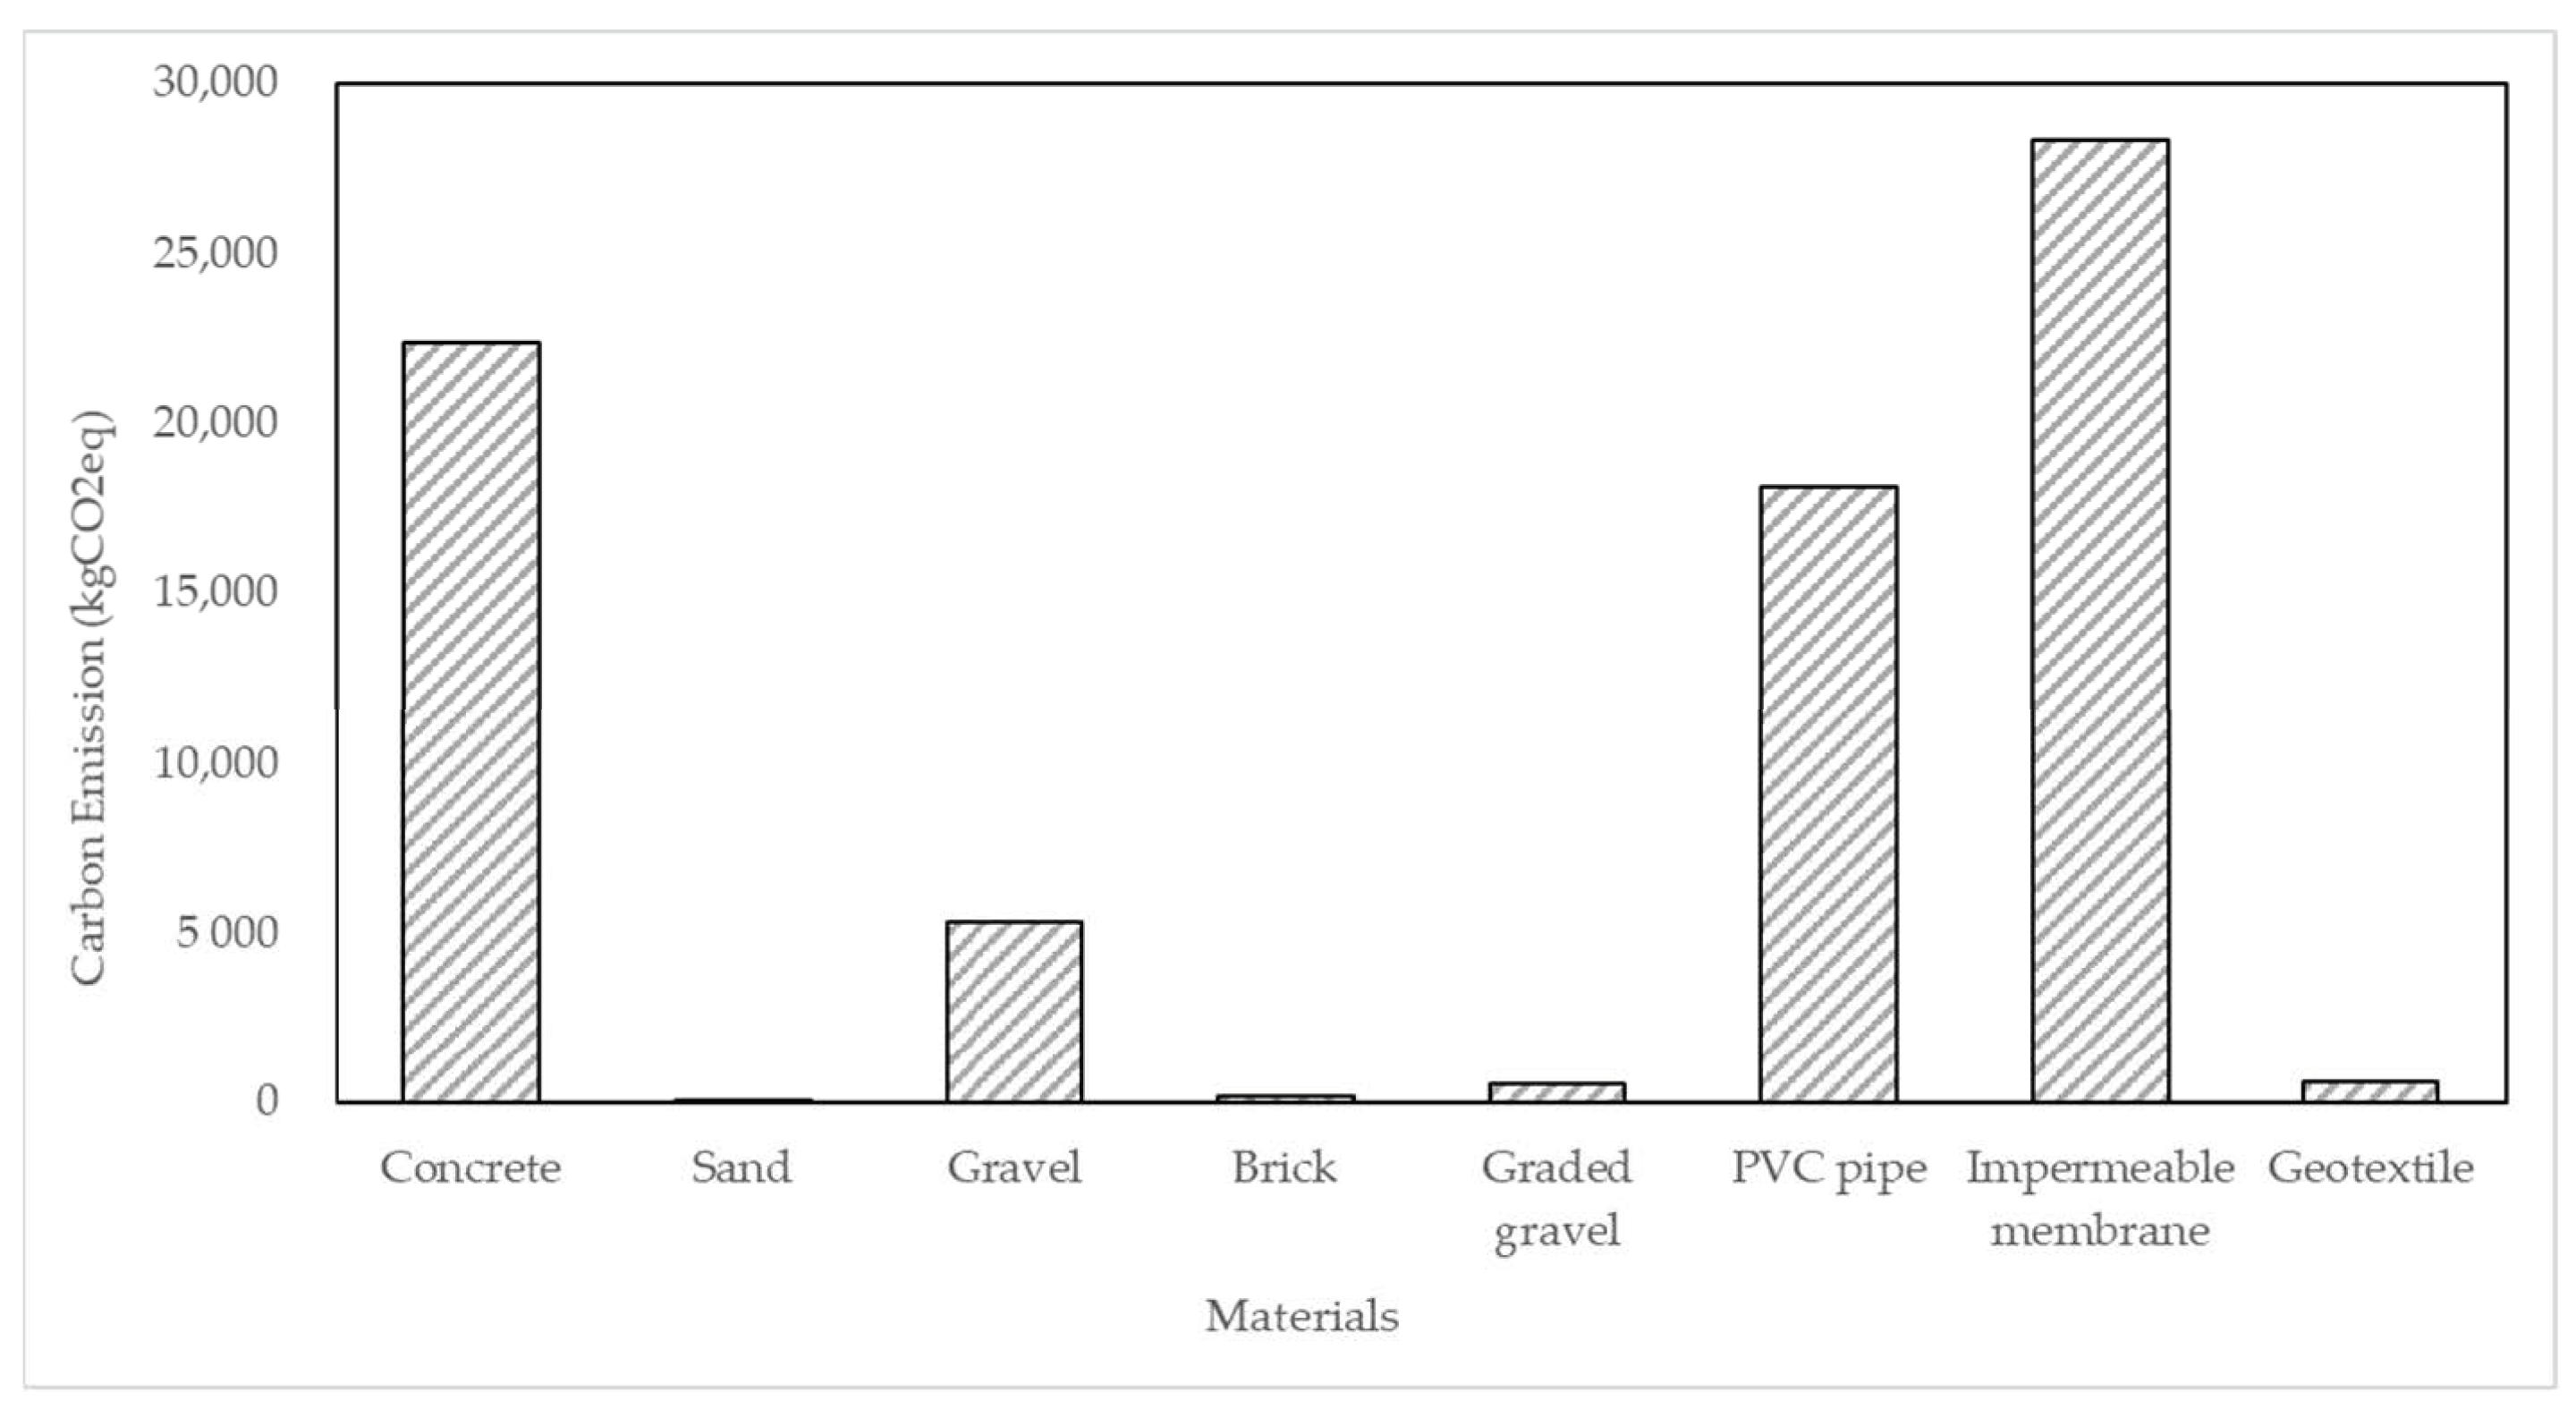
3.1. Carbon Emissions

According to related research [50,51] on the pollutant removal of Sponge City facilities or LID-BMP practices, 40% of these pollutants can be removed by these facilities. After the setting up of Sponge City facilities in the residential community, the removal capacities for COD and nitrogen pollutants are estimated to be 6307.1 kg COD/year and 492.7 kg N/year, respectively. Based on the above calculation method of the IPCC, the direct equivalent CO2 emissions of CH4 and N2O emissions generated by Sponge City facilities are predicted to reach 3941.9 kg CO2/year and 1153.5 kg CO2/year, respectively. The ability of each facility to remove pollutants is a critical factor in determining the amount of direct carbon emissions.
Indirect carbon emissions include carbon emissions from material and energy consumption from the material production, transportation, construction, operation, maintenance, and disassembly phases. According to the foregoing calculation method, combined with the design data of planning and construction of this Sponge City project and the existing literature research, the indirect carbon emissions of each stage of the calculation are shown in Figure 3.
The proportions of indirect carbon emissions generated during the operation, maintenance, and construction phases are the largest (25%, 24%, and 16%, respectively), and accordingly, the amount of carbon emissions from the disassembly phase is also large. The carbon emissions from these phases can be mainly attributed to the fuel and electricity consumption of the corresponding facilities and equipment and thus are closely related to the amount of energy used and emissions during energy extraction and utilization.
As for the materials transportation phase, the amount of carbon emissions depends on the amount of material being transported, the transportation distances and the fuel consumed. Therefore, the emission reduction measures for this item mainly include the use of clean and renewable fuels, as well as the procurement of building materials in the vicinity to shorten the transportation distance. Although the carbon emissions from the material production phase do not account for a large proportion of the total indirect carbon emissions, they cannot be ignored yet. The carbon emissions of various materials are shown in Figure 4. Among all material used in this Sponge City projects, PVC pipes and impermeable membranes (primarily made of polyethylene (PE)) take significant proportions, in total carbon emission which are, even though the consumption amount of these two materials is not much compared to concrete and other materials. This result is consistent with the research of Xu et al. [52], which showed that the consumption of PVC and fabric contributed significantly to carbon emissions from the LID-BMPs construction phase. The production process of plastics is complicated, thus the amount of carbon emissions from their production phase is relatively huge.

3.2. Carbon Sink

In this Sponge City project, since there are no green roofs and other facilities designed that can generate carbon sinks from the energy saving of buildings and the pipeline network has not been substantially modified, the energy saving carbon sinks and runoff-controlled carbon sinks of the buildings are zero. Three kinds of carbon sinks that can be produced are carbon sequestration in green space, the carbon sink from rainwater utilization, and the carbon sink from runoff pollutant reduction.
Carbon sequestration in green space is a kind of carbon sink achieved by both vegetation and soil in bioretention facilities, such as recessed green spaces and rain gardens. Usually, the exact green carbon sequestration rate can be obtained by direct measurement, but this method is difficult to be carried out, especially for the planning and construction stages. Thus, the emission factor method, based on a large number of literature studies and databases, is an important and convenient way to estimate the amount of carbon sequestration in green space. Wu et al. studied [47] the carbon fixation and oxygen release values of the urban green space in Hangzhou, China, near to the case area in this study, showing that the urban spaces with different kinds of plants have different carbon fixation and oxygen release values. Based on the study of Wu et al., considering that the most frequent plants are evergreen broad-leaved plants, the carbon fixation rate of the rainwater garden and green space in this case study is taken as 2.2255 kg/(m2·year), with the carbon sequestration rate of plants of 2.184 kg/(m2·year) and soil of 0.0415 kg/(m2·year). In this context, the carbon sequestration in the green spaces can be obtained as 5450 kg CO2 eq/year. The carbon sequestration rate is consistent with the annual net sequestration carbon fixation rate of the constructed wetland in the study of Klein et al. [32], with the range of 0.27~2.4 kg CO2 eq/year and varying mainly with the season and number of plants. Kim et al. [24] and Kim et al. [53] found that the reed vegetation in integrated management practices had relatively low net ecological exchange (2.72 kg CO2/m2·year) in Korea, compared to that of alternative vegetation such as sedum (3.1 kg CO2/m2·year), grass (5.7 kg CO2/m2·year), and shrubs (4.9 kg CO2/m2·year), which indicated that planting alternative vegetation can effectively reduce greenhouse gases emissions over years by improving CO2 absorption capacity. Compared with their research, the carbon sequestration rate of the case study is relatively low, maybe caused by the differences in terms of regions and plants. At the same time, this study chooses a relatively lower value within a reasonable range to estimate the carbon emission reduction benefits of Sponge City urban facilities conservatively.
The carbon sink from rainwater utilization also can be achieved in this renovation project. The volume of the rainwater storage tank is designed to be 360 m3; combining Shanghai rainfall data and related literature research [54], the average annual rainfall frequency in Shanghai can be estimated to be 80 times every year. Under this condition, the amount of rainwater which can be utilized is 17,280 m3/year. Therefore, combined with the rainfall data from Shanghai, the carbon sink from rainwater utilization which can be achieved by the rainwater storage tank set up in the renovation project contributes the predicted amount of 15,379 kg CO2 eq/year.
According to Ning et al. [54] and previous research by this group, the event mean concentration of COD in runoff is 144 mg/L and the mean concentration of total nitrogen is about 10 mg/L in Shanghai. Pollutants being removed by Sponge City facilities can reduce the load of wastewater treatment plants greatly and reduce the corresponding carbon emissions. The annual removal amount of COD is 6307.09 kg COD/year and the annual removal amount of nitrogen pollutants is 492.74 kg N/year. Therefore, the annual amount of carbon sink from runoff pollutant removal can be up to 19,552 kg CO2 eq/year.

3.3. Life Cyle Carbon Reduction

According to the accounting of the carbon emissions and carbon sinks of Sponge City facilities in this residential community, the accumulated carbon sink after 18.8 years can equal the amount of all direct and indirect emissions during the same period (which can be also called as carbon neutralization). In the subsequent lifespan, these Sponge City facilities can function as carbon-emission-reduction system absorbing greenhouse gases from the natural system. The amount of net carbon emission absorbing benefit is estimated to be 25,407 kg CO2 eq/year, during the last 11 years of the 30-year life cycle.
Therefore, according to the various carbon emissions and carbon sinks, the life cycle flow of the carbon emissions and sinks of the Sponge City project in the case can be presented in Figure 5.

3.4. Uncertainty Analysis

The results of the single-factor sensitivity analysis can show the effect of some variables on the total life cycle carbon emissions and carbon sinks. The variation range of each factor is set at 10%, and the factors that have a significant impact on the total carbon emissions are operation (2.48%, including direct carbon emissions), maintenance (2.36%), disassembly (1.63%), construction (1.58%), factors related to CH4 emissions (1.28%), and material utilization (0.81%), which indicated the significance of energy (fuels and electricity) consumption and emission factors. The three most influential materials are concrete (0.24%), PVC (0.20%), and impermeable membranes (0.20%), which proved the above discussion about the materials’ production. With a similar method, the impact of three factors on the total life cycle carbon sink benefit are pollutant reduction (4.84%), rainwater utilization (4.98%), and carbon sequestration in green space (1.76%). The uncertainty analysis helps to understand the impact of changes in different factors and can be used as instructions and a reference for identifying carbon reduction measures and policies with high priority.

3.5. Carbon Reduction Measures

Based on the above analysis of carbon emissions and carbon sinks, some measures can be proposed to reduce the carbon emissions and enhance its carbon sink benefits in the Sponge City project’s life cycle.
The use of clean and renewable energy and the avoidance of excessive energy consumption is an important way to reduce carbon emissions from many phases mainly including transportation, construction, maintenance, and disassembly phases, which can significantly reduce the total carbon emissions. Many studies have showed that energy saving and efficiency policies were effective in mitigating carbon emissions, and the change in CO2 emission coefficients for fuels slowed down the increase of residential emissions [17,18,19]. Substantial waste will be generated during the disassembly phase. If the waste can be recycled and reused rather than being disposed of directly as waste, a considerable amount of carbon emissions can be reduced [21,55]. Many regions, such as Masdar City, Samsø, have been testing renewable energy utilization in recent years, which has proved the advantages and feasibility of carbon emissions reduction [56,57].
Better arrangement of Sponge City projects’ implementation can contribute a lot to the reduction of carbon emissions, such as optimization of transport, construction, and comprehensive arrangement. Combined with the uncertainty analysis, the transportation distance has a large impact on the overall carbon emissions and can be shorten to reduce carbon emissions.
More bioretention facilities, such as grasslands and rain gardens, can be set up properly according to local conditions, and meanwhile, the types of vegetation can be reasonably complicated to enhance the performance of the micro-ecosystem, which will help increase the carbon sink benefits of Sponge City facilities. It is not only feasible and significant to deploy these facilities with carbon sink benefit in public spaces, but also to arrange some green facilities on the roofs and walls of buildings, such as green roofs and green walls. In this case study, green roofs are not considered and designed due to the characteristic of the old residential community and economic factors, but solutions and application are necessary to be considered in the near future. Energy savings made by private buildings and deploying facilities with carbon sink benefits in the exterior of the building can help increase the overall carbon sink benefits of Sponge City projects, without having to be limited by the status and availability of public spaces.
Avoiding overuse of plastics and adopting alternative low-carbon materials is also effective on reducing carbon emissions from materials production phase. In contrast, in addition to the large amount of carbon emissions attributable to the vast utilization of concrete, the amount of carbon emissions of sand, gravel, brick, and other building materials is obviously smaller than the amount of carbon emissions of plastics.
A local engineering construction and carbon emission database is also highly recommended to be established and maintained. Although many default carbon emission factors have been given by the IPCC, UNFCCC, ecoinvent, and other organizations or databases, they are not fully applicable to specific cities and specific activities. On the other hand, Sponge City facilities are not the same as conventional stormwater control measures and facilities, and may differ in many aspects such as their structural composition and construction process. Combined with the local conditions of the city, the database with substantial similar activities’ data and some carbon emission factors calculated can provide significant value for the selection and determination of factors for the accurate carbon accounting of future projects’ planning and implementation.
In addition, if permitted in terms of economy, it is also necessary to install monitoring system and intelligent control system in the community. The monitoring system can help operators to know the operational effects of various facilities better and in a timely way, which is vital for maintenance and taking appropriate control measures. The intelligent control system helps to control the operating parameters of the corresponding equipment in time, optimizing the operation effect and reducing the energy consumption properly. It was estimated that using movement sensors to control lighting and water could cut electricity and water consumption by 51 and 55%, respectively, in Masdar City [56,58], which could contribute a lot to the carbon emissions reduction.

4. Conclusions

In this study, a carbon emission accounting model for Sponge City projects is established, based on the IPCC guidelines and LCA method. A case study in a residential community in Shanghai is presented to analysze the carbon emissions and sinks during the 30-year lifespan of Sponge City facilities. The carbon emissions generated by the operation phase and maintenance phase of the community Sponge City facilities account for the largest proportion, followed by that from the construction, disassembly, and transportation phase. The pollutant removal function of these Sponge City facilities can bring about the largest amount of carbon sink, accounting for 48.4%, followed by the carbon sink generated by rainwater utilization by the rainwater storage tank, accounting for 38.1%. A long-term proper operation can ensure the realization of a large number of carbon sinks. It is expected that carbon neutrality can be achieved in about 19 years and in the latter part of life cycle, the system can function as carbon-emission-reduction system to mitigate the greenhouse effect.
Based on the case study, several measures can be proposed to further reduce the life cycle carbon emissions of Sponge City projects: using low-carbon fuels as energy sources for vehicles and equipment, using low-carbon materials to replace plastics such as PVC and PE with high carbon emissions, purchasing building materials and equipment nearby to reduce unnecessary carbon emission from long transportation distance, and doing better in terms of actual scheme designing and arrangement of implementation. In addition, it is highly recommended to establish carbon emission databases for Sponge City projects to facilitate the carbon emission accounting of various Sponge City projects more accurately, as well as monitoring systems and intelligent control systems.
In future researches, economic feasibility analysis of various Sponge City facilities and related measures or policies on reducing carbon emission can be also incorporated in the carbon emission accounting and reduction.

Author Contributions

Conceptualization, X.L. and J.X.; Data curation, X.L. and J.R.; Funding acquisition, J.X., T.Z., W.C., J.H., and G.L.; Investigation, X.L. and J.R.; Methodology, X.L. and J.R.; Project administration, J.X., T.Z., J.H., and G.L.; Resources, W.C. and G.L.; Supervision, J.X., T.Z., W.C., J.Q., J.H., and G.L.; Validation, J.R. and W.C.; Writing—original draft, X.L.; Writing—review & editing, T.Z. and J.Q.

Funding

This research was funded by Science and Technology Commission of Shanghai Municipality (16DZ1202107).

Acknowledgments

Thanks for great support and assistance from various aspects by relevant organizations especially Tongji Architectural Design (Group) Co., Ltd., as well as residents of the community, enabling the research work to be carried out smoothly and completed successfully.

Conflicts of Interest

The authors declare no conflict of interest.

References

  1. Green, O.O.; Shuster, W.D.; Rhea, L.K.; Garmestani, A.S.; Thurston, H.W. Identification and Induction of Human, Social, and Cultural Capitals through an Experimental Approach to Stormwater Management. Sustainability 2012, 4, 1669–1682. [Google Scholar] [CrossRef]
  2. Li, X.; Li, J.; Fang, X.; Gong, Y.; Wang, W. In case studies of the sponge city program in China. In Proceedings of the World Environmental and Water Resources Congress, West Palm Beach, FL, USA, 22–26 May 2016; pp. 295–308. [Google Scholar]
  3. Xia, J.; Zhang, Y.Y.; Xiong, L.H.; Shan, H.E.; Wang, L.F.; Zhongbo, Y.U. Opportunities and challenges of the Sponge City construction related to urban water issues in China. Sci. China Earth Sci. 2017, 60, 1–7. [Google Scholar] [CrossRef]
  4. Li, H.; Ding, L.; Ren, M.; Li, C.; Wang, H. Sponge City Construction in China: A Survey of the Challenges and Opportunities. Water 2017, 9, 594. [Google Scholar] [CrossRef]
  5. Liu, H.; Jia, Y.; Niu, C. “Sponge city” concept helps solve China’s urban water problems. Environ. Earth Sci. 2017, 76, 473. [Google Scholar] [CrossRef]
  6. Fletcher, T.D.; Shuster, W.; Hunt, W.F.; Ashley, R.; Butler, D.; Arthur, S.; Trowsdale, S.; Barraud, S.; Semadeni-Davies, A.; Bertrand-Krajewski, J.L.; et al. SUDS, LID, BMPs, WSUD and more—The evolution and application of terminology surrounding urban drainage. Urban Water J. 2015, 12, 525–542. [Google Scholar] [CrossRef]
  7. United Nations. Transforming our World: The 2030 Agenda for Sustainable Development; Resolution adopted by the General Assembly; United Nations: New York, NY, USA, 2015. [Google Scholar]
  8. Mi, Z.; Meng, J.; Guan, D.; Shan, Y.; Liu, Z.; Wang, Y.; Feng, K.; Wei, Y.M. Pattern changes in determinants of Chinese emissions. Environ. Res. Lett. 2017, 12, 074003. [Google Scholar] [CrossRef] [Green Version]
  9. Mi, Z.; Meng, J.; Green, F.; Coffman, D.M.; Guan, D. China’s “exported carbon” peak: Patterns, drivers, and implications. Geophys. Res. Lett. 2018, 45, 4309–4318. [Google Scholar] [CrossRef]
  10. Liu, Y.; Xiao, H.; Zikhali, P.; Lv, Y. Carbon Emissions in China&58; A Spatial Econometric Analysis at the Regional Level. Sustainability 2014, 6, 6005–6023. [Google Scholar]
  11. Mao, X.; Jia, H.; Yu, S.L. Assessing the ecological benefits of aggregate LID-BMPs through modelling. Ecol. Model. 2017, 353, 139–149. [Google Scholar] [CrossRef]
  12. Wilson, C.E.; Hunt, W.F.; Winston, R.J.; Smith, P. Comparison of Runoff Quality and Quantity from a Commercial Low-Impact and Conventional Development in Raleigh, North Carolina. J. Environ. Eng. 2015, 141, 05014005. [Google Scholar] [CrossRef]
  13. Eckart, J.; Sieker, H.; Vairavamoorthy, K.; Alsharif, K. Flexible design of urban drainage systems: Demand led research for Hamburg-Wilhelmsburg. Rev. Environ. Sci. Bio-Technol. 2012, 11, 5–10. [Google Scholar] [CrossRef]
  14. Guan, M.; Sillanpää, N.; Koivusalo, H. Assessment of LID practices for restoring pre-development runoff regime in an urbanized catchment in southern Finland. Water Sci. Technol. 2015, 71, 1485–1491. [Google Scholar] [CrossRef] [PubMed] [Green Version]
  15. Martin-Mikle, C.J.; Beurs, K.M.D.; Julian, J.P.; Mayer, P.M. Identifying priority sites for low impact development (LID) in a mixed-use watershed. Lands. Urban Plan. 2015, 140, 29–41. [Google Scholar] [CrossRef]
  16. Seo, M.; Jaber, F.H. Evaluation of the Effectiveness of Low Impact Development Practices (LIDs) under Various Conditions. Agric. Water Manag. 2014, 134, 110–118. [Google Scholar]
  17. Yeo, Y.; Shim, D.; Lee, J.-D.; Altmann, J. Driving forces of CO2 emissions in emerging countries: LMDI decomposition analysis on China and India’s residential sector. Sustainability 2015, 7, 16108–16129. [Google Scholar] [CrossRef]
  18. Ma, X.-W.; Ye, Y.; Shi, X.-Q.; Zou, L.-L. Decoupling economic growth from CO2 emissions: A decomposition analysis of China’s household energy consumption. Adv. Clim. Chang. Res. 2016, 7, 192–200. [Google Scholar] [CrossRef]
  19. Chapman, A.; Fujii, H.; Managi, S. Key Drivers for Cooperation toward Sustainable Development and the Management of CO2 Emissions: Comparative Analysis of Six Northeast Asian Countries. Sustainability 2018, 10, 244. [Google Scholar] [CrossRef]
  20. Yan, Q.; Wang, Y.; Baležentis, T.; Sun, Y.; Streimikiene, D. Energy-Related CO2 Emission in China’s Provincial Thermal Electricity Generation: Driving Factors and Possibilities for Abatement. Energies 2018, 11, 1–25. [Google Scholar] [CrossRef]
  21. Molina-Moreno, V.; Leyva-Díaz, J.C.; Llorens-Montes, F.J.; Cortés-García, F.J. Design of indicators of circular economy as instruments for the evaluation of sustainability and efficiency in wastewater from pig farming industry. Water 2017, 9, 653. [Google Scholar] [CrossRef]
  22. Flynn, K.M.; Traver, P.R.G. Evaluation of Green Infrastructure Practices Using Life Cycle Assessment; Villanova University Villanova: Villanova, PA, USA, 2011. [Google Scholar]
  23. Spatari, S.; Yu, Z.; Montalto, F.A. Life cycle implications of urban green infrastructure. Environ. Pollut. 2011, 159, 2174. [Google Scholar] [CrossRef] [PubMed]
  24. Kim, D.; Park, T.; Hyun, K.; Lee, W. Life cycle greenhouse-gas emissions from urban area with low impact development (LID). Adv. Environ. Res. 2013, 2, 279–290. [Google Scholar] [CrossRef]
  25. Moore, T.L.C.; Hunt, W.F. Predicting the carbon footprint of urban stormwater infrastructure. Ecol. Eng. 2013, 58, 44–51. [Google Scholar] [CrossRef]
  26. O’Sullivan, A.D.; Wicke, D.; Hengen, T.J.; Sieverding, H.L.; Stone, J.J. Life Cycle Assessment modelling of stormwater treatment systems. J. Environ. Manag. 2015, 149, 236–244. [Google Scholar] [CrossRef] [PubMed]
  27. Getter, K.L.; Rowe, D.B.; Robertson, G.P.; Cregg, B.M.; Andresen, J.A. Carbon sequestration potential of extensive green roofs. Environ. Sci. Technol. 2009, 43, 7564–7570. [Google Scholar] [CrossRef] [PubMed]
  28. Andrew, R.M.; Vesely, E.T. Life-cycle energy and CO2 analysis of stormwater treatment devices. Water Sci. Technol. 2008, 58, 985–993. [Google Scholar] [CrossRef] [PubMed]
  29. Bouchard, N.R.; Osmond, D.L.; Winston, R.J.; Hunt, W.F. The capacity of roadside vegetated filter strips and swales to sequester carbon. Ecol. Eng. 2013, 54, 227–232. [Google Scholar] [CrossRef]
  30. Picek, T.; Čížková, H.; Dušek, J. Greenhouse gas emissions from a constructed wetland—Plants as important sources of carbon. Ecol. Eng. 2007, 31, 98–106. [Google Scholar] [CrossRef]
  31. Pan, T.; Zhu, X.D.; Ye, Y.P. Estimate of life-cycle greenhouse gas emissions from a vertical subsurface flow constructed wetland and conventional wastewater treatment plants: A case study in China. Ecol. Eng. 2011, 37, 248–254. [Google Scholar] [CrossRef]
  32. Klein, J.J.M.D.; Werf, A.K.V.D. Balancing carbon sequestration and GHG emissions in a constructed wetland. Ecol. Eng. 2014, 66, 36–42. [Google Scholar] [CrossRef]
  33. Wu, H.; Li, L.; Jian, Z.; Guo, W.; Shuang, L.; Hai, L. Purification ability and carbon dioxide flux from surface flow constructed wetlands treating sewage treatment plant effluent. Bioresour. Technol. 2016, 219, 768–772. [Google Scholar] [CrossRef] [PubMed]
  34. Loubet, P.; Roux, P.; Bellon-Maurel, V. WaLA, a versatile model for the life cycle assessment of urban water systems: Formalism and framework for a modular approach. Water Res. 2016, 88, 69–82. [Google Scholar] [CrossRef] [PubMed]
  35. Mander, Ü.; Dotro, G.; Ebie, Y.; Towprayoon, S.; Chiemchaisri, C.; Nogueira, S.F.; Jamsranjav, B.; Kasak, K.; Truu, J.; Tournebize, J. Greenhouse gas emission in constructed wetlands for wastewater treatment: A review. Ecol. Eng. 2014, 66, 19–35. [Google Scholar] [CrossRef]
  36. Brudler, S.; Arnbjerg-Nielsen, K.; Hauschild, M.Z.; Rygaard, M. Life cycle assessment of stormwater management in the context of climate change adaptation. Water Res. 2016, 106, 394–404. [Google Scholar] [CrossRef] [PubMed]
  37. Liu, Z. China’s Carbon Emissions Report 2016; Report for Harvard Belfer Center for Science and International Affairs; Harvard Belfer Center for Science and International Affairs: Cambridge, MA, USA, October 2016. [Google Scholar]
  38. Eggleston, S.; Buendia, L.; Miwa, K.; Ngara, T.; Tanabe, K. 2006 IPCC Guidelines for National Greenhouse Gas Inventories; Institute for Global Environmental Strategies Hayama: Kanagawa Prefecture, Japan, 2006; Volume 5. [Google Scholar]
  39. Forster, P.; Ramaswamy, V.; Artaxo, P.; Berntsen, T.; Betts, R.; Fahey, D.W.; Haywood, J.; Lean, J.; Lowe, D.C.; Myhre, G.; Nganga, J. Changes in Atmospheric Constituents and in Radiative Forcing. In Climate Change 2007: The Physical Science Basis. Contribution of Working Group I to the Fourth Assessment Report of the Intergovernmental Panel on Climate Change; Cambridge University Press: Cambridge, UK; New York, NY, USA, 2007. [Google Scholar]
  40. Xia, W. Study on Life Cycle Carbon Emissions of Residential Buildings. Master’s Thesis, Tianjin University, Tianjin, China, December 2011. [Google Scholar]
  41. Dingqin, F. Estimation and Analysis on Energy Consumption of Buildings in Shanghai. Master’s Thesis, Hefei University of Technology, Anhui, China, April 2012. [Google Scholar]
  42. Huapeng, Q.; Huizhou, Y. Urban Water System and Carbon Emission; China Science Publishing & Media Ltd.: Beijing, China, 2014; pp. 103–171. ISBN 7030416031. [Google Scholar]
  43. Kanghai, C. Research on Quantative Assessment Method of GHG Emission for Construction Projects. Master Thesis, Guangdong University of Technology, Guangdong, China, May 2014. [Google Scholar]
  44. Shang, W. Typical Residential Building Life Cycle Carbon Emissions Calculation Model and Case Study. Master Thesis, Southeast Jiaotong University, Chengdu, China, May 2014. [Google Scholar]
  45. Chunxia, Z. Estimation and Prediction Model of Carbon Emissions of Urban Infrastructure System Operations. Master Thesis, Southeast University, Nanjing, China, March 2012. [Google Scholar]
  46. Baseline Emission Factor of China’s Regional Power Grid in 2015. Available online: http://www.tanpaifang.com/tanguwen/2016/0612/53638.html (accessed on 30 September 2018).
  47. Wen-Ting, W.U.; Xia, G.Y.; Bao, Z.Y. The Assessment of the Carbon Fixation and Oxygen Release Value of the Urban Green Space in Hangzhou. Chin. Landsc. Archit. 2016, 32, 117–121. (In Chinese) [Google Scholar]
  48. Bin, S. Contrastive Research on Energy Conservation from the Application of Green Roof and Cool Roof—A Case Study for Office Building in Guangzhou. Master Thesis, Chongqing University, Chongqing, China, June 2016. [Google Scholar]
  49. Mi, Z.; Meng, J.; Guan, D.; Shan, Y.; Song, M.; Wei, Y.M.; Liu, Z.; Hubacek, K. Chinese CO2 emission flows have reversed since the global financial crisis. Nat. Commun. 2017, 8, 1712. [Google Scholar] [CrossRef] [PubMed]
  50. Ahiablame, L.M.; Engel, B.A.; Chaubey, I. Effectiveness of Low Impact Development Practices: Literature Review and Suggestions for Future Research. Water Air Soil Pollut. 2012, 223, 4253–4273. [Google Scholar] [CrossRef]
  51. Dietz, M.E. Low impact development practices: A review of current research and recommendations for future directions. Water Air Soil Pollut. 2007, 186, 351–363. [Google Scholar] [CrossRef]
  52. Xu, C.; Hong, J.; Jia, H.; Liang, S.; Xu, T. Life cycle environmental and economic assessment of a LID-BMP treatment train system: A case study in China. J. Clean. Prod. 2017, 149, 227–237. [Google Scholar] [CrossRef]
  53. Kim, J.; Hong, T.; Koo, C.W. Economic and environmental evaluation model for selecting the optimum design of green roof systems in elementary schools. Environ. Sci. Technol. 2012, 46, 8475. [Google Scholar] [CrossRef] [PubMed]
  54. Jing, N.; Tian, L. Statistics on Rainfall Properties and Capacity Calculation of Rainwater Storage Tank in Shanghai. Chin. Water Wastewater 2006, 22, 48–51. (In Chinese) [Google Scholar]
  55. Molina-Moreno, V.; Utrilla, P.N.C.; Cortes-Garcia, F.J.; Pena-Garcia, A. The Use of Led Technology and Biomass to Power Public Lighting in a Local Context: The Case of Baeza (Spain). Energies 2018, 11, 1783. [Google Scholar] [CrossRef]
  56. Masdar City. Available online: https://en.wikipedia.org/wiki/Masdar_City#International_Renewable_Energy_Agency (accessed on 18 October 2018).
  57. Samsø. Available online: https://en.wikipedia.org/wiki/Sams%C3%B8 (accessed on 18 October 2018).
  58. Masdar: The Shifting Goalposts of Abu Dhabi’s Ambitious Eco-City. Available online: https://www.wired.co.uk/article/reality-hits-masdar (accessed on 18 October 2018).
Figure 1. Subcatchment distribution map of the Sponge City project in the residential community.
Sustainability 10 03978 g001
Figure 2. Boundary and inventory of carbon emission accounting for the residential community.
Sustainability 10 03978 g002
Figure 3. Indirect carbon emissions in the whole process of the Sponge City renovation project.
Sustainability 10 03978 g003
Figure 4. The carbon emissions of various materials from their production phase.
Sustainability 10 03978 g004
Figure 5. Life cycle flow of carbon emissions and sinks of the Sponge City project.
Sustainability 10 03978 g005
Table 1. Inventories of the Sponge City project in the residential community.
Sponge City FacilityMaterial ConsumptionValueUnit
Rain garden (2462.2 m2)Earthwork2462.2m3
Planting soil738.7m3
Permeable geotextile2954.7m2
Gravel738.7m3
Impermeable membrane2955m2
Overflow well102
Polyvinyl chloride (PVC) pipe847m
Plants2832m2
Grassed swale (2800.6 m)Earthwork994.9m3
Pebble31.9m3
Gravel839.6m3
Planting soil769.6m3
Overflow well60
PVC pipe398m
Plants3848m2
Permeable pavement (958 m2)Permeable brick745m2
Medium sand26.82m2
Permeable concrete89.4m3
Impermeable geotextile900m2
Stormwater storage module (360 m3)Intercepting overflow well2
PP module pond189.65m3
PP module pond205.7m3
Drain pump2
Electrical cabinet2

